Embed Size (px)
Citation preview

Draft Report II
Plastics Industry
By
Anam Ayesha Mubashir

2
Acknowledgment
This Sector analysis was done on the instruction of Ministry of Commerce. While finalizing this
analysis, the author gratefully acknowledges the kind supervision of Dr. Adil Khan Miankhel,
Director Research, Pakistan Institute of Trade and Development who provided his effective and
highly experienced guidance in writing this analysis. The author also gratefully acknowledges
the assistance of PITAD Research Team who helped in writing this analysis through their fruitful
suggestions and support.
3
Table of Contents
Acknowledgment ........................................................................................................................... 2
Introduction ................................................................................................................................... 4
Classification of Plastic Products by Type of process used ...................................................................... 4
Plastics Production Process ....................................................................................................................... 5
Objectives ................................................................................................................................................. 6
Scope and Methodology ........................................................................................................................... 6
Section I: Trade Analysis ............................................................................................................. 7
1.1 Pakistan‟s Imports from India ....................................................................................................... 7
1.2 Pakistan‟s Exports to India and Potential Products of Pakistan in Indian Market ........................ 8
1.3 Plastics Sector—Threats and Opportunities................................................................................ 10
1.4 Anti-dumping Duty on Phthalic Anhydrate: ............................................................................... 11
1.5 Non Tariffs Barriers to Trade applied by India ........................................................................... 12
Section II: Plastic Industry of India ......................................................................................... 14
2.1 Domestic Demand of Polyester and Polymers in India .................................................................. 15
Section III: Plastics Industry of Pakistan ............................................................................... 17
3.1 Plastic Resin Industry of Pakistan ................................................................................................... 18
3.2 Domestic Demand of Polymers in Pakistan ................................................................................... 21
Conclusion ................................................................................................................................... 22
Recommendations ....................................................................................................................... 24
Bibliography ................................................................................................................................ 25
Appendix ...................................................................................................................................... 26
4
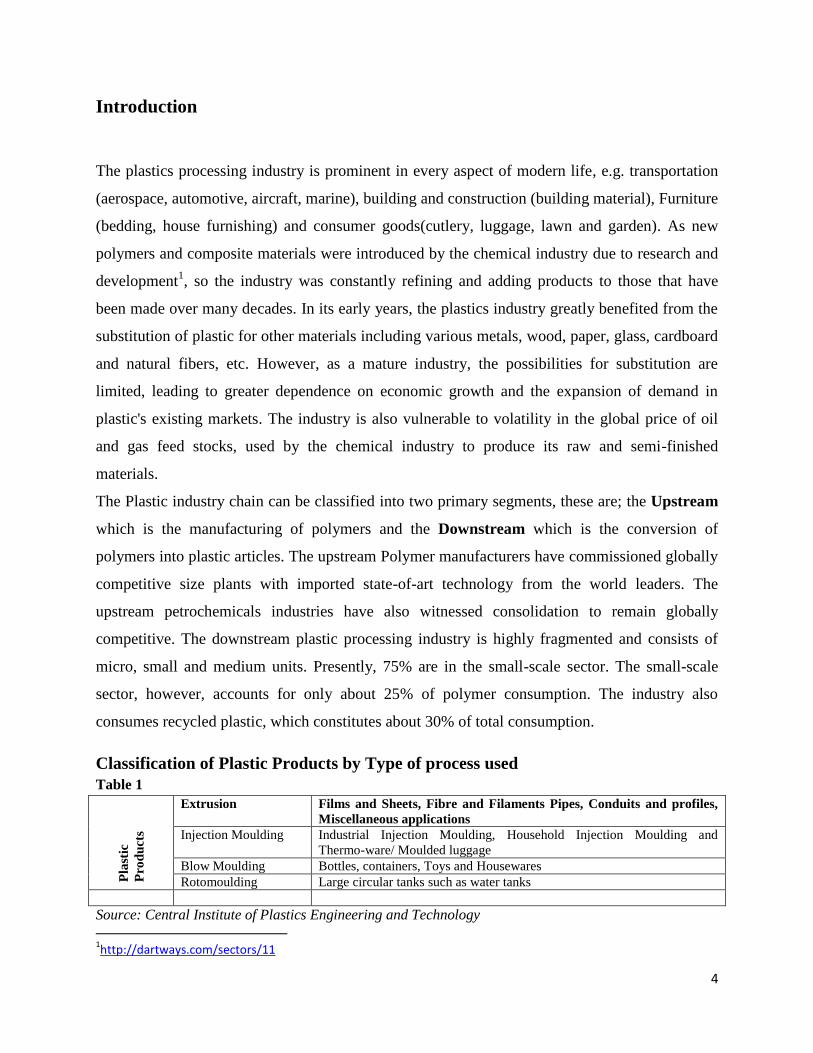
Introduction
The plastics processing industry is prominent in every aspect of modern life, e.g. transportation
(aerospace, automotive, aircraft, marine), building and construction (building material), Furniture
(bedding, house furnishing) and consumer goods(cutlery, luggage, lawn and garden). As new
polymers and composite materials were introduced by the chemical industry due to research and
development1, so the industry was constantly refining and adding products to those that have
been made over many decades. In its early years, the plastics industry greatly benefited from the
substitution of plastic for other materials including various metals, wood, paper, glass, cardboard
and natural fibers, etc. However, as a mature industry, the possibilities for substitution are
limited, leading to greater dependence on economic growth and the expansion of demand in
plastic's existing markets. The industry is also vulnerable to volatility in the global price of oil
and gas feed stocks, used by the chemical industry to produce its raw and semi-finished
materials.
The Plastic industry chain can be classified into two primary segments, these are; the Upstream
which is the manufacturing of polymers and the Downstream which is the conversion of
polymers into plastic articles. The upstream Polymer manufacturers have commissioned globally
competitive size plants with imported state-of-art technology from the world leaders. The
upstream petrochemicals industries have also witnessed consolidation to remain globally
competitive. The downstream plastic processing industry is highly fragmented and consists of
micro, small and medium units. Presently, 75% are in the small-scale sector. The small-scale
sector, however, accounts for only about 25% of polymer consumption. The industry also
consumes recycled plastic, which constitutes about 30% of total consumption.
Classification of Plastic Products by Type of process used
Table 1
Pla
stic
Pro
du
cts
Extrusion Films and Sheets, Fibre and Filaments Pipes, Conduits and profiles,
Miscellaneous applications
Injection Moulding Industrial Injection Moulding, Household Injection Moulding and
Thermo-ware/ Moulded luggage
Blow Moulding Bottles, containers, Toys and Housewares
Rotomoulding Large circular tanks such as water tanks
Source: Central Institute of Plastics Engineering and Technology
1http://dartways.com/sectors/11

5
Plastics Production Process
Oil and Natural Gas
Monomers
Synthetic Resins
Transportation: Aerospace, Automotive, Aircraft, Marine, Rail Road,
Recreational
Packaging: Closures, Coating, Flexible Packaging, Containers
Building and Construction: Pipes and Fittings, Building materials
Furniture: Bedding, Carpets, House furnishing, Rigid, Flexible furniture
Consumer: Cutlery, Lawn and garden, luggage, toys and sporting goods
Source: Plastipedia
Additive
Compounding
Film and
Sheet
Plastic Resins Plastic Bottles Plastic Pipes Laminated
Plastics
Plastic Foam Plumbing Features Plastic Products Nes
Major Markets

6
Objectives
Pakistan had been conducting its trade with India on a positive list approach before 26th
of
March, 2012. Recently, steps have been taken to liberalize trade from positive list to negative
list. In the wake of this liberalization, there would be challenges and opportunities by opening up
the new sectors of the economy to competition from India. In the light of above, this study has
been done with the following objectives:
1. Identification of segments of industry which are not competitive vis a vis Indian plastic
industry.
2. Identification of Pakistan‟s export potential, for the sector, in India.
3. Identify the comparative tariffs of Pakistan and India for the particular product range
4. Identify the threats and opportunities to plastic sector by using Revealed Comparative
Advantage (RCA) Index.
5. Identification of NTBs that need to be addressed to facilitate exports, of the specific
sector, to India.
6. Identification of trade defense laws if (any) used in this sector.
Scope and Methodology
The scope of this report is limited to analyzing Pakistan and India plastic sector as new
challenges and opportunities would arise by liberalizing trade with India. The analysis has been
done up to the year 2010 as trade figures of the post liberalization period are not available. This
report is based primarily on desk research. Due to time, resource and budgetary constraints
interaction with stakeholders was not possible.
The methodology adopted in this report is based on descriptive statistics obtained from
secondary sources. In addition comparative analysis has also been done on the plastics sectors of
Pakistan and India. The structure of the report is as follows:
Section I deals with the trade analysis. A detailed analysis of bilateral trade between Pakistan and
India is conducted for plastics. Furthermore, in this section, the status of the products falling

7
under plastics sector has been determined in the pre-liberalization phase (positive list approach
era), post-liberalization phase (negative list regime) and under SAFTA trading arrangement. In
addition, the MFN and preferential tariff are also being presented. This section also deals with
the identification of Pakistan‟s and India‟s comparative position with respect to products of this
sector. This analysis is done at the HS 6 digit level using Revealed Comparative Advantage
(RCA) Index. The results are mapped according to Pakistan‟s plastics sectors opportunities and
threats.
Section II and III of this report illustrates market size of plastics industry domestic demand of
plastics and polyesters and polymers in India and Pakistan respectively. The information for this
part is obtained from secondary sources.
Section I: Trade Analysis
The leading markets for plastics are in packaging, building and construction and the
automotive/transport industries. However, in Pakistan, a number of other industries which used
some form of plastic, e.g. the textile, clothing, electrical, electronic, mechanical engineering and
agricultural industries, had experienced a profound downturn in demand, as they struggle to
adjust to changes in the market for their products and against a rising tide of imports from
Turkey, China, US, UK, Italy etc.
USA, China, Italy, Japan, Korea, UK and Germany are the major players in the world of plastic
products and the export growth of USA in this specific sector has increased by 185% followed
by UK, China, Germany and Korea with growth rates 31%, 456% and 28% during 2005-2010.
1.1 Pakistan’s Imports from India
Table 2 presents the bilateral trade analysis between India and Pakistan. The analysis on the
bilateral trade between India and Pakistan for the year 2010 shed light on the potential exports of
plastic products to India.

8
Table 2: Pakistan’s Major imports from India in 2010
Product
Code
Description Imported Value in
2010 ($ 000)
'390210 Polypropylene 25209
'391000 Silicones in primary forms 2701
'390319 Polystyrene nes 1323
'392069 Film and sheet etc, non-cellular etc, of polyesters nes 1095
'390110 Polyethylene having a specific gravity of less than 0.94 857
'391290 Cellulose derivatives nes, in primary forms 755
'392690 Articles of plastics or of other materials of Nos 39.01 to 39.14 nes 711
'390720 Polyethersnes 694
'390690 Acrylic polymers nes, in primary forms 635
'391231 Carboxymethylcellulose and its salts 608
'390730 Epoxide resins 513
Source: Trade Map
When we see the imported products of plastics sector, the major import item from India is
Polypropylene with traded value of $ 25 million. Table 2 shows that Pakistan is importing raw
materials from India. If the negative list is analyzed, polypropylene, polyethylene, films and
sheets of polyester and articles of plastics are included in that list. It means that these products
are sensitive and to protect the domestic industry, Pakistan has included these items in the
negative list.
1.2 Pakistan’s Exports to India and Potential Products of Pakistan in Indian
Market
Major exports of Pakistan to India include Polyethylene, PVC film and sheets of polymers, table
ware and kitchen ware etc. while Pakistan‟s major exports to world include PET, Film and
sheets of polymers of propylene, tubes, pipes of plastics and plates, sheets, films, foils, polymers
of vinyl.
Table 3: Pakistan’s Exports to India in 2010
HS Codes Description Exported Value in
2010
'390120 Polyethylene having a specific gravity of 0.94 or more 6155
'390110 Polyethylene having a specific gravity of less than 0.94 5718
'390410 Polyvinyl chloride, not mixed with any other substances 1669
'392020 Film and sheet etc, non-cellular etc, of polymers of propylene 1522

9
'392390 Articles for the conveyance or packing of goods nes, of plastics 1270
'392410 Tableware and kitchenware of plastics 950
'390210 Polypropylene 445
'392051 Film and sheet etc, non-cellular etc, of polymethyl methacrylate 329
'392490 Household and toilet articles nes, of plastics 274
'392112 Film and sheet etc, cellular of polymers of vinyl chloride 177
Source: Trade Map
Table 4 indicates the products in which Pakistan has potential in Indian market. The data is
obtained for the year 2010 and the traded values are in US $ „000‟. Pakistan has potential in
Polyethylene terephthalate, articles of conveyance of plastics, polyesters in primary forms,
polystyrene, household and toilet articles, polyethylene, PVC, films and sheets of plastics, tubes
and pipes of plastics, table and kitchenware etc. Pakistan is already exporting plastics products to
Turkey, Afghanistan, Italy and China. India is the 6th
largest export market for Pakistan in plastic
products.
Table 4: Potential Products of Pakistan in Indian Market
Codes Description Pak Exports
to World
Pak
Exports to
India
India
Imports
from World
'390760 Polyethylene terephthalate 196120 1 40733
'390319 Polystyrene nes 22978 1 16329
'392390 Articles for the conveyance or packing of goods nes, of plastics 17623 1270 32153
'391590 Plastics waste and scrap nes 17577 0 41043
'392490 Household and toilet articles nes, of plastics 17438 274 11853
'390120 Polyethylene having a specific gravity of 0.94 or more 17432 6155 446355
'390110 Polyethylene having a specific gravity of less than 0.94 16342 5718 902846
'390799 Polyesters nes, in primary forms 15977 0 109512
'392690 Articles of plastics or of other materials of Nos 39.01 to 39.14 nes 9997 5 349956
'390410 Polyvinyl chloride, not mixed with any other substances 8708 1669 95111
'392321 Sacks and bags (including cones) of polymers of ethylene 8240 0 12442
'392020 Film and sheet etc, non-cellular etc, of polymers of propylene 7612 1522 50400
'391722 Tubes, pipes and hoses, rigid; of polypropylene 7454 0 353
'392329 Sacks and bags (including cones) of plastics nes 6505 2 13105
'391510 Polyethylene waste and scrap 4397 0 4889
'391890 Floor, wall and ceiling coverings etc, of plastics nes 3311 0 6593
'392410 Tableware and kitchenware of plastics 2815 950 11051
'392330 Carboys, bottles, flasks and similar articles of plastics 2684 0 13798
'392340 Spools, cops, bobbins and similar supports, of plastics 2384 0 3727
'390690 Acrylic polymers nes, in primary forms 2358 22 129562
Source: Trade Map

10
1.3 Plastics Sector—Threats and Opportunities
Table 5 identifies products in which both countries are competitive by using RCA index2. It is observed
that there are 6 product lines in which both countries having RCA greater than 1. Before liberalization
between India and Pakistan, these products were not allowed from India and now again these tariffs lines
have been placed in the negative list implying sensitive products. The RCA criteria show that these six
product lines are threat for Pakistan as India is also competitive in these tariff lines. Out of these six
product lines, two are now allowed from India and these are Polystyrene and Articles for the conveyance
of packing of plastics.
Table5: Product lines in which both Pakistan and India are Competitive
Product
code Product label
RCA-
Pak
RCA-
India
MFN
Tariffs
SAFTA
Tariffs
Appendix
G
Negative
List
390319 Polystyrene nes 3 1
0 0
391610
Monofilaments >1 mm, profile shapes etc of polymers of
ethylene 2 1 20 5 0 3916.1
391721 Tubes, pipes and hoses, rigid; of polyethylene 1 1 20
0 3917.21
391890 Floor, wall and ceiling coverings etc, of plastics nes 4 2 25
0 3918.9
392020
Film and sheet etc, non-cellular etc, of polymers of
propylene 1 1 20
0 3920.201
392329 Sacks and bags (including cones) of plastics nes 1 2 25
0 3923.29
392390
Articles for the conveyance or packing of goods nes, of
plastics 2 1
0 0
Source: Author’s own calculations
Table 6 presents products in which Pakistan is competitive and India is not. There are eleven
products which are an opportunity for Pakistan because in these product lines Pakistan has
comparative advantage and India is not competitive. In addition we also observed that before
trade liberalization these items were banned from India and now six tariff lines have again been
placed in the negative list indicating that this sector is highly sensitive for Pakistan‟ domestic
industry.
2 RCApg = [ Xpg / Xp] / [Xwg/ Xw] Where: Xpg = Exports of Good g by Pakistan, Xp = Total exports of Pakistan,
Xwg = World exports of good g , Xw = Total World Exports If RCA>1: Country has comparative advantage in that product If RCA<1: Country has comparative disadvantage in that product

11
Table 6: Products lines in which Pakistan is Competitive and India is notCompetitive
Product
code Product label
RCA-
Pak
RCA-
India
MFN
Tariffs
SAFTA
Tariffs
Appendix
G
Negative
List
390120 Polyethylene having a specific gravity of 0.94 or more 1 0 5 5 3901.2 0
390410 Polyvinyl chloride, not mixed with any other substances 1 0
0 0
390799 Polyesters nes, in primary forms 2 0 20
0 3907.99
391510 Polyethylene waste and scrap 2 0 25 5 0 0
391590 Plastics waste and scrap nes 3 0 25 5 0 0
391729 Tubes, pipes and hoses, rigid; of plastics nes 1 0 20
0 3917.29
391733 Tubes, pipes and hoses nes, plastic, not reinforced etc,
with fittings 1 0 20
0 3917.33
392051 Film and sheet etc, non-cellular etc, of polymethyl
methacrylate 1 0 20
0 3920.51
392321 Sacks and bags (including cones) of polymers of ethylene 1 0 25
0 3923.21
392340 Spools, cops, bobbins and similar supports, of plastics 2 0 25
0 3923.4
392490 Household and toilet articles nes, of plastics 3 0 25
0 0
Source: Author’s own calculations
1.4 Anti-dumping Duty on Phthalic Anhydrate:
The National Tariff Commission (NTC) has imposed anti-dumping duty @ 10.94% price on
dumped imports of Phthalic Anhydride (“PA”) from India to Pakistan. The anti-dumping duty
was imposed for a period of five years effective from February 13, 2006. However, in terms of
Section 58(3) of the Ordinance, a definitive anti-dumping duty shall not expire if the
Commission determines in a review that the expiry of such anti-dumping duty may likely to lead
to continuation or recurrence of dumping of the investigated product and resulting in injury to
the domestic industry. The Commission has also imposed definitive anti-dumping duties ranging
from 5.87% to 27.28% on imports of PA from Brazil, China, Indonesia, Korea and Taiwan on
September 30, 2010 for period of five years.
There were no imports of PA from India during last three years mainly because it was subject to
10.94% anti-dumping duty and this led to increase in imports from other sources. However,
imposition of anti-dumping duties on dumped imports of PA from Brazil, China, Indonesia,
Korea and Taiwan on September 30, 2010 for period of five years, led to decrease in imports
from other sources also. In case anti-dumping duty imposed on India is terminated, it is likely
that dumping would recur. Therefore, NTC concluded after the detailed analysis that there is
relationship between likely recurrence of dumping of PA and likely recurrence of material injury

12
to the domestic industry if anti-dumping duty imposed on imports of PA from India is
terminated. This product is highly sensitive and importing from India, brazil, China, Indonesia,
Korea and Taiwan will damage the domestic industry of Pakistan.
1.5 Non Tariffs Barriers to Trade applied by India3
India maintains restrictive trade regime for the import of Plastic products and according to PVC
Floorings Scrap Policy, the following are the import licensing notes for an Indian importer:
1.5.1 PVC floorings scrap (scrap denotes industrial trimmings and rejects only) with the
following specifications shall be permitted for imports:
i. The PVC flooring scrap shall consist of thoroughly blended composition of thermoplastic
binder, fillers and pigments. The thermoplastic binder shall consist substantially of one or
both of the following namely (a) Vinyl Chloride polymer and (b) Vinyl Chloride co-
polymer.
ii. The density shall be < 0.925.
iii. Ash content shall be < 21 to 30%.
iv. Final Waste PVC scrap (i.e. unconverted to floor coverings etc.) shall not exceed 5% of
the quantity imported and shall be disposed of in landfills.
The restrictions in the PVC flooring policy which are hurdles to exporters are further evident in
the following conditions:
(i) Only industrial, trimmings and rejects of PVC flooring scrap shall be allowed to be imported.
(ii) Post consumer PVC flooring scrap and waste shall not be allowed to be imported.
(iii) Imports shall only be allowed to actual users. In case the actual users hire export/import
houses they could do so on receipt of specific request from actual users for specific quantities
based on the installed capacity of the plant only.
3 Import Licensing Note retrieve from exim guru
(http://www.eximguru.com/notes/default.aspx?noteid=200&Path1=Customs+Duty&Path2=%28Chapter+39+-
+40+%29+-+Section+VII-
Plastics+and+Articles+thereof%3B+Rubber+and+Articles+Thereof&Path3=Chapter+39%3A+plastics+and+articles
+thereof)

13
(iv) The concerned Pollution Control Boards (PCB)/Pollution Control Committees (PCCs) shall
monitor the use of PVC scrap imported by the units.
(v) The units/PVC scrap users shall file a return of imports made during a calendar year to the
concerned PCB/PCCs; and
(vi) The product so manufactured should meet the BIS specifications for unbacked flexible PVC
floorings.
1.5.2 Import of waste, Parings and Scrap of Plastics
Similarly, India also maintained restrictive trade regime on import of waste, parings and scrap of
plastics for an Indian importer. The DGFT (DG Foreign Trade) withdrew its move to put all
plastic waste in the category of beef tallow whose import is not allowed under any
circumstances. Plastic waste can now be imported freely subject to the condition that the waste is
derived in the process of manufacture of virgin material.
1.5.2.1 Procedure relating to import of plastic waste/scrap
The matter relating to grant of licenses for import of such plastic wastes/scrap has been
examined in consultation with the Department of Chemicals & Petrochemicals and other
Ministries and it has been decided to prescribe the following guidelines for consideration of
applications for import of plastic wastes/scrap.
i. Import of plastic wastes/scrap (except PET bottle waste/scrap) shall be permitted only
against a license.
ii. Such new Plastic scrape shall be permitted for import in the following forms i.e.
compressed, films in cut condition, cut tape soft waste, flakes, powders, pieces of
irregular shape.
iii. Applications for import licenses would be received in the Headquarter of the DGFT as
per procedure prescribed in this regard. DGFT would obtain comments on each
application from the Deptt. of Chemicals & Petrochemicals and Ministry of Environment
& Forests. Based on the comments of Deptt. of Chemicals &Petrochemicals and the

14
Ministry of Environment & Forests, the individual cases shall be put up to the Special
Licensing Committee (SLC) of DGFT for consideration.
iv. The plastic scrape would be permitted only to the actual users who have the required
facility for recycling such scrap and who are duly registered with the competent State
authority and also possess clear pollution clearance certificate from the concerned State
Pollution Board where the unit is located, as well as a capacity assessment certificate.
v. Each consignment of plastic scrap imported against an import license issued in this
regard shall be accompanied with a certificate from the factory in which it was generated.
vi. Before the clearance of the plastic waste/scrap, all imported consignments of such plastic
scrap shall be subjected to scrutiny and testing of samples.
vii. Special Licensing Committee while considering import take into account, the quantity
and value of plastic scrap imported by the applicant during the previous licensing years.
The guidelines and conditions shall also be applicable to the imports made under the Duty
Exemption Scheme against Advance License. Applications for Advance Licenses for the import
of plastic wastes and scrap shall in this case be considered by the Advance Licensing Committee
DGFT (H.Q.). While imports of plastic wastes and scrap shall continue to be governed by the
provisions of Export and Import Policy. Import of Plastic Waste/Scrap (except PET Bottle
Waste/Scarp) and animal dung or animal excreta shall not, be permitted, except against a license.
Section II: Plastic Industry of India
The per capita consumption of plastic products in India is growing and is moving towards 2.5 times GDP
growth4. The Plastic industry in India symbolizes a promising industry and is creating new employment
opportunities for the people of India. The Government of India is trying to set up the economic reforms to
elevate and boost the plastic industry by joint venturing, foreign investments and entrepreneurs are trying
to provide high quality plastic products, so that it has become a booming industry.
The growth of the plastics industry has seen the number of processing units grow from 25,000 in
the year to 2010 to 30,000 units in 2011. The exponential growth anticipated over the next three
years will see this number go up to 40,000 units. As of today, just about 10-15% of these units
4 SME Business Service Limited (http://www.sme.in/CurrentNews.aspx?NewsID=1586)

15
can be classified as medium scale operations and the rest all operate on a small scale basis. Over
70% of the industry is in the unorganized sector5.
The overall turnover of the plastics processing industry in 2011 stands at Rs.85,000 crore and is
expected to touch Rs. 100,000 crore in the year 2012 on the basis of the expected growth of the
demand potential to 12.50 million tons from 9 million tons in 20116.
Independent studies show that the industry hired more than 3 million people in 2011, directly and
indirectly, is expected to employ close to 4 million people in 2012 and 7 million people by the
year 20157
Despite the industry's high growth spanning over a period of over 2 decades and crossing several
milestones, Indian plastics industry is yet to realize its full potential. The per capita consumption of
plastics in India, at 5 kgs, is the lowest in the world. The average global per capita consumption is 26 kgs.
The low level of per capita plastics consumption in India is indicative of the massive growth potential of
the plastic industry. India has the advantage of high population and is expected to maintain high economic
growth. This should propel India's plastics consumption to new levels in coming years.
The next two decades are expected to offer unprecedented opportunities for the plastic industry in India8.
According to a CRISIL Report, the world trade in Plastics is expected to reach 140 million tons in 2012
and provides a lucrative opportunity for India, but with just a 1.5% share in world export volumes, India
is not in a position to capture this opportunity. The top three import destinations of India are Korea, China
and USA and export destinations are China, UAE, Italy and USA. The Indian Plastic Industry, going
forward, needs to consolidate and enhance capacity, upgrade facilities and improve productivity and
increase utilization of critical plastic applications.
2.1 Domestic Demand of Polyester and Polymers in India
According to Business Monitor International‟s (BMI‟s) latest report, strong growth in domestic
petrochemicals demand in 2010 is likely to decrease, owing to slowing down of economic activity, but the
5 ibid
6Plastmart (http://chemguide.asia/news/2010/09/28/strong-growth.html)
7 Plastics Industry in India (2011-15), Market Research, 29
th Feb, 2012.
8 Indian Plastic Industry Growth Drivers
(http://export.gov/build/groups/public/@eg_main/@byind/@manufind/documents/webcontent/eg_main_041066.pdf)

16
Indian market is strong enough to justify the planned rapid increase in capacities. During 2010 (quarter
2), domestic demand for polyester products increased 10%, owing to increased non-apparel applications
like home furnishing and technical textiles. Within the polyester segment, demand for polyethylene
terephthalate (PET) increased 38% due to increased demand for beverages and bottled water. Polymer
products demand remained stable during the quarter. Within the polymer segment, demand for
polypropylene (PP) increased by 6% due to strong growth in the automobile sector, cement packaging
and other industrial applications. Demand for PE and PP is forecast to grow in double digits, with some
grades, such as biaxially-oriented polypropylene (BOPP) film for packaging, non-woven PP and pipe
grade polyethylene (PE) expected to grow by more than 20%. In 2010, strong demand for low density PE
(LDPE) and linear low density PE (LLDPE) film will suck in imports, while the country will remain
self-sufficient in high density PE (HDPE) over the short term due to plentiful capacity and relatively poor
demand. However, the PP sector in general is in danger of overcapacity. India was a significant PP
exporter in 2009, but moderation in growth in global demand at a time of rising capacity will dampen
prospects on external markets. Yet, domestic demand has yet to catch up with growing output volumes.
As a result, the pressure to differentiate will increase, as competition in the Indian market heats up. R&D
and the introduction of higher grades of polymer products are therefore essential to add value9.
The domestic demand of the economy will be fuelled by rising private consumption and fixed investment
levels, as well as the need to rebuild inventories. This has renewed confidence in the petrochemicals
industry. BMI estimates Indian consumption of plastics will grow from 8 million tons in 2009 to 16
million tons by 2016 and 25 million tons by 2020, with a lower rate of growth than the 15-16% seen in
recent years. Nevertheless, this should prompt growth in the industry of 9-10% pa. Estimates for the
investment needed to cater for the increase in demand for plastics in 2010-2016 has been put at US$10
billion. Even when bearing in mind the delays and cancellations, India will host a rapidly expanding
petrochemical industry10
. The Indian government forecasts domestic polymer demands reaching 11
million tons in 2015, up from 5.8 million tons in 2008. This implies that India will remain a net polymer
exporter. However, BMI is doubtful India will come close to increasing the value of its production from
the current US$15-18 billion to US$30-35 billion by 2012-2014, a level that the Tata Strategic
Management Group (TSM) says is necessary to cover the rate of domestic demand growth. By 2014, BMI
estimates that per capita polymer consumption will reach 14 kg. While relatively modest by international
levels, it will be far higher than 4.7 kg in 2007, which represented 20% of the global average.
9Plastindia 2012
10 Plastics Industry in India: An Overview, British Plastics Federation

17
Moreover, it will make India the world‟s third largest plastics consumer after the US and China. India is
ninth on Asia Petrochemicals Business Environment Ratings, with 61.8 points, putting it 16.3 points
ahead of Indonesia and 1.6 points behind Australia. India‟s score has recovered in recent months as a
result of the continued expansion of the sector as well as a reduction in negative risks associated with the
economic downturn and international financial crisis.
The one critical factor that plagues the Indian Plastic industry is the common perception that plastic is not
environmentally friendly. This primarily is due to the low awareness about the energy saving property of
plastics and the benefits to industries that utilize plastics. It is a little known fact that, while India has the
lowest per capita consumption in the world, it is the highest recycler of plastics. India recycle 60% from
both industry and urban waste as compared to the world average of 20-25%11
.
Last but not the least, the various associations need to come together and put in a concerted effort to join
hands to enhance the image and the growth of the Indian Plastic industry, create opportunities to
demonstrate the industry's capabilities, educate all segments of the society about the benefits of plastics.
The associations need to create a positive policy framework with all statutory entities and increase per
capita consumption of plastics, encourage exports thereby significantly contributing to national growth.
Section III: Plastics Industry of Pakistan
Pakistan's plastic industry is thriving at an average annual growth rate of 15% with a total estimated
production capacity of 624,200 M/T per annum12
. The industry attracted investment amounting to more
than US$ 260 billion13
, almost half of which was foreign direct investment (FDI), and as a result export
growth has increased to 35%14
. Pakistan has established successful export markets for its plastic goods.
In foreign markets including countries like Australia, South Africa, Saudi Arabia, West Indies, UAE,
Kuwait, Taiwan, Nigeria and Zimbabwe; Pakistan is strategically well placed to target the all important
local and international buyers in one of the world's largest trading regions. Particular growth is being seen
in exports of plastic components for the automobile industry. This growth happened, besides
entrepreneurial efforts, due to simplified tax policy on local production and reduction in import tariff on
plastic raw materials. The industry is contributing more than Rs7.5 billion annually to the national
11
ibid 12
Evolution of plastics Industry in Pakistan, Mr. F. Chaudhry (2010) 13
http://www.ecgateway.net/download/PPPAsia_Brochure.pdf 14
ibid

18
exchequer in shape of custom duty, sales tax and income tax. Its contribution to the gross domestic
product (GDP) was 1.69%15
.
It is a high technology industry and most of modern plastic processing machinery is imported from Japan,
Korea, Italy, Taiwan, Hong Kong, England, China and Germany. However, locally manufactured
machinery is also being used. Raw material is also imported.
The capacity utilization has been in between 43 to 95%. Plastics industry in the un-organized sector is
totally self-financed and during the last decade, the unorganized sector has grown much more rapidly.
The per capita consumption of plastic in Pakistan is 3.1 kilograms. There are some 6,000 plastic products
manufacturers in the country and 600,000 people are directly and indirectly engaged with this business.
Pakistan imports 80-90 percent raw material for plastic making from different countries. The total
consumption of raw material used in the plastic industry in the country is around 450,000 tonnes. The
country imports raw material from UAE and Far Eastern countries and special grade raw material is
imported from Germany and USA16
.
3.1 Plastic Resin Industry of Pakistan
The plastic resin industry produces resins which are further treated in plastics processing facilities and
sold largely to the building and construction, packaging and consumer markets. Plastic resins are
generally categorized into two types: thermoplastics and thermosets. Globally, thermoplastic resins
dominate plastic resin sales and production.
Pakistan possesses a narrow petrochemical base producing limited number of polymers including
Polystyrene (PS), Polyvinyl Chloride (PVC), Polyethylene Terephthalate (PET) and Urea/Melamine
Formaldehyde. An attempt to set up the first PVC plant in Pakistan was made by the Federal Chemicals
and Ceramics Corporation Limited (FCCCL) when it planned to set up a 20,000 tons per annum capacity
plant in Kala Shah Kaku way back in 199417
. This plant, unfortunately, did not come online. Later in
1999, Engro Chemicals through a joint venture with Japanese company set up the first PVC plant in
Pakistan.
15
ibid 16
Plastics Product Cluster, Lahore;Hamid Minhas (Regional Business Coordinator), SMEDA 17
ibid

19
At present, no facilities for the production of two basic polymers polyethylene and polypropylene exist in
the country with the result that these two constitute the bulk of Pakistan plastic resins imports. Import of
PE and PP during 2009 stood at 0.424 tons valuing $700 million constituting 76% of total plastics raw
material imports18
. Pakistan annual consumption of plastic resins is over one million tons and demand
may further grow on the back of new developments in plastic technologies and a rapidly expanding
market for plastics due to its wider use and application in the building and construction, transportation,
packaging, electrical and electronics, furniture and furnishings and household appliances industries.
Table 6: Types of Plastic Resins and their uses
Plastic Resins and Codes Uses
1. Polyethylene Terephthalate
(PETE)
• Soda Bottles
• Water Bottles
• Shampoo Bottles
• Mouth wash Bottles
• Peanut butter jars
2. High Density Polyethylene
(HDPE
• Milk, Water and Juice Jugs
• Detergent Bottles
• Yogurt and Margerine tubs
• Grocery Bags
3. Vinyl (V)
• Clear Food Packaging
• Shampoo Bottles
4. Low Density Polyethylene • Bread Bags
• Frozen Food Bags
• Squeezable Bottles (mustard, honey)
5. Polypropylene • Ketchup Bottles
• Yogurt and Margarine Bottles
6. Polystyrene • Meat Trays
• Egg Cartons
• Cups and Plates
7. Other • 3 & 5 gallon bottles
• Ketchup
• Small juice Bottles
Source: (http://dartways.com/print.php?pg=sectors&s=11)
18
Trade Map

20
Plastics raw material production in Pakistan is at low scale and does not meet the required demand.
Presently, the total combined annual production capacity of four leading plastic resins producers stands at
a little over 0.5 million tons19
while Pakistan total imports of all plastics raw material, as per Trade Map
data, reached 0.525 million tons valuing US$ 913 million in 200920
. Pakistan was meeting its entire
plastics raw material needs through imports till 1994. Pakistan has now started exporting PVC, PET resin
and Polystyrene on a limited scale to Turkey, UAE, Italy, South Africa and Iran. Total exports of these
three polymers stood at U$ 176 million21
. Table 7 depicts leading plastic resins manufacturers covering
their products and production capacities:
Table 7: Resins Manufacturers and their Production Capacity in Pakistan
Company Product Capacity (Tons)
Novaltex PET 235,000
Engro Polymer and Chemicals Ltd. PVC 150,000
Pak Petrochemicals Industries Ltd. HIPS & PS 90,000
Dynea Pakistan Ltd. Urea & Melamine Formaldehyde 34,000
Source: (http://dartways.com/print.php?pg=sectors&s=11)
The brief description of plastic resins being manufactured in Pakistan, major producers and potential for
growth in each segment is presented in the following section22
:
3.1.1 PET Resin (Polyethylene Terephthalate)
The only producer of Polyethylene Terephthalate (PET bottle grade resin) is Novatex, a sister concern of
Gatron Industries. Gatron was established in 1984 as a producer of texturized and flat polyester filament
yarn. The company diversified into PET bottle grade resin to cater to the increasing demand of the
bottling industry. The company, with an annual production capacity of 235,000 tons of PET Resin (bottle
grade), is not only meeting country‟s demand but has also entered into export market. Gatron has its
Polymerization Plant and Technology from Zimmer AG, Germany while the Solid State Poly-
condensation Plant and Technology has been acquired from Sinco Engineering, Italy. Presently there is a
huge potential for growth as demand is increasing due to high consumer usage in Pakistan.
19
http://dartways.com/print.php?pg=sectors&s=11) 20
ibid 21
ibid 22
Dartways (http://dartways.com/sectors/11)

21
3.1.2 PVC (Polyvinyl Chloride)
Engro Polymer & Chemicals Limited, a subsidiary of Engro Corporation, is the only producer of PVC in
Pakistan. The plant has annual production capacity of 150,000 metric tons. The company now has an
integrated PVC facility after expansion and backward integration in 2009 for the manufacture of Ethylene
Di Chloride (EDC), Chlor-alkali and Vinyl Chloride Monomer (VCM). The company was able to export
10,000 tons of PVC in 2009. At present only traditional PVC items are being manufactured i.e. pipes and
fittings, shoes, cables, water conservation and compounding etc. With increased application of PVC in
other products, there is good potential for growth in PVC consumption.
3.1.3 Polystyrene (PS)
Pak Petrochemicals Industries is the only producer of polystyrene in Pakistan. The company was
established in 1994. Pak Petrochemicals annual production capacity is 90,000 tons producing GPPS and
HIPS. About 60% of this is domestically consumed while the rest is exported to Germany, South Africa,
Lebanon, Egypt and Turkey. Due to increased demand, the Company plans to start local production of
ABS in the near future. The company is planning to increase its polystyrene capacity by 40% initially and
subsequently by 100%.
3.1.4 MethanolUrea (Melamine)
Dynea Pakistan Limited produces urea resin for use in industries like particleboard, chipboard, veneer
board and melamine resin for lamination industry. Together with its wholly owned subsidiary, Visionite
(Pvt.) Limited, it is also Pakistan‟s largest producer of molding compound used for manufacturing dinner
sets and electrical accessories. Manufacturing of formaldehyde and amino-plast resins and of molding
compound were both pioneering ventures introduced for the first time in Pakistan. Now only a small
quantity of molding compound is imported into the country and there are no imports of formaldehyde or
liquid resins.
3.2 Domestic Demand of Polymers in Pakistan
The growth in Pakistan‟s polymer consumption is being curtailed by a severe shortage of power.
Persistent power cuts by the state-owned power companies, lasting 6-10 hours a day, have badly hit
22
production at plastic processing units in the country. Pakistan‟s demand for polyolefins is growing at
around 10%/year, but growth could be even higher were it not for the power cuts.
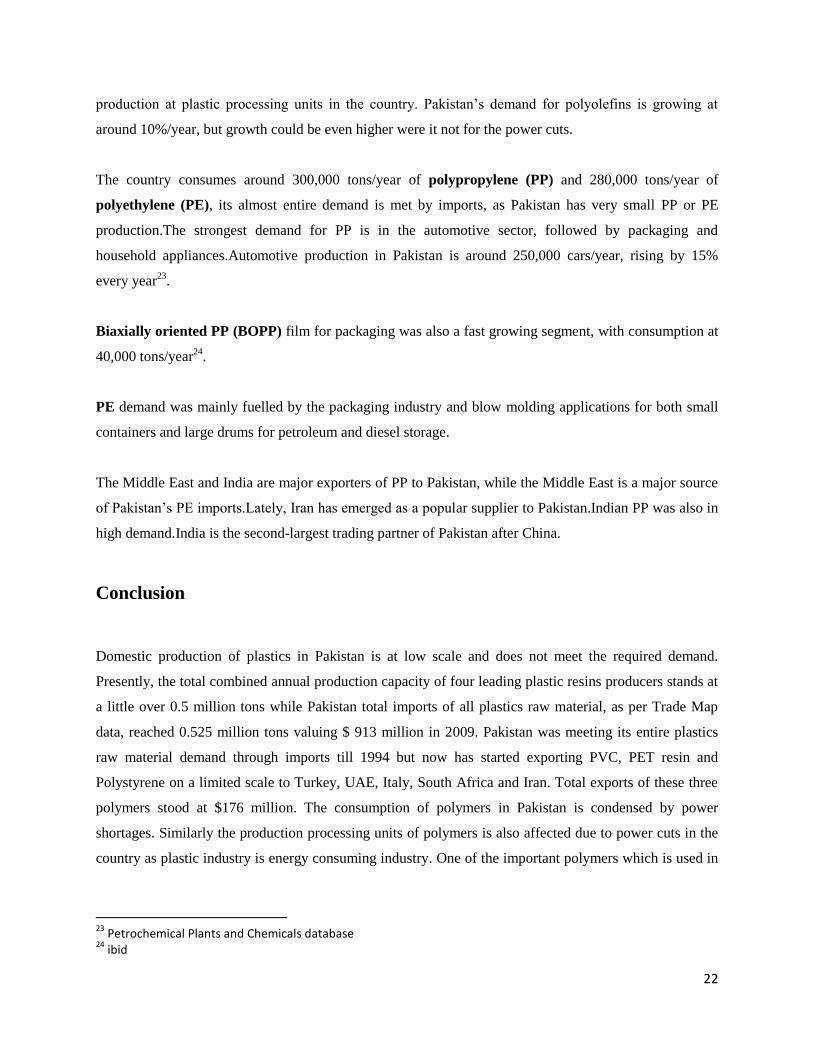
The country consumes around 300,000 tons/year of polypropylene (PP) and 280,000 tons/year of
polyethylene (PE), its almost entire demand is met by imports, as Pakistan has very small PP or PE
production.The strongest demand for PP is in the automotive sector, followed by packaging and
household appliances.Automotive production in Pakistan is around 250,000 cars/year, rising by 15%
every year23
.
Biaxially oriented PP (BOPP) film for packaging was also a fast growing segment, with consumption at
40,000 tons/year24
.
PE demand was mainly fuelled by the packaging industry and blow molding applications for both small
containers and large drums for petroleum and diesel storage.
The Middle East and India are major exporters of PP to Pakistan, while the Middle East is a major source
of Pakistan‟s PE imports.Lately, Iran has emerged as a popular supplier to Pakistan.Indian PP was also in
high demand.India is the second-largest trading partner of Pakistan after China.
Conclusion
Domestic production of plastics in Pakistan is at low scale and does not meet the required demand.
Presently, the total combined annual production capacity of four leading plastic resins producers stands at
a little over 0.5 million tons while Pakistan total imports of all plastics raw material, as per Trade Map
data, reached 0.525 million tons valuing $ 913 million in 2009. Pakistan was meeting its entire plastics
raw material demand through imports till 1994 but now has started exporting PVC, PET resin and
Polystyrene on a limited scale to Turkey, UAE, Italy, South Africa and Iran. Total exports of these three
polymers stood at $176 million. The consumption of polymers in Pakistan is condensed by power
shortages. Similarly the production processing units of polymers is also affected due to power cuts in the
country as plastic industry is energy consuming industry. One of the important polymers which is used in
23
Petrochemical Plants and Chemicals database 24
ibid

23
plastics production is polyoefins; its demand is increasing but again power shortage is the major obstacle
in the growth of this sub segment of the industry.
India was a significant PP exporter in 2009, but moderation in growth in global demand at a time of rising
capacity will dampen prospects on external markets. In India, petrochemicals and polymers domestic
demand has increased in the year 2010 in the following sub categories:
Polyester
Polyethylene terephthalate (PET)
Polypropylene (PP)
Low density PE (LDPE)
Linear low density PE (LLDPE)
Pakistan‟s top three import destinations of PP are Middle East, India and Iran. Pakistan also imports PE
from Middle East. Pakistan‟s second largest trading partner after China is India. Pakistan has imposed an
antidumping duty of 10.94% on India during the years 2008-2010 on imports on PA and this results in
decrease of imports of PA from India.
It has been seen that Pakistan is the major exporter of PET, films and sheets of polymers of propylene,
tubes and pipes of plastics and plates, sheets, film and foil made of plastics to the world. Exports to India
include Polyethylene, PVC film and sheets of polymers, table ware and kitchen ware etc. PET has been
in the negative list in order to protect the domestic industry. The report has also analyzed the threats and
opportunities for Pakistan in plastics sector by using RCA index. Pakistan has an opportunity in Indian
market in the following product lines:
Polyethylene
Polyvinyl chloride
Polyesters
Tubes, pipes and hoses of plastics
Film and sheets of polymethyl methacrylate
Sacks and bags of polymers
Spools, cops, bobbins of plastics
Household and toilet articles of plastics

24
Due to India‟s competitiveness, Pakistan is threatened by these product lines:
Polystyrene
Monofilaments of polymers
Tubes and pipes of polyethylene
Floor, wall and ceiling coverings of plastics
Films and sheets of polypropylene
Sacks and bags of plastics
Articles for conveyance of goods of plastics
Recommendations
Government should establish a hydro cracking plant (Hydro-cracking is a catalytic
cracking process assisted by the presence of an elevated partial
pressure of hydrogen gas), which will ensure cheap raw material for Pakistani plastic
industry. Government was working on setting up such a plant for the last two decades,
but no breakthrough has occurred. GoP may devise an incentive regime through trade
policy instruments for establishing Hydro-cracking plant.
Polyethylene (HS 3901) imports from India were banned but industry was importing
indirectly via Dubai. Therefore, the import of this product should be allowed from India
as it would result in cost savings for the industry. Pakistan was already a net importer of
this product and hence allowing import of the same from India would simply lead to trade
diversion.
One of the important plastic resins is ABS (Acrylonitrile butadiene styrene), which is
currently not being produced in Pakistan. This is raw material used for plastic production,
Pakistan is currently importing ABS and as a result cost of production increases. Demand
of ABS is growing; therefore, GoP should provide incentive to industry in the form of
duty free import of plant and equipment for manufacturing ABS.

25
Bibliography
Chaudary, F. Evolution of Plastics Industry in Pakistan. docstoc, 2010.
Hunt, Stephen. "A Plastics Industry in India: An Overview." British Plastic Federation, August
2011.
Import Licensing Note. Exim Guru. 2011.
http://www.eximguru.com/notes/default.aspx?noteid=200&Path1=Customs+Duty&Path2=(Chap
ter+39+-+40+)+-+Section+VII-
Plastics+and+Articles+thereof%3B+Rubber+and+Articles+Thereof&Path3=Chapter+39%3A+pl
astics+and+articles+thereof.
Indian Plastic Industry Growth Drivers. 2012.
http://export.gov/build/groups/public/@eg_main/@byind/@manufind/documents/webcontent/eg
_main_041066.pdf.
MarketReserach.com."Plastics Industry in India (2011-15)." February 2012.
http://www.marketresearch.com/IS-Advisors-v3900/PLASTIC-INDIA-6838931/.
Minhas, Hamid. Plastics Product Cluster. SMEDA UNIDO Cluster Development Programme
Lahore.
Pakistan the Regional Business Hub. "Plastics, Packaging, Paper and Print Asia: International
Exhibition and Conference." ECommerce Gateway Pakistan. Karachi, 2010.
"Sector/Industry Briefs: Plastics Resin Industry of Pakistan ." dartways. 2009.
http://dartways.com/print.php?pg=sectors&s=11.
SME Business Services Limited. 2011. http://www.sme.in/CurrentNews.aspx?NewsID=1586.
"Strong Growth in India's Petrochemicals Demand likely to Subside." Chem guide.Asia.
September 2010. http://chemguide.asia/news/2010/09/28/strong-growth.html.
26
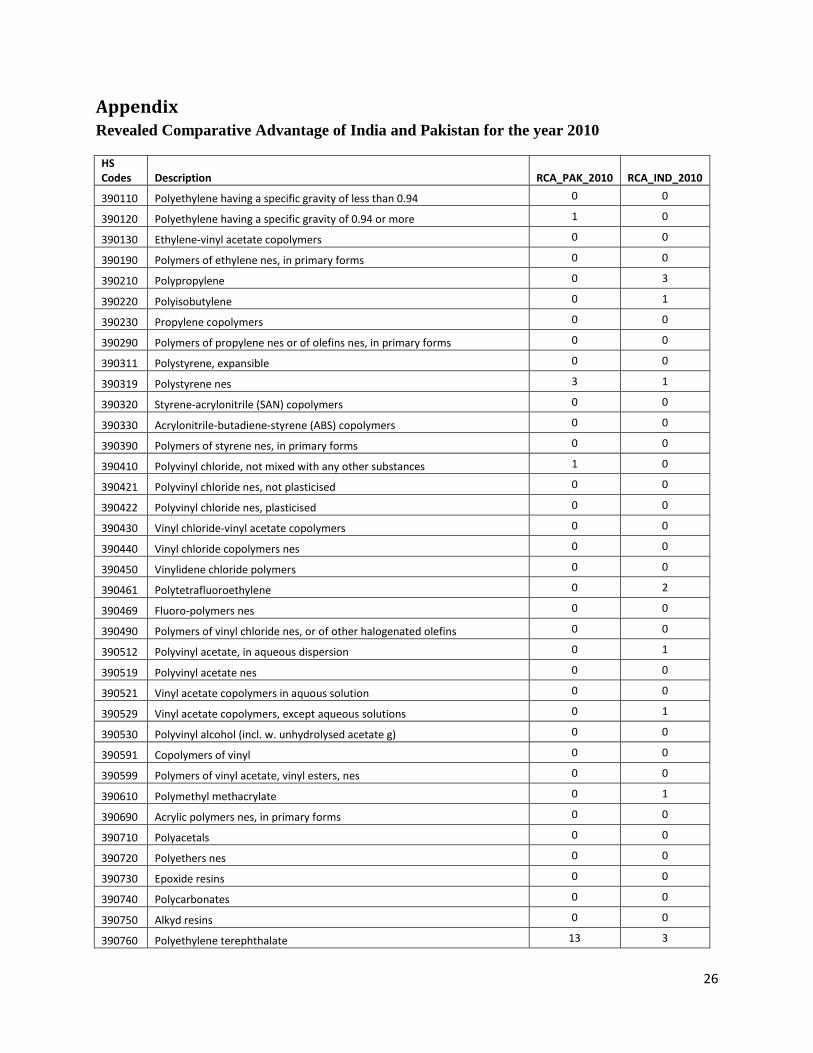
Appendix Revealed Comparative Advantage of India and Pakistan for the year 2010
HS Codes Description RCA_PAK_2010 RCA_IND_2010
390110 Polyethylene having a specific gravity of less than 0.94 0 0
390120 Polyethylene having a specific gravity of 0.94 or more 1 0
390130 Ethylene-vinyl acetate copolymers 0 0
390190 Polymers of ethylene nes, in primary forms 0 0
390210 Polypropylene 0 3
390220 Polyisobutylene 0 1
390230 Propylene copolymers 0 0
390290 Polymers of propylene nes or of olefins nes, in primary forms 0 0
390311 Polystyrene, expansible 0 0
390319 Polystyrene nes 3 1
390320 Styrene-acrylonitrile (SAN) copolymers 0 0
390330 Acrylonitrile-butadiene-styrene (ABS) copolymers 0 0
390390 Polymers of styrene nes, in primary forms 0 0
390410 Polyvinyl chloride, not mixed with any other substances 1 0
390421 Polyvinyl chloride nes, not plasticised 0 0
390422 Polyvinyl chloride nes, plasticised 0 0
390430 Vinyl chloride-vinyl acetate copolymers 0 0
390440 Vinyl chloride copolymers nes 0 0
390450 Vinylidene chloride polymers 0 0
390461 Polytetrafluoroethylene 0 2
390469 Fluoro-polymers nes 0 0
390490 Polymers of vinyl chloride nes, or of other halogenated olefins 0 0
390512 Polyvinyl acetate, in aqueous dispersion 0 1
390519 Polyvinyl acetate nes 0 0
390521 Vinyl acetate copolymers in aquous solution 0 0
390529 Vinyl acetate copolymers, except aqueous solutions 0 1
390530 Polyvinyl alcohol (incl. w. unhydrolysed acetate g) 0 0
390591 Copolymers of vinyl 0 0
390599 Polymers of vinyl acetate, vinyl esters, nes 0 0
390610 Polymethyl methacrylate 0 1
390690 Acrylic polymers nes, in primary forms 0 0
390710 Polyacetals 0 0
390720 Polyethers nes 0 0
390730 Epoxide resins 0 0
390740 Polycarbonates 0 0
390750 Alkyd resins 0 0
390760 Polyethylene terephthalate 13 3

27
390770 Polylactic acid, in primary forms 0 0
390791 Polyesters nes, unsaturated 0 0
390799 Polyesters nes, in primary forms 2 0
390810 Polyamide-6, -11, -12, -6,6, -6,9, -6,10 or -6,12 0 0
390890 Polyamides nes, in primary forms 0 0
390910 Urea resins; thiourea resins 0 0
390920 Melamine resins 0 0
390930 Amino-resins nes 0 0
390940 Phenolic resins 0 1
390950 Polyurethanes in primary forms 0 0
391000 Silicones in primary forms 0 0
391110 Petroleum resins,coumarone,indene/coumarone-indene resins&polyterpenes
0 1
391190 Polysulphides, polysulphones & other products of Note 3 Chap 39, nes 0 0
391211 Cellulose acetates, non-plasticised 0 0
391212 Cellulose acetates, plasticised 0 1
391220 Cellulose nitrates (incl collodions) 0 2
391231 Carboxymethylcellulose and its salts 0 1
391239 Cellulose ethers nes, in primary forms 0 0
391290 Cellulose derivatives nes, in primary forms 0 1
391310 Alginic acid, its salts and esters 0 0
391390 Natural polymers, modified natural polymers nes, in primary forms 0 0
391400 Ion-exchangers basd on polymers of Nos 39.01 to 39.13 in primary forms 0 2
391510 Polyethylene waste and scrap 2 0
391520 Polystyrene waste and scrap 0 0
391530 Polyvinyl chloride waste and scrap 0 0
391590 Plastics waste and scrap nes 3 0
391610 Monofilaments >1 mm, profile shapes etc of polymers of ethylene 2 1
391620 Monofilaments >1 mm, profile shapes etc of polymers of vinyl chloride 0 0
391690 Monofilaments >1 mm, profile shapes etc of plastics nes 0 1
391710 Sausage casings of hardened protein or of cellulosic materials 0 0
391721 Tubes, pipes and hoses, rigid; of polyethylene 1 1
391722 Tubes, pipes and hoses, rigid; of polypropylene 6 0
391723 Tubes, pipes and hoses, rigid; of polyvinyl chloride 0 1
391729 Tubes, pipes and hoses, rigid; of plastics nes 1 0
391731 Tubes,pipes&hoses,flexible,plastic,minimum burst pressure of 27.6 MPa 0 1
391732 Tubes,pipes and hoses nes,plastic,not reinforced etc,without fittings 0 0
391733 Tubes, pipes and hoses nes, plastic, not reinforced etc, with fittings 1 0
391739 Tubes, pipes and hoses nes, plastic 0 0
391740 Fittings, plastic 0 0
391810 Floor, wall and ceiling coverings etc, of polymers of vinyl chloride 0 1
391890 Floor, wall and ceiling coverings etc, of plastics nes 4 2

28
391910 Self-adhesive plates,sheets,film etc,of plastic in rolls <20 cm wide 0 0
391990 Self-adhesive plates, sheets, film etc, of plastic nes 0 0
392010 Film and sheet etc, non-cellular etc, of polymers ofethylene 0 0
392020 Film and sheet etc, non-cellular etc, of polymers of propylene 1 1
392030 Film and sheet etc, non-cellular etc, of polymers of styrene 0 0
392043 Plates, sheets, film, foil and strip, of non-cellular polymers of viny 0 0
392049 Plates, sheets, film, foil and strip, of non-cellular polymers of viny 0 1
392051 Film and sheet etc, non-cellular etc, of polymethyl methacrylate 1 0
392059 Film and sheet etc, non-cellular etc, of acrylic polymers nes 0 0
392061 Film and sheet etc, non-cellular etc, of polycarbonates 0 0
392062 Film and sheet etc, non-cellular etc, of polyethylene terephthalates 0 2
392063 Film and sheet etc, non-cellular etc, of unsaturated polyesters 0 1
392069 Film and sheet etc, non-cellular etc, of polyesters nes 0 5
392071 Film and sheet etc, non-cellular etc, of regenerated cellulose 0 1
392073 Film and sheet etc, non-cellular etc, of cellulose acetate 0 0
392079 Film and sheet etc, non-cellular etc, of cellulose derivatives nes 0 0
392091 Film and sheet etc, non-cellular etc, of polyvinyl butyral 0 0
392092 Film and sheet etc, non-cellular etc, of polyamides 0 0
392093 Film and sheet etc, non-cellular etc, of amino-resins 0 0
392094 Film and sheet etc, non-cellular etc, of phenolic resins 0 1
392099 Film and sheet etc, non-cellular etc, of plastics nes 0 0
392111 Film and sheet etc, cellular of polymers of styrene 0 0
392112 Film and sheet etc, cellular of polymers of vinyl chloride 0 0
392113 Film and sheet etc, cellular of polyurethane 0 0
392114 Film and sheet etc, cellular of regenerated cellulose 0 0
392119 Film and sheet etc, cellular of plastics nes 0 0
392190 Film and sheet etc, nes of plastics 0 1
392210 Baths, shower-baths and wash basins, of plastics 0 0
392220 Lavatory seats and covers of plastics 0 0
392290 Bidets,lavatory pans,flushing cisterns & similar plastic sanitary ware 0 0
392310 Boxes, cases, crates & similar articles of plastic 0 0
392321 Sacks and bags (including cones) of polymers of ethylene 1 0
392329 Sacks and bags (including cones) of plastics nes 1 2
392330 Carboys, bottles, flasks and similar articles of plastics 0 0
392340 Spools, cops, bobbins and similar supports, of plastics 2 0
392350 Stoppers, lids, caps and other closures of plastics 0 0
392390 Articles for the conveyance or packing of goods nes, of plastics 2 1
392410 Tableware and kitchenware of plastics 0 1
392490 Household and toilet articles nes, of plastics 3 0
392510 Reservoirs, tanks, vats etc of a capacity exceeding 300 l, of plastics 0 0
392520 Doors, windows and their frames and thresholds for doors, of plastics 0 0

29
392530 Shutters,blinds (incl Venetian) & similar articles & parts of plastics 0 0
392590 Builders' ware nes, of plastics 0 0
392610 Office or school supplies, of plastics 0 0
392620 Apparel and clothing accessories (incl gloves) of plastic 0 0
392630 Fittings for furniture, coachwork or the like, of plastics 0 0
392640 Statuettes and other ornamental articles, of plastics 0 0
392690 Articles of plastics or of other materials of Nos 39.01 to 39.14 nes 0 0