Embed Size (px)
Citation preview

N PS ARCHIVE1960CULWELL, J.
PLASMA OSCILLATIONS IN ALOW PRESSURE ARSON DISCHARGE
JACKSON ft CULWELL
DEAN R, JOJ::
j
:.H>-.<

LIBRARY
U.S. NAVAL POSTGRADUATE SCHOOL
MONTEREY. CALIFORNIA


*9
PLASMA OSCILLATIONS
IN A
LOW PRESSURE ARGON DISCHARGE
<*i*3§*
^!r ^ ^f* *o* ^<r
Jackson P. Culweli
and
Dean R. Johnson


PLASMA OSCILLATIONS
IN A
LOW PRESSURE ARGON DISCHARGE
by
Jackson P. Culw*
Lieutenant Commander, United States N
and
Dean R. Johnson
Lieutenant Commander, United St- tes Navy
Submitted in partial fulfillment of the
requirements for the degree >i
MASTER OF SCIENCEIN
PHY S CS
United States Naval Postgraduate Si hool
Monterey, Califon
I960

D' TTlMTE SCHOOL
_. ^ ^.iS43-5KHPLASMA OSCILLATIONS
IN -
LOW PRESSURE ARGON DISCHARGE
by
Jackson P. Culwell
'.d
Dean R. Job
This work is accepted as £ ing
the thesis requirements for the degree
MASTER OF SCIENCE
IN
PHYSICS
from the
United States Naval Postgi

ABSTRAC
This work is a continuation o£ tfa^ I g :'ons it
Howard T. Webb and Alan S. Garner, and as extended by Ei |<
E. Shouits and John A. Flynn in the field of plasma osci
in low pressure argon discharges at the United States N;>
Postgraduate School.
The basic tube was modified to incorporate a Philips Im-
pregnated (L.= dispenser type) cathode . Emphasis was given to
analysis of the plasma oscillations and the tube charai.cte t
by the Langmuir probe method.
The writers wish to express their appreciation to Profei
Normal L. Oleson for his continued encouragement, sugge •
I
and support, and to Professor A. W. M. Cooper for his ad%; i
•
and cooperation. Thanks are also due to Mr. Milton K. Andrews
of the Physics Department for his technical support.
11

TABLE OF CONTENT
Section Title Page
1 . Introduction 1
2. Previous Work 4
9
13
15
6. Conclusions 20
1. Recommendations 21
8. Bibliography 43
3. Equipment
4. Procedure
5. Results
111

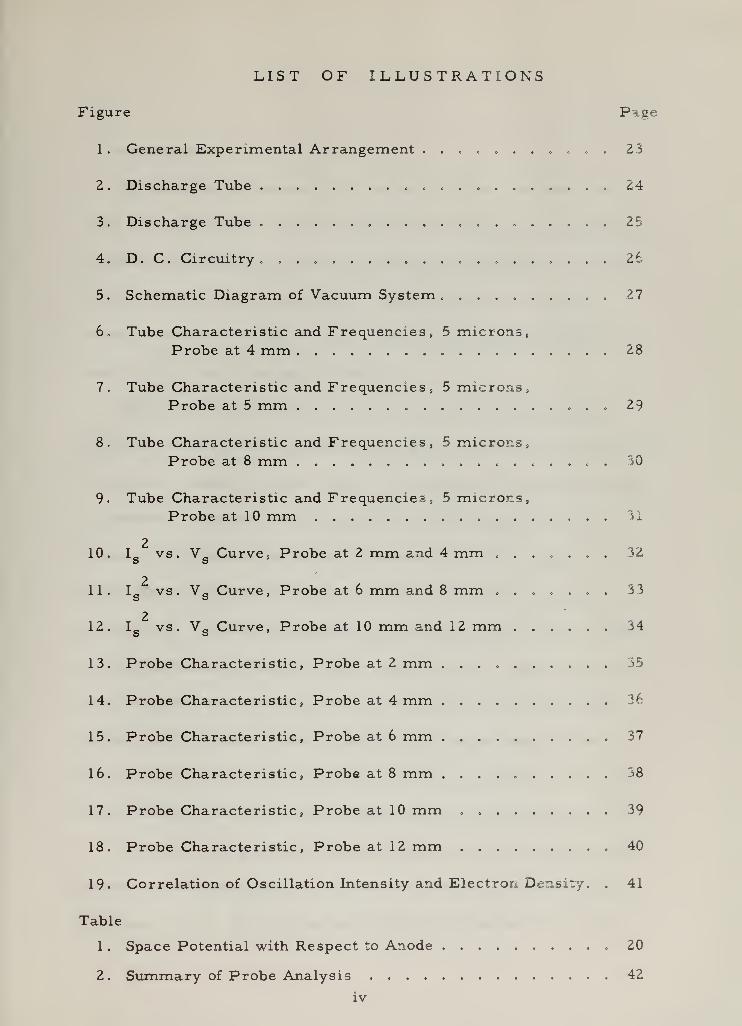
LIST OF ILLUSTRATIONS
Figure Page
1 . General Experimental Arrangement ........... 23
2. Discharge Tube 24
3. Discharge Tube ..................... 25
4. D. C. Circuitry 26
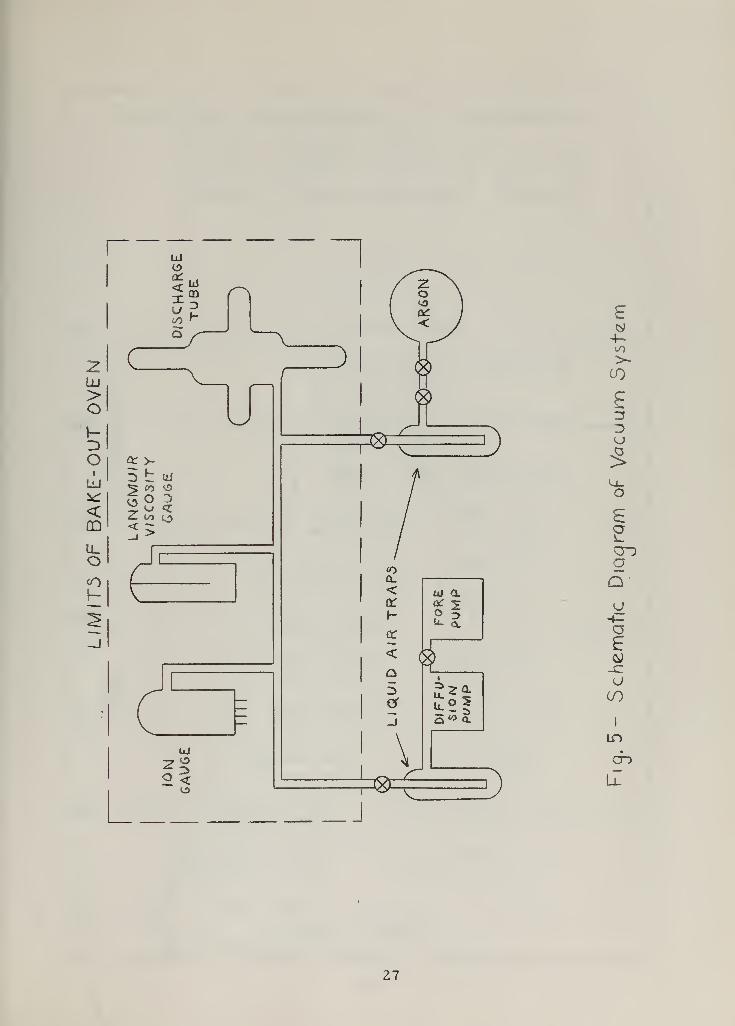
5. Schematic Diagram of Vacuum System .......... 27
6. Tube Characteristic and Frequencies, 5 microns,Probe at 4 mm .................. 28
7. Tube Characteristic and Frequencies, 5 microns,Probe at 5 mm . . 29
8. Tube Characteristic and Frequencies, 5 microns,Probe at 8 mm . 30
9. Tube Characteristic and Frequencies, 5 microns,Probe at 10 mm 31
210. L vs. V c Curve, Probe at 2 mm and 4 mm ....... 32
211. I D vs . V c Curve , Probe at 6 mm and 8 mm ....... 33
212. I
gvs. V s Curve, Probe at 10 mm and 12 mm ...... 34
13. Probe Characteristic, Probe at 2 mm 35
14. Probe Characteristic, Probe at 4 mm 36
15. Probe Characteristic, Probe at 6 mm 37
16. Probe Characteristic, Probe at 8 mm . 38
17. Probe Characteristic, Probe at 10 mm 39
18. Probe Characteristic, Probe at 12 mm 40
19. Correlation of Oscillation Intensity and Electron Density. . 41
Table
1. Space Potential with Respect to Anode 20
2. Summary of Probe Analysis 42
iv


1. Introduction.
The mounting problems in the control of fusion reactions; the
quest for explanation of solar and radio astronomical noise phenomena;
and allied investigations indicate the need for further basic research
in the field of electric discharges - especially discharges at low
pressures and in inert gases. This report covers plasma oscilla-
tions in low pressure argon discharges.
The term "plasma" embraces the portion of the discharge in
which the ion and electron densities are high and substantially equal (I) .
The positive columns of glow and arc discharges are notable examples
of plasmas. Ionization of the plasma is maintained primarily by-
electron collisions and by some photoionization. The regions
highly conducting and the negative carriers are electrons in rare
gas plasmas. Thermal equilibrium among the positive ions, electrons,
and neutral atoms of the gas may or may not exist. Since the positive
ions are accelerated by the action of the applied electric field, the
positive ion temperature may be higher than the gas temperature.
Because of the greater mobility of the electrons and their small mass
their temperatures will be much higher than those of the positive ions.
In general, the positive ions and electrons may be assumed to have
a maxwellian distribution, but departures from this distribution have
been observed (1 , Z) . The applied field does not necessarily produce


a departure from the maxwellian distribution in the plasma because, the
drift current density is generally much smaller than the random current
densities of the ions and the electrons. The field does however in« rease
the temperatures of both ions and electrons.
A large volume of plasma with the electrons and ions moving at
their characteristic temperatures in random directions is necessarily
neutral. However at points within the plasma there are high fields
existing depending on the arrangement of the charged particles around
each point. The fields change with time and electrons may gain con-
siderable energy in passing through a series of ac eeleraiing fields
with a fortuitous instantaneous configuration.
Two types of oscillations seem to be possible from the theoretical
point of view; plasma electron oscillations and plasma ion oscillations.
When the electrons oscillate,, the positive ions in a comparative analogy
have been likened to a rigid jelly of uniform density of positive charge,
ne. The electrons are initially distributed uniformly with, a charge
density, -ne, but are free to move. The resulting restoring force
brings about plasma oscillations. The positive ions also may ate
but because of their large mass the frequency of oscillations will be
much lower than the frequency of electron oscillations.
Plasma electron oscillations may transmit energy by a growing
wave mechanism. A growing wave results from the excitation of
plasma electron oscillations and the interaction, of these oscillations
with the beam. As the wave moves longitudinally through the plai

it tends to "bunch" the slowly drifting groups of oscillating ele<
in advance of the wave and spread the groups after wave passage. As
the redistribution takes place the exchange of energy between electrons
and wave in a particular phase relationship increases the net energy
in the wave. The wave amplitude grows exponentially reaching the
maximum rate of growth when plasma frequency approaches the
excitation frequency.
Another mechanism in which energy of the plasma electron os-
cillations may be transmitted is by modulating the velocity of the
primary electrons as the latter traverse the oscillating region.
Experiments in plasma oscillations are usually carried out in .
s ,
gas-filled diodes or triodes employing discharges through mercury,
argon, and similar gases. A diode filled with argon was used in this
investigation.
Typically, the voltage profile across the tube consists of a steep
rise in potential near the cathode, then a slow rise across the posi- ,
tive column of discharge to the anode with a sharp, small rise at the
anode C9} • The electrons traversing the interelectrode distance ex-
perience their major potential rise in the region near the cathode
called the cathode "fall." Because the electron mobilities are greater
than those of the positive ions, the cathode is surrounded by a sheath
of positive ions. As electrons move away from the cathode sheath
they are accelerated toward the anode producing more ionizations
and attaining a maxwellian distribution of velocities as they move

through the gas and experience collisions with gas atoms and each
other. At the negative glow boundary the entering electrons consist
of at least two groups - fast electrons which have been produced at or
near the cathode and have suffered few collisions in the dark space,
and slow electrons which have made many inelastic collisions in the
dark space. Since the slow electrons have energies below the ioniza-
tion potential but above or at the excitation potentials they experience
exciting collisions and produce emission of light from the negative
glow, then recombine with positive ions. The group of fast electrons
are the negative charge carriers which traverse the interelectrode space
2. Previous Work.
In 1924 while making studies of electric discharges at low pressure
using a hot filament as an electron source, Langmuir and Mott-Smith *
found that a large number of the primary electrons acquire velocities
whose voltage equivalent was greater than the potential drop across the
tube (5)
.
Primary electrons beyond the cathode sheath would be expected to
have energies corresponding approximately to the anode potential.
There was also a large number of electrons which had less energy
than expected so that the average energy of the primary electrons as a
group had not changed. This unequal distribution of the -energy among
the primary electrons is called "scattering."

Dittmer found that the region o£ scattering approaches the ' de
as the tube current is increased and predicted that high scattering of
electrons might be due to oscillations in the plasma. However he wasr.
unable to detect such oscillations (4} .
In 1926 Penning observed plasma oscillations with frequencies
ranging from 300 to 600 megacycles in the regions of elf scat-
tering [5) .
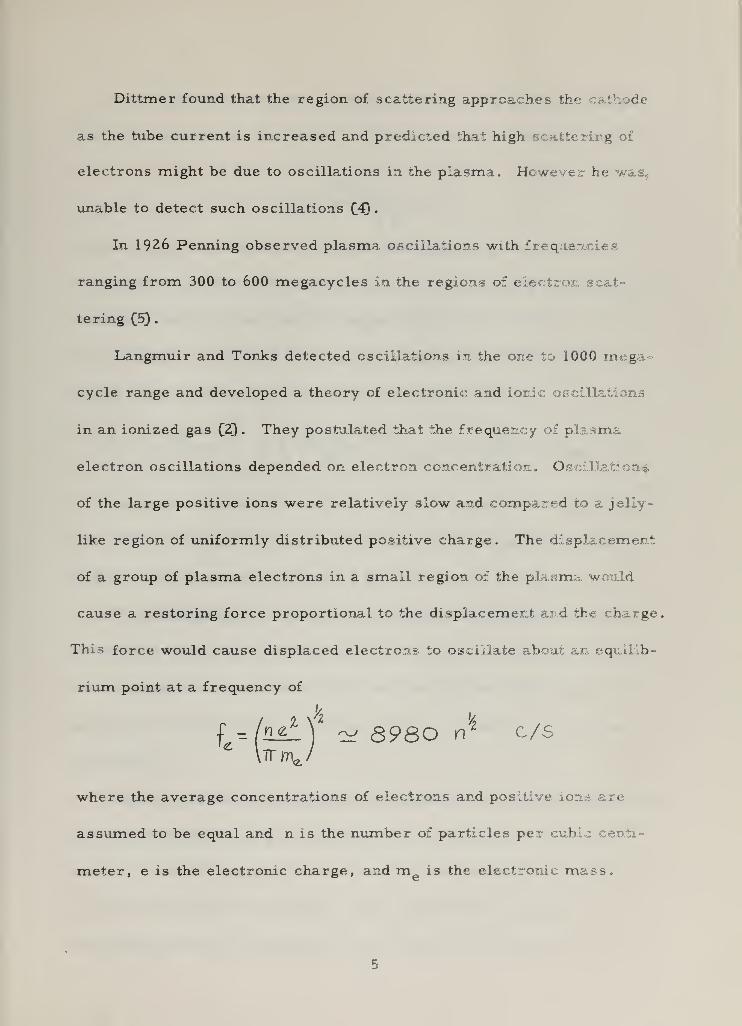
Langmuir and Tonks detected oscillations in the one to 1000 mega-
cycle range and developed a theory of electronic and ionic oscillations
in an ionized gas QZ) . They postulated that the frequency of plasma
electron oscillations depended on electron concentration. Os« n$
of the large positive ions were relatively slow and compared to a jelly-
like region of uniformly distributed positive charge. The displacement
of a group of plasma electrons in a small region of the plasma would
cause a restoring force proportional to the displacement and the charge
This force would cause displaced electrons to oscillate about an equilib-
rium point at a frequency of
f WiL^V ~ 8980 nl c/s
\iYn\J
where the average concentrations of electrons and positive ions are
assumed to be equal and n is the number of particles per cubic centi-
meter, e is the electronic charge, and m is the electronic mass.

Assuming the same type of displacement for the positive ions as
for electrons before, the frequency of plasma ion oscillations be: -
i = (
—
nz\ A'1
-/ s1 I Trm + na^m
pA I
K ' a. '
where m is the ionic mass, A is the wave length of the plane wave or
approximately equal to the displacement of the ions from an equilibrium
position, and T is the absolute temperature of the electrons. If tl
displacement is small or if T is large, the plasma ion freq * y re-
duces to the same form as the electron frequency, i.e. ,
* \ If m- / ~~ T<2YY\- I
C/S (for singly charged ions)
Langmuir and Tonks verified the above predictions with experim*
The absence of space coordinates indicates that, except for secondary
. i
factors, the electronic oscillations do not transmit energy.
Druyvesteyn and Warmoltz during their work with hot cathode dis-
charged in 1937 observed that anomalous changes in electros t i• [ties
and concentrations occurred in very narrow regions in the plasma and
advanced a hypothesis of the existence of micro-fields to explain the
effects (6) .
Merrill and Webb investigated the dependence of elect ing
upon plasma oscillations in a mercury arc discharge. Tbx
movable probe of tungsten wire to measure the intensity and position of
plasma oscillations. Probe data was analyzed by the La
Mott-Smith method to determine electron and ion concentration- -
6


electron temperatures - a method generally used in the presei
ligations. Merrill and Webb confirmed the observations of Bt". .
and Warmoltz and detected stable periodic oscillations o£ conside - tb i
magnitude in narrow regions. Because the oscillations were found 01
in regions traversed by the primary electrons they concluded that tin
scattering was due to plasma oscillations. The observed frequen
agreed well with the formula derived by Tonks and Langmuir (3)
.
Continuing the pioneering investigations of Merrill and Webb with
studies extending from 1947 to 1954, Armstrong, Emeieus , and Nel.ll
established that (a) oscillations are stable and reproducible, (h) os-
cillations varied in frequency and magnitude over the tube characterise
tics (83 and (c) the frequency of oscillation, which agreed with Toi
and Langmuir's formula, was independent of probe bias over an ex-
tended range and varied directly with gas pressure Q.0 , IX}.
In 1949 Wehner's experiments with a stabilised low pres"
discharge resulted in the discovery of an RF oscillator with '
frequencies between 800 and 4,000 megacycles and again tht
frequencies compared with Tonks and Langmui 1 theory
Utilizing a new technique in 1954 Looney and Browi
of high energy electrons from an auxiliary electron gc|
of a D.C. discharge and excited oscillations in the plaszn l at ti
Langmuir electron frequency Q. 3} . A movable probe sib tl • exi
of standing wave patterns at the oscillatory energy in
electron beam. By detailed behavior of the freqi

the transitions in the standing wave patterns, the mechanism of energy
transfer from the electron beam to the oscillation of the pla * ons
was established as a velocity-modulation process. However, Looney and
Brown could not produce the plasma oscillation predicted by Bohrn and
Gross and others 04, l5)»
Later in 1957, Boyd, Field, and Gould used a technique similar to
that of Looney and Brown but modulated the probing electron beam with
a slow electromagnetic wave. They obtained experimental verification
that the maximum rate of growth of plasma oscillations ocean- when the
plasma frequency is linearly related to the modulation frequency 06j .
By producing a direct correlation between modulation and plasma f r
quency and demonstrating the laboratory existence o£ growing plasma
waves, Boyd et al substantiated the previous theoretical efforts of Bohrn
and Gross, Haeff, and others.
The reliability of probe analysis in the investigations of electron
scattering in discharges was shown by T. K. Allen 07}. A • rmed
that the oscillation intensity peaks occurred at an integral number of
"beam wavelengths" between anode and cathode. He concluded that o
dilation intensity fluctuations as the probe is moved away from th<
cathode are caused by feedback from the probe used for detection of the
oscillations. The peaks correspond to the feedback being in phase with
the disturbance at the cathode. Spectroscopic analysis of an argon dis-
charge showed the abrupt appearance of scattering at
distance in the absence of the probe. He also described the ppeara
8

in argon and mercury of a meniscus - a thin region of brighter plasma .,
extending across the beam and convex toward the cathode with a dark
region of similar shape on the anode side. Emanating from a region just
beyond the meniscus, visible effects of primary electron scattering were
observed as converging and diverging beams in the glow region.
In 1957 Allis suggested that the concentration gradient of plasma
electrons is a controlling factor for the growth of plasma oscillations,
theory indicating that oscillations are most likely to grow in amplitude
when propagated down a concentration gradient (!&)• Mahaffey et al
in 1958 and 1959 investigated Allis' s suggestion and found at least an
eighty-five percent correlation between occurrence of maxima and
minima of the electron concentration, and the growth and decay respec-
tively of oscillation intensity QSQ •
3. Equipment.
The equipment used can be divided into four main components as
follows:
(1) Gaseous discharge tube in which a glow discharge could be
continuously maintained.
(2) D. C. electrical circuit for supplying power and for controlling
and measuring discharge conditions.
(3) Frequency detection and measuring equipment.
(4) Vacuum system for the evacuation and filling of the tube.
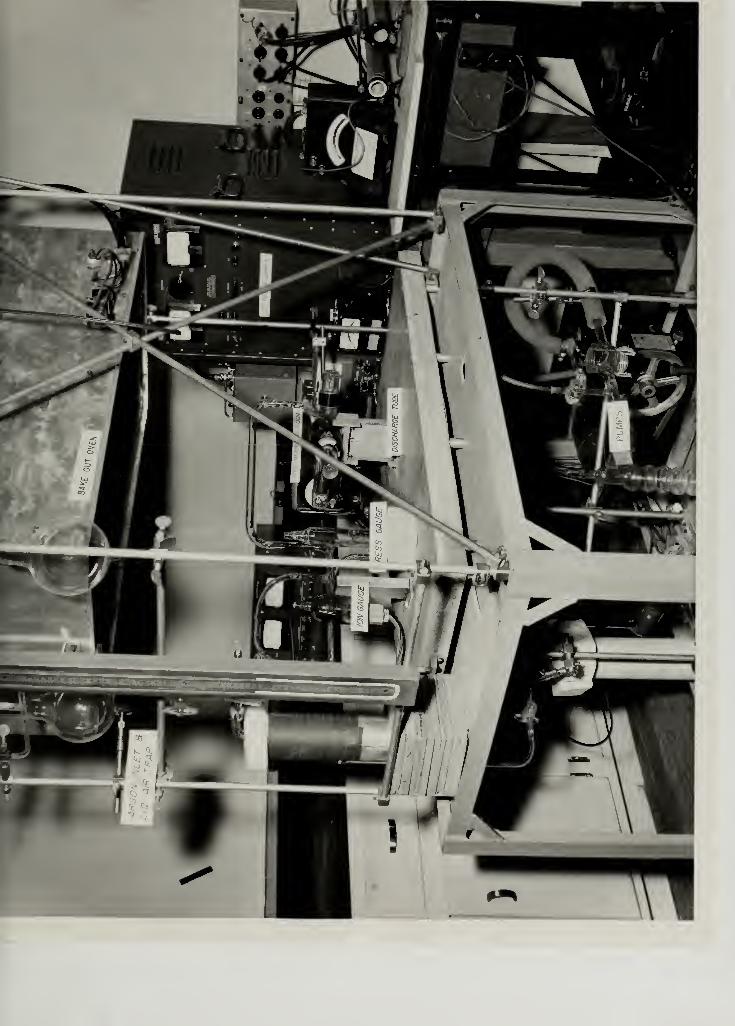
Fig. 1 is a photograph of the general experimental arrangement.


a. Discharge tube. Fig. 2 is a photograph and Fig. 3 is a
detailed drawing of the tube (diode). The electrodes and probes were
attached to soft iron cylindrical cores sealed in glass. This made
possible the variation of interelectrode distances and probe positions
by moving the iron cores with externally applied magnetic fields.
The principal probe used in this work was a cylindrical probe
composed of .008 inch tungsten wire which was enclosed in a glass
sheath up to 3.8 millimeters of the tip.
Some preliminary measurements were made using an insulated
coiled wire probe. This probe was constructed of 112 turns of No. 36
Cerametemp * wire coiled on a ceramic core of five millimeters diam-
eter and four millimeters long. The coil could be rotated from a position
parallel to the discharge beam axis to one that was perpendicular. Dur-
ing remodeling of the discharge tube the coil wire was damaged and this
probe was removed. It was replaced by a ring probe as shown in Fig. 3.
The latter probe was not used in the experiment.
All leads to the probes and to the electrodes were made as short
as possible in order to minimize inductance effects which tend to at-
tenuate signals
.
The cathode was a Philips impregnated "L" cathode ** with a two
centimeter diameter face indirectly heated by a tungsten element drawing
# Manufactured by Hitemp Wires, Inc. , 26 Windsor Ave. , Mineola,
L.I. , New York** Manufactured by Semicon of California, Inc.
10

seven amperes D. C. Considerable time and effort were spent in
making a suitable heater element for the cathode. The design decided
upon was a coiled .014 inch tungsten wire, the coil being approximately
1.5 centimeters in diameter and one centimeter in length. The element
was formed by winding the tungsten wire on a brass mandrel and then
heating the mandrel with a torch until the wire was sufficiently annealed
to hold the desired shape.
An insulating coating was necessary for the heater so that it would
not short out with itself or with the body of the cathode into which it
fitted. For this purpose a thin uniform coating of Al was applied
by the following procedure. The coil was thoroughly cleaned electro-
lytically in a strong NaOH solution using the coil as anode and a carbon
rod as cathode. A potential of approximately five volts was applied for
less than one minute which was sufficient time to remove the oxide film
from the tungsten. The cleaned wire was then coated with alumina by
dipping it into a thick slurry of Al suspended in amyl acetate. Some
experimenting was required before this seemingly simple process re-
sulted in an acceptable alumina coating on the tungsten. Another method
tried was the cataphoresis process (2.CF) • The amyl acetate slurry was
diluted with an equal volume of ethyl alcohol and used as an electrolytic
solution with a stainless steel anode and the tungsten coil as cathode.
Various voltages were tried, but the coatings achieved were not as
uniform as those resulting from the simpler dipping method.
11


The alumina was dried in air by passing 3.5 amperes of current
through the wire for about five minutes. This resulted in an adherent
coating which would stand reasonably careful handling. A harder coat-
ing could be obtained by baking in a vacuum at 1700 degrees centigrade
for 15-20 minutes.
b. D. C. circuits. Fig. 4 diagrams the D. C. circuitry used
with the discharge tube. D. C. power source for the tube was a voltage
regulated power supply manufactured by Kepco Laboratories, Model
1250B. Power available was 1-1000 volts, 1-500 milliamperes . A
D. C. generator supplied power for filament heating, and probe biasing
was by "B" batteries. Vacuum tube volt meters were used to measure
plate and probe voltages.
c. Vacuum system. Although no special attempts were made to
obtain the ultra-vacuums achieved by Flynn and Shoults (21), pressures
-7in the order of 10 mm of mercury were readily attained. All valves
in the system were glass stop- cocks lubricated with Type N Apiezon
grease. The diffusion pump was a three- stage air-cooled pump
using Octoil-S. The major part of the system could be baked out by
means of a portable oven (see Fig. 5). An induction heater was used
to outgas the anode. Outgassing of the Langmuir probe was accomplished
while the tube was operating by applying positive potential to the probe
sufficient to cause ohmic heating of the probe.
Low pressures were measured by an ion gauge. Pressures in the
operating range (one to ten microns) were measured by a Langmuir
12


viscosity gauge C2Q. Tube voltage readings also were used as an
indication of tube pressures after voltage-pressure relation had been
determined. Since plate voltage is a function of tube pressure (other
parameters such as current and anode- cathode spacing remaining con-
stant), a given pressure could be readily duplicated by evacuating or
filling the tube until the correct voltage was obtained. Thus, if fresh
argon was desired in the tube, the procedure of flushing and refilling
could be quickly and accurately accomplished without relying solely on
the relatively slower pressure measurement process using the viscosity
gauge
.
d. Detection equipment. A Tektronix Type 543 oscii i or.cope was
used to detect oscillations of frequencies up to 20 megacycles. Higher
frequencies were detected by a radio test set, AN/URM-17 which has
a frequency range of 370-1000 megacycles with a threshold voltage of
ten microvolts.
4. Procedure.
-4After assembly, the system was evacuated to the 10 mm of
mercury range. The anode was outgassed with the induction heater
and then the system was baked out with the oven at 460 degrees centi-
grade for five hours. During this time the tubing and liquid air trap of
the filling system were heated to 350 degrees centigrade by means of
heating tapes. Following bake out, the cathode was heated to operating
temperature and the anode again outgassed with the induction heater.
-7After the pressure was reduced to 5 X 10 millimeters of mercury,
13

the system was filled to two millimeters of mercury with spectroscop-
ically pure argon. This evacuation and filling was repeated twice with
the final pressure left at the desired operating pressure.
The first efforts were to obtain the tube current-voltage character-
istics and to determine if detectable plasma oscillations were present.
The results of these experiments are shown in Figs. 6 through 9. Tube
pressures shown were measured by the viscosity gauge with the tube in
operation. Low frequencies were detected by the oscilloscope (the oscil-
loscope probe was attached to the wire probe and grounded to the cathode)
.
Measured signal voltages are shown in parenthesis on the graphs of Figs.
6 through 9. The high frequencies were detected by using the URM-17
as a sensitive radio frequency electronic micro-voltmeter with the lead-
in cable terminal next to, but not touching, the wire probe lead. Voltage
readings for these oscillations must be considered relative since the
URM-17 was not calibrated for a matched impedance input.
By use of the cylindrical wire probe, data were obtained for
Langmuir probe analysis, i.e. , determination of electron temperatures,
ion and electron densities, space potentials, and predicted electron and
ion oscillation frequencies. Plots of the characteristics are shown in
Figs. 10 through 18. Due to limited time, probe analysis was restricted
to one tube pressure (2.2 microns) and one plate current (50 milliamperes)
Data were taken with anode-cathode distance fixed at 1.5 centimeters and
with six different probe to cathode distances. The probe was approxi-
14


mately five millimeters above the discharge beam axis and parallel to
the cathode face.
Preliminary measurements were made with the coil probe in an
attempt to detect the presence and orientation of changing magnetic
fields in the discharge. Signals were observed on the oscilloscope and
signal strength varied as the coil probe was rotated in the beam. With
the coil axis tilted about ten degrees toward the cathode from the vertical.
plane, the maximum signal was detected. The signal diminished as the
coil was rotated clockwise, i.e. , the upper part of the coil was turned
toward the anode. A minimum in the signal strength was detected when
the coil had been rotated approximately 90 degrees from the position of
maximum signal. With further rotation of the coil, the strength of the
signals increased to another maximum at the position of 180 degrees of
rotation. These results indicated a changing magnetic field in the beam
with a maximum component in a plane tilted about ten degrees toward the
cathode from a plane which is normal to the beam axis. Further use of
this coil was curtailed when the coil was damaged and removed from the
tube
.
5 . Resutlts
.
Low frequencies which were attributed to positive ion oscillations
were detected by the oscilloscope in the range of 40-550 kilocycles.
Lower frequencies were present but were found to be relaxation oscilla-
tions C?3). Higher frequencies were detected from 362 to 9^0 megacycles
and were believed to be electron oscillations. Equipment capabilities
15


prevented adequate coverage of the ranges 2-370 megacycles and above
1000 megacycles. The measured relative intensities of oscillations and
the calculated electron densities for tube pressure of 2 . 2 microns are
shown graphically in Fig. 19 and tabulated in Table 2. It can be seen
that these properties increased to maximum values in the 10-12 milli-
meter range of probe to cathode distance. Also, Figs. 6 through 9 show
maximum oscillation intensity at a probe-cathode distance of ten milli-
meters for the measurements made with tube pressure at five microns.
It was found that the wire probe characteristics changed rapidly
during tube operation. It was assumed that this was primarily due to
material sputtered or evaporated from the Philips cathode. To minimize
this effect, it was necessary to clean the probe repeatedly. This was
accomplished by applying a positive potential to the probe, causing it
to draw sufficient current to heat it to cherry red.
For a cylindrical probe with an orbital-motion- limited current, the
theory developed by Langmuir and Mott- Smith indicates that the square of
the ion current density increases linearly with probe voltage (3J , the
relationship for singly charged ions being:
2jz= IL. =
2°rkTi
fr
Lit
7' m +
i
LkT;n
,
where: Jj = ion current density to probe
1^ = ion current to probe
A = probe area
V = probe potential with respect to plasma
16


Tj = ion temperature
m. = ion mass
n„ = ion density in plasma
electronic charge
k = Boltzmann's constant
2Thus, a plot of I. versus V should result in a straight line. Further,
the slope of the line can be used to determine ni
dV Tr*m t
and K - ^'ffl iwhere $= slope
Under the assumptions made, n is also n (electron density) in the plasmai
e
2Curves for square of total probe current (I ) versus probe voltage
with respect to anode (V ) are shown as Figs. 10 through 12. L is equal
to I in the region where the probe retarding field is large enough to
repel all the electrons. As probe potential is decreased from that point
all probe current should be positive ion current, and a straight line
relation is predicted. However, it was found that current increased
rather rapidly as the probe was made more and more negative, and the
2I versus V plot departed from the straight line relation. This wass s
assumed to be the result of electron emission by the probe, and the ef-
fect was increased as the probe to cathode distance was decreased. The
2correct J -V relation in each plot was taken as a line drawn through
the points in the region where probe emission was not evident.
17


2To obtain the values of I
e» the I| plot was extrapolated toward higher
potentials. Using the Ij so obtained:
I« « Is - II
As long as the probe voltage retards the electrons and if the electrons
have a maxwellian velocity distribution, the following relations are
valid C22):
Ie = 1° evp(-eV)/fcTe
In order to obtain electron temperature and space potential the logarithm
of I was plotted against probe potential with respect to anode (V s ). The
plot obtained was not linear but it could be resolved more or less into
two energy groups, each with a maxwellian distribution, i.e. , linear
relation of log I and V s . Figs. 13 through 18 are plots of log Ie versus
Vs and show the resolution of Ie into the two groups. The temperature
of each group was determined from the slope (S ) of its log Ie versus
Vsby:
In all plots except the one for probe to cathode distance of ten millimeters
the plot of the fast group terminated at a "kink" which appeared at a point
where the potential in relation to space approximated the tube drop. The
reason for this "kink" is not known., but it probably can be attributed to a
small group of electrons with a narrow band of energy, one which had been
accelerated to tube potential and had not been scattered.
18


Space potential listed in Table 2 was obtained from the intersection
of the two asymptotes of the log I versus Vg plot. Space potential can
also be located on the log Ie versus V s graph by using the predicted
electron current when the probe is at space potential. This current
(I ) can be calculated from the electron concentration (ne ) and the
temperature of the slow group of electrons by using the relation:
J-sp 4- « ^ TV m& J ^ n
As a third method, the space potential can be fixed- -theoretically- -as
the potential where the graph of log I versus Vgdeparts from linearity.
Experimentally it has been found that this transition is not a sharp one
and that log Ie departs from the straight line relation to Vgbefore space
potential is reached. Thus, if this third method is used to determine
space potential the value found will be low. The determinations made by
the three methods are tabulated below. The space potentials are given
with respect to the anode. Potentials with respect to the cathode may
be obtained by adding the tube voltage, 32 volts, to the tabulated values.
It is seen that the determinations made by the asymptote intersection
method compare fairly well with those determined from the I calcula-
tions, and are considered reasonably accurate. The asymptote inter-
section method is the preferred one because it is a simple graphical
solution and requires no computations. All three methods gave positive
values for the space potential, this being in agreement with the findings
of Mahaffey when using a disc anode in mercury discharge 0*0 .
19

— ~
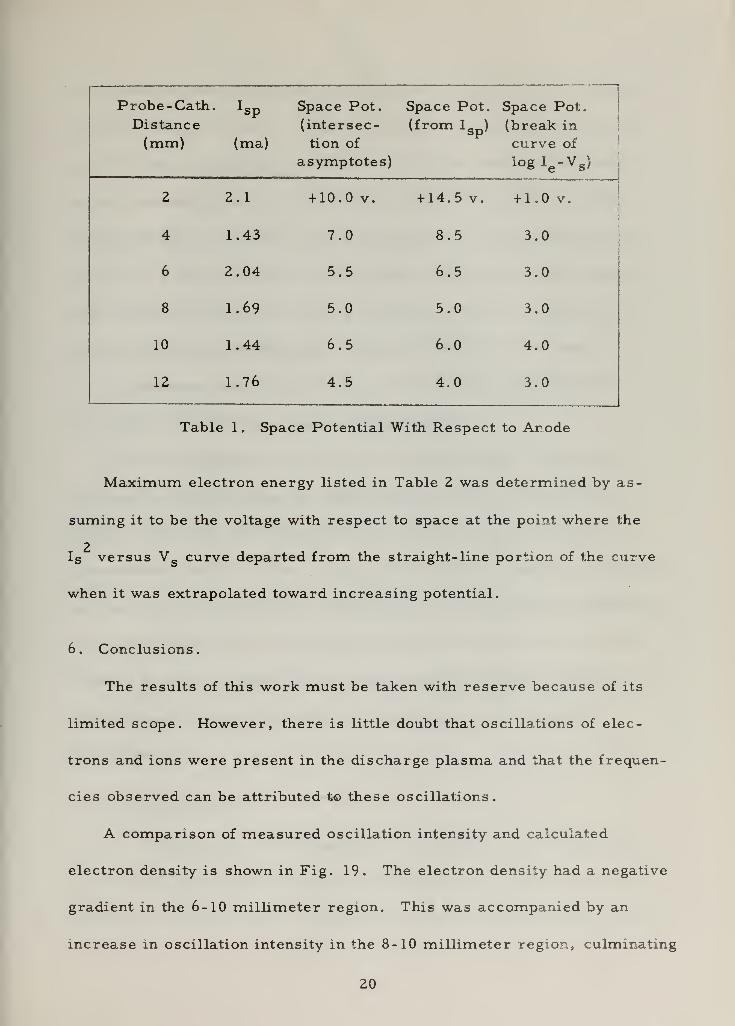
r
Probe -Cath. *sp Space Pot. Space Pot. Space Pot.
Distance (intersec- (from I sp ) (break in
(mm) (ma) tion of curve of
asymptotes) logIe-Vs )
2 2.1 +10.0 v. +14.5 v. +1.0 v.
4 1.43 7.0 8.5 3.0
6 2.04 5.5 6.5 3.0
8 1.69 5.0 5.0 3.0
10 1.44 6.5 6.0 4.0
12 1.76 4.5 4.0 3.0
Table 1 . Space Potential With Respect to Anode
Maximum electron energy listed in Table 2 was determined by as-
suming it to be the voltage with respect to space at the point where the
2I s versus V s curve departed from the straight-line portion of the curve
when it was extrapolated toward increasing potential.
6. Conclusions.
The results of this work must be taken with reserve because of its
limited scope. However, there is little doubt that oscillations of elec-
trons and ions were present in the discharge plasma and that the frequen-
cies observed can be attributed to these oscillations.
A comparison of measured oscillation intensity and calculated
electron density is shown in Fig. 19. The electron density had a negative
gradient in the 6-10 millimeter region. This was accompanied by an
increase in oscillation intensity in the 8-10 millimeter region, culminating
20


with maximum intensity at the point where the density gradient changed
sharply to a positive one. This was in accord with the theory advanced
by Allis that oscillations are more likely to grow when a beam of elec-
trons is moving down a plasma electron concentration gradient, and
that the maximum intensity should occur at the end of a negative grad-
ient 0$). It must be noted that data was obtained at relatively widely
spaced points and that more data is necessary before a complete com-
parison of electron density and oscillation intensity can be made.
No apparent relationship could be found between space potential
and oscillation intensity or electron distribution.
Observed frequencies of electron oscillations were lower than
predicted maximum values by approximately a factor of two. It is
possible that frequencies observed were subharmonics and that the
fundamentals were above the ranges of the detection equipment. Because
no meniscus or scattering was observed, it is concluded that oscillations
were relatively weak. The reason for the absence of a meniscus is not
known. It seems unlikely, but it may be that the emission properties of
the Philips cathode are not conducive to the occurrence of such a
phenomenon.
7. Recommendations.
a. Conduct further investigations of the plasma oscillations in the
present configuration of the tube with various pressures, interelectrode
distances, and type of gas. In particular, make intensive probe analyses
21


varying probe to cathode distances in steps not greater than 0.5
millimeters
.
b. Obtain or design and construct sensitive frequency detection
and measuring equipment with complete coverage up to about 2,000
megacycles •
c. Investigate the effects of a superimposed axial magnetic field
on the plasma oscillations.
d. In order to reduce interference of the probe with the discharge
and to obtain more reliable probe data s the wire probe should be re-
placed by a similar one of smaller diameter, e.g. , one of diameter
.004 inch as compared to the .008 inch diameter of the probe used.
e. Replace the ring probe with a small coil probe and investigate
the magnetic field associated with the plasma.
22


2
.oh- 1
Z) I
o 1
UJ I^ 1< BCD 1
25


Oto
25


o
o
I
26

a:<x
a
r\
zLu>o
O
<CD
oCO
c\
Or
a: >-
3 t UJ
O O 2)
<C to (o
2>
LU
2<
E
>-CO
2
g
E-CuCO
IT)
Li
27


Fig.6-Tub<z Characteristics and Frequenc/es
Pressure (Argon)- 5.0 microns
Anode - Cathode distance- 1.6 cms.
Ca+hode- Probe distance — 4nom5,
28

Fig.7 -Tube Characteristics and Fre quiz na^sPressure (Argon) - 5.0 micronsAnod e— Cathode distance
-
1, 6 cms.
Cathode-Probe distance - 5 mms.
/go
J 830 tr\C 0-3)r 85omc (1.2)
70 kc (0.4-)
i 83t>^c0.4)r <S50mc(0.9)
l&Q
A 82.5*y>c(i.3)
140
COJ -780W1C.O-I)
1 78omc(l-6)r 855r*c(f.O)
/ lfiom^e.0'9) gSo^t Cl-2.)
9 82.5^c(|.o)
\%0
a/ 760Wic(o.9) 8o5rr^c(0.9)? 780*^c (i.8) 82.S hnc(l.
E1
J 735r*c (0.8^ 78C"^C (0.9)7 76ooo C (I, 0)
100
•
C / "73S"vncCl-°)r 78owc(i.O no tec (0.2.)
u
J 4 5"4n^c (o.7) "73S"kwc Cl-D
7 715" mc (l.o) S^owc (0.8)
L 6^omc(l-o)P 7i£mc CI- 6)
/oo kc (0.2^
/ 58o^c('-o) 688mc(|.l)P 615" ">c CL.5") 7/o mnt (l'»)
GO a.J 429r»c(l.2.) ^gmc(2.7>y 5o9*oic(/.6) (-il. rt\z (S.o)
J 4-i4-m<z (2..o) 5"<?6 mc (5.o)
9 5o?mc (7.o)
4o/ 4*8 *»c (1.6) 5"7l tone (5.0^
/ 48*|^c (lo.o)80 kc Co.^
c/ 4S"I /Vio C 1.4^ ^owc(4,g]7^ 465 mc ag) S8Qfl\c (|,o)
10
7 362. /*k ( |,o)
1 AQ«? Kvsr f, •>>
> 419 wc (6-5)
*p *.
' Plate Volts*? 2,4 2^6 2,8 3,o
29

F>9 8- Tube Character istics and Frequencies
Pressure (Argon) - 5.0 micronsAnode - Cathode d/staioce - 1.6 cids.
Cathode -Probe, distance- 8mms.
. </)
1 A-QO mc (|o} Zoo Kc (6.0)
C3
£C5 /
\60
IS.0
£1
-4-
c
O-U --4-
OCl
r/ 870 fr\<L (9.6)Y 57gmcU.O)
1 8l0mc(\0.dSY 96o mc (0.7)
2oo (cc il.o)
I60 ICC (o.s^
1 350 K*C (il.o^r 8i?mc 09.O)
L 8so ™c (3.5)
1 8o5 vT^C Ci.oi
J7oS-
r*c(/.7)
-
SO
90 Kc Co. 6)
do k-Q. fo.6}
40
i 59Omc0/.0) 69orr)c(3>°)
7 4-74- rv\c (3.9) ll0KQ.C0.4-)J 5So mc C17.0)A SQtl r*c (4.0)
1 4oS>y\cC0.5)
<L_J____Plare Vo/fsZ,2 0^~~° 3jO 3|*
30


Fig.9-Tub<£ Characteristics and Frequencies
Pressure (Arg°n) - 5.0 microns
A node- Cathode distance- I. 6 cms.
Cathode- Probe, distance - 10 mms.
a9o
870mc(8.o) ZZO Jrc (4 o)
7A0_ Jl _
a.
2oo ^
160
12.0
£1
i.
4-_o
,80
4o
6/5" me (1.4)
§30rnc 6.6.0)
43owc(l.5)6IS mc(l.5")-810 rnc(22.o)
43omc0.7)S85"me(3.o)8»ovvic(l7.o>
ZooJcc (2.o)
Zoo kcCi.o)
430mc(l.®) 79<0mc(/0.o)5"5*5"rvic (1.6)
SSZmc C2.o) £4omc(l2.0)6(0 W c C1.3)
735" r»c (4-. 5")
83o«r>c Clo.5)
7^.ovy\c(I-2-)
8i5rv»c (4-5)
620 mc (3.o)
810 mc CZ.5")
407 rr\<- (\*o)
574 we (4.5)
45a mc(l-3)
loo Ice (©•*>}
loo kc (0.6)
Plate VoIts3\0 Ai±31


Fig- loSquare, of Probe Current
vs.
Probe. Voltage wrt Anode
i
C
4
3
2
/
-a
TCathode-Probe distance- 2mms
j a.-46 38 -30 _2^
Probe Voltage-
-14
i
o
I
H 8o
o
T
Cathode -Probe distance- 4 mms
-46 -38 -30 -22
Probe. Voltage
-/+
32


10-
8-
I
Fig. II
Square of Probcz Current
Probe Volfeme vyrf Anod<2-
1
Cathode -Probe distance.- 6mms
o
4-0)
E °
oQ
OV -
-4-61^.
-38 -30
Probe Voltage-21 14-
O
* *>/*_H /0
O
,
Catnode-Pro be distance- 8mms i
6-^
<<
^a
J o I
-*6 -38 -30
Probe Vo/taac-2Z -/4
33


Fig. 12
Sauare of Probe Currentvs.
Probe Vol+aae wrf Anode
T" "^ T~
Cathode -Probe disfance-IOmms
o
30hG^
-22
probe Vol+age
Probe Voltage
34


\Q£_
,0.6
Fig. 13- Probe Characteristic
Pressure (Argon)- 2.2 microns
Cathode -Probe distance -2 mms
a"o'
.^<r
v
-O-
^
4oo
Ea
,2—
rf
lO.I
/o
P4
^7 /
A %= 254,000 °k
-e-^/4
,08
.ofe
/
a f
.04- tt?O
o
o
o
T^=- 50,800 °K
.0%
.01
O
O
O _2.o
/
t Probe Voltage ('
V
s ) wrt Anod<z
4ff60_)
35


l.o
i.o
Fig. 14- Probe Charac+erisfic
Pressure (Argon) - 2.2 imicrons
Cathode -Probe d/stance -4 mnjs
-o^
o
0-8
o
"O
0.6
o
1°
o.
»
1
p^^Ts= 40,000 °KO,
o1
.08
1^6 1Z.
.04-
O
O/4,70/
.««.°
I
Probe Voltage (Vs) wrt Anode
36
. 01 -t ZD I ? £|0 3l2 6j0 &£_

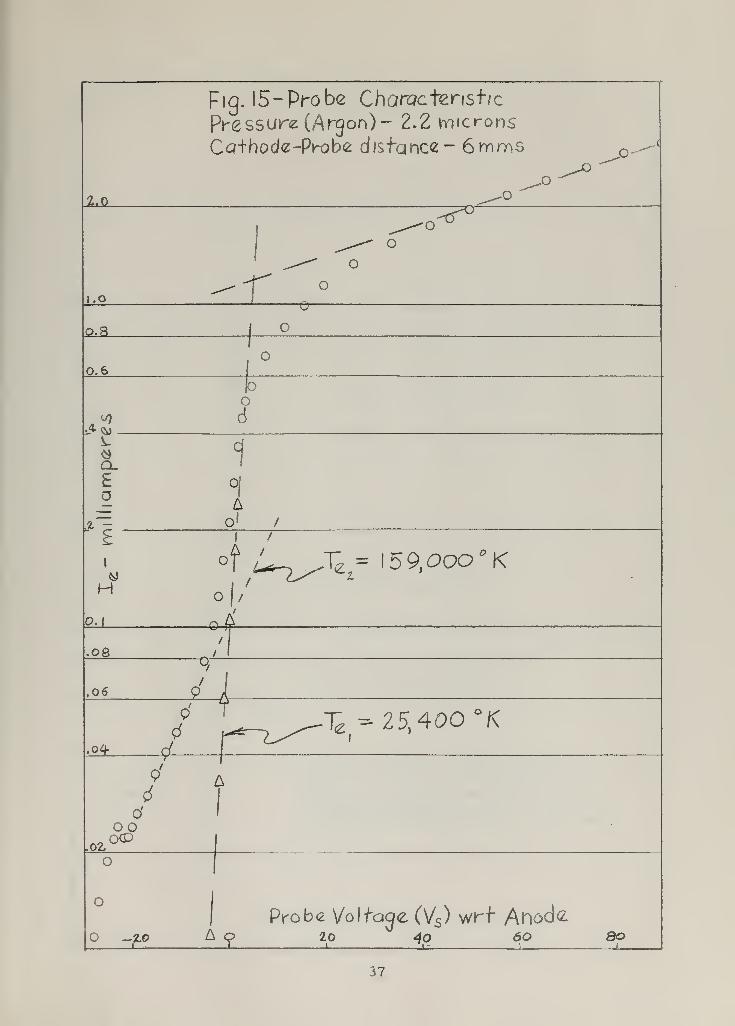
Fig. l5-Prob<2 Chargctens-hc
Pressure (Argon)- 2.2 mmcrons
Ca+hod<z-pK)be distance- 6mros jo-^
Mo
^i.o
O
-e-
Q.S
0.6 iOd
o
a.Ea
I
Ho.
1
°iAo !
"^ = I59,000°K
.oe
.06
£4.
I
4-
1^ - 25,400 °K
6A
.02,
O'
oo
O
o _-z© A oL_
Probe Volf-ajc (Vs ) wrf Anode4o20 60 so
i_
37


4-.0~^cr
1.0
.-tr°
XT
.6
f</3
Lfa)
Ea
"Ei
ol
7H
p.i
A ."T^ = 1 4T.OOO °KoA/
o_&.
.06
.04-
£0/1/
-O" r1^ ^ Zi^oCK
O^D d
o oo
o
Fig. 16 -Probe Characteristic
Pressure (Arqon)- 2,2 microns
Catbod<z-Probe distance -8mms
T
.01-2o
Probe Voltage (Vs ) wrt Anode20 4-0 60 90
1
38


XF~
o^-
oo
Tz = 22,800 °K
T~ -I60.000 °K
z
Fig. 1 7- Probe Characteristic
Pressure (Argon)- 2.2 m'crons
Cathode-Probe distance- lOimms
Probe Voltage (Vs) wrt Anode2.0 40 60
39
80—1
—


4.0
ML
\.o
.JO
O
TCT
Q&_
£&.
.4 V
Q_
Ea
f. -X = I4 2.0OO °K
OHO.I
f6ft
.08
.06
od1
° /
.04 O
-X = is;2oo °k16
1
.02.
?
Fig.l8-Probe Characteristic
Pressure (Argon) -2.2 microns
Cathode-Probe distance- !2mms
.Ol "?°
tProbe Voltage (N^) wrf Anodfc
20 4o 6060 Boi
40


Fig. 19
Corrfclat/on of1
Oscillation Xnf-^nsitc^
and Electron D<z.nsitu
Pressure (Argoni -2.2 micronsAnode -Cathode distance- 1.5 cmsPlate Curreni- - 50 mamps,Plate Voltage - 32 volts
ico4-
O
>4-
JO^)
£ 4 6 8
Probe- Caihode distance'
i]


zt
H
ft
i-
O H •d u)=> (=•
ft
ga u>rt-
ft
•
ft
U o <* fi o68
hi
ft
rt-
rt-
TOfta hi
- •
1I
6a>4
urn
o ro
TOO 3
<
p a ~ i-j
o N=s rt
!N) 3
as
*-=> "
ti• tv
(9
cn 34
3•
o
(B
4 303*
rt-
n ft
»=n T
id
C0)
£
09
oodI—"
o 00 &* * ro robe
to
athode
i
stance
(mm)
+* T)
^ gv uni Ui -J oSpacotent
rt
an(volt
Ui UTC o gn o o5 ^ (5
ft
!_. H ^oo LO oo 00 ^ *> < a ft x4^ 0^ -v] -J 00 oo
imumctron
ergyolts)
tn yi•
ro
0*
l_l tO I—
•
s d2° ft a
o o w Ul O Q>
8 ^ §!
i—i ts) to r\> *> gn wUi ro i^-* gn o O
*~^^ ^w *> w VI V* *o
t\> 00 o^ *> o 00 Oft o i
£ 3 hT i
O o o O o oO o o o o o
|
»^ I—" (—a 1—
'
t— ^ w00 1—
•
ts) 00 sO h-.
>£> OO UH h-
<
00 o 3 pj ft
O o o o o o ^ h-4
rt-
4.
aUT Un 00 o o gn O* 0* Ui o^oo o o o O 00 »-J — to oW OH o o 00 o o O O ui w^^ <-**^ ^"^. ^^ ^^ ^^ ^^•k ^^*» ^™»* 0*™* ft Jr
1as o
o o 00 CO o o t-J o o p•
-J -vj o o^ *» o^ 00 gn oo 00 £1* < a^ ft 3•fl
*•**• **=*> »«** •«*** -*=** "*-*• -*,»-*» '—' gn ,"*«!*' 4
ft—
A
•— - - -
hi
gn £> *> *> 00 £>1—
1
to c>- nO On t—> no o o o O o •
o o o o o o1
-°
3i
CO
p1 i 1 1 1 gn1 i 1 1 ' OO
o c oon
^4—
•
wft
£>
ro t\> 1—
'
i
H o o*"
1 ^ * v
^f—• h- t—
>
H^ K >—• M«00 -o ^ gn •* oo TO
I
42


BIBLIOGRAPHY
1. L. Tonks and I. Langmuir, Phys . Rev., 33, pp. 195, 450, Feb 1929
2. K. T. Compton and I. Langmuir, Rev. Mod. Phys., 2, p 222, 1930
3. I. Langmuir and H. Mott-Smith, Gen. Elec. Rev., p. 449, Jul -Dec 1924
4. A. F. Dittmer, Phys. Rev., 28, p. 507, 1926
5. F. M. Penning, Nature, 118, p. 301, 1926
6. M. J. Druyvesteyn and N. Warmoltz, Physica, 4, p. 51, 1947
7. H. J. Merrill and H. W. Webb, Phys. Rev., 55, 1939
8. E. B. Armstrong and K. G. Emeleus , Proc. Inst. E. E. (London),
96, Pt III, No. 43, p. 390, 1949
9. A. von Engel, Ionized Gases , p. 191, Oxford Univ. Press, 1955
10. T. R. NeillandK. G. Emeleus, Proc. Royal Irish Acad. , (Dublin),53, Sect. A, No. 13, pp. 197, 219, 1951
11. R. A. Bailey and K. G. Emeleus, Proc. Royal Irish A ad. , 57,Sect. A, No. 5, p. 58, 1955
12. G. Wehner, Jour. Appl. Phy. , 21, p. 62, 1950
13. D. H. LooneyandS. C. Brown, Phys. Rev., 93, No. 5, p. 965, 1954
14. D. Bohm and E. P. Gross, Phys. Rev., 75, p. 1851, 1949; 75, p. 1864,
1949; 79, p. 992, 1950
15. A. V. Haeff, Phys. Rev., 74, p. 1532, 1948
16. G. D. Boyd, L. M. Field, and R. W. Gould, Phys. Rev., 109, No. 4,
p. 1393, 1958
17. T. K. Allen, Ph. D. Thesis, Queen's Univ. of Belfast, 1954
18. W. P. Allis, paper presented at U. R.S.I. Conf . , Boulder, Coin,, 1957
19. D. W. Mahaffey, Jour. Elec. Cont .. , 6, No. 3, 1959
20. E. S. Bidgood and G. H. Kent, Trans. Electrochem. Soc, 87,
pp. 321-329, 1945
21. J. A. FlynnandE. E. Shoults , M.S. Thesis, U. S. Naval Postgraduate School, pp. 13, 17, 1959
22. J. D. Cobine, Gaseous Conductors, McGraw-Hill Book. Co. , Inc.,p. 139, 1941
23. R. J. Stansfield and J. P. Wise, M.S. Thesis, U. S. Naval Post-graduate School, 1959
43


![Oscillations mécaniques libres non amorties Oscillations ...ww2.cnam.fr/physique/PHR004/04_L08_PHR004.pdf · Leçon n°8 : Oscillations [1] PHR 004 1 Oscillations mécaniques libres](https://img.dokumen.tips/doc/110x75/5b968ab509d3f206218b9064/oscillations-mecaniques-libres-non-amorties-oscillations-ww2cnamfrphysiquephr00404l08.jpg)