Embed Size (px)
DESCRIPTION
PLASMA INPUT AND METABOLITE FRACTION MODELS. TPCMOD0009 Models for plasma metabolite correction TPCMOD0010 Modelling input function. http://pet.utu.fi/staff/vesoik/reports/tpcmod0000.html. PLASMA METABOLITES. http://pet.utu.fi/staff/vesoik/analysis/doc/metab_corr.html. - PowerPoint PPT Presentation
Citation preview

PLASMA INPUT AND METABOLITE FRACTION
MODELS
http://pet.utu.fi/staff/vesoik/reports/tpcmod0000.html
TPCMOD0009Models for plasma metabolite correction
TPCMOD0010Modelling input function

PLASMA METABOLITES
http://pet.utu.fi/staff/vesoik/analysis/doc/metab_corr.html

MODELLING PLASMA METABOLITES: WHY?
• Removes ”noise” in the measured parent tracer fraction curve
• Interpolation of the fraction curve
• Extrapolation of the fraction curve
• Population based average metabolite correction?

MODELLING PLASMA METABOLITES: HOW?
• Linear interpolation (no modelling)
• Mathematical function fitting
• Kinetic models
http://pet.utu.fi/staff/vesoik/reports/tpcmod0009.pdf
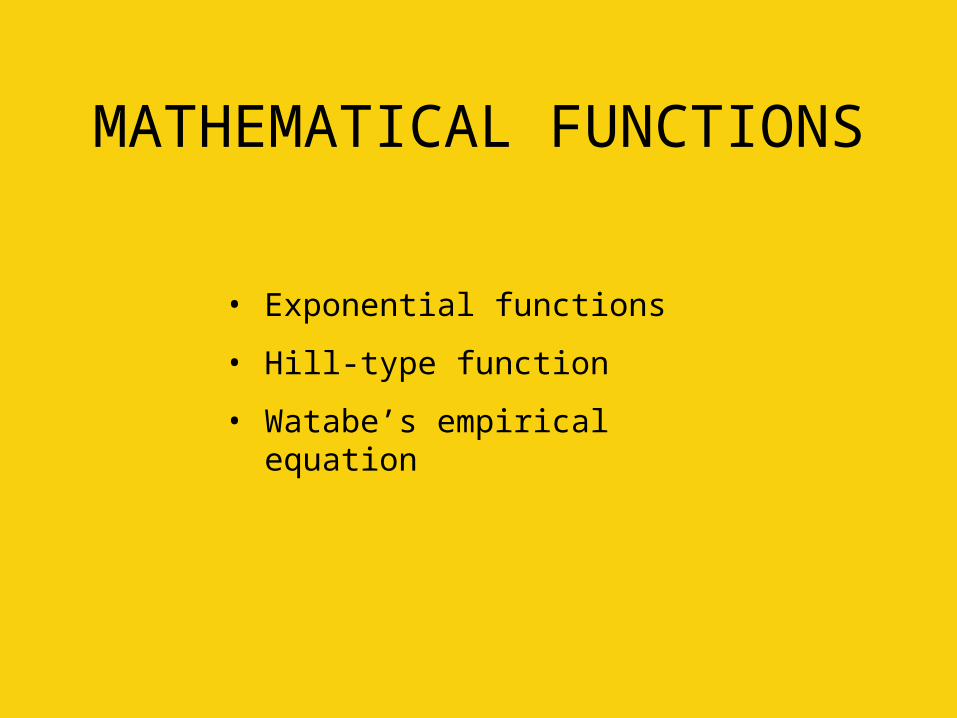
MATHEMATICAL FUNCTIONS
• Exponential functions
• Hill-type function
• Watabe’s empirical equation

Hill-type functions
0 15 30 45 60 75 900.0
0.1
0.2
0.3
0.4
0.5
0.6
0.7
0.8
0.9
1.0
Fra
ctio
n o
f au
the
ntic
[11C
]FL
B
Time (min)
t
tfMet
http://pet.utu.fi/staff/vesoik/programs/doc/fit_hill.html

KINETIC MODELS FOR PLASMA METABOLITES
• Huang et al. 1991, Reith et al. 1990, Gjedde et al. 1991
• Carson et al. 1997
• Models for [15O]O2: Huang et al. 1991, Iida et al. 1993
http://pet.utu.fi/staff/vesoik/reports/tpcmod0009.pdf

Huang’s plasma metabolite model
http://pet.utu.fi/staff/vesoik/reports/tpcmod0009_app_a.pdf
C0PARENT
C1MET1 C2MET1K01
k21
k12
C3MET2 C4MET2K03
k43
k34
PLASMA

Extended Carson’s plasma metabolite model
http://pet.utu.fi/staff/vesoik/reports/tpcmod0009_app_b.pdf
Cpa Cta
Ctm
K1a
k2a
k3
CpmK1m
k2m
PLASMA

New plasma metabolite model
http://pet.utu.fi/staff/vesoik/reports/tpcmod0009_app_c.pdf
Cpa
Ct1m
Ct2m
km
Cpmk3m
k4m
PLASMA
k1m
k2m
TISSUE

KINETIC PLASMA METABOLITE MODELS MAY
FAIL IF:
• Noise in measured plasma or blood curve
• Missing plasma samples during tracer infusion

MODELLING PLASMA CURVE: WHY?
• Removes noise
• Interpolation
• Extrapolation
• Reduces bias caused by missing samples
• Population based curve applying few late-time venous samples

MODELLING PLASMA CURVE: HOW?
• Linear interpolation (no modelling)
• Spline fitting
• Mathematical function fitting
• Kinetic models
http://pet.utu.fi/staff/vesoik/reports/tpcmod0010.pdf

MATHEMATICAL FUNCTIONS
• Sum of exponential functions
• Thompson and Golish bolus input function
• Gamma variate function
• Feng et al. (based on compartmental models)
http://pet.utu.fi/staff/vesoik/reports/tpcmod0010.pdf
http://pet.utu.fi/staff/vesoik/programs/doc/fit_feng.html

Examples of Thompson’s function with asymptotic recirculation term by Golish et al.
0 50 100 150 200
0.0
0.2
0.4
0.6
0.8
1.0
/exp1exp)1exp(
)( 000
0max ttCtt
ttCtC p

KINETIC MODELS FOR PLASMA CURVE
• Feng et al. 1993
• Graham 1997

GRAHAM’S MODEL
Vp
Vt
Vi
Bolus or Infusion
Renal loss
PS1
PS2
Vp
Vt
Vi
Bolus or Infusion
Renal loss
PS1
PS2
Vc
PS3
http://pet.utu.fi/staff/vesoik/reports/tpcmod0010_app_a.pdf

GRAHAM’S MODEL FOR PLASMA CURVE AND
A METABOLITE
http://pet.utu.fi/staff/vesoik/reports/tpcmod0010_app_b.pdf
Vpa
Vta
Via
Bolus or Infusion
PS1a
PS2a
GFRa
Vpm
Vtm
VimPS1m
PS2m
GFRm
MR1
MR2
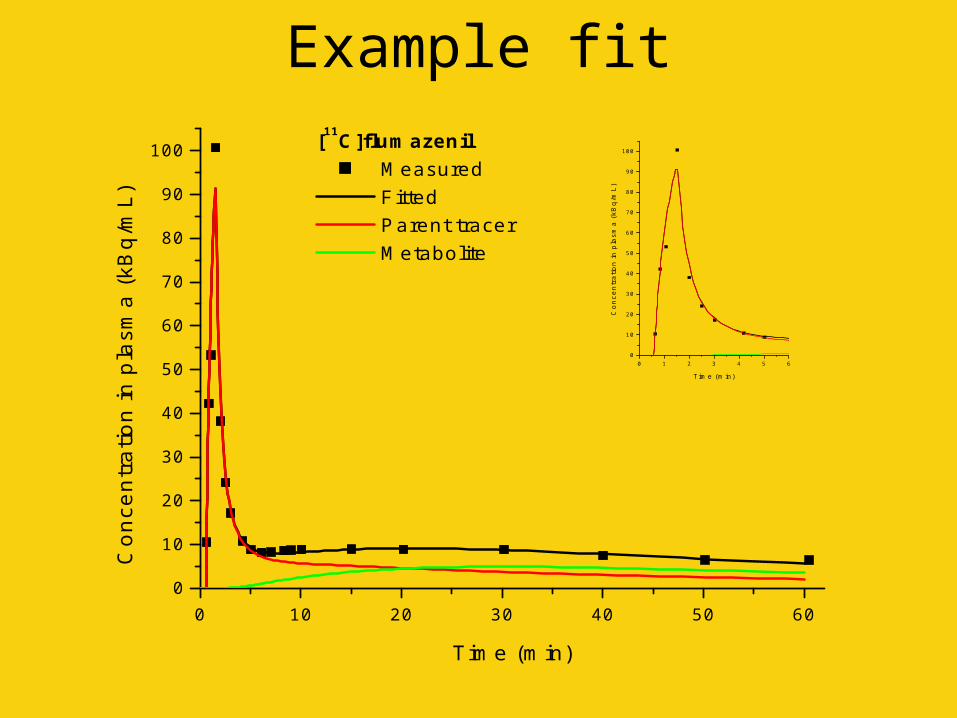
Example fit
0 10 20 30 40 50 600
10
20
30
40
50
60
70
80
90
100
0 1 2 3 4 5 60
10
20
30
40
50
60
70
80
90
100
Co
nce
ntr
atio
n in
pla
sma
(kB
q/m
L)
Time (min)
Con
cent
ratio
n in
pla
sma
(kB
q/m
L)
Time (min)
[11C]flumazenil Measured Fitted Parent tracer Metabolite

Example fit (cont.)
0 10 20 30 40 50 600.0
0.1
0.2
0.3
0.4
0.5
0.6
0.7
0.8
0.9
1.0F
ract
ion
of [11
C]fl
umaz
enil
Time (min)
Measured fractions Fitted with extended Graham model Fitted with Hill-type function

PROBLEMS
• Model contains up to 18 parameters
• Difficult to weight metabolite fractions in relation to plasma
• Peak is not fitted well: may need a constraint
• Fast metabolism: are the first measured fractions correct?