Embed Size (px)
Citation preview

PlantGSEA: a gene set enrichment analysis toolkitfor plant communityXin Yi1, Zhou Du2,* and Zhen Su1,*
1State Key Laboratory of Plant Physiology and Biochemistry, College of Biological Sciences, China AgriculturalUniversity, Beijing 100193, China and 2Department of Bioinformatics, School of Life Sciences and Technology,Tongji University, 1239 Siping Road, Shanghai 200092, China
Received January 28, 2013; Revised March 29, 2013; Accepted March 31, 2013
ABSTRACT
Gene Set Enrichment Analysis (GSEA) is a powerfulmethod for interpreting biological meaning of a listof genes by computing the overlaps with variouspreviously defined gene sets. As one of the mostwidely used annotations for defining gene sets,Gene Ontology (GO) system has been used inmany enrichment analysis tools. EasyGO andagriGO, two GO enrichment analysis toolkits de-veloped by our laboratory, have gained extensiveusage and citations since their releases becauseof their effective performance and consistent main-tenance. Responding to the increasing demands ofmore comprehensive analysis from the users, wedeveloped a web server as an important componentof our bioinformatics analysis toolkit, namedPlantGSEA, which is based on GSEA method andmainly focuses on plant organisms. In PlantGSEA,20 290 defined gene sets deriving from different re-sources were collected and used for GSEA analysis.The PlantGSEA currently supports gene locus IDsand Affymatrix microarray probe set IDs from fourplant model species (Arabidopsis thaliana, Oryzasativa, Zea mays and Gossypium raimondii). ThePlantGSEA is an efficient and user-friendly webserver, and now it is publicly accessible at http://structuralbiology.cau.edu.cn/PlantGSEA.
INTRODUCTION
Recent revolution in sequencing technology leads to ever-increasing high-throughput data, and the tremendousrepository of publicly available data becomes an invalu-able treasure. Meanwhile, the novelty and complexity ofexploiting these data highlighted the challenges in compu-tational analysis and knowledge mining. One of thepopular methods is Gene Set Enrichment Analysis
(GSEA) (1), which is a promising method to interpret bio-logical meaning by calculating the overlaps between therequested gene lists and various previously defined genesets, and the gene lists can be derived from high-through-put experiments like microarray or next-generationsequencing. Gene Ontology (GO) system (2) is a popularannotation system for defining gene set on which manytools were developed toward different groups of users inthe scientific community. EasyGO (3) and agriGO (4), twoGO enrichment analysis tools developed by our labora-tory, focus on agricultural organisms and have accom-plished >25 000 and >60 000 analysis requests fromusers around the world, respectively. During the processof maintaining these tools, we realized that the coverage ofGO annotated genes is limited because of their predictionmethod and systematic structure, whereas GSEA analysisturns out to be a method that can broaden the scope ofdata set and make up the deficiency of GO. Thus, to meetthe increasing requirements of more comprehensiveanalysis, we developed a newly designed web servernamed PlantGSEA implementing GSEA analysis forplant species.
So far, we collected 20 290 gene sets deriving from fourdifferent types of resources, including (i) well-recognizedannotation systems, such as GO (2) and KyotoEncyclopedia of Genes and Genomes (KEGG) (5), (ii)public databases, such as TAIR (6) and RGAP (7), (iii)published literatures, and (iv) computational predictionsusing existed tools, for example, miRNA target predictionresults. Notably, we manually collected many gene setsfrom literatures and considered them as valuabletreasure for the enrichment analysis in terms of theirhigh accuracy and reliability.
The PlantGSEA analysis supports both gene locus IDsand Affymatrix microarray probe set IDs as input query,and it gives users a comprehensive analysis report, whichcan be explored and downloaded freely. Some newfeatures have been added to extend the functionality ofthe PlantGSEA. For example, we provided a hierarchyvisualization tool by which significantly enriched gene
*To whom correspondence should be addressed. Tel: +86 10 62731380; Fax: +86 10 62731380; Email: [email protected] may also be addressed to Zhou Du. Tel: +86 21 65981195; Fax: +86 21 65981195; Email: [email protected]
W98–W103 Nucleic Acids Research, 2013, Vol. 41, Web Server issue Published online 30 April 2013doi:10.1093/nar/gkt281
� The Author(s) 2013. Published by Oxford University Press.This is an Open Access article distributed under the terms of the Creative Commons Attribution License (http://creativecommons.org/licenses/by/3.0/), whichpermits unrestricted reuse, distribution, and reproduction in any medium, provided the original work is properly cited.
by guest on July 4, 2013http://nar.oxfordjournals.org/
Dow
nloaded from

sets can be selected for a hierarchy analysis(Supplementary Figure S1). Based on that, users candecrease the number of total gene sets and then paymore focus on interesting ones and achieve a better under-standing of relationships among different biologicalprocesses. A treeview-like navigation interface is alsoprovided for gene sets exploration. Users can browse allthe gene sets grouped by their sources and functions in onespecies. Collected gene sets in PlantGSEA are availablefor downloading in tab-separated text to facilitaterelevant researchers. Last but not the least, a conversiontool, which can convert among gene locus, gene symboland Affymatrix probe set, was developed to extend thediversity of input type in PlantGSEA.
WEB SERVER CONSTRUCTION
Gene sets collection and preparation
To provide a comprehensive analysis, we collected>20 000 gene sets of four plant model organisms includingArabidopsis, rice, maize and cotton from various re-sources. We grouped the gene sets into four categories,GO-related gene sets, gene family-based gene sets,curated gene sets and motif information-based gene setson the basis of their characteristics. A statistical summaryof collected gene sets in each category is presented inTable 1.
First, GO-based gene sets are most widely used in theGSEA, and we downloaded them from related annotationdatabases, including TAIR (6), MSU rice (7) andPhytozome (9). The GO gene sets are re-computed tocover every GO term and are prepared as gene set anno-tation files. Plant Ontology (PO), a controlled vocabularydescribing plants’ anatomy and morphology and
development, was collected from Plant OntologyConsortium (14).A gene family means a set of genes formed by duplica-
tion of a single original gene, and generally, genes in onegene family share similar biochemical function. We col-lected all gene families of Arabidopsis and rice from TAIRand MSU, respectively, and included them as gene family-based gene sets category. Additionally, we collected tran-scription factor families from PlnTFDB (11) and theubiquitin proteasome system-related gene families fromplantUPS (13).Third, we included gene sets derived from KEGG
database (5), PlantCyc (8) and literatures as curated genesets. We manually collected gene sets from published refer-ences and the AraPath database (10). In aim to clarify thegene sets, we named these gene sets based on the descriptionin the references. For example, a set of genes co-expressedwith OsWRKY22 that plays a role in the resistanceresponse to blast was named as ‘ABBRUSCATO_CO-EXPRESSED_WITH_OSWRKY22_RESISTANCE_TO_BLAST’ beginning with the author’s name, and similarly,‘COUDERT_CRL1_CROWN_ROOT_DEVELOPMEN-T_UP’ means a list of upregulated genes in crown rootless1mutant (CRL1) associated with crown root development(15,16). Additional information, including a brief descrip-tion of the gene set, a PubMed ID, abstract, authors andtheir affiliation and a link of publication, was also gatheredand accessible in PlantGSEA. Till now, >1100 gene setsfrom 245 references were collected and used for theGSEA analysis, and we are committed to update ourgene sets regularly in the future.Finally, for the motif information-based gene sets,
we included transcription factor targets and microRNAtargets of Arabidopsis obtained from AraPath databaseand predicted microRNA targets of rice using thesame approach as in our plant microRNA database(PMRD) (12).By adopting annotations from diverse resources, we
found that the proportion of annotated genes increasedin a promising way comparing with of single GO annota-tion (Supplementary Table S1). In Arabidopsis and rice,the coverage of all genes increased from 79 to 91% and 32to 63%, respectively. In cotton and maize, the proportionincreased from 65 to 72% and 39 to 48%, respectively.Overall, the substantial increase of annotation coverageproved the advantage of the GSEA concept that guaranteea better understanding of biological meaning in the enrich-ment analysis.
Data processing
The PlantGSEA is an easy-to-use web server that users areonly required to submit a list of genes for the enrichmentanalysis. Users can choose different background as refer-ence, either a pre-calculated background covering wholegenome or a customized background provided by users.Both gene locus ID and probe set ID are supported byPlantGSEA. The PlantGSEA provided three statisticaltests for the analysis including hypergeometric test,Fisher’s exact test and �2 test. A statistical formula of
Table 1. Total numbers and sources of categorized gene sets in four
comprehensively annotated species
Organism Category Number ofgene sets
Source
Arabidopsisthaliana
GO gene sets 7041 TAIR (6)Gene family-based
gene sets1018 TAIR/PlantUPS (13)
Curated gene sets 1806 AraPath (10)/literature
Motif gene sets 764 AraPathOryza sativa GO gene sets 2782 AgriGO (4)
Gene family-basedgene sets
118 RGAP (7)/PlantUPS
Curated gene sets 740 Gramene (8)/KEGG (5)/POC(14)/literature
Motif gene sets 2566 Prediction fromPMRD(12)
Zea mays GO gene sets 1790 AgriGOGene family-based
gene sets81 PlnTFDB (11)/
PlantUPSCurated gene sets 410 Gramene/literature
Gossypiumraimondii
GO gene sets 6764 Phytozome (9)Curated gene sets 2315 Phytozome/literature
Nucleic Acids Research, 2013, Vol. 41,Web Server issue W99
by guest on July 4, 2013http://nar.oxfordjournals.org/
Dow
nloaded from
default method, Fisher’s exact test, is displayed as follows:
P ¼
nk
� �N� nK� k
� �
NK
� � :
In the formula, N is the total number of one organism’sall genes or of the user-provided background, n is thenumber of genes in the query list, K means the totalnumber of genes in one gene set and k stands for the numberof overlapped genes. Multiple test correction is performedbecause of the large number of our collected gene sets andto alleviate possible false-positive rate. We provide sixmultiple test correction methods in PlantGSEA, includingYekutieli, Bonferroni, Hochberg, Hochberg, Hommel andHolm. We get all the adjusted P-values after performingfalse discovery rate correction and display the most signifi-cantly enriched gene sets using a cut-off selection.
Implementation
The PlantGSEA is constructed on a Dell Server with RedHat Enterprise Release 5.2 operating system. Analysiscodes are compiled with Python (www.python.org), andthe web interface is supported by PHP scripts (www.php.net). We used R software (www.r-project.org) for statis-tical analysis and the dot program of Graphviz software(www.graphviz.org) for generating hierarchy charts. Nosoftware or plug-in is needed to install, as the tool isweb-based. The users are free to access the analysisresults with a given job session after the submission ofthe job, and we will keep the user’s records for 3 monthsfor their retrieving.
SAMPLE TEST AND RESULTS ANALYSIS
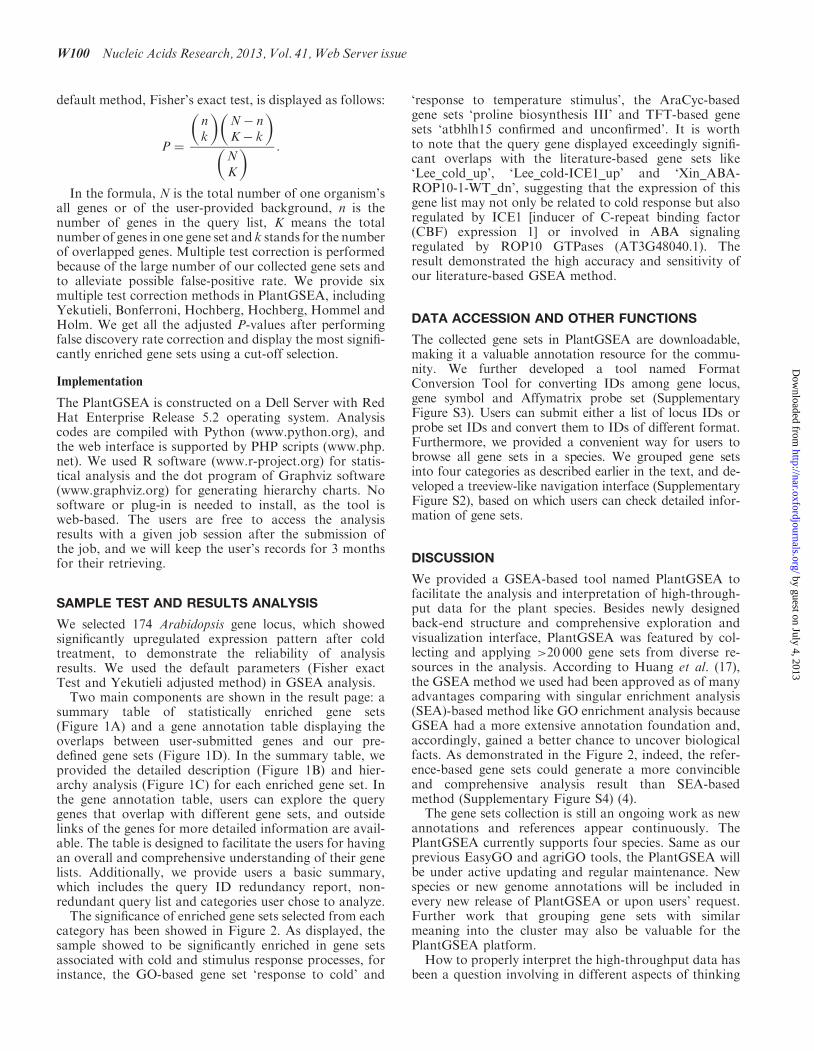
We selected 174 Arabidopsis gene locus, which showedsignificantly upregulated expression pattern after coldtreatment, to demonstrate the reliability of analysisresults. We used the default parameters (Fisher exactTest and Yekutieli adjusted method) in GSEA analysis.Two main components are shown in the result page: a
summary table of statistically enriched gene sets(Figure 1A) and a gene annotation table displaying theoverlaps between user-submitted genes and our pre-defined gene sets (Figure 1D). In the summary table, weprovided the detailed description (Figure 1B) and hier-archy analysis (Figure 1C) for each enriched gene set. Inthe gene annotation table, users can explore the querygenes that overlap with different gene sets, and outsidelinks of the genes for more detailed information are avail-able. The table is designed to facilitate the users for havingan overall and comprehensive understanding of their genelists. Additionally, we provide users a basic summary,which includes the query ID redundancy report, non-redundant query list and categories user chose to analyze.The significance of enriched gene sets selected from each
category has been showed in Figure 2. As displayed, thesample showed to be significantly enriched in gene setsassociated with cold and stimulus response processes, forinstance, the GO-based gene set ‘response to cold’ and
‘response to temperature stimulus’, the AraCyc-basedgene sets ‘proline biosynthesis III’ and TFT-based genesets ‘atbhlh15 confirmed and unconfirmed’. It is worthto note that the query gene displayed exceedingly signifi-cant overlaps with the literature-based gene sets like‘Lee_cold_up’, ‘Lee_cold-ICE1_up’ and ‘Xin_ABA-ROP10-1-WT_dn’, suggesting that the expression of thisgene list may not only be related to cold response but alsoregulated by ICE1 [inducer of C-repeat binding factor(CBF) expression 1] or involved in ABA signalingregulated by ROP10 GTPases (AT3G48040.1). Theresult demonstrated the high accuracy and sensitivity ofour literature-based GSEA method.
DATA ACCESSION AND OTHER FUNCTIONS
The collected gene sets in PlantGSEA are downloadable,making it a valuable annotation resource for the commu-nity. We further developed a tool named FormatConversion Tool for converting IDs among gene locus,gene symbol and Affymatrix probe set (SupplementaryFigure S3). Users can submit either a list of locus IDs orprobe set IDs and convert them to IDs of different format.Furthermore, we provided a convenient way for users tobrowse all gene sets in a species. We grouped gene setsinto four categories as described earlier in the text, and de-veloped a treeview-like navigation interface (SupplementaryFigure S2), based on which users can check detailed infor-mation of gene sets.
DISCUSSION
We provided a GSEA-based tool named PlantGSEA tofacilitate the analysis and interpretation of high-through-put data for the plant species. Besides newly designedback-end structure and comprehensive exploration andvisualization interface, PlantGSEA was featured by col-lecting and applying >20 000 gene sets from diverse re-sources in the analysis. According to Huang et al. (17),the GSEA method we used had been approved as of manyadvantages comparing with singular enrichment analysis(SEA)-based method like GO enrichment analysis becauseGSEA had a more extensive annotation foundation and,accordingly, gained a better chance to uncover biologicalfacts. As demonstrated in the Figure 2, indeed, the refer-ence-based gene sets could generate a more convincibleand comprehensive analysis result than SEA-basedmethod (Supplementary Figure S4) (4).
The gene sets collection is still an ongoing work as newannotations and references appear continuously. ThePlantGSEA currently supports four species. Same as ourprevious EasyGO and agriGO tools, the PlantGSEA willbe under active updating and regular maintenance. Newspecies or new genome annotations will be included inevery new release of PlantGSEA or upon users’ request.Further work that grouping gene sets with similarmeaning into the cluster may also be valuable for thePlantGSEA platform.
How to properly interpret the high-throughput data hasbeen a question involving in different aspects of thinking
W100 Nucleic Acids Research, 2013, Vol. 41, Web Server issue
by guest on July 4, 2013http://nar.oxfordjournals.org/
Dow
nloaded from
Figure
1.Theresult
pagein
PlantG
SEA.(A
)A
summary
table
displayed
enriched
genesets
with
sixcolumns:
genesetnames,abrief
description,thecategory
ofthegeneset,
thenum-
ber
ofoverlapbetweenqueriedgenes
andthegeneset,P-valueofstatisticaltest
andadjusted
P-valueafter
theFalseDiscoveryRate
(FDR)correction.(B
)Detailinform
ationabouttheselected
geneset,includinggenesetname,
brief
andfulldescription,contributor’sinform
ationandoverlapped
genes.(C
)Theenriched
genesets
displayed
inthehierarchicalpattern.Thecolorshowed
the
significance
ofageneset.(D
)Anannotationtable
representedthegeneset-basedannotationofquerygenes.Genesets
andqueriedgenes
canbefurther
exploredfordetailinform
ationbyclicking
thelinks.
Nucleic Acids Research, 2013, Vol. 41, Web Server issue W101
by guest on July 4, 2013http://nar.oxfordjournals.org/
Dow
nloaded from

and different analytical methods. Our series of analysistoolkit, EasyGO, agriGO and PlantGSEA contribute touncovering facts from the data by calculating the enrich-ment gene ontology or gene sets within the query genelists. The future work will lie in the integrative analysisof different types of data, for example, chromatinimmunoprecipitation followed by high-throughputsequencing (ChIP-seq) data, DNaseI hypersensitive sitessequencing (DNase-seq) data and mutation informationand so forth. It is conceivable that our toolkit seriestogether with other analytical tools may shed light on re-vealing the multifaceted relationship and the regulatorymechanisms of genes in plants.In summary, the PlantGSEA is a comprehensive and
easy-to-use GSEA-based web server in aim to serveplant research community, and we believe a largeamount of researchers will benefit from it.
SUPPLEMENTARY DATA
Supplementary Data are available at NAR Online:Supplementary Table 1 and Supplementary Figures 1–4.
ACKNOWLEDGEMENTS
The authors thank Ms Wenying Xu for her constructivecomments and valuable suggestions. They thank ZhenhaiZhang for data collection.
FUNDING
Funding for open access charge: The Ministry of Scienceand Technology of China [31071125 and 31171276];Ministry of Education of China [NCET-09-0735].
Conflict of interest statement. None declared.
REFERENCES
1. Subramanian,A., Tamayo,P., Mootha,V.K., Mukherjee,S.,Ebert,B.L., Gillette,M.A., Paulovich,A., Pomeroy,S.L.,Golub,T.R., Lander,E.S. et al. (2005) Gene set enrichmentanalysis: a knowledge-based approach for interpreting genome-wide expression profiles. Proc. Natl Acad. Sci. USA, 102,15545–15550.
2. Ashburner,M., Ball,C.A., Blake,J.A., Botstein,D., Butler,H.,Cherry,J.M., Davis,A.P., Dolinski,K., Dwight,S.S., Eppig,J.T.et al. (2000) Gene ontology: tool for the unification of biology.The Gene Ontology Consortium. Nat. Genet., 25, 25–29.
3. Zhou,X. and Su,Z. (2007) EasyGO: Gene Ontology-basedannotation and functional enrichment analysis tool foragronomical species. BMC Genomics, 8, 246.
4. Du,Z., Zhou,X., Ling,Y., Zhang,Z. and Su,Z. (2010) agriGO: aGO analysis toolkit for the agricultural community. Nucleic AcidsRes., 38, W64–W70.
5. Wixon,J. and Kell,D. (2000) The Kyoto encyclopedia of genesand genomes–KEGG. Yeast, 17, 48–55.
6. Swarbreck,D., Wilks,C., Lamesch,P., Berardini,T.Z., Garcia-Hernandez,M., Foerster,H., Li,D., Meyer,T., Muller,R., Ploetz,L.et al. (2008) The Arabidopsis Information Resource (TAIR): genestructure and function annotation. Nucleic Acids Res., 36,D1009–D1014.
Figure 2. A Bar chart of significantly enriched gene sets in different categories. These terms were selected from significantly enriched gene sets(FDR< 0.05). The y-axis represented the value of log10-converted adjusted P-value. The x-axis displayed the gene sets name. Gene sets belonging todifferent categories were marked with different colors. GO, gene ontology; PO, plant ontology; TFT, transcription factor target; FDR, FalseDiscovery Rate.
W102 Nucleic Acids Research, 2013, Vol. 41, Web Server issue
by guest on July 4, 2013http://nar.oxfordjournals.org/
Dow
nloaded from
7. Ouyang,S., Zhu,W., Hamilton,J., Lin,H., Campbell,M., Childs,K.,Thibaud-Nissen,F., Malek,R.L., Lee,Y., Zheng,L. et al. (2007)The TIGR Rice Genome Annotation Resource: improvementsand new features. Nucleic Acids Res., 35, D883–D887.
8. Liang,C., Jaiswal,P., Hebbard,C., Avraham,S., Buckler,E.S.,Casstevens,T., Hurwitz,B., McCouch,S., Ni,J., Pujar,A. et al.(2008) Gramene: a growing plant comparative genomics resource.Nucleic Acids Res., 36, D947–D953.
9. Goodstein,D.M., Shu,S., Howson,R., Neupane,R., Hayes,R.D.,Fazo,J., Mitros,T., Dirks,W., Hellsten,U., Putnam,N. et al. (2012)Phytozome: a comparative platform for green plant genomics.Nucleic Acids Res., 40, D1178–D1186.
10. Lai,L., Liberzon,A., Hennessey,J., Jiang,G., Qi,J., Mesirov,J.P.and Ge,S.X. (2012) AraPath: a knowledgebase for pathwayanalysis in Arabidopsis. Bioinformatics, 28, 2291–2292.
11. Perez-Rodriguez,P., Riano-Pachon,D.M., Correa,L.G.,Rensing,S.A., Kersten,B. and Mueller-Roeber,B. (2010) PlnTFDB:updated content and new features of the plant transcriptionfactor database. Nucleic Acids Res., 38, D822–D827.
12. Zhang,Z., Yu,J., Li,D., Liu,F., Zhou,X., Wang,T., Ling,Y. andSu,Z. (2010) PMRD: plant microRNA database. Nucleic AcidsRes., 38, D806–D813.
13. Du,Z., Zhou,X., Li,L. and Su,Z. (2009) plantsUPS: adatabase of plants’ Ubiquitin Proteasome System. BMCGenomics, 10, 227.
14. Avraham,S., Tung,C.W., Ilic,K., Jaiswal,P., Kellogg,E.A.,McCouch,S., Pujar,A., Reiser,L., Rhee,S.Y., Sachs,M.M. et al.(2008) The Plant Ontology Database: a community resourcefor plant structure and developmental stages controlledvocabulary and annotations. Nucleic Acids Res., 36,D449–D454.
15. Abbruscato,P., Nepusz,T., Mizzi,L., Del Corvo,M., Morandini,P.,Fumasoni,I., Michel,C., Paccanaro,A., Guiderdoni,E.,Schaffrath,U. et al. (2012) OsWRKY22, a monocot WRKY gene,plays a role in the resistance response to blast. Mol. PlantPathol., 13, 828–841.
16. Coudert,Y., Bes,M., Le,T.V., Pre,M., Guiderdoni,E. andGantet,P. (2011) Transcript profiling of crown rootless1 mutantstem base reveals new elements associated with crown rootdevelopment in rice. BMC Genomics, 12, 387.
17. Huang da,W., Sherman,B.T. and Lempicki,R.A. (2009)Bioinformatics enrichment tools: paths toward the comprehensivefunctional analysis of large gene lists. Nucleic Acids Res., 37,1–13.
Nucleic Acids Research, 2013, Vol. 41, Web Server issue W103
by guest on July 4, 2013http://nar.oxfordjournals.org/
Dow
nloaded from


![A Comprehensive Toolkit for Inducible, Cell Type-Specific Gene … · A Comprehensive Toolkit for Inducible, Cell Type-Specific Gene Expression in Arabidopsis1 [CC-BY] Ann-Kathrin](https://img.dokumen.tips/doc/110x75/60b7c27ed2931f72db3927c9/a-comprehensive-toolkit-for-inducible-cell-type-specific-gene-a-comprehensive-toolkit.jpg)