Embed Size (px)
Citation preview
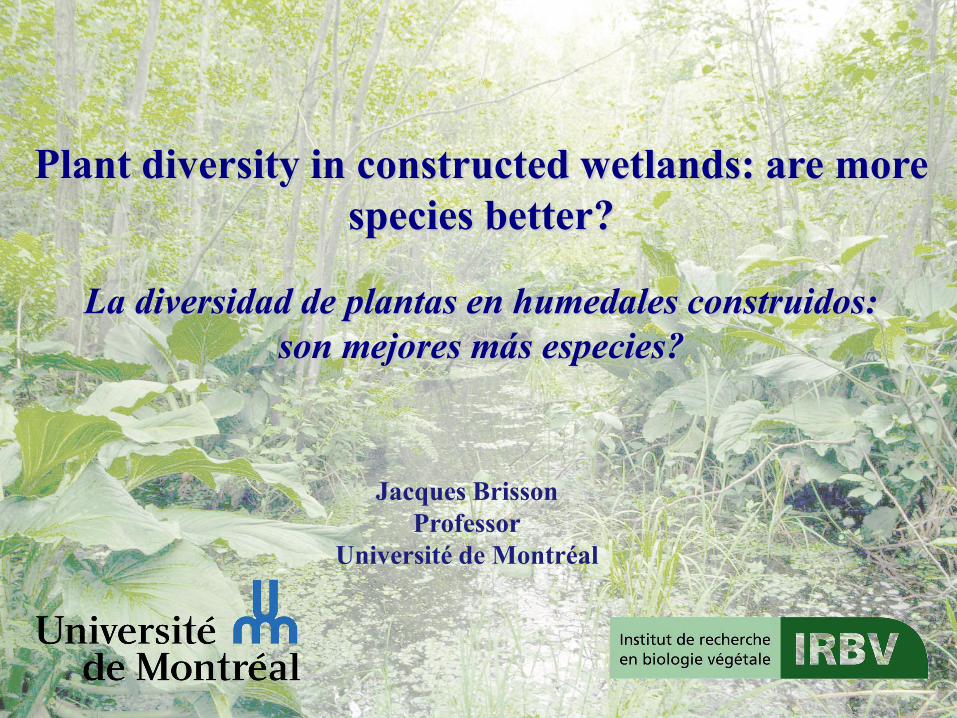
Plant diversity in constructed wetlands: are more
species better?
La diversidad de plantas en humedales construidos:
son mejores más especies?
Jacques Brisson
Professor
Université de Montréal
Source: avrotor.blogspot.com.ar
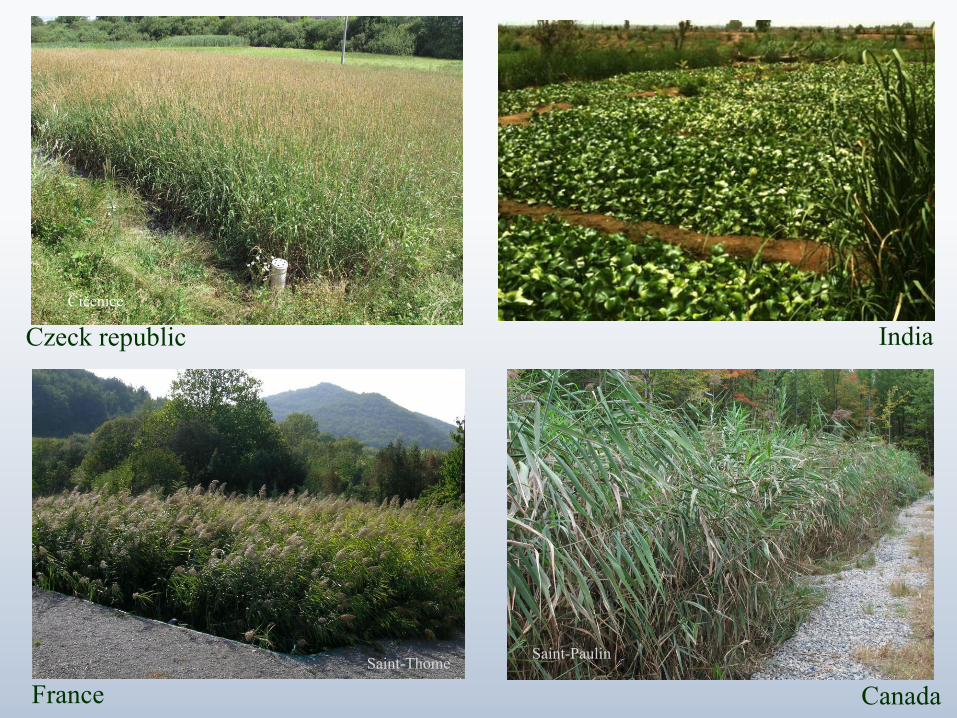
India Czeck republic
Canada France
Saint-Thome
Čičenice
Saint-Paulin
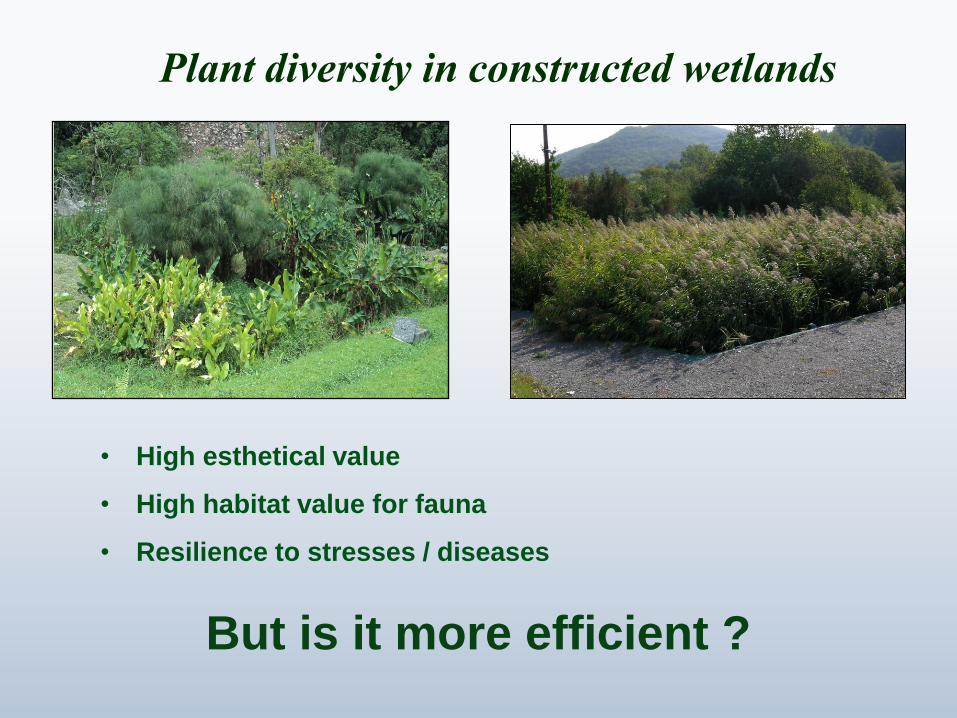
Plant diversity in constructed wetlands
• High esthetical value
• High habitat value for fauna
• Resilience to stresses / diseases
But is it more efficient ?
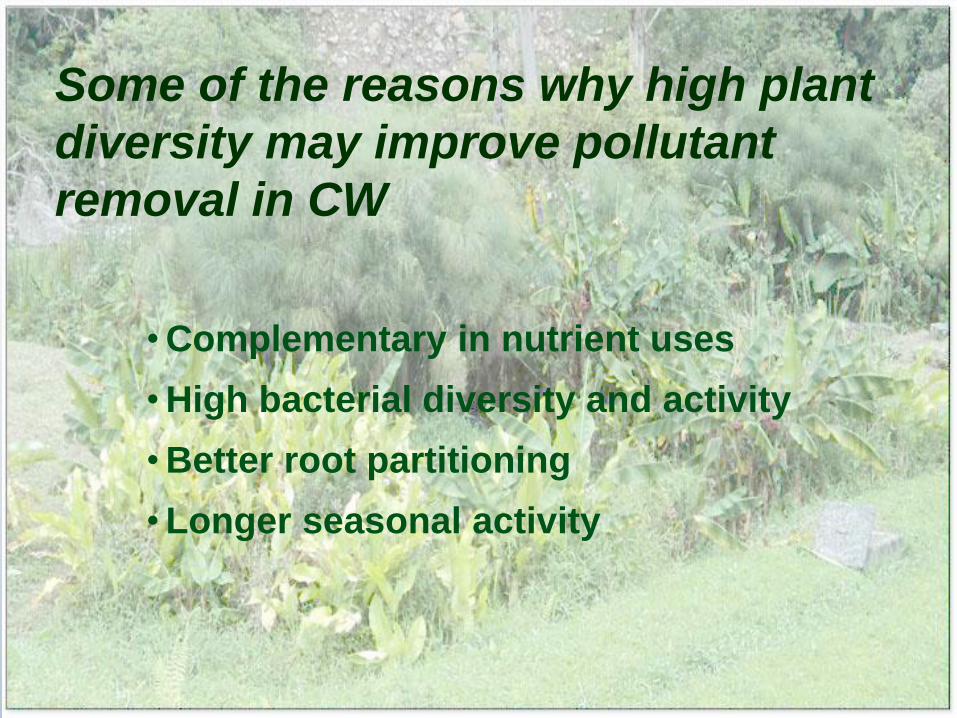
•Complementary in nutrient uses
•High bacterial diversity and activity
•Better root partitioning
•Longer seasonal activity
Some of the reasons why high plant
diversity may improve pollutant
removal in CW
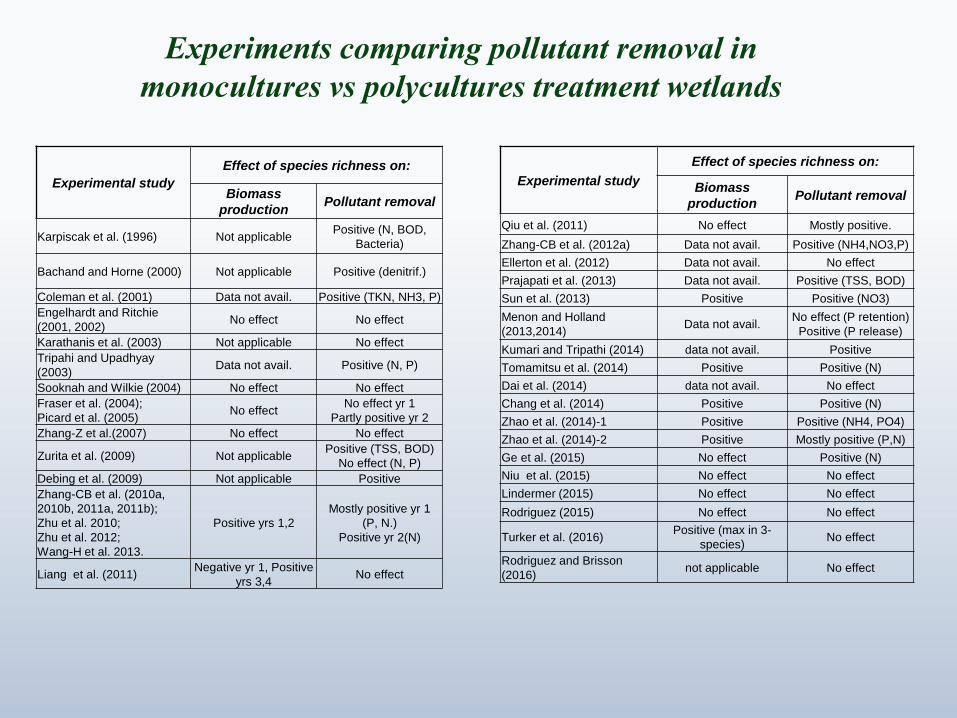
Experimental study
Effect of species richness on:
Biomass
production Pollutant removal
Karpiscak et al. (1996) Not applicable Positive (N, BOD,
Bacteria)
Bachand and Horne (2000) Not applicable Positive (denitrif.)
Coleman et al. (2001) Data not avail. Positive (TKN, NH3, P)
Engelhardt and Ritchie
(2001, 2002) No effect No effect
Karathanis et al. (2003) Not applicable No effect
Tripahi and Upadhyay
(2003) Data not avail. Positive (N, P)
Sooknah and Wilkie (2004) No effect No effect
Fraser et al. (2004);
Picard et al. (2005) No effect
No effect yr 1
Partly positive yr 2
Zhang-Z et al.(2007) No effect No effect
Zurita et al. (2009) Not applicable Positive (TSS, BOD)
No effect (N, P)
Debing et al. (2009) Not applicable Positive
Zhang-CB et al. (2010a,
2010b, 2011a, 2011b);
Zhu et al. 2010;
Zhu et al. 2012;
Wang-H et al. 2013.
Positive yrs 1,2
Mostly positive yr 1
(P, N.)
Positive yr 2(N)
Liang et al. (2011) Negative yr 1, Positive
yrs 3,4 No effect
Experimental study
Effect of species richness on:
Biomass
production Pollutant removal
Qiu et al. (2011) No effect Mostly positive.
Zhang-CB et al. (2012a) Data not avail. Positive (NH4,NO3,P)
Ellerton et al. (2012) Data not avail. No effect
Prajapati et al. (2013) Data not avail. Positive (TSS, BOD)
Sun et al. (2013) Positive Positive (NO3)
Menon and Holland
(2013,2014) Data not avail.
No effect (P retention)
Positive (P release)
Kumari and Tripathi (2014) data not avail. Positive
Tomamitsu et al. (2014) Positive Positive (N)
Dai et al. (2014) data not avail. No effect
Chang et al. (2014) Positive Positive (N)
Zhao et al. (2014)-1 Positive Positive (NH4, PO4)
Zhao et al. (2014)-2 Positive Mostly positive (P,N)
Ge et al. (2015) No effect Positive (N)
Niu et al. (2015) No effect No effect
Lindermer (2015) No effect No effect
Rodriguez (2015) No effect No effect
Turker et al. (2016) Positive (max in 3-
species) No effect
Rodriguez and Brisson
(2016) not applicable No effect
Experiments comparing pollutant removal in
monocultures vs polycultures treatment wetlands
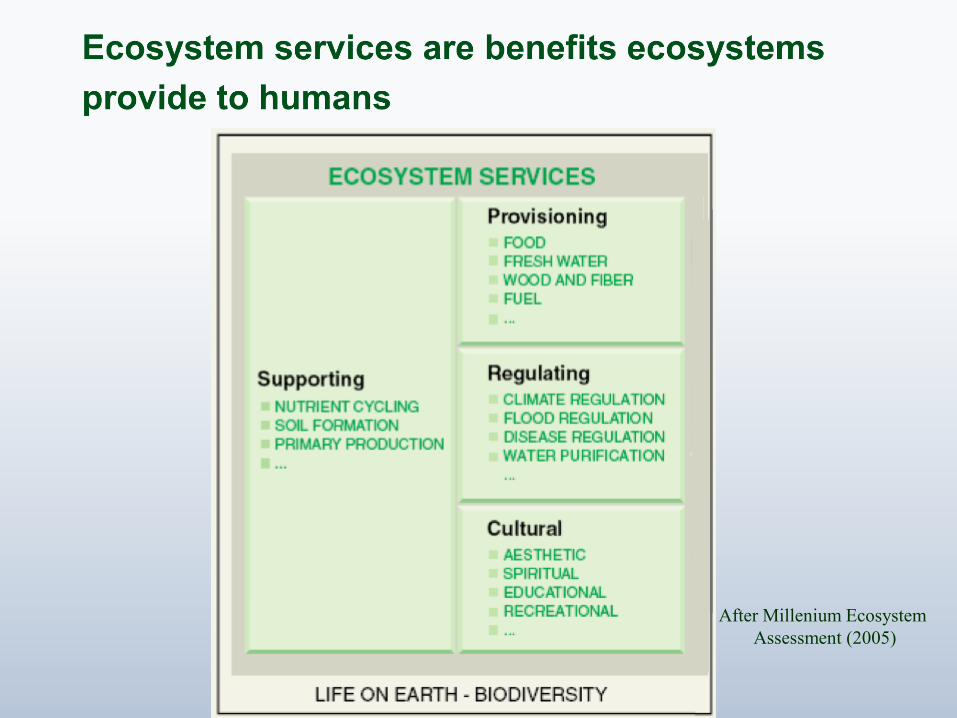
After Millenium Ecosystem
Assessment (2005)
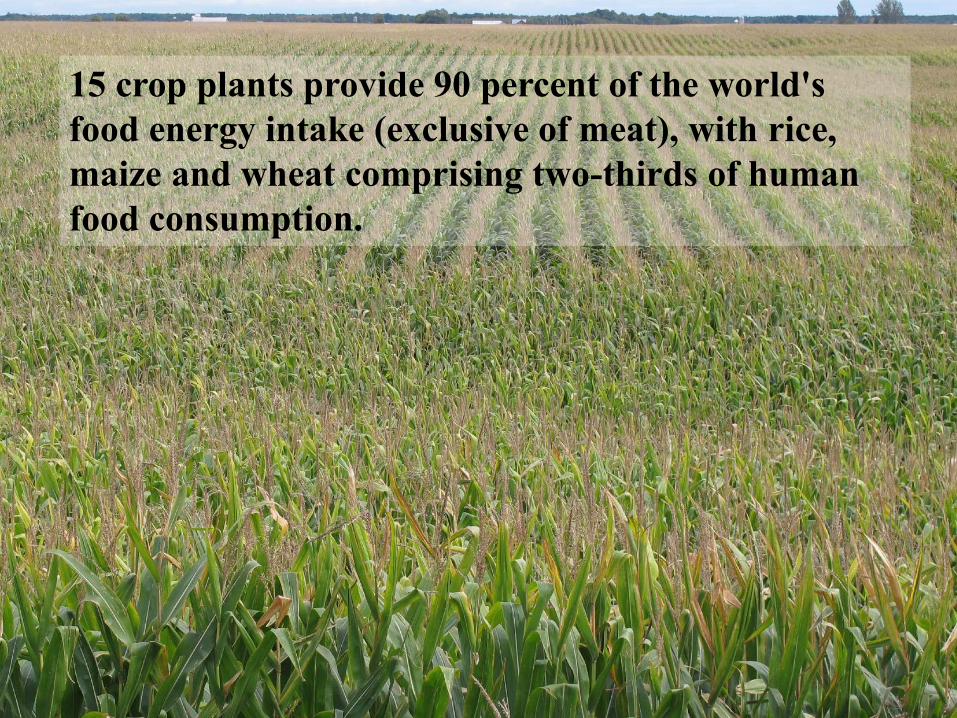
15 crop plants provide 90 percent of the world's
food energy intake (exclusive of meat), with rice,
maize and wheat comprising two-thirds of human
food consumption.
What are the consequences of
biodiversity loss for ecosystem
functioning, for the provision
of ecosystem services, and for
human well being ?
10
Outline
• Experimental studies on biodiversity
and ecosystem services
• Constructed wetland: a special case
• Review of published experiments in
constructed wetlands
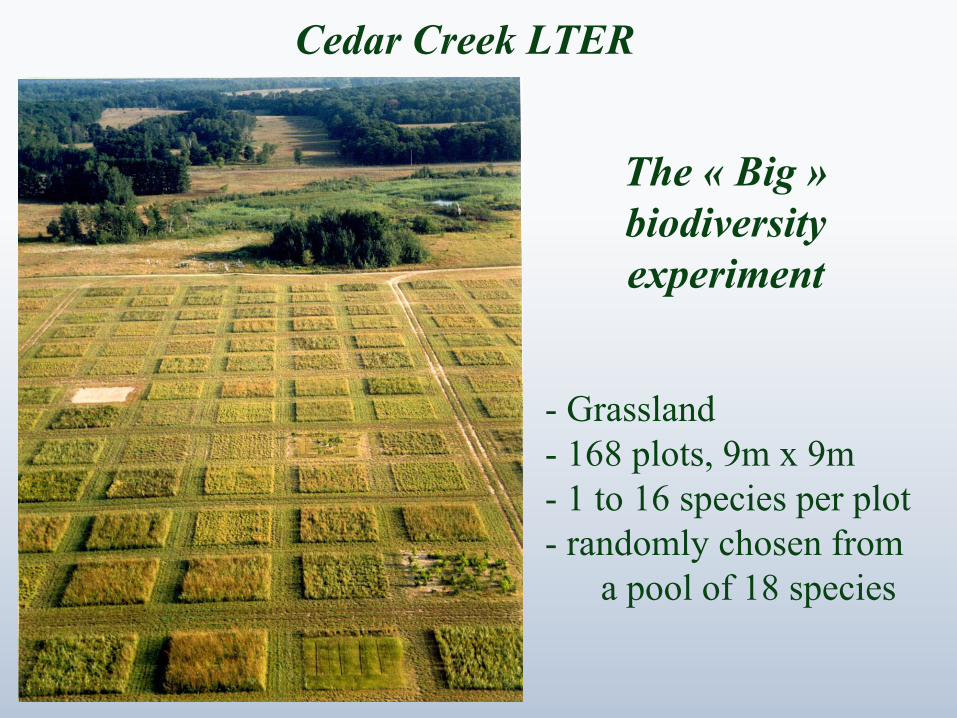
Cedar Creek LTER
- Grassland
- 168 plots, 9m x 9m
- 1 to 16 species per plot
- randomly chosen from
a pool of 18 species
The « Big »
biodiversity
experiment
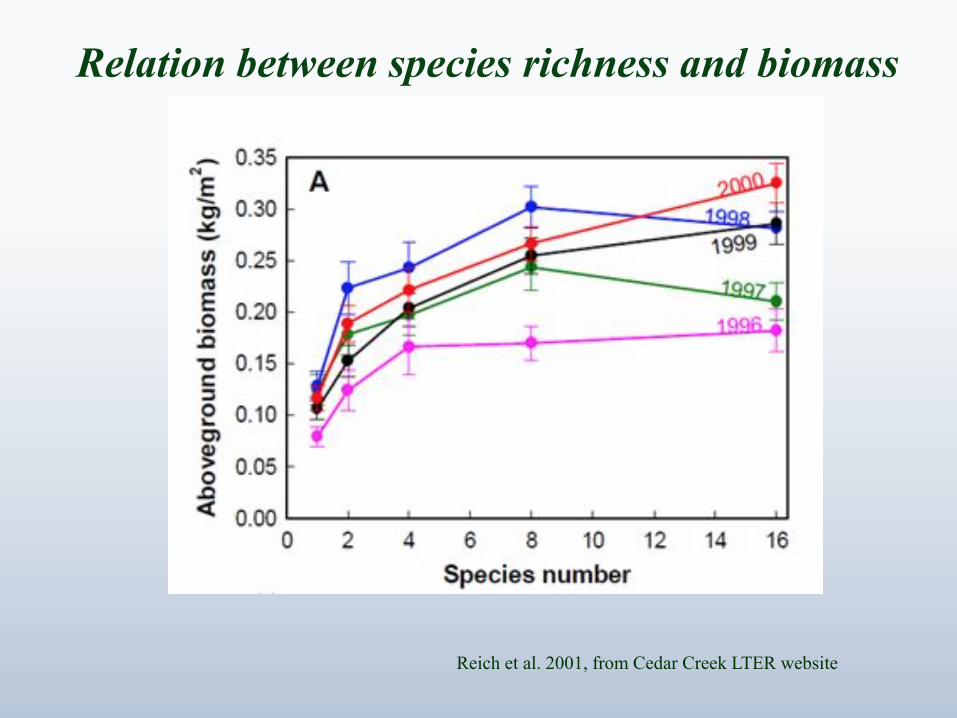
Relation between species richness and biomass
Reich et al. 2001, from Cedar Creek LTER website
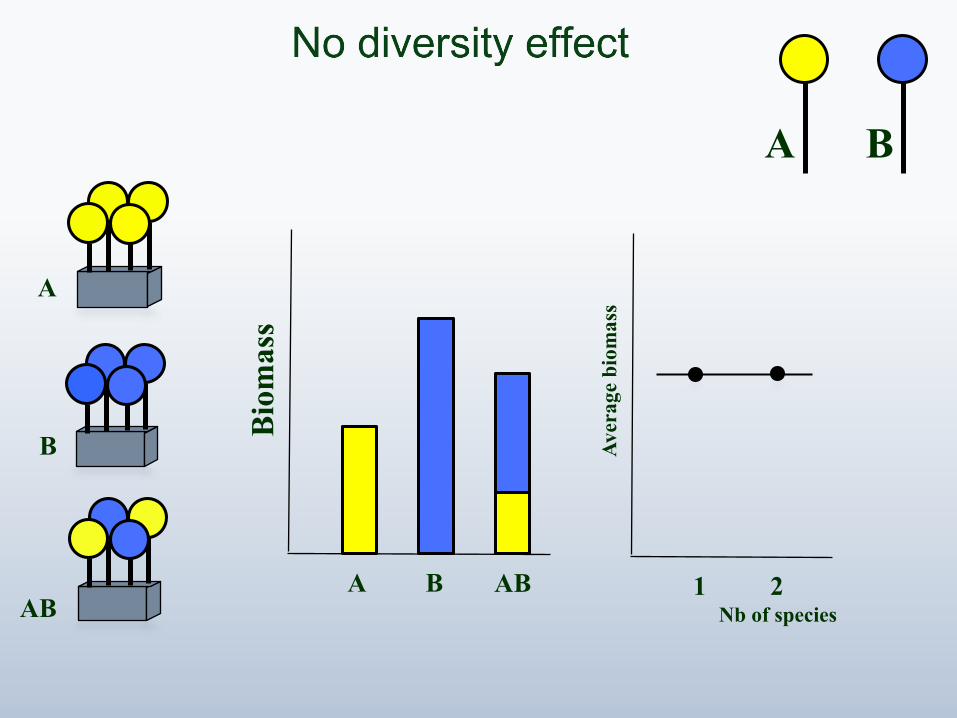
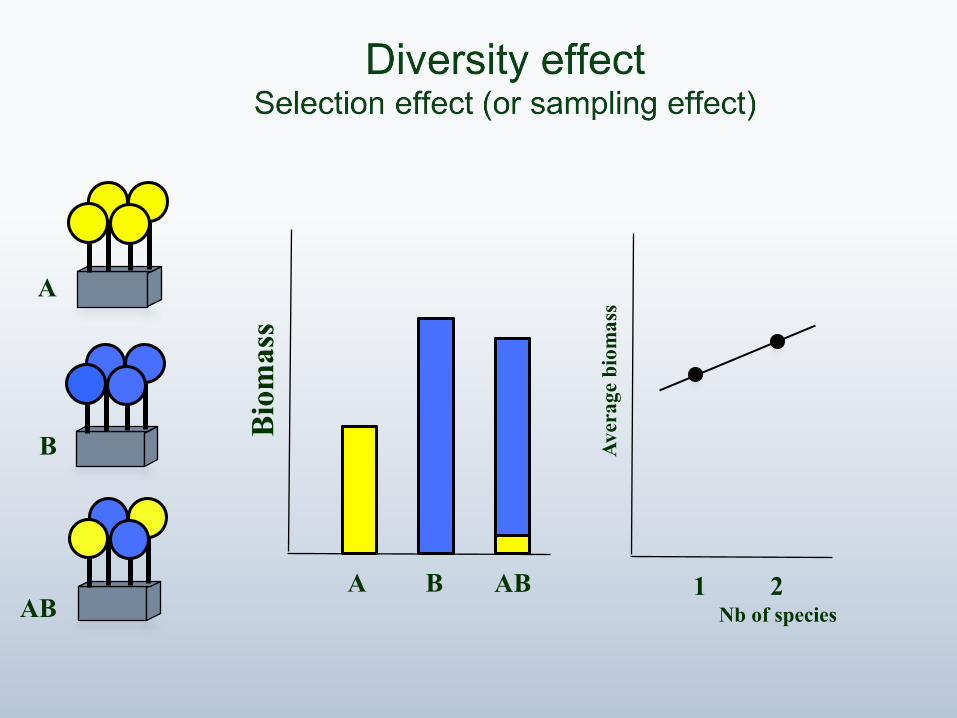
AB
A B
A B
A
B
AB
Bio
mass
1 2 Nb of species
Av
erag
e b
iom
ass
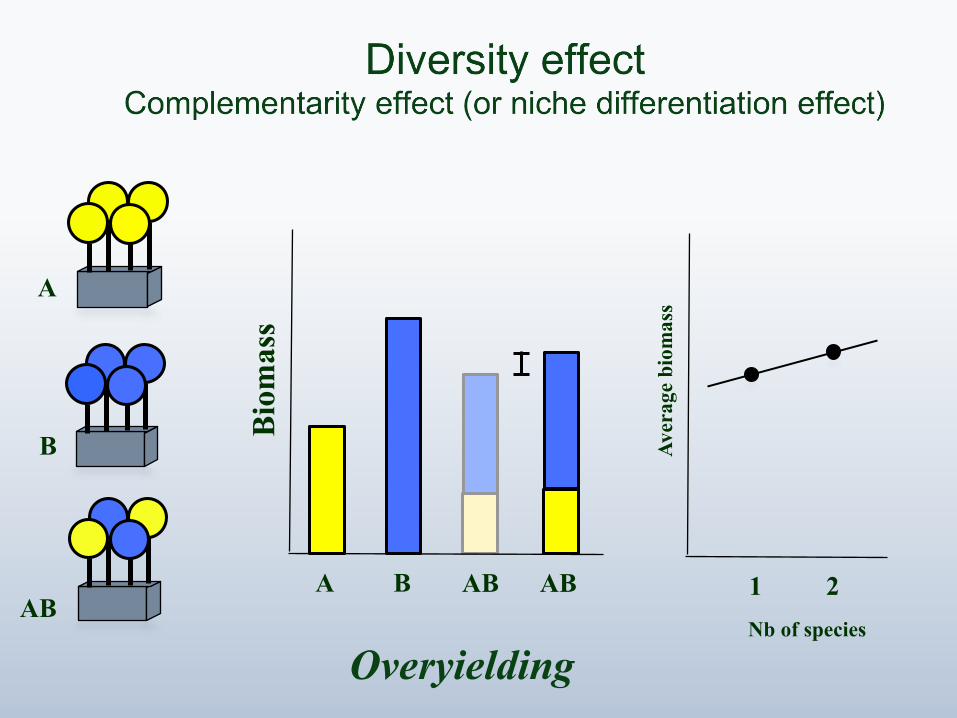
AB A B
Bio
mass
AB
A
B
AB 1 2
Nb of species
Av
erag
e b
iom
ass
Overyielding
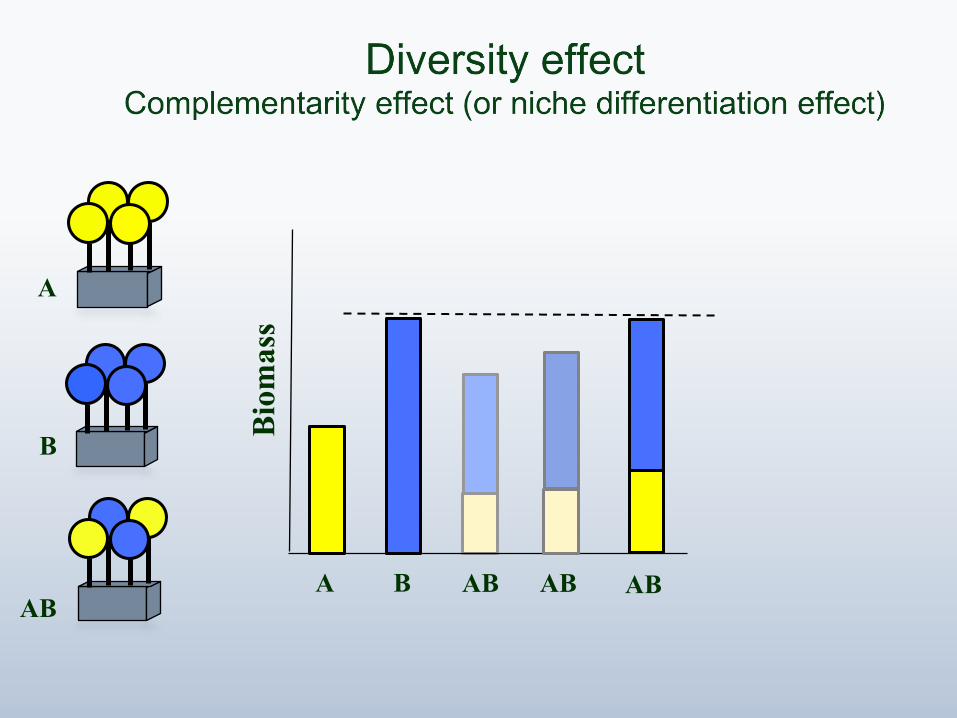
AB A B
Bio
mass
AB
A
B
AB AB
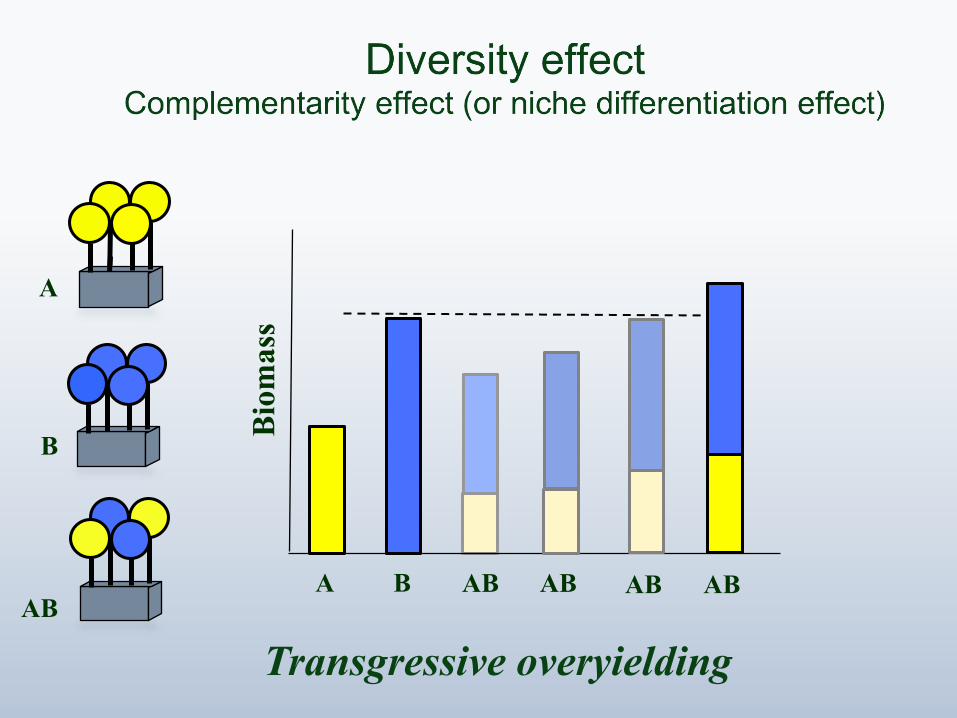
AB A B
Bio
mass
AB
A
B
AB AB AB
Transgressive overyielding
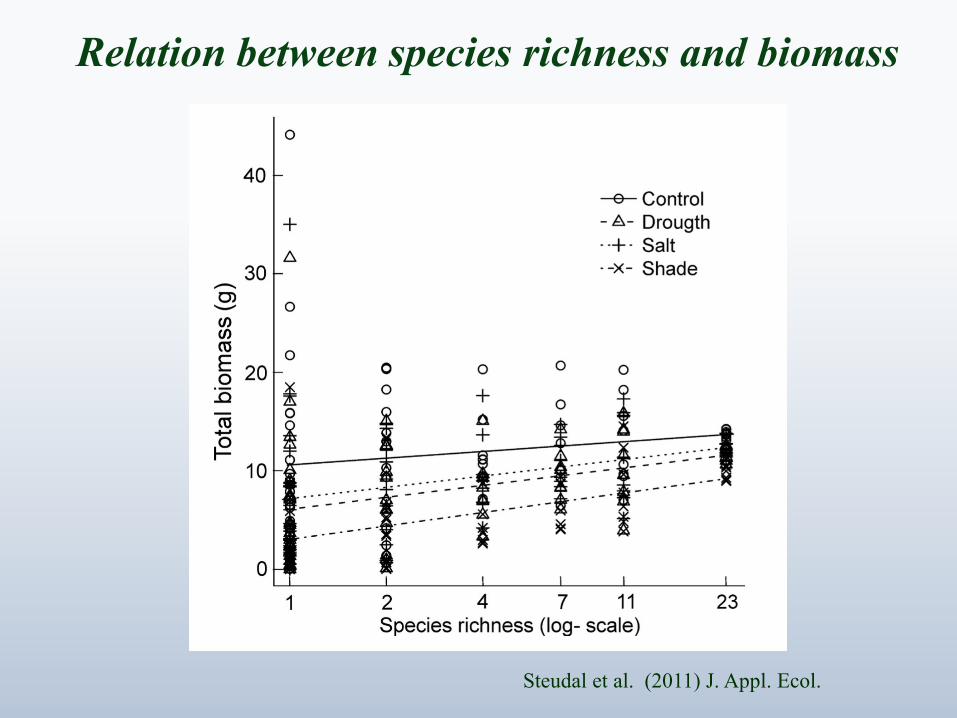
Relation between species richness and biomass
Steudal et al. (2011) J. Appl. Ecol.
AB A B
A
B
AB
Bio
mass
1 2 Nb of species
Av
erag
e b
iom
ass
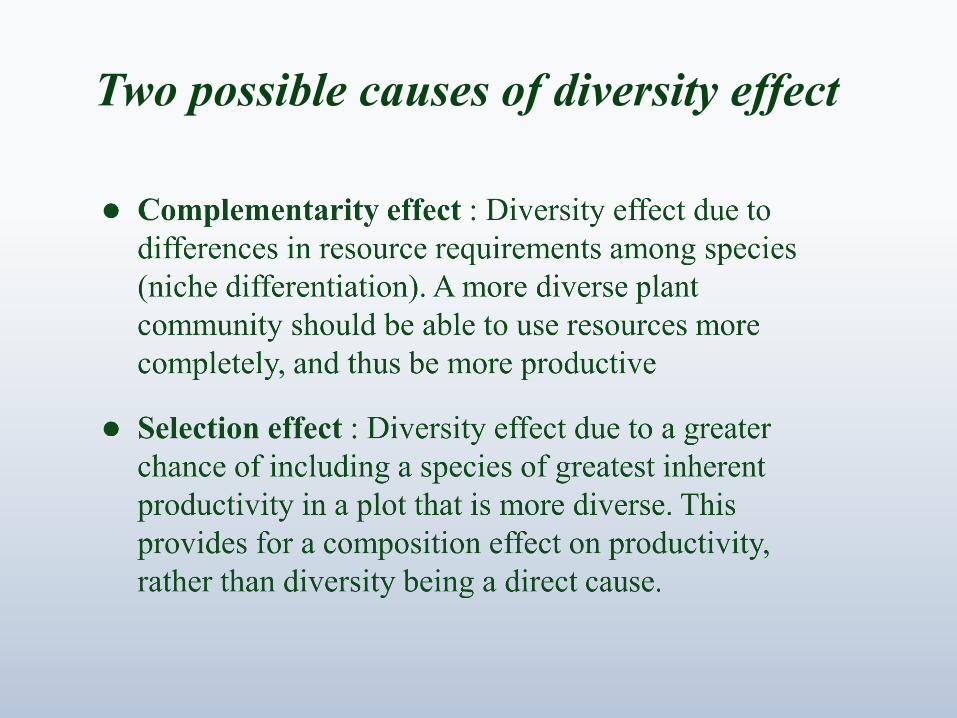
Two possible causes of diversity effect
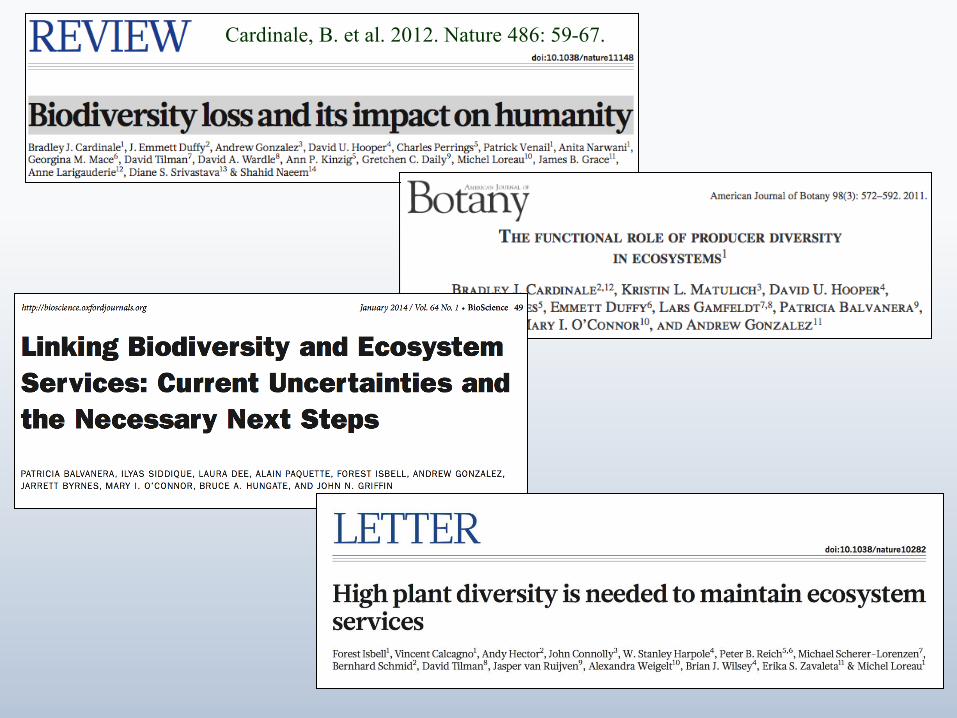
Cardinale, B. et al. 2012. Nature 486: 59-67.
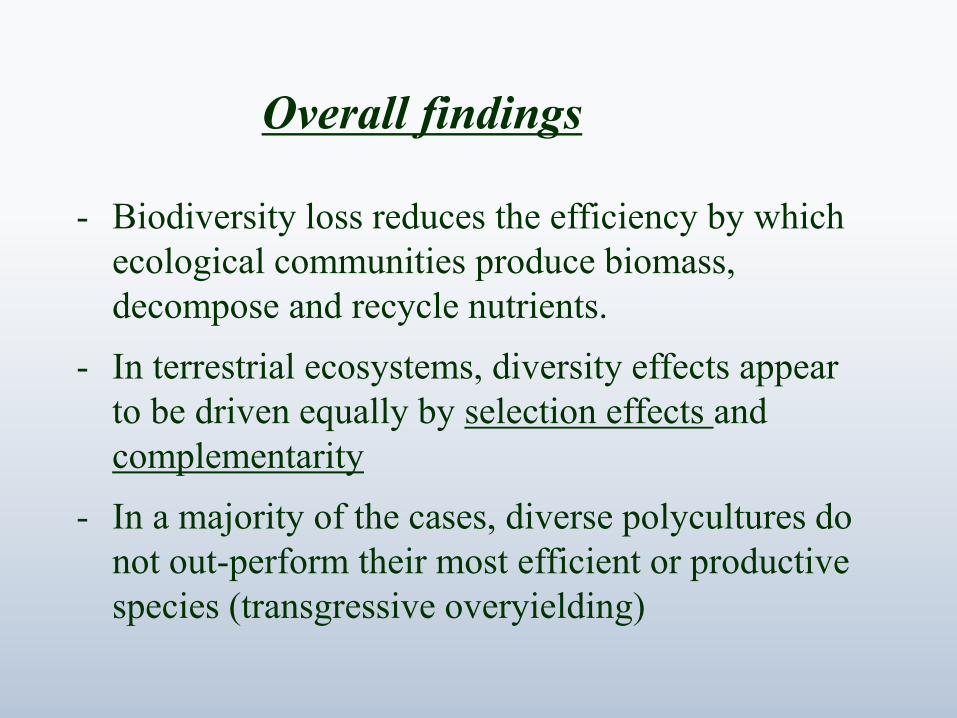
Overall findings
- Biodiversity loss reduces the efficiency by which
ecological communities produce biomass,
decompose and recycle nutrients.
- In terrestrial ecosystems, diversity effects appear
to be driven equally by selection effects and
complementarity
- In a majority of the cases, diverse polycultures do
not out-perform their most efficient or productive
species (transgressive overyielding)
Remaining questions
- In biodiversity experimental studies, grasslands are over-
represented (and wetlands under-represented). How do these
conclusions can be generalized to all types of ecosystems ?
- By far the most common « ecological service » evaluated is
productivity (biomass). Do these conclusions apply to other
services ?
- In general, the effect of biodiversity is evaluated against one
service. What is the biodiversity effect on multiple services ?
Constructed wetlands for water treatment can
contribute in answering these questions
Constructed wetlands
- Constructed wetland can be thought of a special case of
ecosystem providing a specific ecosystem service
- Water purification is definitely an ecosystem service
- Water purification is a complex process measured using
several parameters (removal of nitrogen, phosphorus,
suspended solids, organic matter, etc.)
There is little overlap between the ecological and
the constructed wetland scientific literature
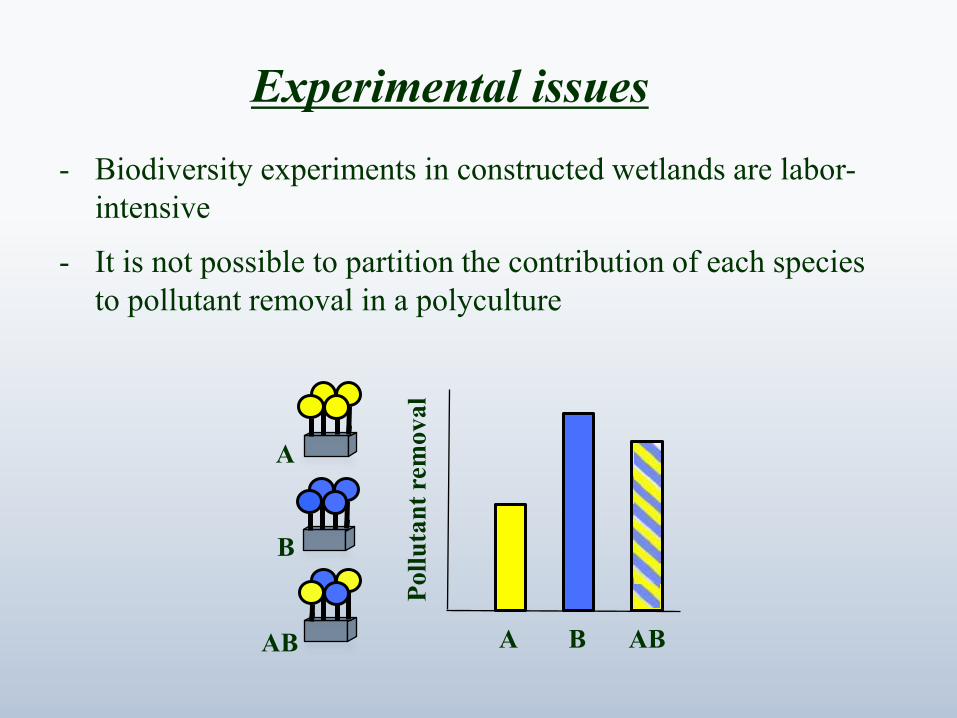
Experimental issues
- Biodiversity experiments in constructed wetlands are labor-
intensive
- It is not possible to partition the contribution of each species
to pollutant removal in a polyculture
AB A B
A
B
AB
Poll
uta
nt
rem
ov
al
A B AB
A
B
AB
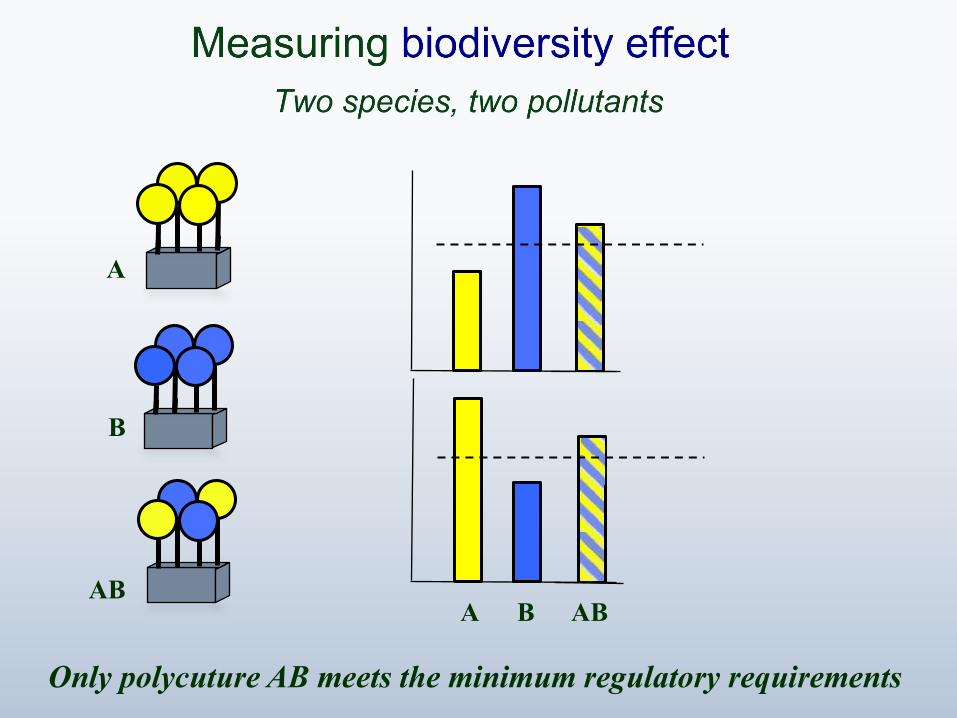
Only polycuture AB meets the minimum regulatory requirements
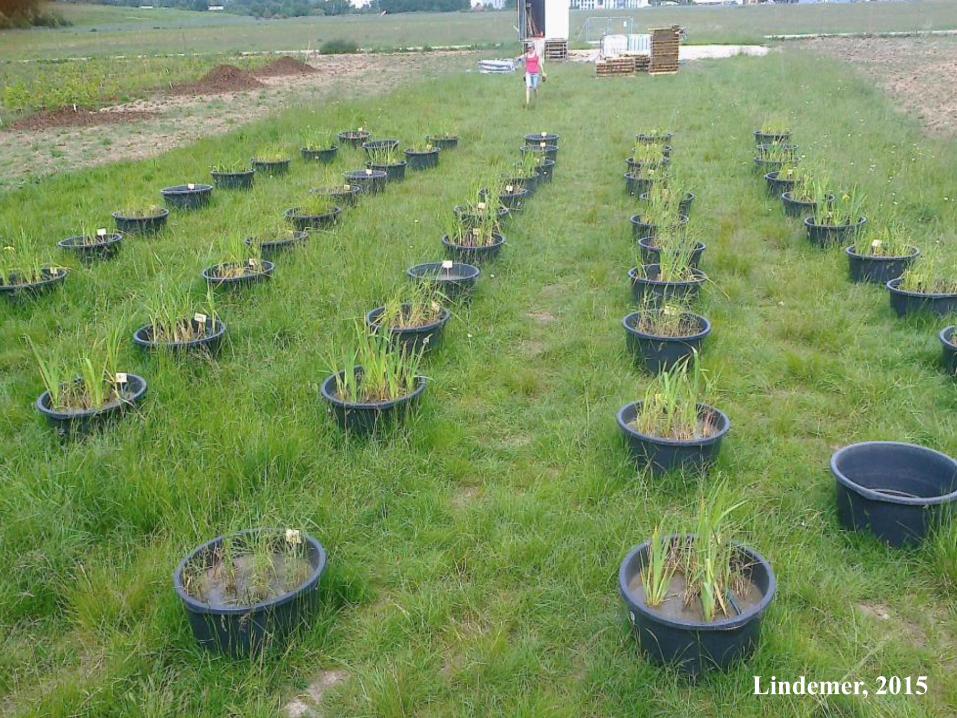
Lindemer, 2015
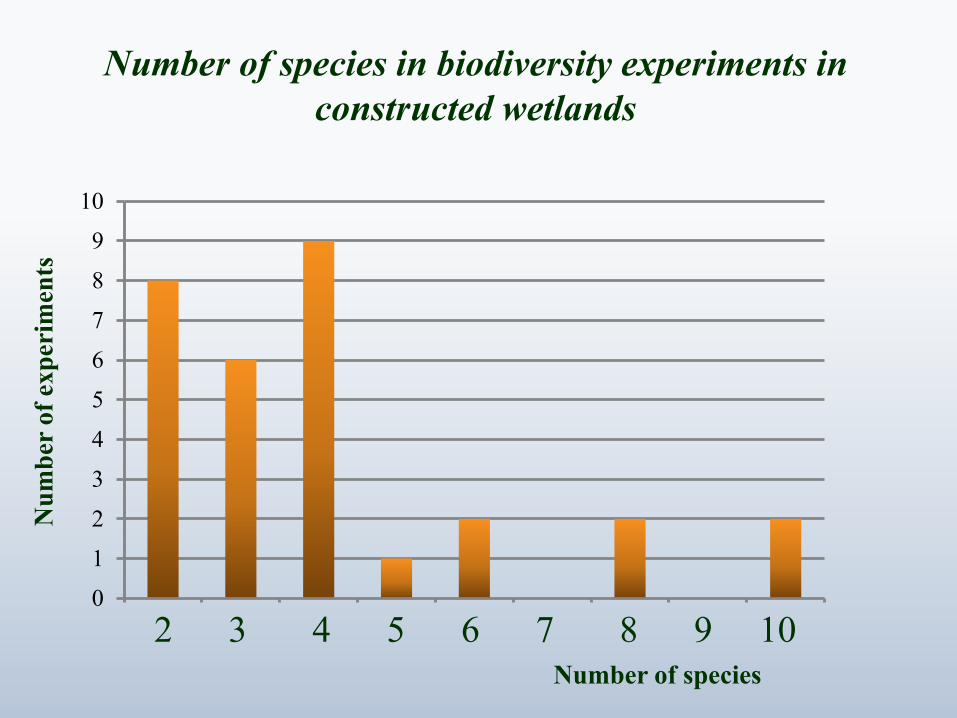
Number of species in biodiversity experiments in
constructed wetlands
0
1
2
3
4
5
6
7
8
9
10
1 2 3 4 5 6 7 8 9
Number of species
Nu
mb
er o
f ex
per
imen
ts
2 3 4 5 6 7 8 9 10
0
1
2
3
4
5
6
7
8
1 2 3 4 5 6 7 8 9 10 11 12 13 14 15
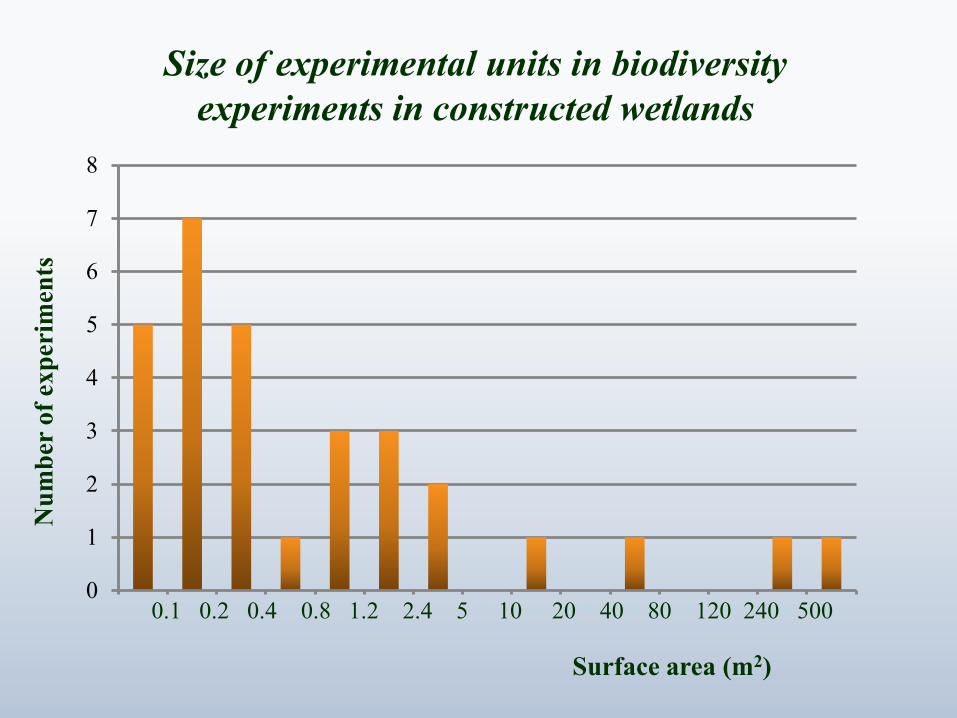
Size of experimental units in biodiversity
experiments in constructed wetlands
Nu
mb
er o
f ex
per
imen
ts
Surface area (m2)
0.1 0.2 0.4 0.8 1.2 2.4 5 10 20 40 80 120 240 500
0
20
40
60
80
100
120
140
160
180
200
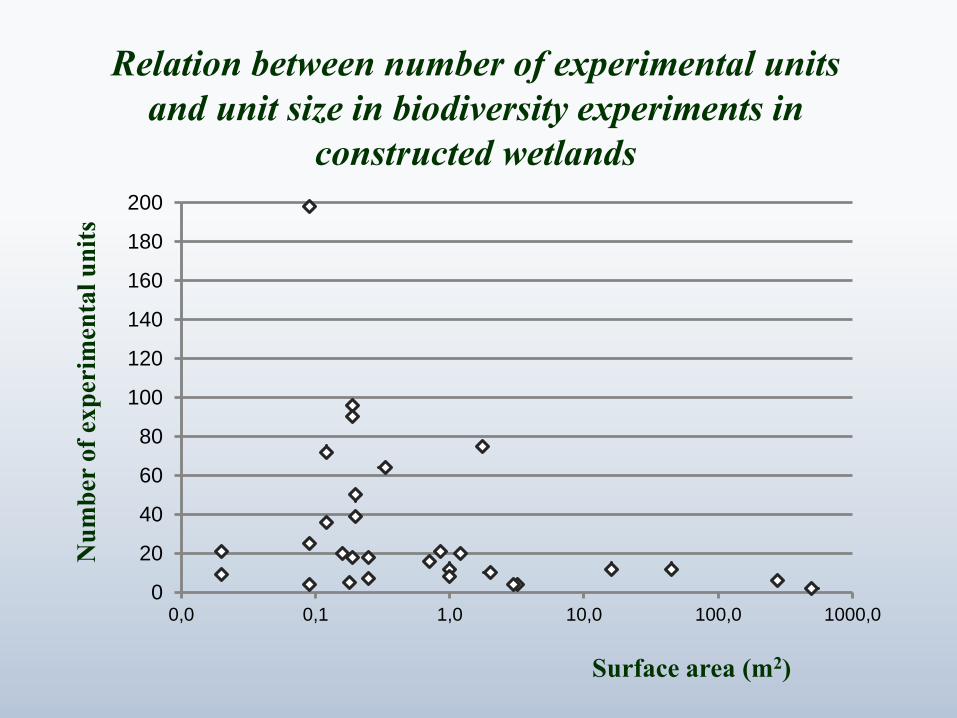
0,0 0,1 1,0 10,0 100,0 1000,0
Relation between number of experimental units
and unit size in biodiversity experiments in
constructed wetlands
Surface area (m2)
Nu
mb
er o
f ex
per
imen
tal
un
its
30
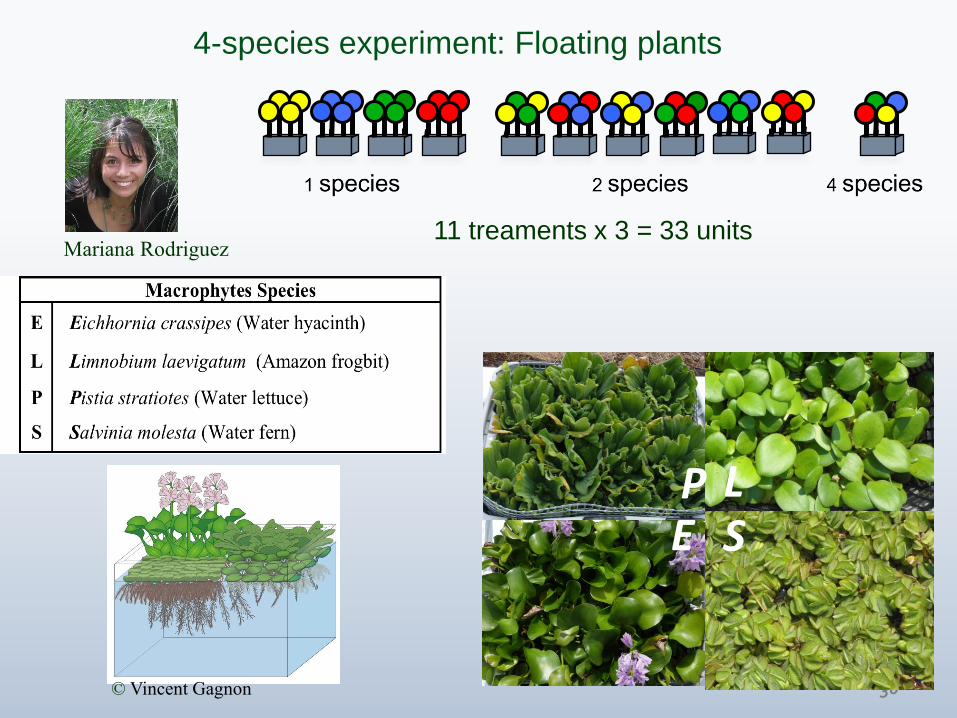
4-species experiment: Floating plants
11 treaments x 3 = 33 units Mariana Rodriguez
L S
P E
© Vincent Gagnon
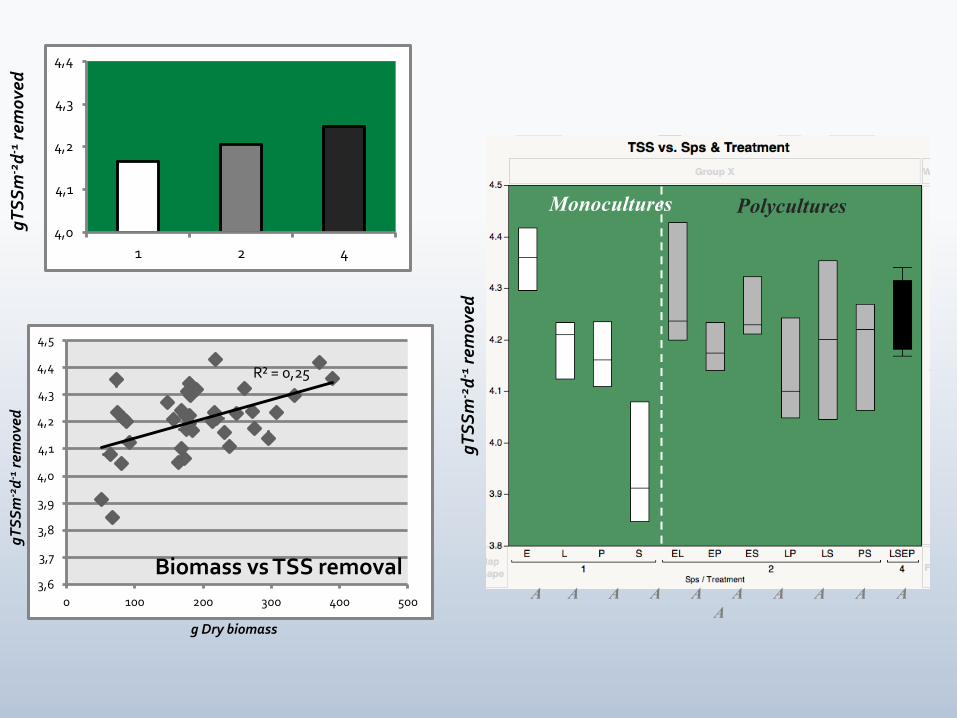
R² = 0,25
3,6
3,7
3,8
3,9
4,0
4,1
4,2
4,3
4,4
4,5
0 100 200 300 400 500
Biomass vs TSS removal
4,0
4,1
4,2
4,3
4,4
1 2 4
gT
SS
m-2
d-1
rem
ove
d
gT
SS
m-2
d-1
rem
ove
d
Polycultures Monocultures
A A A A A A A A A A
A
gT
SS
m-2
d-1
rem
ove
d
g Dry biomass

Monocultures
4-species experiment: floating plants
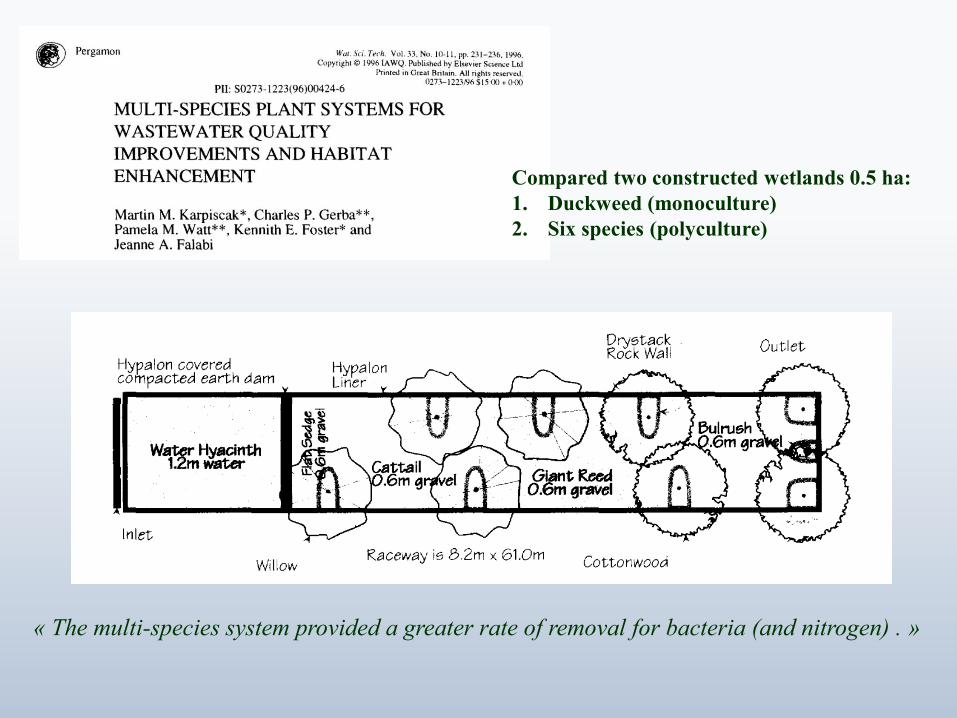
« The multi-species system provided a greater rate of removal for bacteria (and nitrogen) . »
Compared two constructed wetlands 0.5 ha:
1. Duckweed (monoculture)
2. Six species (polyculture)
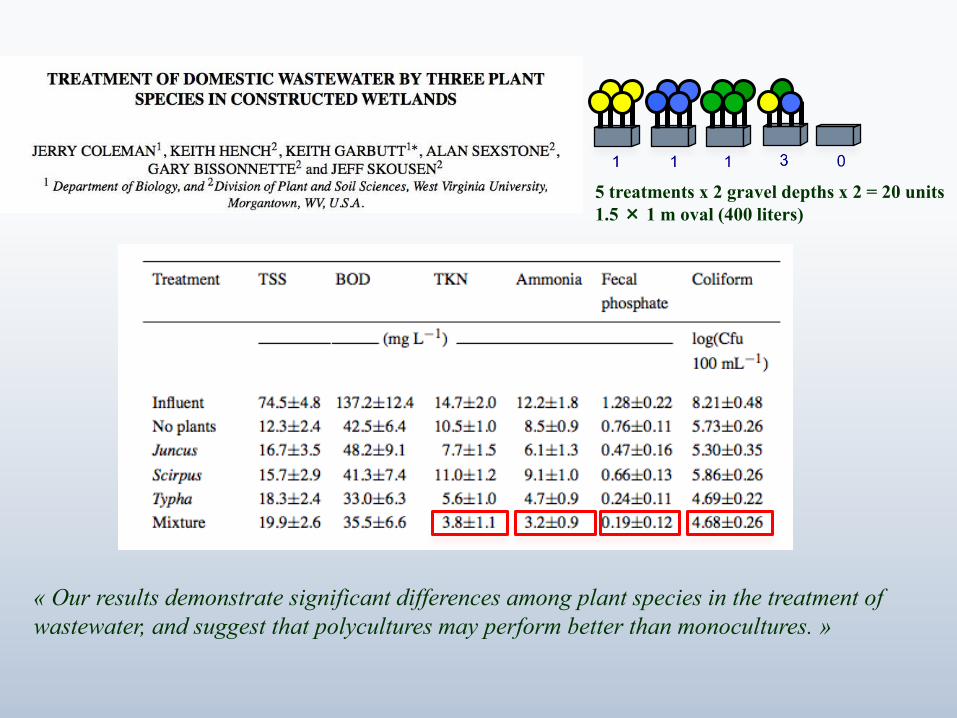
5 treatments x 2 gravel depths x 2 = 20 units
1.5 × 1 m oval (400 liters)
« Our results demonstrate significant differences among plant species in the treatment of
wastewater, and suggest that polycultures may perform better than monocultures. »
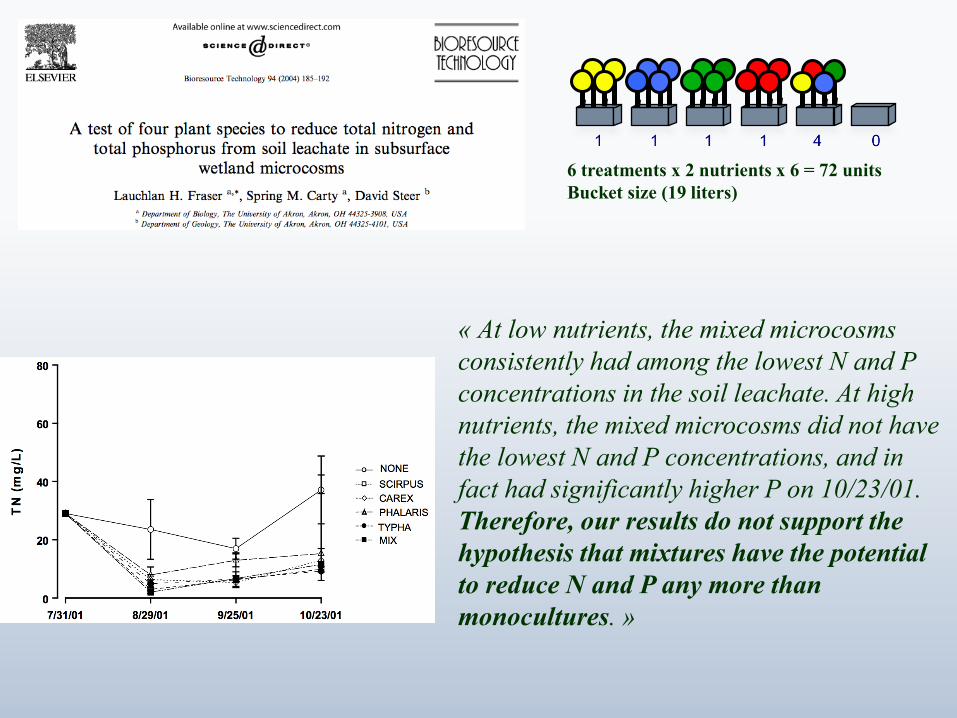
« At low nutrients, the mixed microcosms
consistently had among the lowest N and P
concentrations in the soil leachate. At high
nutrients, the mixed microcosms did not have
the lowest N and P concentrations, and in
fact had significantly higher P on 10/23/01.
Therefore, our results do not support the
hypothesis that mixtures have the potential
to reduce N and P any more than
monocultures. »
6 treatments x 2 nutrients x 6 = 72 units
Bucket size (19 liters)
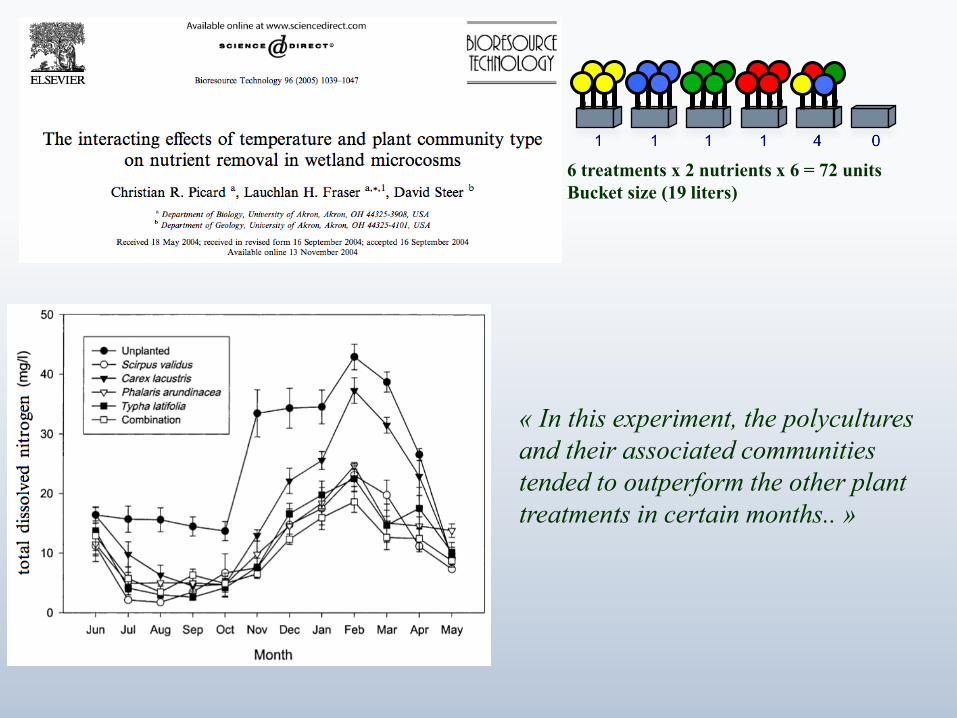
6 treatments x 2 nutrients x 6 = 72 units
Bucket size (19 liters)
« In this experiment, the polycultures
and their associated communities
tended to outperform the other plant
treatments in certain months.. »
Experimental study
Effect of species richness on:
Biomass
production Pollutant removal
Karpiscak et al. (1996) Not applicable Positive (N, BOD,
Bacteria)
Bachand and Horne (2000) Not applicable Positive (denitrif.)
Coleman et al. (2001) Data not avail. Positive (TKN, NH3, P)
Engelhardt and Ritchie
(2001, 2002) No effect No effect
Karathanis et al. (2003) Not applicable No effect
Tripahi and Upadhyay
(2003) Data not avail. Positive (N, P)
Sooknah and Wilkie (2004) No effect No effect
Fraser et al. (2004);
Picard et al. (2005) No effect
No effect yr 1
Partly positive yr 2
Zhang-Z et al.(2007) No effect No effect
Zurita et al. (2009) Not applicable Positive (TSS, BOD)
No effect (N, P)
Debing et al. (2009) Not applicable Positive
Zhang-CB et al. (2010a,
2010b, 2011a, 2011b);
Zhu et al. 2010;
Zhu et al. 2012;
Wang-H et al. 2013.
Positive yrs 1,2
Mostly positive yr 1
(P, N.)
Positive yr 2(N)
Liang et al. (2011) Negative yr 1, Positive
yrs 3,4 No effect
Experimental study
Effect of species richness on:
Biomass
production Pollutant removal
Qiu et al. (2011) No effect Mostly positive.
Zhang-CB et al. (2012a) Data not avail. Positive (NH4,NO3,P)
Ellerton et al. (2012) Data not avail. No effect
Prajapati et al. (2013) Data not avail. Positive (TSS, BOD)
Sun et al. (2013) Positive Positive (NO3)
Menon and Holland
(2013,2014) Data not avail.
No effect (P retention)
Positive (P release)
Kumari and Tripathi (2014) data not avail. Positive
Tomamitsu et al. (2014) Positive Positive (N)
Dai et al. (2014) data not avail. No effect
Chang et al. (2014) Positive Positive (N)
Zhao et al. (2014)-1 Positive Positive (NH4, PO4)
Zhao et al. (2014)-2 Positive Mostly positive (P,N)
Ge et al. (2015) No effect Positive (N)
Niu et al. (2015) No effect No effect
Lindermer (2015) No effect No effect
Turker et al. (2016) Positive (max in 3-
species) No effect
Rodriguez (2015) No effect No effect
Rodriguez and Brisson
(2016) not applicable No effect
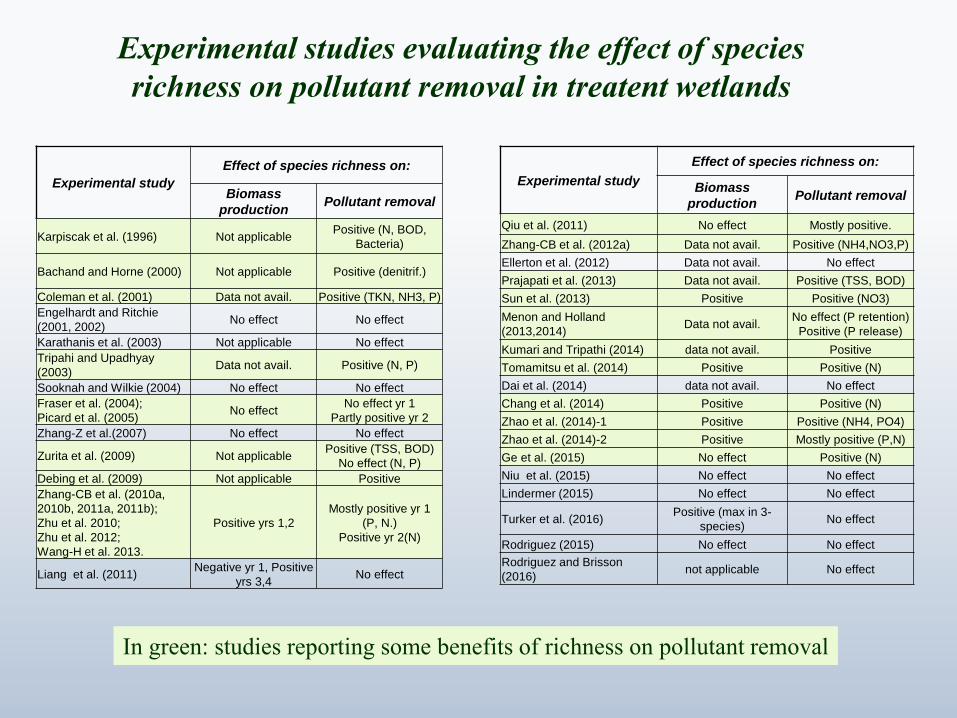
Experimental studies evaluating the effect of species
richness on pollutant removal in treatent wetlands
In green: studies reporting some benefits of richness on pollutant removal
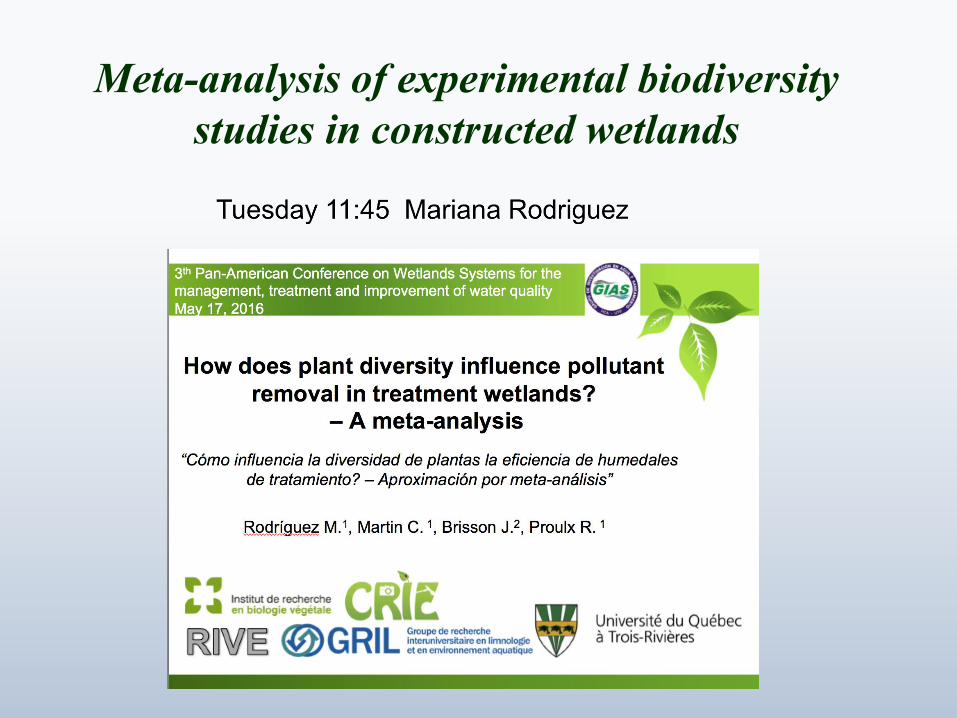
Meta-analysis of experimental biodiversity
studies in constructed wetlands
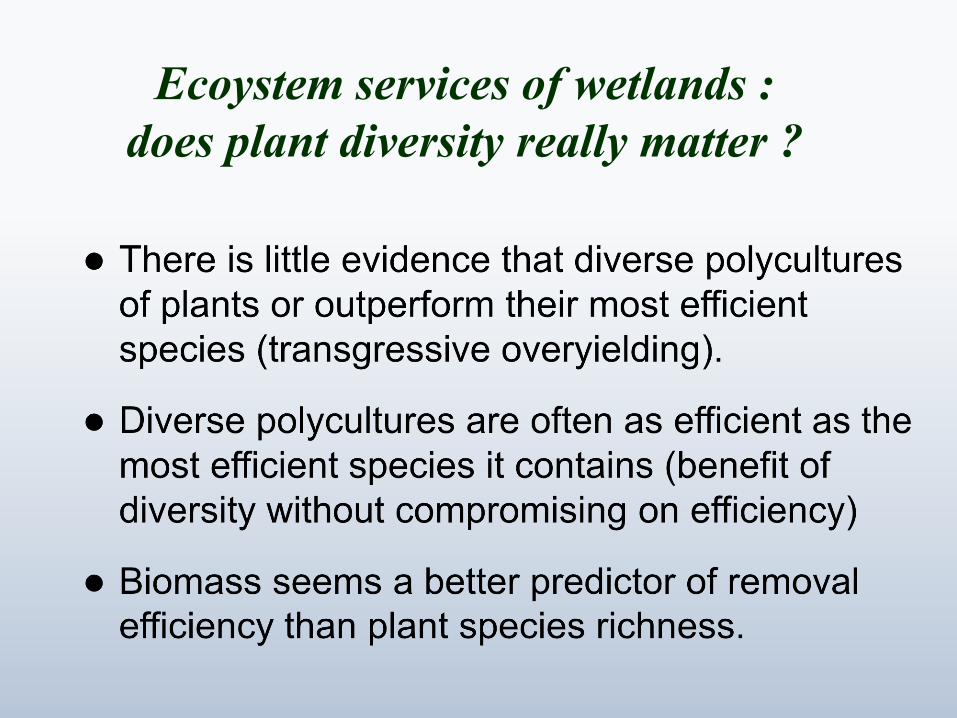
Ecoystem services of wetlands :
does plant diversity really matter ?
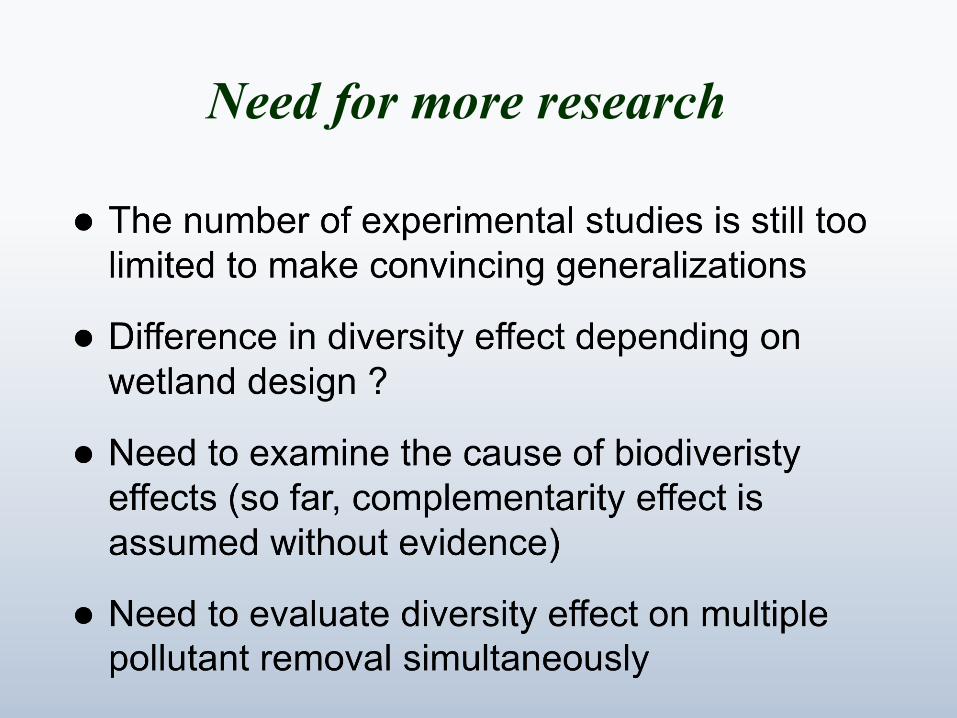
Need for more research