Embed Size (px)
Citation preview
Planning Level Cost Estimation Manual
Page 1 of 75
Planning Level Cost Estimation
Step by Step to Make it Easy
By: Delwar Murshed, Ph.D., P.E.
Paul McCorkhill
Urban Planning Office Washington State Department of Transportation
December 2008
Planning Level Cost Estimation Manual
Page 2 of 75
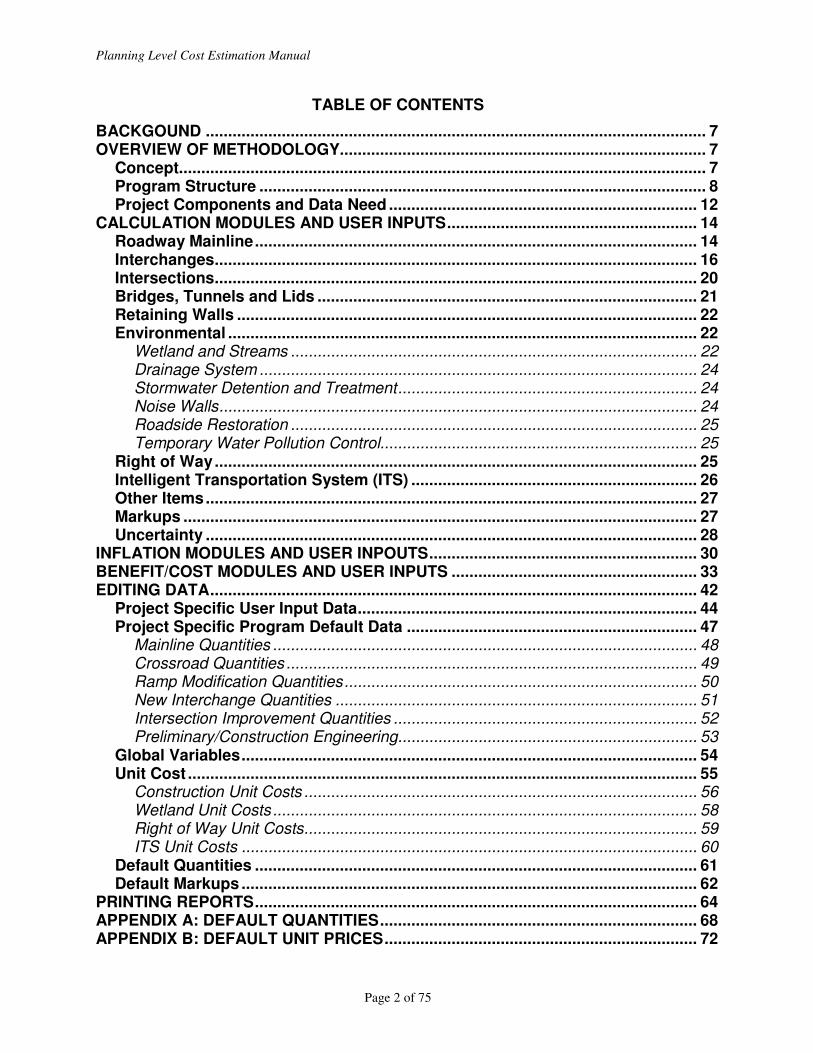
TABLE OF CONTENTS
BACKGOUND ................................................................................................................ 7 OVERVIEW OF METHODOLOGY.................................................................................. 7
Concept...................................................................................................................... 7 Program Structure .................................................................................................... 8 Project Components and Data Need ..................................................................... 12
CALCULATION MODULES AND USER INPUTS........................................................ 14 Roadway Mainline................................................................................................... 14 Interchanges............................................................................................................ 16 Intersections............................................................................................................ 20 Bridges, Tunnels and Lids ..................................................................................... 21 Retaining Walls ....................................................................................................... 22 Environmental ......................................................................................................... 22
Wetland and Streams ........................................................................................... 22 Drainage System .................................................................................................. 24 Stormwater Detention and Treatment................................................................... 24 Noise Walls........................................................................................................... 24 Roadside Restoration ........................................................................................... 25 Temporary Water Pollution Control....................................................................... 25
Right of Way............................................................................................................ 25 Intelligent Transportation System (ITS) ................................................................ 26 Other Items.............................................................................................................. 27 Markups ................................................................................................................... 27 Uncertainty .............................................................................................................. 28
INFLATION MODULES AND USER INPOUTS............................................................ 30 BENEFIT/COST MODULES AND USER INPUTS ....................................................... 33 EDITING DATA............................................................................................................. 42
Project Specific User Input Data............................................................................ 44 Project Specific Program Default Data ................................................................. 47
Mainline Quantities ............................................................................................... 48 Crossroad Quantities ............................................................................................ 49 Ramp Modification Quantities............................................................................... 50 New Interchange Quantities ................................................................................. 51 Intersection Improvement Quantities .................................................................... 52 Preliminary/Construction Engineering................................................................... 53
Global Variables...................................................................................................... 54 Unit Cost .................................................................................................................. 55
Construction Unit Costs ........................................................................................ 56 Wetland Unit Costs ............................................................................................... 58 Right of Way Unit Costs........................................................................................ 59 ITS Unit Costs ...................................................................................................... 60
Default Quantities ................................................................................................... 61 Default Markups ...................................................................................................... 62
PRINTING REPORTS................................................................................................... 64 APPENDIX A: DEFAULT QUANTITIES....................................................................... 68 APPENDIX B: DEFAULT UNIT PRICES...................................................................... 72

Planning Level Cost Estimation Manual
Page 3 of 75
Planning Level Cost Estimation Manual
Page 4 of 75
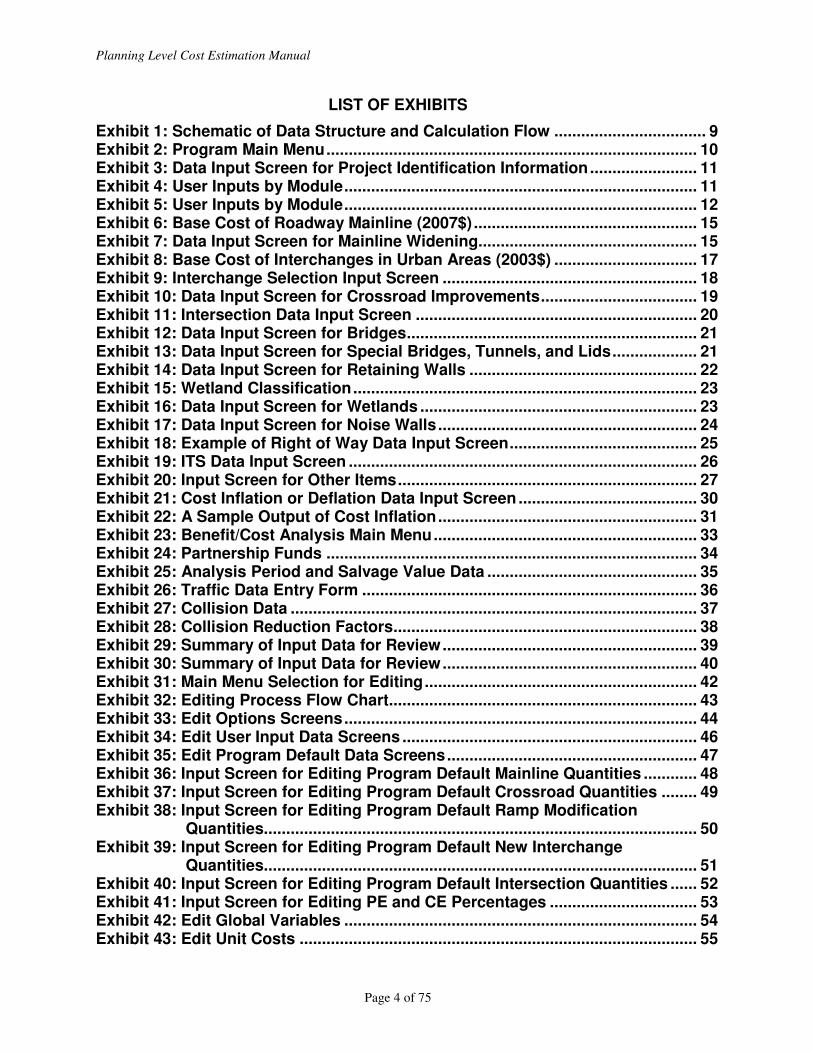
LIST OF EXHIBITS
Exhibit 1: Schematic of Data Structure and Calculation Flow .................................. 9 Exhibit 2: Program Main Menu................................................................................... 10 Exhibit 3: Data Input Screen for Project Identification Information........................ 11 Exhibit 4: User Inputs by Module............................................................................... 11 Exhibit 5: User Inputs by Module............................................................................... 12 Exhibit 6: Base Cost of Roadway Mainline (2007$).................................................. 15 Exhibit 7: Data Input Screen for Mainline Widening................................................. 15 Exhibit 8: Base Cost of Interchanges in Urban Areas (2003$) ................................ 17 Exhibit 9: Interchange Selection Input Screen ......................................................... 18 Exhibit 10: Data Input Screen for Crossroad Improvements................................... 19 Exhibit 11: Intersection Data Input Screen ............................................................... 20 Exhibit 12: Data Input Screen for Bridges................................................................. 21 Exhibit 13: Data Input Screen for Special Bridges, Tunnels, and Lids................... 21 Exhibit 14: Data Input Screen for Retaining Walls ................................................... 22 Exhibit 15: Wetland Classification............................................................................. 23 Exhibit 16: Data Input Screen for Wetlands .............................................................. 23 Exhibit 17: Data Input Screen for Noise Walls.......................................................... 24 Exhibit 18: Example of Right of Way Data Input Screen.......................................... 25 Exhibit 19: ITS Data Input Screen .............................................................................. 26 Exhibit 20: Input Screen for Other Items................................................................... 27 Exhibit 21: Cost Inflation or Deflation Data Input Screen ........................................ 30 Exhibit 22: A Sample Output of Cost Inflation.......................................................... 31 Exhibit 23: Benefit/Cost Analysis Main Menu........................................................... 33 Exhibit 24: Partnership Funds ................................................................................... 34 Exhibit 25: Analysis Period and Salvage Value Data ............................................... 35 Exhibit 26: Traffic Data Entry Form ........................................................................... 36 Exhibit 27: Collision Data ........................................................................................... 37 Exhibit 28: Collision Reduction Factors.................................................................... 38 Exhibit 29: Summary of Input Data for Review......................................................... 39 Exhibit 30: Summary of Input Data for Review......................................................... 40 Exhibit 31: Main Menu Selection for Editing............................................................. 42 Exhibit 32: Editing Process Flow Chart..................................................................... 43 Exhibit 33: Edit Options Screens............................................................................... 44 Exhibit 34: Edit User Input Data Screens .................................................................. 46 Exhibit 35: Edit Program Default Data Screens........................................................ 47 Exhibit 36: Input Screen for Editing Program Default Mainline Quantities ............ 48 Exhibit 37: Input Screen for Editing Program Default Crossroad Quantities ........ 49 Exhibit 38: Input Screen for Editing Program Default Ramp Modification
Quantities................................................................................................. 50 Exhibit 39: Input Screen for Editing Program Default New Interchange
Quantities................................................................................................. 51 Exhibit 40: Input Screen for Editing Program Default Intersection Quantities ...... 52 Exhibit 41: Input Screen for Editing PE and CE Percentages ................................. 53 Exhibit 42: Edit Global Variables ............................................................................... 54 Exhibit 43: Edit Unit Costs ......................................................................................... 55

Planning Level Cost Estimation Manual
Page 5 of 75
Exhibit 44: Input Screens for Editing Construction Unit Costs............................... 56 Exhibit 45: Edit Wetland Mitigation Costs................................................................. 58 Exhibit 46: Edit Right of Way Unit Costs................................................................... 59 Exhibit 47: Edit ITS Unit Costs................................................................................... 60 Exhibit 48: Edit Mainline Default Quantities ............................................................. 61 Exhibit 49: Edit Default Markups................................................................................ 62 Exhibit 50: Sample Cost Summary Report................................................................ 65 Exhibit 51: Sample B-C Report .................................................................................. 66 Exhibit A-1: Default Quantities per Lane Mile for Limited Access Roadways in
Central Puget Sound Region ................................................................ 68 Exhibit A-2: Earthwork Quantities by Terrain Type.................................................. 69 Exhibit A-3: Default Quantities per Ramp-Mile ......................................................... 69 Exhibit A-4: Default Quantities for Interchange Cost Estimate............................... 70 Exhibit B-1: Default Unit Costs for Central Puget Sound Region ........................... 72 Exhibit B-2: Default Unit Cost of Structures in Central Puget Sound Region........ 73 Exhibit B-3: Default Unit Costs for Wetlands and Streams ..................................... 73 Exhibit B-4: Default Right of Way Costs ................................................................... 74 Exhibit B-5: Default Unit Cost as Percent of Construction Costs........................... 75 Exhibit B-6: Construction Engineering Cost ............................................................ 75 Exhibit B-7: Intelligent Transportation System (ITS) Costs..................................... 75

Planning Level Cost Estimation Manual
Page 6 of 75

Planning Level Cost Estimation Manual
Page 7 of 75
Planning Level Project Cost Estimation
BACKGROUND
A planning level project cost estimation methodology was developed as part of Congestion Relief Analysis (CRA) for Washington State’s three metropolitan areas – Central Puget Sound, Spokane, and Vancouver. The methodology was first developed in an EXCEL spreadsheet to quickly estimate the cost of planning level improvements analyzed in the CRA. This spreadsheet tool can analyze only one project at a time. If, for any reason, any assumption or input needs to be adjusted, it has to be done project by project. Significant time and labor would be involved in performing such revisions for a large number of projects, for example projects analyzed for Highway System Plan updates. In addition, this does not have capability to generate summary information for a portfolio of projects. Any summary report needs to be done manually which is again labor intensive and time consuming. In order to overcome these problems and increase efficiency, the methodology has been converted to a MS Access database tool. This database tool has been developed with an objective of realizing a number of user benefits including:
• Broadening the applicability of the methodology to other areas of Washington State outside three metropolitan areas stated above;
• Designing user-friendly interface for project data entry;
• Easily updating the estimates for a portfolio of projects when one or more input variables need to be revised;
• Preparing project cost summary; and
• Reporting of results by corridor, geographic area, or by various cost components such as construction cost, ROW cost, environmental mitigation cost, and so on.
OVERVIEW OF METHODOLOGY
Concept
This methodology is intended to perform cost estimation for projects that are very conceptual, often with no or minimum design. The methodology has been developed to estimate costs for varieties of projects namely widening existing roadways or bridges, building new roads or bridges, and modifying existing interchanges or building new ones. It utilizes unit price approach that accounts for regional differences as well as differences in land use types and development density within a region. Since unit prices vary by geographic area, separate unit prices are used in the estimate depending on where the project is located. To keep the program manageable, four sets of unit prices representing Central Puget Sound, Vancouver, Spokane, and the rest of the state are used. Within each of these geographic areas, unit prices are
Planning Level Cost Estimation Manual
Page 8 of 75
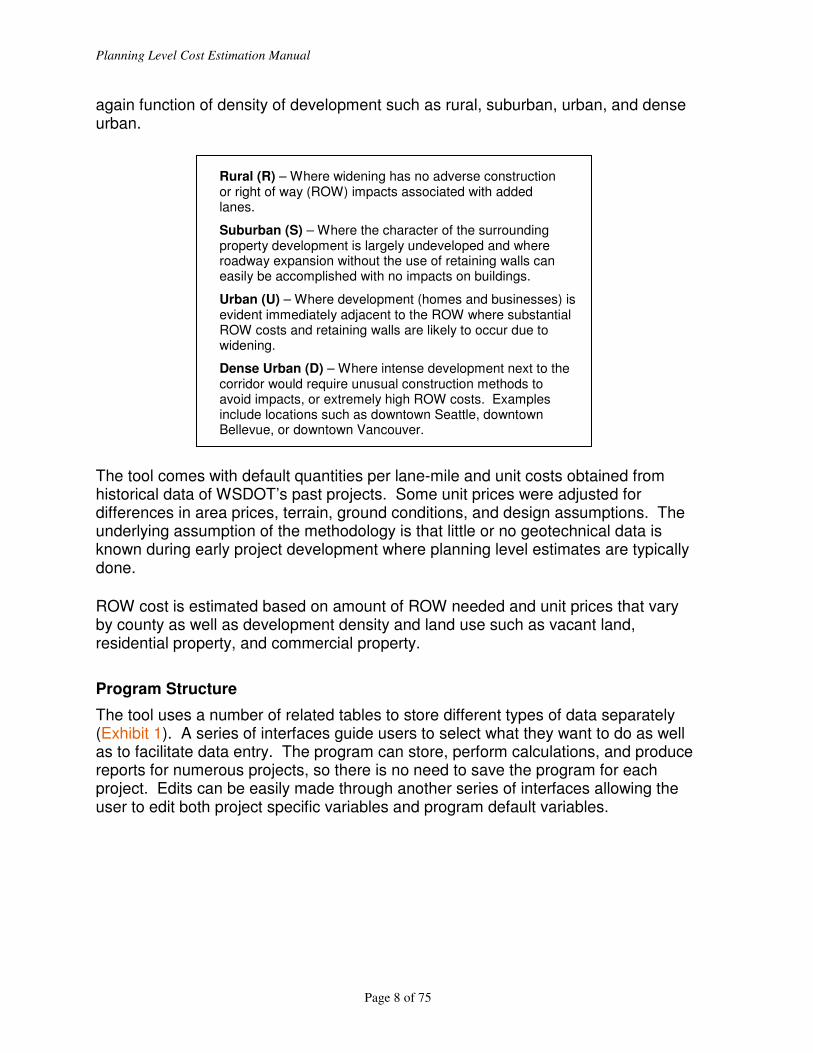
again function of density of development such as rural, suburban, urban, and dense urban. The tool comes with default quantities per lane-mile and unit costs obtained from historical data of WSDOT’s past projects. Some unit prices were adjusted for differences in area prices, terrain, ground conditions, and design assumptions. The underlying assumption of the methodology is that little or no geotechnical data is known during early project development where planning level estimates are typically done. ROW cost is estimated based on amount of ROW needed and unit prices that vary by county as well as development density and land use such as vacant land, residential property, and commercial property.
Program Structure
The tool uses a number of related tables to store different types of data separately (Exhibit 1). A series of interfaces guide users to select what they want to do as well as to facilitate data entry. The program can store, perform calculations, and produce reports for numerous projects, so there is no need to save the program for each project. Edits can be easily made through another series of interfaces allowing the user to edit both project specific variables and program default variables.
Rural (R) – Where widening has no adverse construction or right of way (ROW) impacts associated with added lanes.
Suburban (S) – Where the character of the surrounding property development is largely undeveloped and where roadway expansion without the use of retaining walls can easily be accomplished with no impacts on buildings.
Urban (U) – Where development (homes and businesses) is evident immediately adjacent to the ROW where substantial ROW costs and retaining walls are likely to occur due to widening.
Dense Urban (D) – Where intense development next to the corridor would require unusual construction methods to avoid impacts, or extremely high ROW costs. Examples include locations such as downtown Seattle, downtown Bellevue, or downtown Vancouver.

Planning Level Cost Estimation Manual
Page 9 of 75
Exhibit 1: Schematic of Data Structure and Calculation Flow
User Input
- Project Description - Mainline
- Interchange
- Intersection - Crossroad
- Bridge - Retaining Wall
- Noise Wall
- Wetland - Right of Way
- ITS - Other Items
Interchange Cost
Initial Project
Estimate
Environmental
Cost
Mainline/ Crossroad Cost
Bridge Cost
Retaining Wall Cost
Right of Way Cost
Mainline Default
Quantities
Ramp Default Quantities
Project
Quantities
Interchange Default
Quantities
Ramp-Mile Cost
Lane-Mile Cost
Cost Range
Add cost of PE, mobilization, utility
relocation, construction staging, traffic control, temporary water pollution control,
CE and sales tax as percentages of the
total project cost.
Total Project
Cost
Adjust CE cost based on total
construction dollars
Apply adjustment factors for
uncertainty
Unit Costs
User Input
Program Default Data
Legend
Program Calculations
Intersection Cost
ITS Cost
Planning Level Cost Estimation Manual
Page 10 of 75
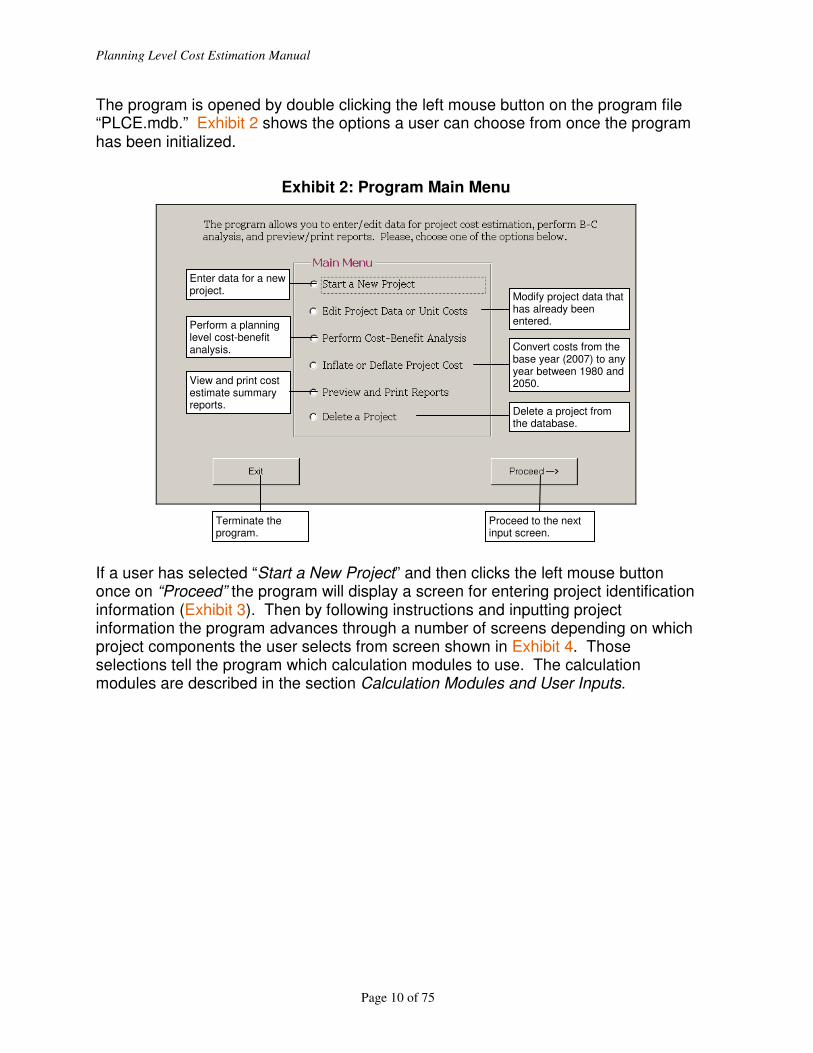
The program is opened by double clicking the left mouse button on the program file “PLCE.mdb.” Exhibit 2 shows the options a user can choose from once the program has been initialized.
Exhibit 2: Program Main Menu
If a user has selected “Start a New Project” and then clicks the left mouse button once on “Proceed” the program will display a screen for entering project identification information (Exhibit 3). Then by following instructions and inputting project information the program advances through a number of screens depending on which project components the user selects from screen shown in Exhibit 4. Those selections tell the program which calculation modules to use. The calculation modules are described in the section Calculation Modules and User Inputs.
Proceed to the next input screen.
Delete a project from the database.
Convert costs from the base year (2007) to any year between 1980 and 2050.
Terminate the program.
View and print cost estimate summary reports.
Perform a planning level cost-benefit analysis.
Enter data for a new project.
Modify project data that has already been entered.

Planning Level Cost Estimation Manual
Page 11 of 75
Exhibit 3: Data Input Screen for Project Identification Information
Exhibit 4: Project Components
By selecting “Edit Project Data or Unit Costs” from the screen shown in Exhibit 2, a user can modify any of the previously entered data or default values (e.g., unit costs, project quantities, etc) for one or more projects. Selecting “Perform Cost-Benefit Analysis” the user can do an analysis, edit an analysis, edit global variables, or print benefit-cost reports. Selecting “Inflate or Deflate Project Cost” the user can choose the year in which they want the costs reported. Selecting “Preview / Print Reports” users can either, preview and print a one page summary report for all projects in the database, or only the project of their interest. Selecting “Delete a Project” allows the

Planning Level Cost Estimation Manual
Page 12 of 75
user to delete individual projects from the database. Pressing “Exit” will save the data, terminate the program, and close all the opened forms associated with this program.
Project Components and Data Need
The tool performs cost estimation requiring only very basic information regarding a project. Exhibit 5 provides an overview of what data is needed for different components of a project. Please note that a particular project may or may not have all these components. The tool offers options to select any combination of components for a specific project.
Exhibit 5: User Inputs by Module
Module User Input Data
Project Description
State route, beginning and ending ARM, county, roadway type (i.e., freeway or arterial), terrain (i.e., level, rolling or mountainous), and development density (i.e., rural, suburban, urban or dense urban)
Mainline Existing and proposed number of lanes by direction, and length of proposed lanes
Interchange Type and number of interchanges
Intersection Number and length of left turn, right turn and two-way-left-turn lanes, number of new signalized intersections, and number and unit cost of roundabout
Crossroad Length and number of lanes
Bridge, Tunnel or Lid
Square feet of existing bridges to be widened or removed, length and square feet of roadway bridges to be built, square feet of new lids, and length of new tunnels, pedestrian bridges and railroad bridges
Walls Square feet of retaining walls, and length of noise walls
Wetland Acres of wetlands to be mitigated by wetland category (i.e., Class I, II, III, and IV), number of stream culverts, and number of beach restorations
ROW Acres of land required by landuse (i.e., vacant, residential, and commercial)
ITS
Number of WMS, CCTV, HARS, HART, data stations, fiber optic terminal cabinets, and ramp meters; number of signals to coordinate; length of ITS conduit and fiber optic cable. No input is required if the default cost per lane-mile option chosen.

Planning Level Cost Estimation Manual
Page 13 of 75

Planning Level Cost Estimation Manual
Page 14 of 75
CALCULATION MODULES AND USER INPUTS
Cost estimation is performed in ten separate user selected calculation modules and a number of associated sub-modules. These user selected modules are:
• Roadway Mainline
• Interchanges
• Intersections
• Crossroads
• Bridges, Tunnels and Lids
• Retaining Walls
• Noise Walls
• Wetland Mitigation
• Right of Way
• Intelligent Transportation Systems In addition to the user selected calculation modules the program performs additional calculations which require no additional user input. These calculations include:
• Grading
• Drainage
• Stormwater Treatment
• Paving
• Roadside Development
• Traffic
• Markups (mobilization, traffic control, temporary water pollution control, construction staging, utility relocation, sales tax, preliminary engineering, and construction engineering)
• Uncertainty
Roadway Mainline
Mainline widening costs are estimated using default quantities per lane-mile from past projects (Exhibits A-1 and A-2) and recent unit costs. The quantities and costs vary according to development densities, roadway type, and geographic location. These variations result in 28 different mainline types (Exhibit 6) that depend on:
• Development Density (rural, suburban, urban, and dense urban)
• Roadway Type (freeways and limited access highways; and arterials and non-limited access highways)
• Geographic Area (the Central Puget Sound Region, Vancouver Metro Area, Spokane Metro Area, and rest of the state).
Mainline estimates are performed based on a number of assumptions commonly experienced in past projects. For example roadways in the Puget Sound area are assumed to be in steeper terrain with greater environmental and right of way impacts. Also, earthwork costs associated with projects in rolling and mountainous

Planning Level Cost Estimation Manual
Page 15 of 75
terrains are generally higher than those for projects in level terrain. Default base estimates per lane-mile for level terrain are shown below.
Exhibit 6: Base Cost* of Roadway Mainline (2007$)
Freeways and Limited Access Highways
Puget Sound ($/lane-mile)
Vancouver ($/lane-mile)
Spokane ($/lane-mile)
Other Areas ($/lane-mile)
Rural 3.66 M 1.48 M 1.48 M 1.12 M
Suburban 3.90 M 1.48 M 1.48 M 1.11 M
Urban 5.53 M 2.29 M 2.00 M 1.12 M
Dense Urban 7.88 M 4.24 M ----- -----
Arterials and Non-Limited Access Highways
Puget Sound ($/lane-mile)
Vancouver ($/lane-mile)
Spokane ($/lane-mile)
Other Areas ($/lane-mile)
Rural 3.53 M 1.20 M 1.20 M 1.11 M
Suburban 3.89 M 1.26 M 1.26 M 1.11 M
Urban 5.46 M 2.16 M 1.87 M 1.19 M
Dense Urban 7.11 M 3.99 M ----- -----
*Does not include interchanges, bridges, walls, wetland mitigation, right of way, or intelligent
transportation systems.
The minimum inputs required for producing a mainline estimate are beginning and ending accumulated route mileposts (ARM), number of lanes in build and no-build conditions by direction, roadway type, terrain type, land development density, and geographic location. An input screen with some example data is shown in Exhibit 7.
Exhibit 7: Data Input Screen for Mainline Widening

Planning Level Cost Estimation Manual
Page 16 of 75
Selection of geographic area, roadway type, terrain, and development density allows the use of appropriate per-mile quantities and costs to reflect that particular roadway segment characteristics. APPENDIX A documents default quantities (Exhibits A-1, A-2, A-3 and A-4) whereas APPENDIX B documents default unit costs (Exhibits B-1, B-2, B-3, B-4, B-5, B-6 and B-7) used in the tool.
Often as part of interchange improvements, cross roads are improved. Cross road data input is similar to that of mainline. Cross road cost calculation uses the same default values as in the mainline calculations. Interchanges
An interchange may involve mainline widening or shift, as well as construction of ramps, bridges and retaining walls, and installation of signals. Mainline widening costs come from mainline estimates described above. For ramps, a typical ramp-mile is estimated using default quantities (Exhibit A-3) and default unit costs (Exhibits B-1 and B-2) obtained from past projects. As unit costs and material quantities required for an interchange vary by geographic area and development density, interchange costs vary from area to area and from one development density to other. Exhibit 8 shows default estimates for different interchange types in urban areas throughout the state.

Planning Level Cost Estimation Manual
Page 17 of 75
Exhibit 8: Base Cost of Interchanges in Urban Areas (2007$)
Interchange Type Puget Sound Vancouver Spokane Other Areas
Ramp modification $5.74 M $5.00 M $5.00 M $3.56 M
Diamond at rural/minor crossroad $21.76 M $13.00 M $12.29 M $10.75 M
Diamond at urban/arterial crossroad
$30.54 M $17.83 M $ 16.64 M $13.81 M
Diamond at urban/braided ramps $37.47 M $21.83 M $20.52 M $17.40 M
Half-diamond $14.81 M $9.09 M $8.66 M $7.68 M
HOV direct access interchange – one directional
$37.96 M $23.96 M $23.44 M $22.22 M
HOV direct access interchange – bidirectional
$68.21 M $43.08 M $42.28 M $40.47 M
HOV direct access interchange – bidirectional with freeway shift for median widening
$77.01 M $47.95 M $46.50 M $42.48 M
HOV direct access interchange – with flyover ramp to HOV facility
$35.74 M $21.62 M $21.04 M $19.84 M
Single point urban interchange at minor arterial crossroad
$47.06 M $28.15 M $27.40 M $25.77 M
Single point urban interchange at major arterial crossroad
$52.72 $31.15 M $29.96 M $27.13 M
Partial cloverleaf with 1 to 2 loop ramps and small footprint
$37.12 M $19.59 M $17.54 M $12.70 M
Partial cloverleaf with 3 loop ramps and large footprint
$43.08 M $22.53 M $20.19 M $14.56 M
Full cloverleaf with small footprint in sparsely developed location
$46.42 M $27.13 M $25.22 M $20.47 M
Full cloverleaf with large footprint in highly developed location
$56.42 M $31.79 M $29.27 M $23.07 M
Partial directional with 1 flyover ramp
$72.16 M $39.08 M $35.88 M $28.22 M
Partial directional with 2 flyover ramps
$88.55 M $49.17 M $45.79 M $37.76 M
Full directional with 2 flyover ramps
$97.31 M $57.98 M $54.50 M $43.88 M
Full directional with 3 flyover ramps
$138.98 M $82.04 M $77.64 M $65.14 M
Full directional with 4 flyover ramp $160.85 M $95.34 M $90.68 M $77.63 M
Fully directional with some HOV direct connections
$202.60 M $120.07 M $114.73 M $100.31 M
Fully directional for all GP and HOV movements
$245.11 M $145.11 M $139.01 M $123.30 M
*Does not include right of way, wetland mitigation, or I.T.S.

Planning Level Cost Estimation Manual
Page 18 of 75
Most of the interchange cost estimation is performed using default data (Exhibits A-3 and A-4), requiring little user input. What a user needs to do is to select an appropriate type of interchange from a menu of seven interchange types and then several sub categories for each type. The seven interchange types are selected from the input screen shown in Exhibit 9.
Exhibit 9: Interchange Selection Input Screen
Use this button to view examples of different interchange types.

Planning Level Cost Estimation Manual
Page 19 of 75
Often connecting crossroads would be widened to meet the added demand for access to the improved freeway or arterial. To account for this, crossroad improvement costs are estimated only when users select this item to be included in the cost estimates. Crossroad widening costs are estimated in a separate calculation module using the mainline widening costs for undivided arterial roadways and the related assumptions. Only two pieces of information are needed for crossroad estimates – length and number of lanes of crossroad to be improved. Exhibit 10 shows an example of data input screen.
Exhibit 10: Data Input Screen for Crossroad Improvements

Planning Level Cost Estimation Manual
Page 20 of 75
Intersections
Intersection improvement options include adding left-turn, right-turn and/or two-way-left-turn lanes, installing signals, and building roundabouts (Exhibit 11). Unlike most other items, roundabouts do not have a default unit cost, so the user has to input both the number of roundabouts and the cost for each.
Exhibit 11: Intersection Data Input Screen
Planning Level Cost Estimation Manual
Page 21 of 75
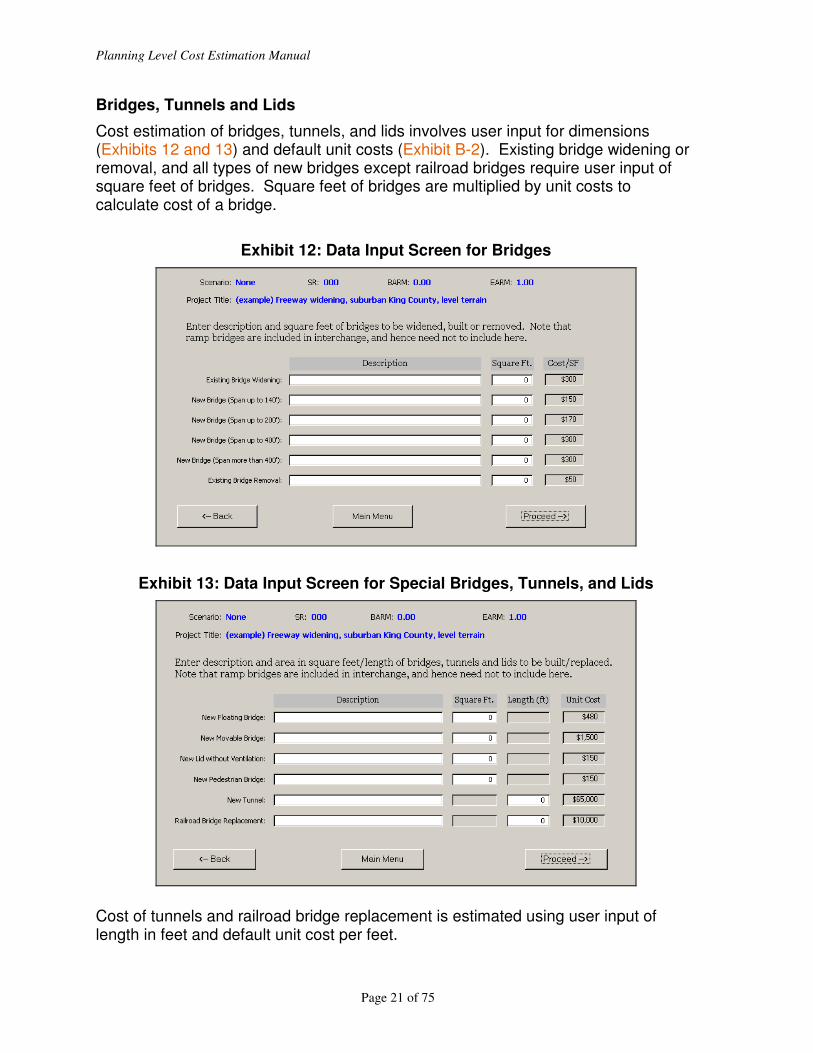
Bridges, Tunnels and Lids
Cost estimation of bridges, tunnels, and lids involves user input for dimensions (Exhibits 12 and 13) and default unit costs (Exhibit B-2). Existing bridge widening or removal, and all types of new bridges except railroad bridges require user input of square feet of bridges. Square feet of bridges are multiplied by unit costs to calculate cost of a bridge.
Exhibit 12: Data Input Screen for Bridges
Exhibit 13: Data Input Screen for Special Bridges, Tunnels, and Lids
Cost of tunnels and railroad bridge replacement is estimated using user input of length in feet and default unit cost per feet.

Planning Level Cost Estimation Manual
Page 22 of 75
Retaining Walls
Estimating retaining wall costs is a straightforward process. It requires the user to only input the square footage for each retaining wall. Retaining wall costs are calculated by multiplying wall surface area by unit cost per square foot for retaining walls. Exhibit 14 provides an example of the data input screen for retaining walls which can accommodate up to 10 walls.
Exhibit 14: Data Input Screen for Retaining Walls
Environmental
Environmental estimates include a number of items such as wetland and streams, drainage system, stormwater detention and treatment, noise walls, roadside restoration, and temporary water pollution control during construction. A brief description of each of these items follows. Wetland and Streams
The cost of wetland mitigation is based on the rating of the wetland and/or the type of wetland. Unit costs are assigned differentiating between wetlands based on their classification (i.e., sensitivity to disturbance, rarity, the functions they provide, and whether they can be replaced or not). Exhibit B-3 shows the default unit costs for wetland and streams by classification. Exhibit 15 describes wetland types considered in this tool.
Planning Level Cost Estimation Manual
Page 23 of 75
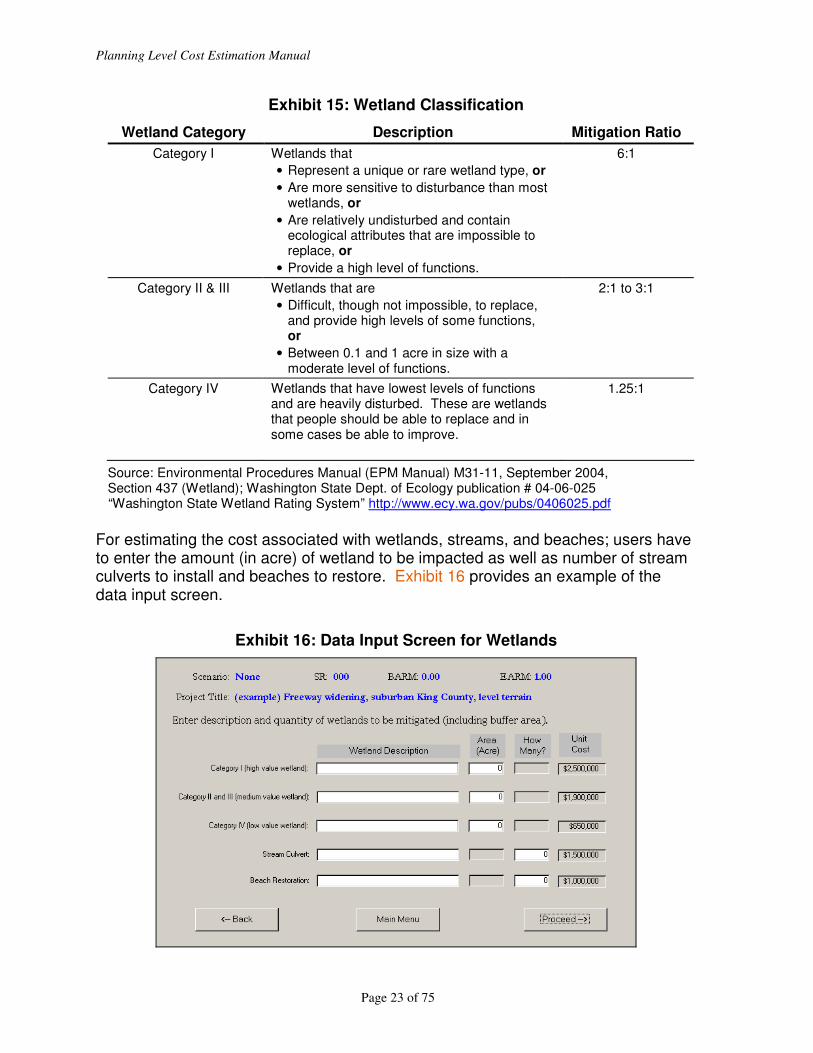
Exhibit 15: Wetland Classification
Wetland Category Description Mitigation Ratio
Category I Wetlands that
• Represent a unique or rare wetland type, or
• Are more sensitive to disturbance than most wetlands, or
• Are relatively undisturbed and contain ecological attributes that are impossible to replace, or
• Provide a high level of functions.
6:1
Category II & III Wetlands that are
• Difficult, though not impossible, to replace, and provide high levels of some functions, or
• Between 0.1 and 1 acre in size with a moderate level of functions.
2:1 to 3:1
Category IV Wetlands that have lowest levels of functions and are heavily disturbed. These are wetlands that people should be able to replace and in some cases be able to improve.
1.25:1
Source: Environmental Procedures Manual (EPM Manual) M31-11, September 2004, Section 437 (Wetland); Washington State Dept. of Ecology publication # 04-06-025 “Washington State Wetland Rating System” http://www.ecy.wa.gov/pubs/0406025.pdf
For estimating the cost associated with wetlands, streams, and beaches; users have to enter the amount (in acre) of wetland to be impacted as well as number of stream culverts to install and beaches to restore. Exhibit 16 provides an example of the data input screen.
Exhibit 16: Data Input Screen for Wetlands

Planning Level Cost Estimation Manual
Page 24 of 75
Cost of wetland mitigation is calculated based on users’ input of areas of impact and default unit cost per acre. Stream culvert and beach restoration are assigned a lump sum cost per each.
Drainage System
Drainage costs were calculated from past project experience. The treatment and conveyance costs were determined based on the four project setting types (dense-urban, urban, suburban, and rural). Rural areas were assumed to be 100 percent ditch conveyance as opposed to dense urban which were assumed to be 100 percent pipe conveyance systems. The intermediate conditions were proportioned with percentage splits of these two methods and their relative costs. The program calculates drainage systems cost based on the user input data entered elsewhere, no additional input is required. Stormwater Detention and Treatment
Stormwater detention and treatment system is assumed to be detention pond and water quality pond for rural and suburban areas. Stormwater detention and treatment costs are calculated using: 50% by ponds and 50% by vaults in urban areas, and 10% by ponds and 90% by vaults in dense urban areas. Costs are estimated using default quantities per lane-mile and default unit costs. No additional user input is necessary. Noise Walls
Noise wall costs are estimated with an average height (25 feet) and a unit cost associated with this average height. Therefore, it requires only user input of length (in feet) of each wall. Exhibit 17 provides an example of data input screen, which can accommodate up to 10 noise walls.
Exhibit 17: Data Input Screen for Noise Walls

Planning Level Cost Estimation Manual
Page 25 of 75
Costs for noise walls are calculated based on user input of wall length and the default cost per linear foot (Exhibit B-2) Roadside Restoration
A lump sum cost is assigned to roadside restoration per lane-mile. This cost varies by geographic area as well as development density in each geographic area. Default costs are shown in Exhibit B-1. No user input required. Temporary Water Pollution Control
Cost of temporary water pollution control during construction is estimated as a percent of construction cost. A 3% factor is used for all estimates (Exhibit B-5). Right of Way
Right of way costs are estimated by using per acre unit costs for vacant land, and residential and commercial properties that accounts for variations not only by county, but also by development density within each county. In order to estimate project cost, users need to enter amount of right of way (ROW) needs in acres by vacant land, residential, and commercial properties (Exhibit 18). In addition to inflation ROW costs will increase due to build out condition with respect to zoning, therefore, it is suggested to use zoned classifications not visual opinions to classify the ROW type. Number of impacted parcels, residential units, and businesses are not part of the calculation and hence it is optional to enter such data.
Exhibit 18: Example of Right of Way Data Input Screen
The amount of right of way need is multiplied by the default unit costs in Exhibit B-4. However, users would be able to change the default values to reflect the local

Planning Level Cost Estimation Manual
Page 26 of 75
conditions, if needed. Right of way default unit costs can be updated using the button “Edit Project Data or Unit Cost” shown in Exhibit 2. Intelligent Transportation System
The tool offers two options for intelligent transportation system (ITS) cost estimation – default cost and user input specific cost. No input is required when choosing the option for default cost per lane-mile. For the other option, the user has to specify quantity of WMS, CCTV, HARS, HART, data stations, fiber optic terminal cabinet, ramp meters, and number of signals to coordinate (Exhibit 19). In addition, the user has to provide length of ITS conduit and fiber optic cable, if any. Default unit costs are shown in Exhibit B-7.
Exhibit 19: ITS Data Input Screen
Planning Level Cost Estimation Manual
Page 27 of 75
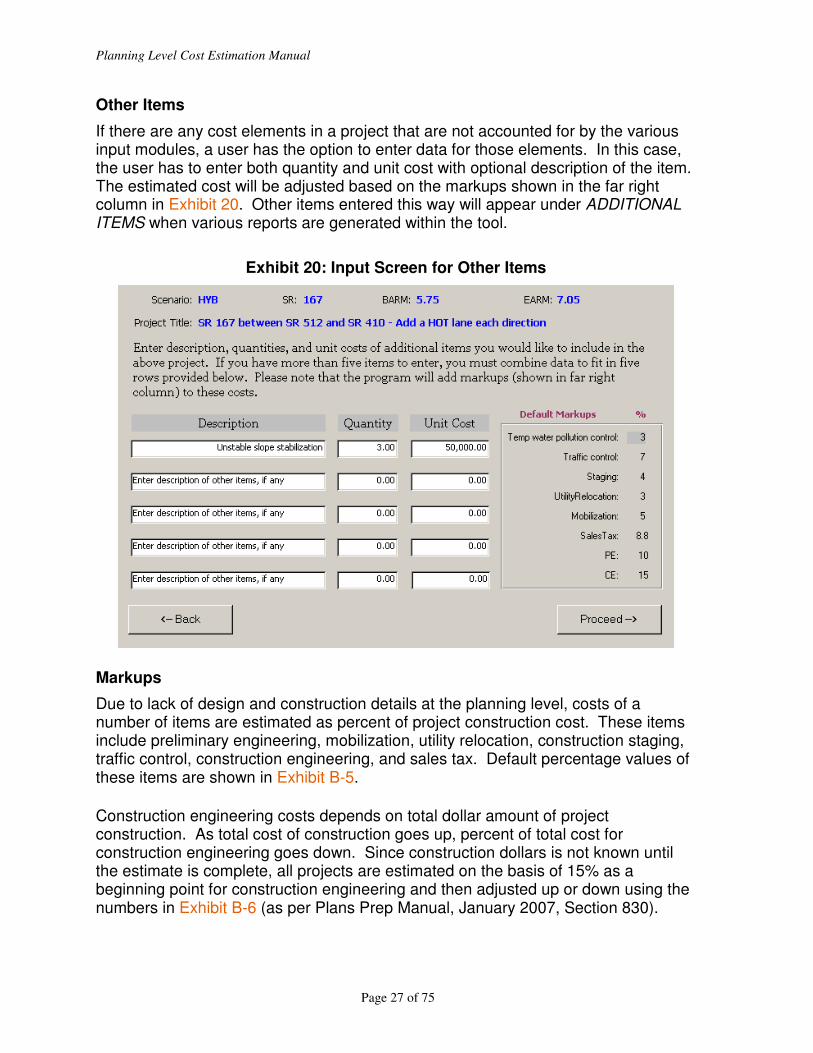
Other Items
If there are any cost elements in a project that are not accounted for by the various input modules, a user has the option to enter data for those elements. In this case, the user has to enter both quantity and unit cost with optional description of the item. The estimated cost will be adjusted based on the markups shown in the far right column in Exhibit 20. Other items entered this way will appear under ADDITIONAL ITEMS when various reports are generated within the tool.
Exhibit 20: Input Screen for Other Items
Markups
Due to lack of design and construction details at the planning level, costs of a number of items are estimated as percent of project construction cost. These items include preliminary engineering, mobilization, utility relocation, construction staging, traffic control, construction engineering, and sales tax. Default percentage values of these items are shown in Exhibit B-5. Construction engineering costs depends on total dollar amount of project construction. As total cost of construction goes up, percent of total cost for construction engineering goes down. Since construction dollars is not known until the estimate is complete, all projects are estimated on the basis of 15% as a beginning point for construction engineering and then adjusted up or down using the numbers in Exhibit B-6 (as per Plans Prep Manual, January 2007, Section 830).
Planning Level Cost Estimation Manual
Page 28 of 75
Uncertainty
Generally planning level estimates are performed with no design information. Therefore, many unknown factors may lead to changes in the estimates later on. This is why the project costs are estimated as a range of probable costs and not as a single cost number. The single project cost value is only one possibility within the entire range of probable costs assigned to the estimate. The cost risk factors are applied to all projects in all regions regardless of project or corridor type. The final costs range from minus 10 percent to plus 20 percent of the initial estimated amount.

Planning Level Cost Estimation Manual
Page 29 of 75
Planning Level Cost Estimation Manual
Page 30 of 75
INFLATION MODULES AND USER INPUTS
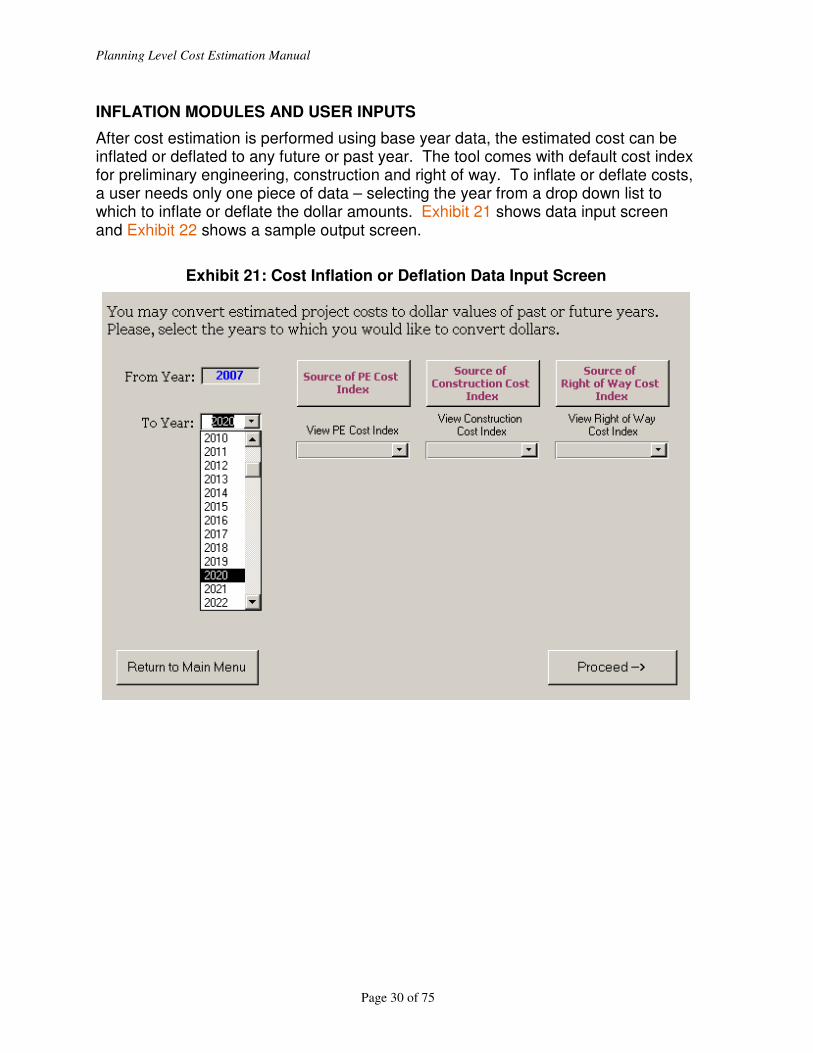
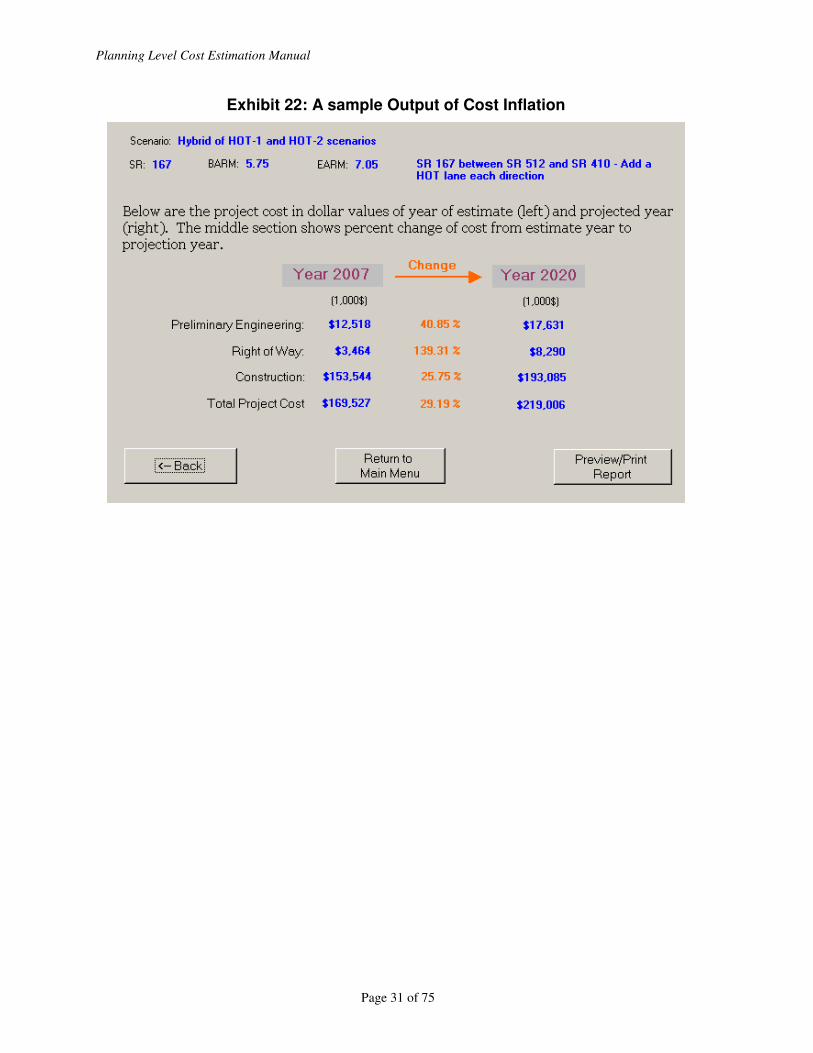
After cost estimation is performed using base year data, the estimated cost can be inflated or deflated to any future or past year. The tool comes with default cost index for preliminary engineering, construction and right of way. To inflate or deflate costs, a user needs only one piece of data – selecting the year from a drop down list to which to inflate or deflate the dollar amounts. Exhibit 21 shows data input screen and Exhibit 22 shows a sample output screen.
Exhibit 21: Cost Inflation or Deflation Data Input Screen
Planning Level Cost Estimation Manual
Page 31 of 75
Exhibit 22: A sample Output of Cost Inflation

Planning Level Cost Estimation Manual
Page 32 of 75

Planning Level Cost Estimation Manual
Page 33 of 75
BENEFIT/COST MODULES AND USER INPUTS
Once cost estimation of a project is complete, a user has the option to perform benefit-cost analysis. This is feasible only if the user has data related to travel time savings. More specifically the user has to have vehicle hour travel (VHT) data for build and no build conditions in base and horizon years. Exhibit 23 shows options available in benefit-cost analysis module. When the option “Select a Project for B-C Analysis” is chosen, the user is prompted to select a project from a drop down list to perform B-C analysis.
Exhibit 23: B-C Analysis Main Menu
Planning Level Cost Estimation Manual
Page 34 of 75
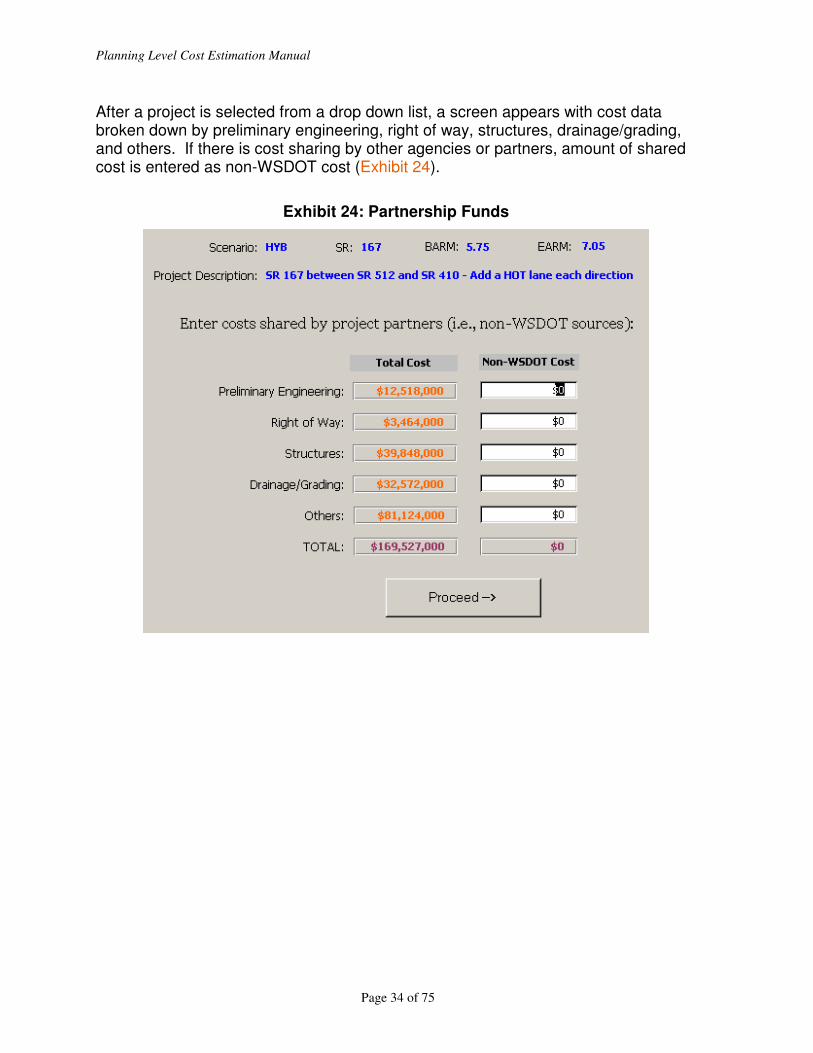
After a project is selected from a drop down list, a screen appears with cost data broken down by preliminary engineering, right of way, structures, drainage/grading, and others. If there is cost sharing by other agencies or partners, amount of shared cost is entered as non-WSDOT cost (Exhibit 24).
Exhibit 24: Partnership Funds

Planning Level Cost Estimation Manual
Page 35 of 75
Analysis period and remaining life for preliminary engineering, right of way, structures, drainage/grading and other items are entered as shown in Exhibit 25. The tool allows changing any of the default values shown below.
Exhibit 25: Analysis Period and Salvage Value Data
Planning Level Cost Estimation Manual
Page 36 of 75
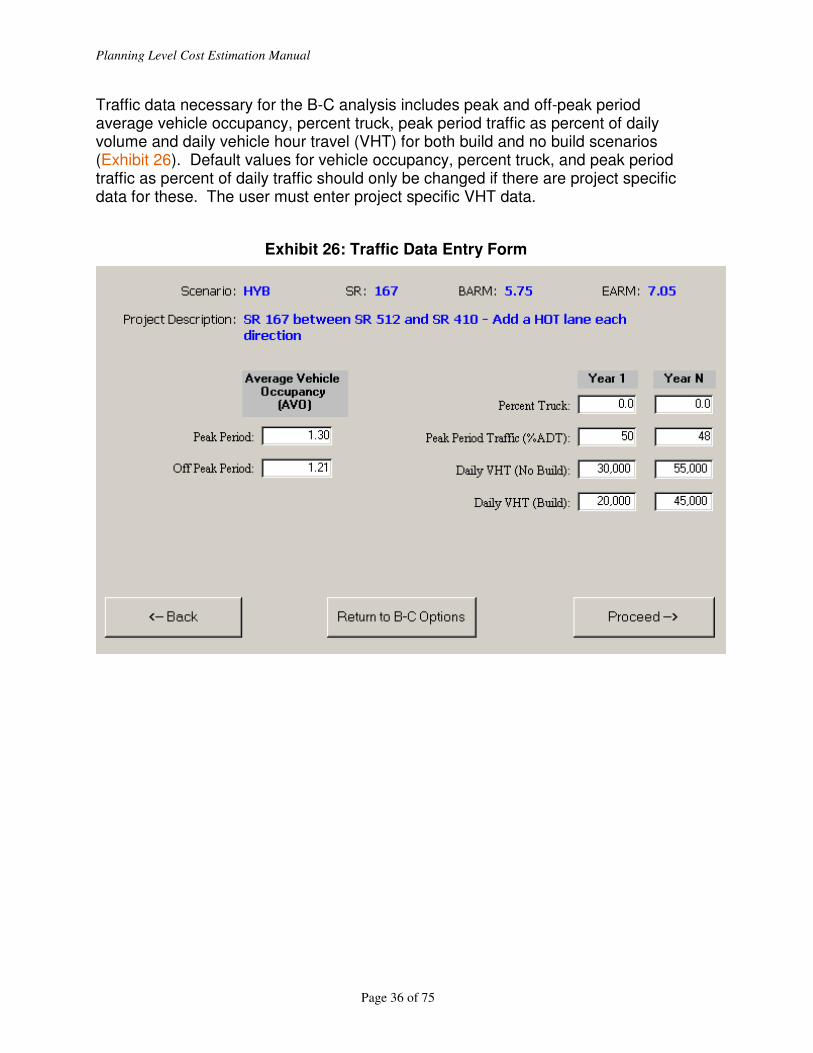
Traffic data necessary for the B-C analysis includes peak and off-peak period average vehicle occupancy, percent truck, peak period traffic as percent of daily volume and daily vehicle hour travel (VHT) for both build and no build scenarios (Exhibit 26). Default values for vehicle occupancy, percent truck, and peak period traffic as percent of daily traffic should only be changed if there are project specific data for these. The user must enter project specific VHT data.
Exhibit 26: Traffic Data Entry Form

Planning Level Cost Estimation Manual
Page 37 of 75
The B-C analysis uses collision data for property damage, injury and fatality as shown in Exhibit 27. All collision data are entered as total of most recent three years. The tool applies cost per accident as shown below.
Exhibit 27: Collision Data

Planning Level Cost Estimation Manual
Page 38 of 75
Once collision data entry is complete, the tool brings another screen to select construction items that are part of the project (Exhibit 28). This helps to estimate percent reduction of each type of collisions. The bottom line in Exhibit 28 shows combined reduction from all the selected items.
Exhibit 28: Collision Reduction Factors

Planning Level Cost Estimation Manual
Page 39 of 75
After entering all necessary data, the tool displays a summary of all entries for review (Exhibit 29). If changes need to be made at this time use the back buttons to return to the appropriate input screen and make the necessary changes.
Exhibit 29: Summary of Input Data for Review
If Perform B-C Analysis is chosen as shown above, an option window appears to select one of the two options for printing B-C reports – either for a selected project or all projects. A one page report is generated for each project (see the section PRINTING REPORTS). Project specific and global data can be edited by selecting editing option from the B-C Main Menu (Exhibit 23). If project specific data editing option is selected, a screen appears to select a project from the drop down list. Once a project is selected, a number of screens (as shown in Exhibits 24 to 29) will appear for editing data entered earlier. If global data editing option is selected, a screen (Exhibit 30) appears with all default or earlier entered data that allows editing any data.

Planning Level Cost Estimation Manual
Page 40 of 75
Exhibit 30: Summary of Input Data for Review

Planning Level Cost Estimation Manual
Page 41 of 75

Planning Level Cost Estimation Manual
Page 42 of 75
EDITING DATA
The tool has editing modules that provide ways of updating project specific as well as global data. Project specific data is divided into user input data and program default data. The user input data is the data that was input to describe the project. The program default data is used internally to calculate quantities and costs and can be either project specific or global affecting all projects in the database. The tool allows editing of each type of data through a series of modules which are discussed in the following sections. The screen below shows how to start editing a project.
Exhibit 31: Main Menu Selection for Editing
Exhibit 32 on the following page is a flow chart for the editing process within the tool.
Proceed to edit user input data describing a specific project or program default data used to calculate project quantities and costs.

Planning Level Cost Estimation Manual
Page 43 of 75
Exhibit 32: Editing Process Flow Chart
Edit ITS Unit
costs
Project Markups
Edit Project
Specific Data
Default QuantitiesUnit Costs
Edit Options
Editing in the PLCE Tool
Editing Modules:
- Mainline Quantities
- Crossroad Quantities
- Ramp Quantities
- Interchange Quantities
- Intersection Quantities
- Engineering %'s
User Input Project
Data Screens
Edit User Input Data
Edit Project Specific Program Default Data
Select the Project
to Edit
Default Quantities Edit
Screens
Edit Global
Variables
Resets the base
year and updates unit costs
Edit Wetland
Mitigation Unit Costs
Review EstimateUpdates unit cost
in the current base year
Edit Defualt Quantities
Edit Right of Way
Unit Costs
Edit Construction
Unit Costs
(Same input screens
as for entering
project data.)
(Return to Edit
Options)
(Goto Main
Menu)
Change
Base Year?
(Yes) (No)
Review Estimate
Review Estimate
(Goto Preview and
Print Report Options)
(Goto Preview and
Print Report
Options)
Edit Project Markups
(From Main Menu)
Save Data
Save Data
(Return to Edit
Options)
Save Data
(Goto Preview and
Print Report
Options)
(Return to Edit
Options)
(Return to Edit
Unit Costs)
User Edit Interface
PLCE Tool Navagation Screens
Legend

Planning Level Cost Estimation Manual
Page 44 of 75
Project Specific User Input Data
Editing user input data is done through the same series of modules that were used when initially entering the data. The user is taken through the same screens as the initial project input screens described in the section “Calculation Modules and Required User Inputs”. The user is prompted to choose the type of edit in the screen shown below. In this example editing project specific data was chosen. The user then chooses from a drop down list of all the projects currently in the database.
Exhibit 33: Edit Options Screens
Proceed to edit the user input data describing a specific project or the program default data for a specific project.
Select a specific project for editing.

Planning Level Cost Estimation Manual
Page 45 of 75
The user can now choose the type of project specific data to be edited. When Edit Project Specific Data is chosen, the editing session stores project information in the same temporary location that new project information is stored. Data is kept in that temporary location until an estimate is completed. An estimate is completed when the button “Perform Estimate” has been pushed. To prevent the unwanted overwriting of project information stored in this temporary location, a warning message reminds users to complete the project already in the temporary location. To verify if there is a project remaining in the temporary location all a user has to do is return to the main menu and start a new project. If there was project information already stored in the temporary location it will be reloaded into the project information inputs screens and the user only need to push the proceed buttons until reaching the “Perform Estimate” button. As soon as the “Perform Estimate” button is pushed cost estimation is performed and the project data is copied from the temporary location to a permanent location in the database.

Planning Level Cost Estimation Manual
Page 46 of 75
In the following example the user chooses to edit the user input data and is taken to the project information input screens.
Exhibit 34: Edit User Input Data Screens
Warning Message: Data is stored in a temporary table when it is being entered or modified. It will remain in that table until “Perform Estimate” has been chosen. This warning allows for reconsideration as to whether or not there may be data in the temporary table that should be saved prior to beginning an editing session.
The editing modules use the same program modules and input screens as those for entering a project. The appearance and function of the input screens are the same as when the project was first entered. (See Calculation Modules and User Inputs)
Edit user input data describing the specific project selected.

Planning Level Cost Estimation Manual
Page 47 of 75
Project Specific Program Default Data
Some of the program default variables can be edited for a specific project. Program default variables are used to make internal calculations and produce an estimate. There are two basic types of program default variables one for quantities and one for unit costs. Default variables for quantities can be edited for a specific project. For example if there is likely to be significantly more earthwork on a particular project the quantities for earthwork can be adjusted for that project only. Default variables for costs are considered regional and can not be edited on a project by project basis. The user can edit project specific default quantities though a series of interfaces each of which shows the aggregate quantities for a portion of the project. For example the quantities shown on the screen for editing new interchanges is the sum of all interchanges on the project. In the example below the user chooses to edit the program default quantities for the selected project. The next screen asks which of six sets of quantity data is to be edited.
Exhibit 35: Edit Program Default Data Screens
The six sets of quantity data are used in the calculation modules to produce project quantities which are then applied to the unit costs to arrive at the project costs.
Edit program default data used in calculating quantities and costs for the specific project selected.
Planning Level Cost Estimation Manual
Page 48 of 75
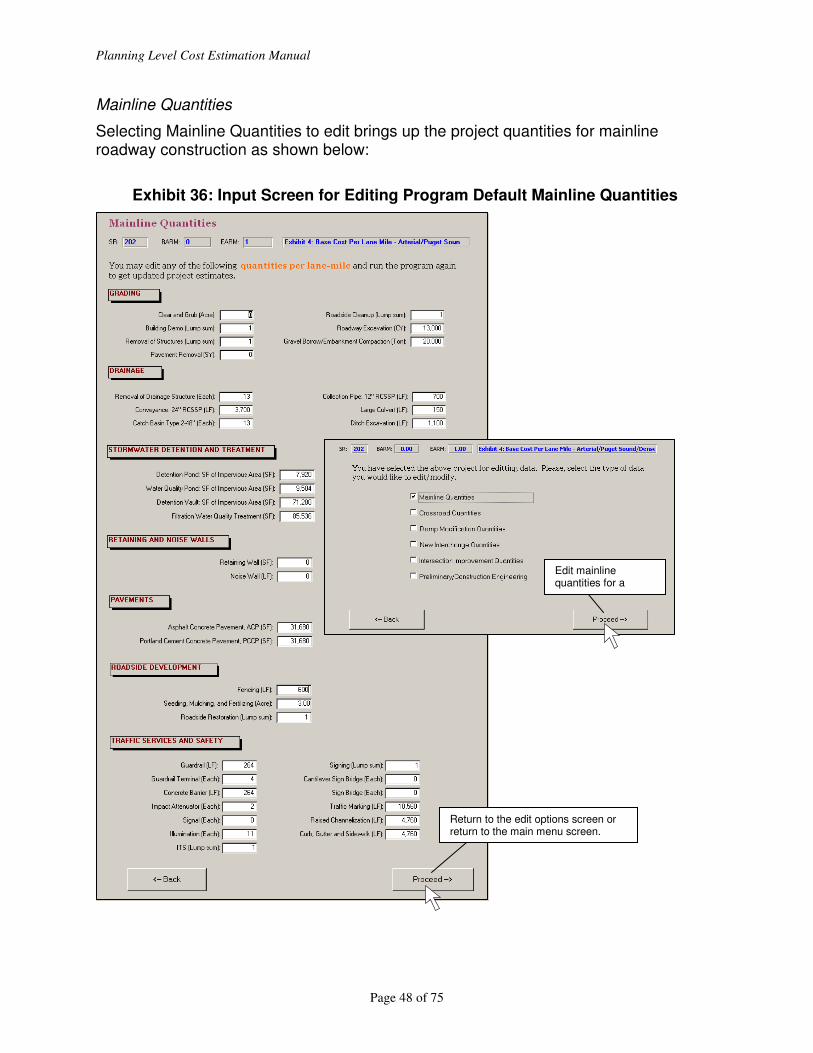
Mainline Quantities
Selecting Mainline Quantities to edit brings up the project quantities for mainline roadway construction as shown below:
Exhibit 36: Input Screen for Editing Program Default Mainline Quantities
Return to the edit options screen or return to the main menu screen.
Edit mainline quantities for a specific project.
Planning Level Cost Estimation Manual
Page 49 of 75
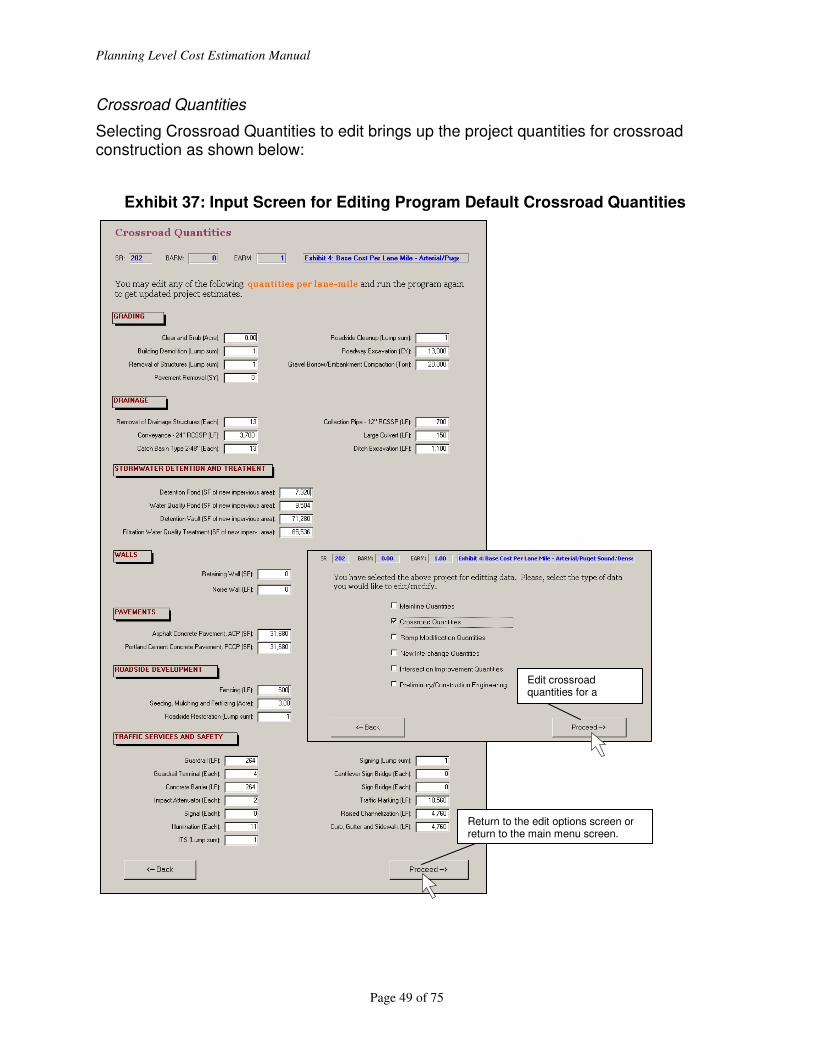
Crossroad Quantities
Selecting Crossroad Quantities to edit brings up the project quantities for crossroad construction as shown below:
Exhibit 37: Input Screen for Editing Program Default Crossroad Quantities
Edit crossroad quantities for a
Return to the edit options screen or return to the main menu screen.

Planning Level Cost Estimation Manual
Page 50 of 75
Ramp Modification Quantities
Selecting Ramp Modification Quantities to edit brings up the project quantities for modifying ramps to accommodate mainline widening. The ramp modification editing screen is shown below:
Exhibit 38: Input Screen for Editing Program Default Ramp Modification Quantities
Edit ramp modification quantities for a
Return to the edit options screen or return to the main menu screen.

Planning Level Cost Estimation Manual
Page 51 of 75
New Interchange Quantities
Selecting New Interchanges to edit brings up the project quantities for new interchanges. (In this example there were no interchanges in the project.) The editing screen is shown below:
Exhibit 39: Input Screen for Editing Program Default New Interchange Quantities
Edit new interchange quantities for a specific project.
Return to the edit options screen or return to the main menu screen.
Planning Level Cost Estimation Manual
Page 52 of 75
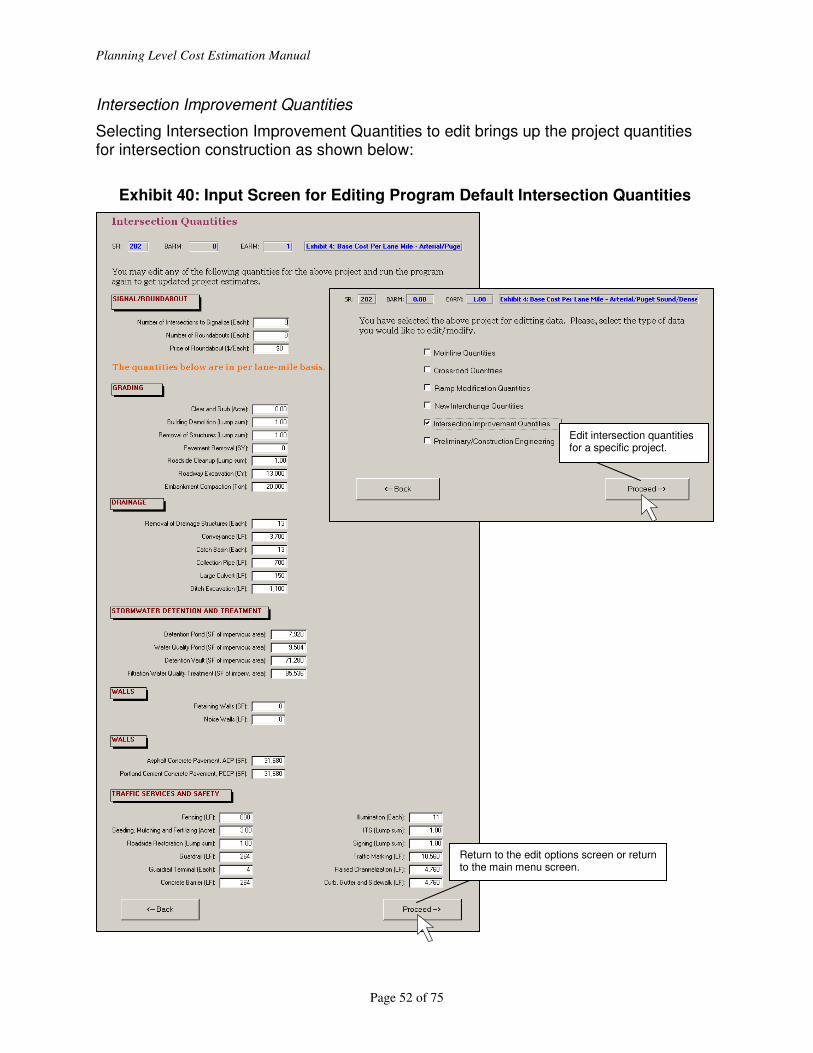
Intersection Improvement Quantities
Selecting Intersection Improvement Quantities to edit brings up the project quantities for intersection construction as shown below:
Exhibit 40: Input Screen for Editing Program Default Intersection Quantities
Edit intersection quantities for a specific project.
Return to the edit options screen or return to the main menu screen.

Planning Level Cost Estimation Manual
Page 53 of 75
Preliminary/Construction Engineering
Selecting Preliminary/Construction Engineering allows the editing of the engineering costs for a particular project. Preliminary Engineering (PE) is set at a constant ten percent. Construction Engineering (CE) varies based on formulas in the Plans Prep Manual, June 2003, Page 8-5. Both PE and CE for a particular project can be changed from the defaults using the screens shown below.
Exhibit 41: Input Screen for Editing PE and CE Percentages
Edit engineering costs for a specific project.
Return to the edit options screen or return to the main menu screen.

Planning Level Cost Estimation Manual
Page 54 of 75
Global Variables
There are three types of global variables – costs, quantities, and markups. There are two main reasons for editing global variables. One is to update the base year based on new cost data (i.e. cost data from recently completed construct projects) and is covered in section “Editing Unit Cost Global Default Variables”. The other is to edit the costs, quantities, and markups to be more representative of a particular region or set of projects. The image below shows the available options for editing global variables.
Exhibit 42: Edit Global Variables
Edit unit costs for all projects.
Planning Level Cost Estimation Manual
Page 55 of 75
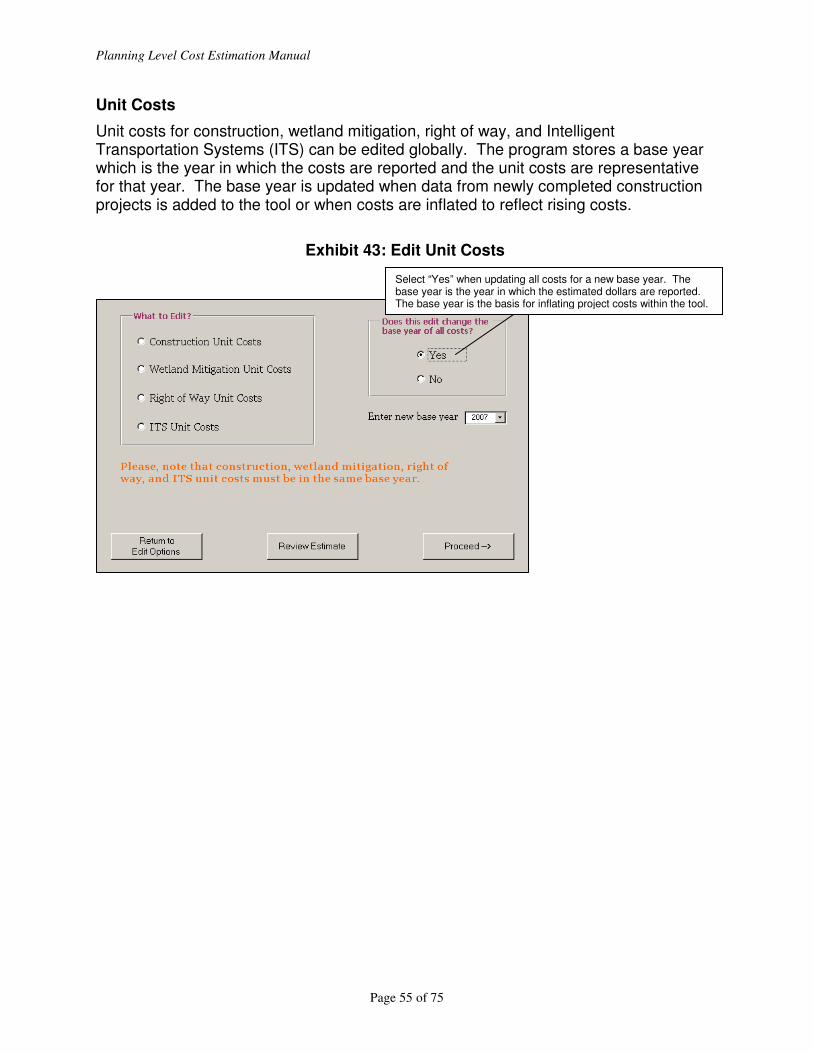
Unit Costs
Unit costs for construction, wetland mitigation, right of way, and Intelligent Transportation Systems (ITS) can be edited globally. The program stores a base year which is the year in which the costs are reported and the unit costs are representative for that year. The base year is updated when data from newly completed construction projects is added to the tool or when costs are inflated to reflect rising costs.
Exhibit 43: Edit Unit Costs
Select “Yes” when updating all costs for a new base year. The base year is the year in which the estimated dollars are reported. The base year is the basis for inflating project costs within the tool.

Planning Level Cost Estimation Manual
Page 56 of 75
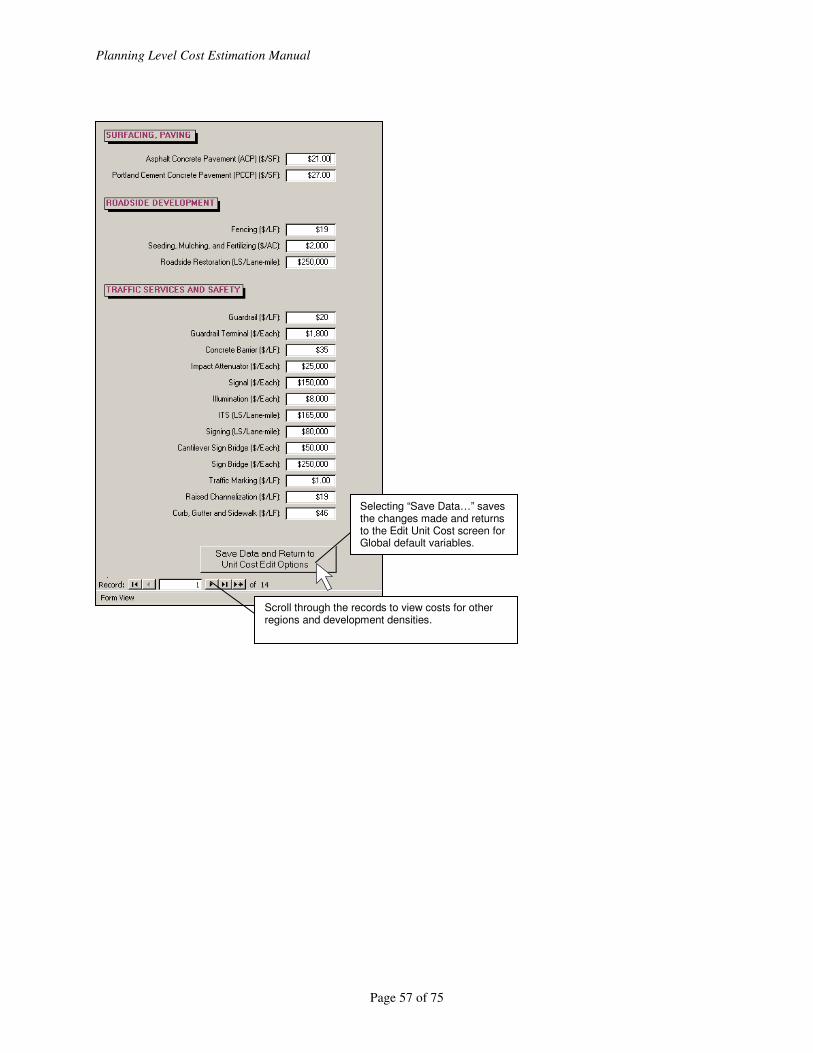
In the following four sections the examples shown are not updating the base year but the input screens look and operate the same as when updating the base year. Construction Unit Costs
There are 14 different sets of construction costs representing different areas and development densities (see the section “Roadway Mainline” and Exhibit 6). Construction unit costs are used in calculating many components of a project including crossroads, intersections, ramp modifications, and interchanges.
Exhibit 44: Input Screens for Editing Construction Unit Costs
(Continued on next page)
Edit the program default unit costs for construction items.
Planning Level Cost Estimation Manual
Page 57 of 75
Selecting “Save Data…” saves the changes made and returns to the Edit Unit Cost screen for Global default variables.
Scroll through the records to view costs for other regions and development densities.
Planning Level Cost Estimation Manual
Page 58 of 75
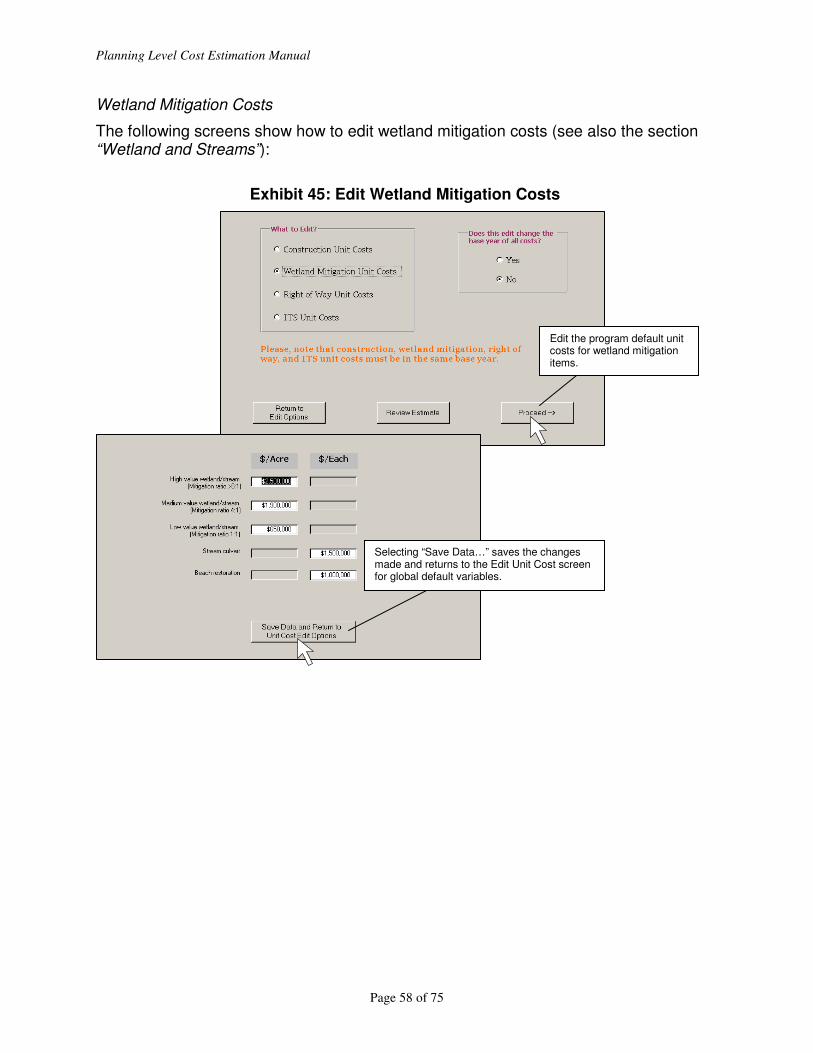
Wetland Mitigation Costs
The following screens show how to edit wetland mitigation costs (see also the section “Wetland and Streams”):
Exhibit 45: Edit Wetland Mitigation Costs
Selecting “Save Data…” saves the changes made and returns to the Edit Unit Cost screen for global default variables.
Edit the program default unit costs for wetland mitigation items.
Planning Level Cost Estimation Manual
Page 59 of 75
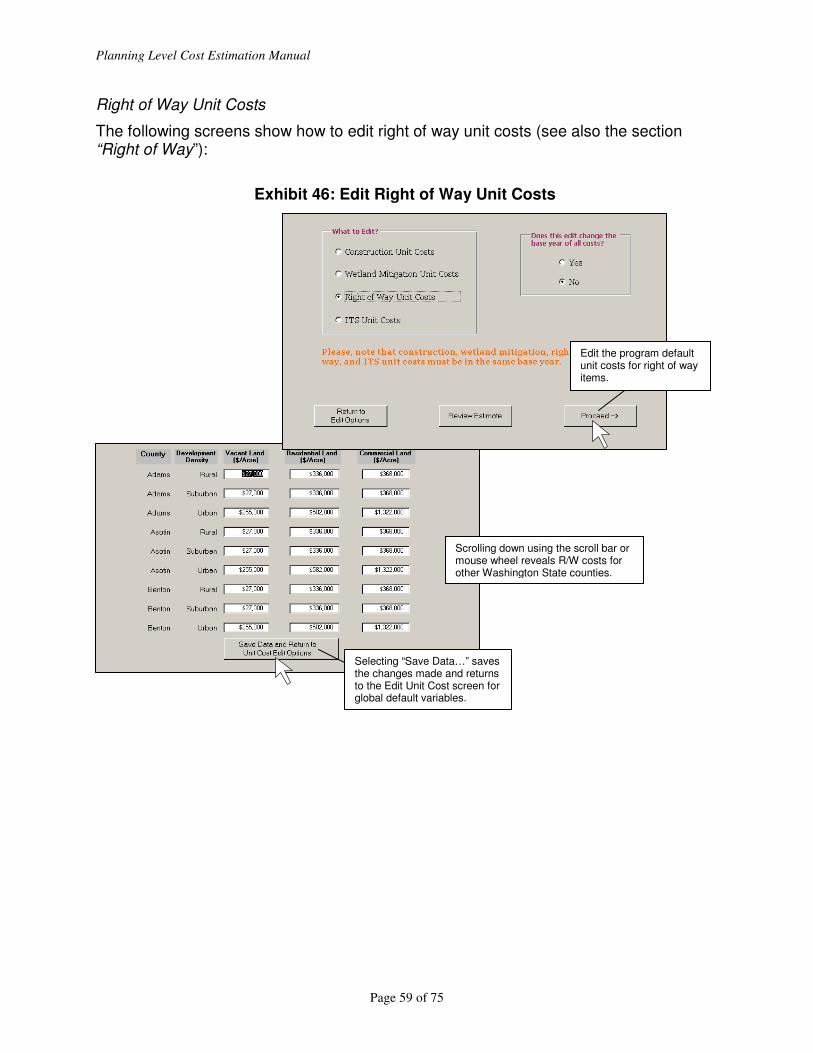
Right of Way Unit Costs
The following screens show how to edit right of way unit costs (see also the section “Right of Way”):
Exhibit 46: Edit Right of Way Unit Costs
Scrolling down using the scroll bar or mouse wheel reveals R/W costs for other Washington State counties.
Selecting “Save Data…” saves the changes made and returns to the Edit Unit Cost screen for global default variables.
Edit the program default unit costs for right of way items.

Planning Level Cost Estimation Manual
Page 60 of 75
ITS Unit Costs
The following screens show how to edit ITS costs.
Exhibit 47: Edit ITS Unit Costs
Selecting “Save Data…” saves the changes made and returns to the Edit Unit Cost screen for global default variables.
Edit the program default unit costs for intelligent transportation systems items.

DDDRRRAAAFFFTTT DDDRRRAAAFFFTTT DDDRRRAAAFFFTTT
Page 61 of 75
Default Quantities
Only mainline construction default quantities can be edited globally. There are 28 different sets of mainline construction default quantities representing different areas, development densities, and roadway types (see the section Roadway Mainline). The mainline construction default quantities for arterial roadways are used in calculating arterial roadway quantities, crossroad quantities, and intersection quantities. They are components in ramp modification and each of the 22 interchange types. Mainline construction default quantities for freeways are also a component of each interchange type as well as freeway costs. The following screens show how to edit mainline construction default quantities.
Exhibit 48: Edit Mainline Default Quantities
Scroll through records to view quantities for other regions, roadway types, and development densities (i.e. Suburban Spokane Freeway, Urban Vancouver Arterial, etc).
Select “Review Estimate” to see how the changes effect estimates already in the database.
Selecting “Save Data…” saves the changes made and returns to the Edit Option screen.
Edit the program default quantity for all projects.

DDDRRRAAAFFFTTT DDDRRRAAAFFFTTT DDDRRRAAAFFFTTT
Page 62 of 75
Default Markups
There are 14 different sets of default markups representing different areas and development densities. Default markups are applied as a percentage of construction costs and are shown below:
Exhibit 49: Edit Default Markups
Selecting “Save Data…” saves the changes made end returns to the Edit Option screen.
Select “Review Estimate” to see how the changes effect estimates already in the database.
Scroll through the records to view markups for other regions and development densities.
Edit the program default markups for all projects.

DDDRRRAAAFFFTTT DDDRRRAAAFFFTTT DDDRRRAAAFFFTTT
Page 63 of 75

DDDRRRAAAFFFTTT DDDRRRAAAFFFTTT DDDRRRAAAFFFTTT
Page 64 of 75
PRINTING REPORTS
The tool provides two options for printing – cost reports or benefit/cost reports. Once an option is selected, another window appears prompting to choose one of the two options – a selected project or all projects. If the option “a selected project” is chosen, a user can select the desired project from a drop down list. In case of cost reports, a user will be prompted to choose one of the five types of reports to print (as shown in the figure below).
The cost reports vary in size ranging from one page summary to multi-page detailed reports. When the option “All of Above Reports” is selected, all types of reports are sent to default printer and printed. There is only one report for the benefit/cost analysis. Sample of a one-page cost summary report and a benefit/cost report have been shown in the following pages.

DDDRRRAAAFFFTTT DDDRRRAAAFFFTTT DDDRRRAAAFFFTTT
Page 65 of 75
Exhibit 50: Sample Cost Summary Report
Planning Level Cost Estimate* Summary (2007 dollars)
SR: 167 Beginning ARM: 5.75 Ending Arm: 7.05 Length(mile): 1.30
Project Title: SR 167 between SR 512 and SR 410 - Add a HOT lane each direction
# of NoBuild Lane(s) in NB/EB: 2 # of Build Lane(s) in NB/EB: 3.33
# of NoBuild Lane(s) in SB/WB: 2 # of Build Lane(s) in SB/WB: 3.33
Improvement Type: HOT Terrain Type: L
PRELIMINARY ENGINEERING $12,537,000 ENVIRONMENTAL MITIGATION RIGHT-OF-WAY $3,464,000 Drainage: $9,027,000 Stormwater Detention and $8,415,000 CONSTRUCTION / PREPARATION Temporary Water Pollution Control: $3,083,000 Mobilization: $5,138,000 Utility Relocation: $3,083,000 Wetland Mitigation: $4,825,000 Grading: $23,544,000 Roadside Development: $3,513,000
Staging: $4,110,000 TRAFFIC Construction Engineering: $12,537,000 Traffic Services and Safety: $13,199,000 STRUCTURES Workzone Traffic Control: $7,193,000 Bridges and Tunnels: $37,648,000 Retaining Walls: $2,200,000 ADDITIONAL ITEMS $151,000
Noise Walls: $0 SALES TAX $11,032,000
PAVEMENT $5,063,000 TOTAL PROJECT COST $169,764,000
Project Cost Summary:
Low High
PE $11,283,000 $15,044,000 ROW $3,118,000 $4,157,000
CN $138,387,000 $184,516,000 Total $152,788,000 $203,717,000
Note: Generally planning estimates are done with no design information.
Therefore, many unknown factors may lead to changes in the estimates later on.
This is why a range approach has been used in reporting project costs. Low
is10% below and high is 20% above the estimated cost.
* This estimate is based on little or no design work, and hence intended for use for planning
Date Printed: Tuesday, December 30, 2008

DDDRRRAAAFFFTTT DDDRRRAAAFFFTTT DDDRRRAAAFFFTTT
Page 66 of 75
Exhibit 51: Sample B-C Report
Planning Level Cost and Benefit* (2007
Scenario: HYB SR: 167 Beginning ARM: 5.75 Ending ARM: 7.05
Project Title: SR 167 between SR 512 and SR 410 - Add a HOT lane each direction
Analysis Period (yrs): 20 Discount Rate (%): 4.00
PRELIMINARY ENGINEERING: $12,537,000
RIGHT OF WAY: $3,464,000
STRUCTURES (Bridges, Retaining walls, Noise walls): $39,848,000
DRAINAGE/GRADING: $32,572,000
OTHERS (Stormwater treatment, Pavements, Roadside development, Traffic operations and safety, Wetland mitigation, Construction engineering, etc.): $81,342,000
TOTAL COST: $169,764,000
Cost Shared by Project Partners: $0
Present Value of Operation and Maintenance Cost: $2,624,000
Present Value of Cost: $140,665,000
Present Value of Travel Time Saving Benefit: $628,897,000
Present Value of Safety Benefit: $0
Present Value of Benefit: $628,897,000
Benefit-Cost Ratio: 4.47
* This estimate is based on little or no design work, and therefore, many unknown factors may lead
to changes in the estimates later on. Hence the estimates are intended for use for planning purposes
only.
Date Printed: Tuesday, December 30, 2008

DDDRRRAAAFFFTTT DDDRRRAAAFFFTTT DDDRRRAAAFFFTTT
Page 67 of 75

DDDRRRAAAFFFTTT DDDRRRAAAFFFTTT DDDRRRAAAFFFTTT
Page 68 of 75
APPENDIX A: DEFAULT QUANTITIES
Exhibit A-1: Default Quantities per Lane-Mile for Limited Access Roadways in Central Puget Sound Region
Quantities per Lane-Mile Item Unit
Rural Suburban Urban Dense Urban
Grading
Clear and grub Acre 3.00 3.00 3.00 0.00
Building demolition LS/lane-mile 1 1 1 1
Removal of structure LS/lane-mile 1 1 1 1
Pavement removal SY 0 0 0 0
Roadside cleanup LS/lane-mile 1 1 1 1
Roadway excavation * CY - - - -
Gravel borrow/embank. Compaction * Ton - - - -
Drainage
Remove drainage structures Each 4 4 9 14
Conveyance: 24” RCSSP LF 500 500 2,640 3,960
Catch basin type 2 – 48” Each 3 3 9 14
Collection pipe: 12” PCSSP LF 400 400 500 900
Large culverts LF 200 200 150 200
Ditch excavation LF 1,400 1,400 2,640 600
Stormwater Treatment
Detention pond SF of Imp. 79,200 79,200 39,600 7,920
Water quality pond SF of Imp. 95,040 95,040 47,520 9,504
Detention vaults SF of Imp. 0 0 39,600 71,280
Filtration treatment SF of Imp. 0 0 47,520 85,536
Paving
Asphalt concrete pavement SF 63,360 63,360 63,360 31,680
Portland cement conc. pavement SF 0 0 0 31,680
Structures
Bridge SF User input User input User input User input
Retaining wall SF User input User input User input User input
Noise wall LF User input User input User input User input
Roadside Development
Fencing LF 700 700 1,400 2,700
Seeding, mulching and fertilizing Acre 3 3 3 3
Roadside restoration LS/lane-mile 1 1 1 1
Traffic Services and Safety
Guardrail LF 700 700 5,280 2,700
Guardrail terminals Each 10 10 10 10
Concrete barrier LF 150 150 5,280 8,000
Impact attenuator Each 1 1 1 2
Signals Each User input User input User input User input
Illumination Each 0 0 0 11
Intelligent transportation system LS/lane-mile 1 1 1 1
Signing LS/lane-mile 1 1 1 1
Cantilever sign bridge Each 0.0 0.0 0.5 1.0
Sign bridge Each 0.0 0.0 0.5 1.0
Traffic markings LF 10,560 10,560 10,560 15,900
Raised channelization LF 0 0 0 0
Curb, gutter and sidewalk LF 0 0 0 0
* See table below for Roadway Excavation and Embankment Compaction by terrain type (i.e. Level, Rolling or Mountainous)
DDDRRRAAAFFFTTT DDDRRRAAAFFFTTT DDDRRRAAAFFFTTT
Page 69 of 75
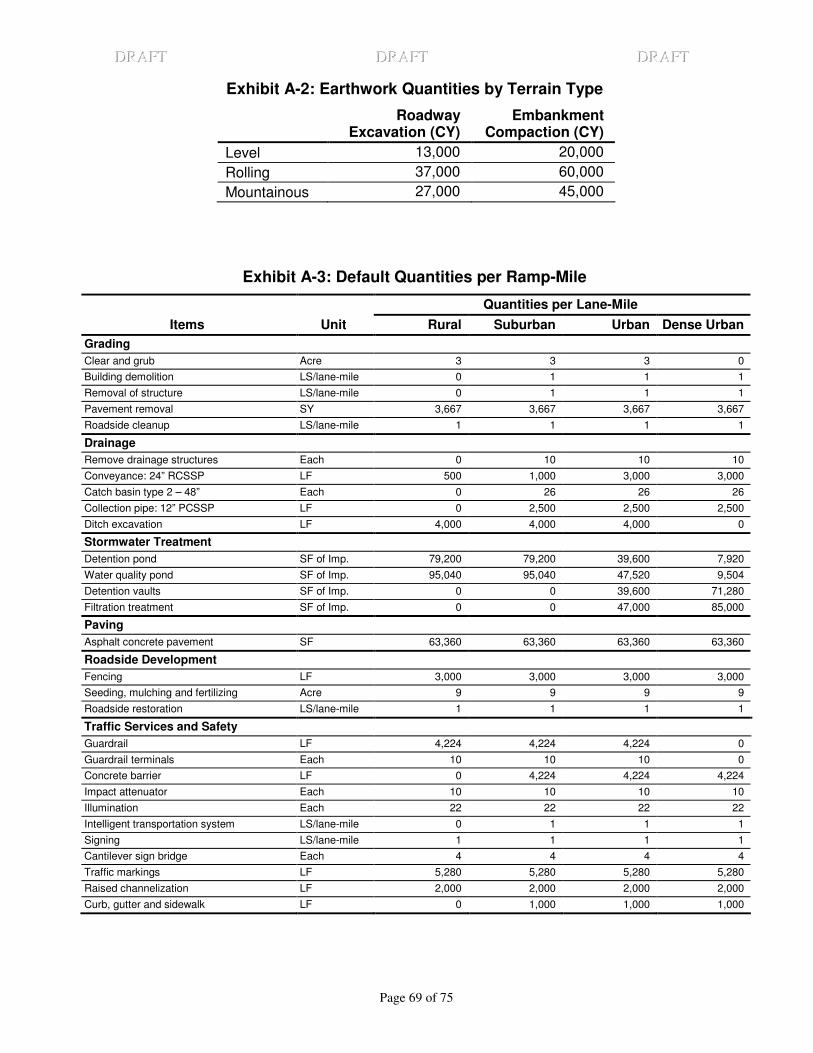
Exhibit A-2: Earthwork Quantities by Terrain Type
Roadway
Excavation (CY) Embankment
Compaction (CY)
Level 13,000 20,000
Rolling 37,000 60,000
Mountainous 27,000 45,000
Exhibit A-3: Default Quantities per Ramp-Mile
Quantities per Lane-Mile
Items Unit Rural Suburban Urban Dense Urban
Grading
Clear and grub Acre 3 3 3 0
Building demolition LS/lane-mile 0 1 1 1
Removal of structure LS/lane-mile 0 1 1 1
Pavement removal SY 3,667 3,667 3,667 3,667
Roadside cleanup LS/lane-mile 1 1 1 1
Drainage
Remove drainage structures Each 0 10 10 10
Conveyance: 24” RCSSP LF 500 1,000 3,000 3,000
Catch basin type 2 – 48” Each 0 26 26 26
Collection pipe: 12” PCSSP LF 0 2,500 2,500 2,500
Ditch excavation LF 4,000 4,000 4,000 0
Stormwater Treatment
Detention pond SF of Imp. 79,200 79,200 39,600 7,920
Water quality pond SF of Imp. 95,040 95,040 47,520 9,504
Detention vaults SF of Imp. 0 0 39,600 71,280
Filtration treatment SF of Imp. 0 0 47,000 85,000
Paving
Asphalt concrete pavement SF 63,360 63,360 63,360 63,360
Roadside Development
Fencing LF 3,000 3,000 3,000 3,000
Seeding, mulching and fertilizing Acre 9 9 9 9
Roadside restoration LS/lane-mile 1 1 1 1
Traffic Services and Safety
Guardrail LF 4,224 4,224 4,224 0
Guardrail terminals Each 10 10 10 0
Concrete barrier LF 0 4,224 4,224 4,224
Impact attenuator Each 10 10 10 10
Illumination Each 22 22 22 22
Intelligent transportation system LS/lane-mile 0 1 1 1
Signing LS/lane-mile 1 1 1 1
Cantilever sign bridge Each 4 4 4 4
Traffic markings LF 5,280 5,280 5,280 5,280
Raised channelization LF 2,000 2,000 2,000 2,000
Curb, gutter and sidewalk LF 0 1,000 1,000 1,000

DDDRRRAAAFFFTTT DDDRRRAAAFFFTTT DDDRRRAAAFFFTTT
Page 70 of 75
Exhibit A-4: Default Quantities for Interchange Cost Estimate
Interchange Type Ram
p T
yp
ical
Secti
on
Fre
ew
ay T
yp
ical
Secti
on
Cro
ss R
oad
T
yp
ical S
ecti
on
Ro
ad
way
Excavati
on
Gra
vel
Bo
rro
w
& E
mb
an
km
en
t C
om
pacti
on
Exis
tin
g B
rid
ge
Rem
oval
New
Bri
dg
e
Reta
inin
g W
all
Sig
nals
Sig
n B
rid
ge
LM LM LM CY TON SF SF SF Each Each
Ramp modification 1.00 0.00 0.45 17,670 155,620 0 0 0 0 0
Diamond interchange at rural/minor crossroad
2.00 0.00 0.45 17,670 431,000 14,280 13,525 0 2 0
Diamond interchange at urban/arterial crossroad
2.00 0.00 1.89 17,670 431,000 22,400 23,520 0 2 0
Diamond interchange at urban/braided ramps
2.50 0.00 1.89 26,500 538,800 22,400 25,500 15,000 2 0
Half-diamond interchange 1.00 0.00 0.45 8,830 215,520 22,400 13,525 0 2 0
HOV direct access interchange – one directional
0.96 0.00 0.76 8830 214,000 14,280 98,300 17,150 1 0
HOV direct access interchange – bidirectional
2.00 0.00 0.76 17,670 428,000 14,280 181,400 34,300 1 0
HOV direct access interchange – bidirectional with freeway shift for median widening
1.93 2.00 0.76 17,670 428,000 14,280 181,400 34,300 1 0
HOV direct access interchange – with flyover ramp to HOV facility
2.15 0.00 0.00 8,830 214,000 0 87,880 17,150 1 0
Single point urban interchange at minor arterial crossroad
2.19 0.00 0.45 26,000 538,000 22,400 27,200 108,430 2 0
Single point urban interchange at major arterial crossroad
2.00 0.00 1.89 26,000 538,000 22,400 27,200 108,430 2 2
Partial cloverleaf with 1 to 2 loop ramps and small footprint
2.84 0.00 3.79 17,670 214,000 21,530 21,600 0 0 2
Partial cloverleaf with 3 loop ramps and large footprint
3.91 0.00 3.79 26,000 321,000 21,530 21,600 0 0 2
Full cloverleaf with small footprint in sparsely developed location
2.33 0.00 3.79 34,000 856,000 23,088 17,810 0 0 4
Full cloverleaf with large footprint in highly developed location
3.93 0.50 3.79 34,000 856,000 23,088 25,440 0 0 4
Partial directional with 1 flyover ramp
5.57 0.00 5.00 17,670 214,000 23,088 91,930 13,330 2 4
Partial directional with 2 flyover ramps
6.24 0.00 5.00 26,000 321,000 23,088 133,680 26,660 1 4
Full directional with 2 flyover ramps
2.88 8.00 0.00 34,000 856,000 20,560 119,760 20,000 0 6
Full directional with 3 flyover ramps
6.26 8.00 0.00 45,000 900,000 47,130 229,280 20,000 0 7
Full directional with 4 flyover ramp
7.24 8.00 0.00 56,000 900,000 70,700 291,890 26,660 0 8
Fully directional with some HOV direct connections
9.72 8.00 0.00 34,000 900,000 70,700 409,610 53,320 0 10
Fully directional for all GP and HOV movements
12.20 8.00 0.00 56,000 900,000 70,700 527,330 79,980 0 12

DDDRRRAAAFFFTTT DDDRRRAAAFFFTTT DDDRRRAAAFFFTTT
Page 71 of 75
DDDRRRAAAFFFTTT DDDRRRAAAFFFTTT DDDRRRAAAFFFTTT
Page 72 of 75
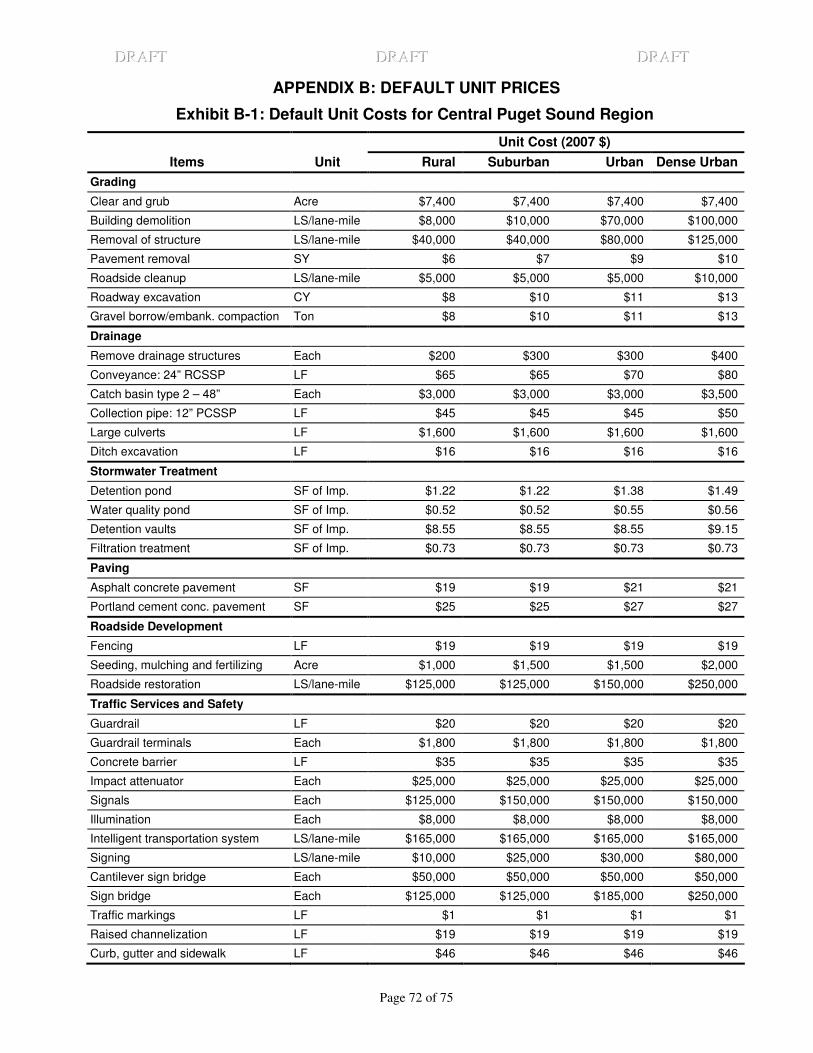
APPENDIX B: DEFAULT UNIT PRICES
Exhibit B-1: Default Unit Costs for Central Puget Sound Region
Unit Cost (2007 $)
Items Unit Rural Suburban Urban Dense Urban
Grading
Clear and grub Acre $7,400 $7,400 $7,400 $7,400
Building demolition LS/lane-mile $8,000 $10,000 $70,000 $100,000
Removal of structure LS/lane-mile $40,000 $40,000 $80,000 $125,000
Pavement removal SY $6 $7 $9 $10
Roadside cleanup LS/lane-mile $5,000 $5,000 $5,000 $10,000
Roadway excavation CY $8 $10 $11 $13
Gravel borrow/embank. compaction Ton $8 $10 $11 $13
Drainage
Remove drainage structures Each $200 $300 $300 $400
Conveyance: 24” RCSSP LF $65 $65 $70 $80
Catch basin type 2 – 48” Each $3,000 $3,000 $3,000 $3,500
Collection pipe: 12” PCSSP LF $45 $45 $45 $50
Large culverts LF $1,600 $1,600 $1,600 $1,600
Ditch excavation LF $16 $16 $16 $16
Stormwater Treatment
Detention pond SF of Imp. $1.22 $1.22 $1.38 $1.49
Water quality pond SF of Imp. $0.52 $0.52 $0.55 $0.56
Detention vaults SF of Imp. $8.55 $8.55 $8.55 $9.15
Filtration treatment SF of Imp. $0.73 $0.73 $0.73 $0.73
Paving
Asphalt concrete pavement SF $19 $19 $21 $21
Portland cement conc. pavement SF $25 $25 $27 $27
Roadside Development
Fencing LF $19 $19 $19 $19
Seeding, mulching and fertilizing Acre $1,000 $1,500 $1,500 $2,000
Roadside restoration LS/lane-mile $125,000 $125,000 $150,000 $250,000
Traffic Services and Safety
Guardrail LF $20 $20 $20 $20
Guardrail terminals Each $1,800 $1,800 $1,800 $1,800
Concrete barrier LF $35 $35 $35 $35
Impact attenuator Each $25,000 $25,000 $25,000 $25,000
Signals Each $125,000 $150,000 $150,000 $150,000
Illumination Each $8,000 $8,000 $8,000 $8,000
Intelligent transportation system LS/lane-mile $165,000 $165,000 $165,000 $165,000
Signing LS/lane-mile $10,000 $25,000 $30,000 $80,000
Cantilever sign bridge Each $50,000 $50,000 $50,000 $50,000
Sign bridge Each $125,000 $125,000 $185,000 $250,000
Traffic markings LF $1 $1 $1 $1
Raised channelization LF $19 $19 $19 $19
Curb, gutter and sidewalk LF $46 $46 $46 $46

DDDRRRAAAFFFTTT DDDRRRAAAFFFTTT DDDRRRAAAFFFTTT
Page 73 of 75
Exhibit B-2: Default Unit Cost of Structures in Central Puget Sound Region
Unit Cost (2007 $)
Items Unit Rural Suburban Urban Dense Urban
Widening existing bridge SF $300 $300 $300 $330
Roadway bridge (span up to 140’) SF $150 $150 $150 $170
Roadway bridge (span up to 200’) SF $170 $170 $170 $185
Roadway bridge (span up to 400’) SF $300 $300 $300 $330
Roadway bridge (span more than 400’) SF $300 $300 $300 $330
Removal of existing bridge SF $50 $50 $50 $50
Floating bridge SF $480 $480 $480 $480
Movable bridge SF $1,500 $1,500 $1,500 $1,500
Lid without ventilation SF $150 $150 $150 $165
Tunnel LF $65,000 $65,000 $65,000 $65,000
Railroad bridge replacement LF $10,000 $10,000 $10,000 $10,000
Pedestrian bridge SF $150 $150 $150 $150
Retaining wall SF $105 $105 $110 $115
Noise wall LF $335 $335 $335 $335
Exhibit B-3: Default Unit Costs for Wetland and Streams
Wetland Category Unit Cost (Acre)
I $2,500,000
II & III $1,900,000
IV $650,000
Stream Restoration Unit Cost (Each)
Stream Culvert $1,500,000
Beach restoration $1,000,000
Stream culvert and beach restoration have default unit costs of $600 K and $750 K per each, respectively.
DDDRRRAAAFFFTTT DDDRRRAAAFFFTTT DDDRRRAAAFFFTTT
Page 74 of 75
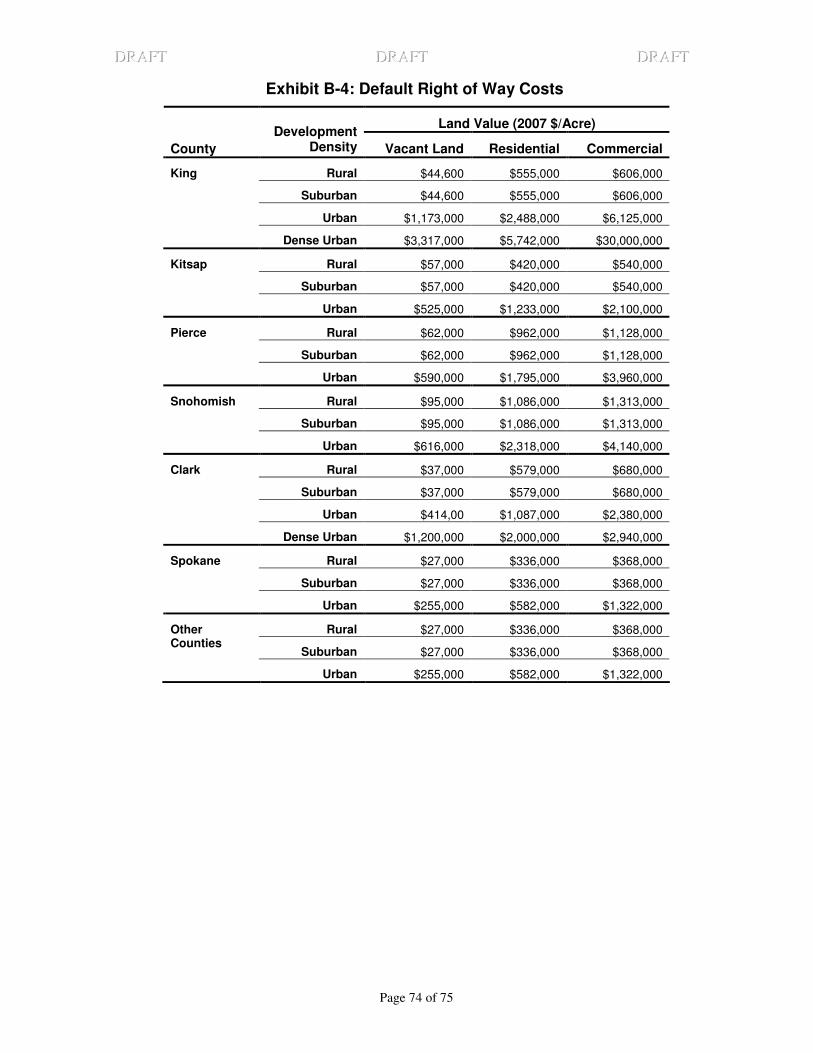
Exhibit B-4: Default Right of Way Costs
Land Value (2007 $/Acre)
County
Development Density Vacant Land Residential Commercial
King Rural $44,600 $555,000 $606,000
Suburban $44,600 $555,000 $606,000
Urban $1,173,000 $2,488,000 $6,125,000
Dense Urban $3,317,000 $5,742,000 $30,000,000
Kitsap Rural $57,000 $420,000 $540,000
Suburban $57,000 $420,000 $540,000
Urban $525,000 $1,233,000 $2,100,000
Pierce Rural $62,000 $962,000 $1,128,000
Suburban $62,000 $962,000 $1,128,000
Urban $590,000 $1,795,000 $3,960,000
Snohomish Rural $95,000 $1,086,000 $1,313,000
Suburban $95,000 $1,086,000 $1,313,000
Urban $616,000 $2,318,000 $4,140,000
Clark Rural $37,000 $579,000 $680,000
Suburban $37,000 $579,000 $680,000
Urban $414,00 $1,087,000 $2,380,000
Dense Urban $1,200,000 $2,000,000 $2,940,000
Spokane Rural $27,000 $336,000 $368,000
Suburban $27,000 $336,000 $368,000
Urban $255,000 $582,000 $1,322,000
Rural $27,000 $336,000 $368,000 Other Counties
Suburban $27,000 $336,000 $368,000
Urban $255,000 $582,000 $1,322,000

DDDRRRAAAFFFTTT DDDRRRAAAFFFTTT DDDRRRAAAFFFTTT
Page 75 of 75
Exhibit B-5: Default Markups as Percent of Construction Costs
Development Density
Items Rural Suburban Urban Dense Urban
Mobilization 8% 8% 5% 5%
Traffic Control 6% 6% 7% 8%
Temporary Water Pollution Control 3% 3% 3% 3%
Construction Staging 2% 3% 4% 4%
Utility Relocation 0% 2% 3% 4%
Sales Tax * 8.8% 8.8% 8.8% 8.8%
Preliminary Engineering 10% 10% 10% 10%
Construction Engineering Varies with construction cost (Exhibit 24)
* PLCE tool uses an 8.8% sales tax although the actual sales tax varies slightly over the State.
Exhibit B-6: Default Construction Engineering Cost
Project Construction Cost CE
(% of Construction Cost)
Below $2,000,000 17%
$2,000,000 - $5,000,000 14%
$5,000,000 - $10,000,000 12%
Above $10,000,000 10%
(Source: Plan Preparation Manual)
Exhibit B-7: Intelligent Transportation System (ITS) Costs
Items Unit Unit Cost (2007 $)
Variable Message Sign (VMS) Each $240,000
Closed Circuit Television (CCTV) Each $33,000
Highway Advisory Radio Sign (HARS) Each $12,000
Highway Advisory Radio Transmitter (HART) Each $40,000
Data Station Each $40,000
Conduit LF $25
Fiber Optic Cable Mile $975,000
Fiber Optic Cable Terminal Cabinet Each $80,000
Ramp Meter Each $60,000
Signal Coordination Each $5,000