Embed Size (px)
Citation preview
PLANNING DISTRICTS SOCIO-ECONOMIC ANALYSIS 2007
Author: Emille van Heyningen
Strategic Development Information and GIS Department
Strategic Information Branch
11 October 2007

Planning Districts Socio-Economic Analysis 2007
11 October 2007 Strategic Development Information and GIS Department Page 2
“The idea that action should only be taken after having all the answers and all the resources is a sure recipe for paralysis. The planning of a city is a process that allows for corrections, always. It is supremely arrogant to believe that planning can be done only after figuring out every possible variable. To innovate is to start! Hence, it is necessary to begin the process. Imagine the ideal, but do what is possible today". Jaime Lerner - Former Mayor of Curitiba, Brazil

Planning Districts Socio-Economic Analysis 2007
11 October 2007 Strategic Development Information and GIS Department Page 3
ACKNOWLEDGEMENTS This report was compiled by Emille van Heyningen. Input was given by Karen Small, Janet Gie and Craig Haskins (Strategic Development Information and GIS); and Ken Sinclair-Smith (City Spatial Development and Urban Design). Strategic Development Information and GIS department would also like to thank other City departments who provided comments on the document including the Economic and Human Development and City Spatial Development and Urban Design departments.
CITATION City of Cape Town (2007), Planning Districts Socio-Economic Analysis 2007, Strategic Development Information and GIS Department, Emille van Heyningen, 146 Pages.
Planning Districts Socio-Economic Analysis 2007
11 October 2007 Strategic Development Information and GIS Department Page 4
TABLE OF CONTENTS
List of Figures 7 List of Tables 8 1 Executive Summary 10 2 Introduction 13 3 District Comparisons: Demographic and Socio-Economic Information 15
3.1 Population 15
(i) Population Numbers 15 (ii) Population Projection 15 (iii) Population Density 16 (iv) Age Profile 18 (v) Age-Gender Indices 19
(vi) Household Size 20 3.2 Human and Social Development 21
(i) Levels of Living 21 (ii) Socio-Economic Status Index 21
3.3 Housing and Services 22
(i) Dwelling Type 22 (ii) Level of Services 27
3.4 Crime 29
(i) Murder 29 (ii) Rape 30 (iii) Business Crime 31 (iv) Drug-related Crime 32
3.5 Governance 33 (i) Need for Governance 33
(ii) Subcouncils 34 (iii) Integrated Development Plan 36
3.6 Spatial Planning 38 3.7 Economy 39 (i) Economic Trends 39
(ii) Employment Status 41
(iii) Spatial Distribution of the Economy 42
(a) Growth Patterns: Housing and Employment Nodes 42 (b) Commercial and Industrial Land-Use 43

Planning Districts Socio-Economic Analysis 2007
11 October 2007 Strategic Development Information and GIS Department Page 5
(c) Commercial and Industrial Property Values 45 (d) Detailed Land-Use Categories 47 (e) Economic Output / Turnover 48 (f) Spatial Economic Trends 50 (g) Spatial Distribution of the Economy: Spatial Planning Implications 53
4 District-Specific Information 54 4.1 District A: Table Bay 54
(i) Introduction 54 (ii) Population 54 (iii) Economy 55 (iv) Crime 56 (v) Housing 56 (vi) Human and Social Development 59 (vii) Challenges and Opportunities 61
4.2 District B: West Coast 62
(i) Introduction 62 (ii) Population 62 (iii) Economy 63 (iv) Crime 63 (v) Housing 64 (vi) Human and Social Development 67 (vii) Challenges and Opportunities 69
4.3 District C: Northern 69
(i) Introduction 69 (ii) Population 70 (iii) Economy 70 (iv) Crime 71 (v) Housing 71 (vi) Human and Social Development 74 (vii) Challenges and Opportunities 76
4.4 District D: Tygerberg 76
(i) Introduction 76 (ii) Population 77 (iii) Economy 78
(iv) Crime 78 (v) Housing 79 (vi) Human and Social Development 82 (vii) Challenges and Opportunities 84
4.5 District E: Eastern 85
(i) Introduction 85 (ii) Population 85 (iii) Economy 86 (iv) Crime 86 (v) Housing 87 (vi) Human and Social Development 90

Planning Districts Socio-Economic Analysis 2007
11 October 2007 Strategic Development Information and GIS Department Page 6
(vii) Challenges and Opportunities 92 4.6 District F: Mitchells Plain / Khayelitsha 92
(i) Introduction 92 (ii) Population 92 (iii) Economy 93 (iv) Crime 94 (v) Housing 94 (vi) Human and Social Development 97 (vii) Challenges and Opportunities 99
4.7 District G: Klipfontein / False Bay 100
(i) Introduction 100 (ii) Population 100 (iii) Economy 101 (iv) Crime 102 (v) Housing 102 (vi) Human and Social Development 105 (vii) Challenges and Opportunities 107
4.8 District H: Southern 108
(i) Introduction 108 (ii) Population 108 (iii) Economy 109 (iv) Crime 109 (v) Housing 110 (vi) Human and Social Development 113 (vii) Challenges and Opportunities 115
5 Conclusion 117 References 119 Appendices 120 Appendix A: Suburbs in Planning Districts with Population Figures Appendix B: Additional Economic Information on District Comparisons Appendix C: Planning and Building Plan Tracker Data

Planning Districts Socio-Economic Analysis 2007
11 October 2007 Strategic Development Information and GIS Department Page 7
LIST OF FIGURES Figure 1: Spatial Planning Districts (May 2007) Figure 2: Total Population Projection for Cape Town Figure 3: Population Density Figure 4: Dwelling Type Figure 5: Distribution of Informal Dwellings Figure 6: Percentage of reported cases of Murder in 2005/2006 Figure 7: Percentage of reported cases of Rape in 2005/2006 Figure 8: Percentage of reported cases of Business Crime in 2005/2006 Figure 9: Percentage of reported cases of Drug-related Crime in 2005/2006 Figure 10: Planning Districts and 2007 Subcouncils Figure 11: Cape Town‟s urban footprint 1977 versus 2005 Figure 12: Cape Town‟s Economic Output by Sector Classification, 2006 Figure 13: Trends in Non-residential property and Low-income housing Figure 14: Commercial and Industrial land use Figure 15: Economic Property per person (2000 price/value) Figure 16: Commercial and Industrial Property Values Figure 17: Formal Economic Output (in 2000 Rand Value) Figure 18: Building Plans Submitted (Jan 2005 – May 2006): Commercial land Figure 19: Building Plans Submitted (Jan 2005 – May 2006): Industrial Land Figure 20: Informal Settlements - District A: Table Bay Figure 21: Service Level Index - District A: Table Bay Figure 22: Socio-economic Status Index - District A: Table Bay Figure 23: Informal Settlements - District B: West Coast Figure 24: Service Level Index - District B: West Coast Figure 25: Socio-economic Status Index - District B: West Coast Figure 26: Informal Settlements - District C: Northern Figure 27: Service Level Index - District C: Northern Figure 28: Socio-economic Status Index - District C: Northern Figure 29: Informal Settlements - District D: Tygerberg Figure 30: Service Level Index - District D: Tygerberg Figure 31: Socio-economic Status Index - District D: Tygerberg Figure 32: Informal settlements in district – District D: Tygerberg Figure 33: Service Level Index - District E: Eastern Figure 34: Socio-economic Status Index - District E: Eastern Figure 35: Informal settlements in district - District F: Mitchells Plain / Khayelitsha Figure 36: Service Level Index - District F: Mitchells Plain / Khayelitsha Figure 37: Socio-economic Status Index - District F: Mitchells Plain / Khayelitsha Figure 38: Informal Settlements - District G: Klipfontein / False Bay Figure 39: Service Level Index - District G: Klipfontein / False Bay Figure 40: Socio-economic Status Index - District G: Klipfontein / False Bay Figure 41: Informal Settlements - District H: Southern Figure 42: Service Level Index - District H: Southern Figure 43: Socio-economic Status - District H: Southern

Planning Districts Socio-Economic Analysis 2007
11 October 2007 Strategic Development Information and GIS Department Page 8
LIST OF TABLES
Table 1: Population comparison between districts Table 2: District Population density per square km Table 3: Age Profile Table 4: Age-Gender Indices Table 5: Household Size Table 6: Socio-Economic Status Index Table 7: Dwelling Type Table 8: Informal Settlement Counts Table 9: Service Levels in Cape Town Table 10: Service Level Index Table 11: Incidence of reported Murder Table 12: Incidence of reported Rape Table 13: Incidence of reported Business Crime Table 14: Incidence of reported Drug-related Crime Table 15: Planning Districts and 2007 Subcouncils Table 16: Employment Status of the Economically Active Aged 15 to 65 Table 17: Commercial and Industrial Property Values Table 18: Main Areas of Economic Clustering Table 19: Population of District A: Table Bay Table 20: Age-Gender in District A: Table Bay Table 21: Age in District A: Table Bay Table 22: Household Size in District A: Table Bay Table 23: Commercial and Industrial Property Values Table 24: Employment Status in District A: Table Bay Table 25: Type of Dwellings - District A: Table Bay Table 26: Population - District B: West Coast Table 27: Age-Gender - District B: West Coast Table 28: Age - District B: West Coast Table 29: Household Size - District B: West Coast Table 30: Commercial and Industrial Property Values- District B: West Coast Table 31: Employment Status - District B: West Coast Table 32: Types of Dwellings- District B: West Coast Table 33: Population - District C: Northern Table 34: Age-Gender - District C: Northern Table 35: Age - District C: Northern Table 36: Household Size - District C: Northern Table 37: Commercial and Industrial Property Values- District C: Northern Table 38: Employment Status - District C: Northern Table 39: Types of Dwellings - District C: Northern Table 40: Population - District D: Tygerberg Table 41: Age-Gender - District D: Tygerberg Table 42: Age - District D: Tygerberg Table 43: Household Size - District D: Tygerberg Table 44: Commercial and Industrial Property Values - District D: Tygerberg Table 45: Employment Status - District D: Tygerberg Table 46: Type of Dwellings - District D: Tygerberg Table 47: Population - District E: Eastern Table 48: Age-Gender - District E: Eastern Table 49: Age - District E: Eastern Table 50: Household Size - District E: Eastern Table 51: Employment Status - District E: Eastern Table 52: Commercial and Industrial Property Values - District E: Eastern Table 53: Population - District F: Mitchells Plain / Khayelitsha Table 54: Age-Gender - District F: Mitchells Plain / Khayelitsha

Planning Districts Socio-Economic Analysis 2007
11 October 2007 Strategic Development Information and GIS Department Page 9
Table 55: Age - District F: Mitchells Plain / Khayelitsha Table 56: Household Size - District F: Mitchells Plain / Khayelitsha Table 57: Employment Status - District F: Mitchells Plain / Khayelitsha Table 58: Types of Dwellings - District F: Mitchells Plain / Khayelitsha Table 59: Population - District G: Klipfontein / False Bay Table 60: Age-Gender Issues - District G: Klipfontein / False Bay Table 61: Age - District G: Klipfontein / False Bay Table 62: Household size - District G: Klipfontein / False Bay Table 63: Commercial and Industrial Property Values - District G: Klipfontein / False Bay Table 64: Employment Status - District G: Klipfontein / False Bay Table 65: Types of Dwellings - District G: Klipfontein / False Bay Table 66: Population - District H: Southern Table 67: Age-Gender - District H: Southern Table 68: Age - District H: Southern Table 69: Household Size in District H: Southern Table 70: Commercial and Industrial Property Values - District H: Southern Table 71: Employment Status - District H: Southern Table 72: Types of Dwellings - District H: Southern

Planning Districts Socio-Economic Analysis 2007
11 October 2007 Strategic Development Information and GIS Department Page 10
1 EXECUTIVE SUMMARY
Introduction The purpose of this report is to provide an analysis of the available socio-economic data for the City of Cape Town‟s eight spatial planning districts. The report presents the most up-to-date set of demographic, social, economic, housing and crime information for each district, as well as comparisons of the these issues between the districts. The report will inform the spatial planning for the districts and will provide a basis for the formulation of district spatial plans for these entities. Please note that this report is based on the spatial planning districts of the City (as at 19 June 2007).
Population Cape Town‟s current population is approximately 3.3 million people (2007). The city‟s population growth is expected to slow dramatically over the next 15 years, with an expected growth of approximately 300 000 people between 2006 and 2021, with a growing proportion of the aged and youth relative to total population. Almost a quarter of the city‟s population resides in District F: Mitchells Plain / Khayelitsha. Districts D and G each have nearly 18% of the population, while District B: West Coast has the fewest residents (just over 5%). District F: Mitchells Plain / Khayelitsha has the highest percentage of youth (36.3%) and the lowest percentage of the aged (1.5%). The highest percentage of the aged (9.9%) occurs in District H: Southern and the lowest percentage of youth (23.9%) in District A: Table Bay. In all the districts the number of females is greater than the number of males. The differences in the age profile of the various districts mean that the needs in each district are different and solutions should cater for these different needs. Over half of households in Districts A and H have either 1 or 2 people. At the other end of the scale District G: Klipfontein / False Bay has the largest percentage (14%) of households with 7 or more people, followed by District F: Mitchells Plain / Khayelitsha (11.9%) and District D: Tygerberg (10.7%). The differences in the sizes of households in the districts have implications for housing developments, particularly with regard to the provision of the number of bedrooms in housing units.
Human and Social Development There has been rising poverty in the city (from 25% in 1996 to 38% in 2005 of households living below or marginally above the household poverty line, increasing HIV prevalence among women visiting public health clinics (from 1,2% in 1994 to 15% in 2005) and increasing tuberculosis cases (from 13 870 in 1997 to 26 754 in 2005). In terms of levels of living, District H: Southern is the best off at 22.16, while District F: Mitchells Plain / Khayelitsha is the worst off at 54.12. Programmes to address the poor socio-economic status should prioritise some of districts (and areas within districts) that are the worst off.
Integrated Human Settlements Approximately 30% of households (almost one million people) in the city live in inadequate housing and depressed physical environments. There has been an increasing housing backlog in the city from 150 000 in 1998 to 300 000 in 2007. The number of people living in informal settlements has increased from 23 000 families in 1993 to approximately 120 000 families in 2007. District F: Mitchells Plain / Khayelitsha has the highest percentage of informal dwellings at 43.7% followed by District E: Eastern (15.6%) and District G: Klipfontein / False Bay (15.1%). At just over 90% District D: Tygerberg has the largest percentage of formal dwellings followed by Districts B and H at 88%.

Planning Districts Socio-Economic Analysis 2007
11 October 2007 Strategic Development Information and GIS Department Page 11
Apart from the obvious housing backlogs in the city, there is also a need to provide basic infrastructure to accommodate economic, urban and population growth. In terms of the provision of services, District F: Mitchells Plain / Khayelitsha is the worst off with levels of living (Socio-economic Status Index of 26.37), followed by District E: Eastern with a value of 13.04. District D: Tygerberg is the best off with a value of 3.30. The districts with the most informal dwellings (and pockets of informal dwellings within other districts) should be prioritized in terms of an incremental approach to the development of housing - to focus on the provision of a broad range of housing opportunities which are integrated with other services, to ensure the development of integrated settlements.
Crime One of the city‟s main challenges is its high crime rate. The current state of the city‟s crime rate over the past few years has demonstrated an improving stabilising situation (except for drug-related crime), although far from normalised. In 2005/2006 the largest percentage (44.6%) of reported murders occurred in District F: Mitchells Plain / Khayelitsha, followed by District G: Klipfontein / False Bay with 15.5%. The lowest incidence (3.4%) occurred in District B: West Coast. With regard to reported rape, again District F: Mitchells Plain / Khayelitsha has the highest incidence at 33.9%, followed by District D: Tygerberg with 14.9%. The lowest incidence (6%) of reported rape occurred in District B: West Coast. A quarter of the business crime in the city occurred in District A: Table Bay, followed by District D: Tygerberg, with 19.2%. District C: Northern had the lowest incidence of business crime (6.5%). The incidence of drug-related crime, was highest in District D: Tygerberg (19.9%), followed by District F: Mitchells Plain / Khayelitsha (19.7%). District C: Northern had the lowest incidence (3.8%). It is clear from the data that the districts with the highest level of crime are those with the poorest socio-economic indicators.
Governance The need for effective leadership in the city is a key issue. The city‟s challenges are interrelated and addressing these cuts across the responsibilities of all spheres of government and civil society. It is therefore critical that innovative ways are found for dealing with these challenges in a more sustained and integrated way through partnership. In order to promote the democratization of the city, the City of Cape Town has established 23 subcouncils which have as their base a political, community and a service interface, serving the 105 wards of the city. The City‟s year Integrated Development Plan (2007/8 - 2011/12include seven strategic focus areas, which should be incorporated, supported and implemented by the district plans. These are the promotion of shared economic growth and development, establishment of sustainable urban infrastructure and services, effective public transport systems, establishment of integrated human settlements, the promotion of safety and security, health, social and human capital development, and good governance and regulatory reform.
Spatial Planning Cape Town‟s current urban form is unsustainable, economically unproductive and prevents spatial, racial and economic integration. The city grew by 40% in developed land area in the period 1985-2005. Change and growth are inevitable, pressure for development a given, but the city can, with foresight and insight, shape change, guide and direct development to ensure the best possible outcome for the city and its people. When undertaking spatial planning, it is important to understand the economic forces and trends in the city. Spatial plans can not significantly redirect these economic forces, but should take the underlying economic forces into account and can, at most, „bend the trend‟ of the economical forces. The district plans should include the identification of land which is available for development, along with the spatial representation of economic activity, as these are useful elements in determining optimal plans for each district. In addition, the natural environment needs to be considered and incorporated accordingly.

Planning Districts Socio-Economic Analysis 2007
11 October 2007 Strategic Development Information and GIS Department Page 12
Economy In 2006, Cape Town‟s formal economy contributed about 11,1% (or R123,58 billion) to South Africa‟s Gross Domestic Product (GDP). Between 1995 and 2006, the city contributed 15,9% of South Africa‟s economic growth, and 82% of new provincial economic growth.
Unemployment has grown from 13% in 1997 to almost 29% in 2001, with a drop in 2005 to 20,7%. There is a large variation in the unemployment levels across the districts. District F: Mitchells Plain / Khayelitsha has the highest level of unemployment (45.1%), followed by District G: Klipfontein / False Bay (31%). District H: Southern has the lowest level of unemployment (13.4%) occurs in District H: Southern. A key challenge to be addressed in the city, and particularly in the districts with high unemployment, is to implement strategies which will achieve shared growth. In order to address the high unemployment rate, job opportunities should be promoted by implementing training programmes to ensure that the right skills for the economy. In addition to more employment opportunities for local people, it will also reduce the need to travel as residents would be able to work within the district. To this effect, public funding should be invested at locations which can act as potential catalyst for private investment. The city‟s economy is distorted. Cape Town, Bellville, Claremont and Century City appear to be the main generators of commercial investment. The three former areas support 46% of total business turnover and contain 42% of formal businesses in the city. Commercial development data shows continuing investment in Districts A, B, C, D, E and H and relatively little investment in Districts G and F. Significant concentrations of building plan submissions are evident in the Cape Town CBD / Foreshore, Tableview, Somerset West, Durban Road and Claremont, with Voortrekker Road subjected to a high number of relatively small building plan submissions. Districts B and D have the greatest value of industrial building plans submitted and continued industrial investment is taking place in Montague Gardens, Parow and Airport Industria. Districts E, F and G play a local retail function while the other districts have better developed office-based sectors.
Despite the trends in the formal economy, the city‟s second economy will for many years to come remain a strong feature of life in the city and many people from less affluent communities will be involved with it. Increasing numbers of people will have to „invent‟ a livelihood for themselves and their families, given the lack of formal-sector jobs and the high levels of competition for employment.
Conclusion
The challenges facing Cape Town are numerous and the socio-economic trends for the city strongly indicate the need for a change in strategy to address these challenges. Although there are many positive trends in the city, including a growing economy: healthy tourism and real estate sector. The 2010 World Cup should also provide a catalyst for development in the city. However, other factors like growing unemployment, increasing HIV/Aids prevalence rates, an ineffective public transport system, unsustainable urban sprawl and high crime (especially drug-related crime) should be addressed. It must be acknowledged, however, that many of the challenges, such as HIV/Aids, crime and the housing backlog, will remain for a long time and there will be a very limited chance of totally eradicating them. It is thus important to be realistic about what can actually be achieved over certain time periods. To conclude, it is clear from the data, that there are great variations between the various planning districts – with each district having its own characteristics and needs. However, it is essential that the spatial planning, with other development initiatives to be undertaken for the future development of each district, be undertaken within the overall metropolitan perspective and principles for the development of the city.

Planning Districts Socio-Economic Analysis 2007
11 October 2007 Strategic Development Information and GIS Department Page 13
2 INTRODUCTION
The purpose of this report is to provide an analysis of the available socio-economic data for the City of Cape Town‟s eight spatial planning districts, as sourced and accessed by the Strategic Development Information and GIS Department. The districts were established in 2006 as basis for more manageable administrative districts to allow for more effective spatial and land use planning functions in the city. However, in May 2007 some of the boundaries for the districts changed – with separate districts for spatial planning purposes and for land use management and building management purposes. The spatial planning districts are similar to the City‟s health districts. Due to the purpose of the report as a basis for spatial planning, the report relates to the spatial planning districts and not the land use- and building management districts. Figure 1 outlines the boundaries of the eight planning districts. The report presents the most up-to-date set of demographic, social, economic, housing and crime information for each district, as well as comparisons of the other various issues between the districts. It will inform the spatial planning of the districts by providing a basis for the formulation of district spatial plans for these entities. The first part of the report includes district comparisons with regard to demographic and socio-economic data. This is followed by the second part of the report with information relating to each planning district specifically. The conclusion includes a summary of the main issues which should inform spatial planning and land use management to support it. It should be noted that the report presents an analysis of the „as is‟ situation to inform change and presents a „snap shot‟ of information with limited trend analysis. Also note that the planning districts are for administrative purposes only and do not represent independently functional entities - in reality human-, social-, environmental- and economic systems, processes and issues cut across and transcend the theoretic district boundaries. In addition, Cape Town plays an important role in its regional, provincial and national context with processes and trends crossing these administrative boundaries. It is important therefore for any planning at a district level to take into account these broader contexts and not be undertaken in isolation as well as to be sensitive to scale and impact of appropriate interventions at the various planning scales.
The information in the report is presented in support of the broad themes of the Provincial and City of Cape Town intergovernmental task teams, which include Human and Social Development, Integrated Human Settlements, Crime, Governance, Spatial Planning and the Economy.

Planning Districts Socio-Economic Analysis 2007
11 October 2007 Strategic Development Information and GIS Department Page 14
Figure 1 - Spatial Planning Districts (May 2007)
A: Table Bay B: West Coast C: Northern D: Tygerberg E: Eastern F: Mitchells Plain / Khayelitsha G: Klipfontein / False Bay H: Southern

Planning Districts Socio-Economic Analysis 2007
11 October 2007 Strategic Development Information and GIS Department Page 15
3 DISTRICT COMPARISONS: DEMOGRAPHIC AND SOCIO-ECONOMIC INFORMATION The following section outlines comparisons between the districts with regard to demographic and socio-economic data.
3.1 Population
(i) Population Numbers
Cape Town‟s current population is approximately 3,21 million people (2007). Between 1996 and 2006, the population has grown fairly rapidly with an increase of 700 000 people, with an annual average growth rate of 3% in 1996. By 2006, this had decreased to 1,6% (City of Cape Town, 2006a). As can be seen from Table 1, almost a quarter of the city‟s population (nearly 25%) resides in District F: Mitchells Plain / Khayelitsha. Districts D and G have nearly 18% of the population each. In contrast, with just over 5%, District B: West Coast has the fewest residents. In all the districts the number of females is greater than the number of males (City of Cape Town, 2007b).
Table 1: Population comparison between districts
Planning District Male % Female % Total %
A: Table Bay 81,786 2.83 88,885 3.07 170,671 5.90
B: West Coast 73,851 2.55 78,448 2.71 152,299 5.27
C: Northern 106,489 3.68 112,055 3.87 218,544 7.56
D: Tygerberg 241,789 8.36 267,474 9.25 509,263 17.61
E: Eastern 164,279 5.68 174,159 6.02 338,438 11.70
F: Mitchells Plain /
Khayelitsha 346,487 11.98 373,025 12.90 719,512 24.88
G: Klipfontein / False Bay 242,728 8.39 270,230 9.34 512,958 17.74
H: Southern 131,237 4.54 139,288 4.82 270,525 9.35
Total 1,388,646 48.01 1,503,564 51.99 2,892,210 100.00 City of Cape Town 2006b
(ii) Population Projection
The city‟s population growth is expected to slow dramatically over the next 15 years, with an expected growth of approximately 300 000 people between 2006 and 2021 and a growing proportion of the aged and youth relative to total population. This is mainly due to reduced fertility, the impact of HIV/Aids and reduced migration to the city (City of Cape Town, 2006a, p14). Figure 2 compares the total population estimates based on the high and low migration assumptions with those based on the middle migration assumptions. From this comparison the population in the city in 2021 could range between a low of 3.4 million and a high of 4.2 million (City of Cape Town, 2007b).

Planning Districts Socio-Economic Analysis 2007
11 October 2007 Strategic Development Information and GIS Department Page 16
Figure 2: Total Population Projection for Cape Town
2,000,000
2,500,000
3,000,000
3,500,000
4,000,000
4,500,000
2001 2006 2011 2016 2021
High Migration Middle Migration Low Migration Assumptions
City of Cape Town, 2006a
(iii) Population Density
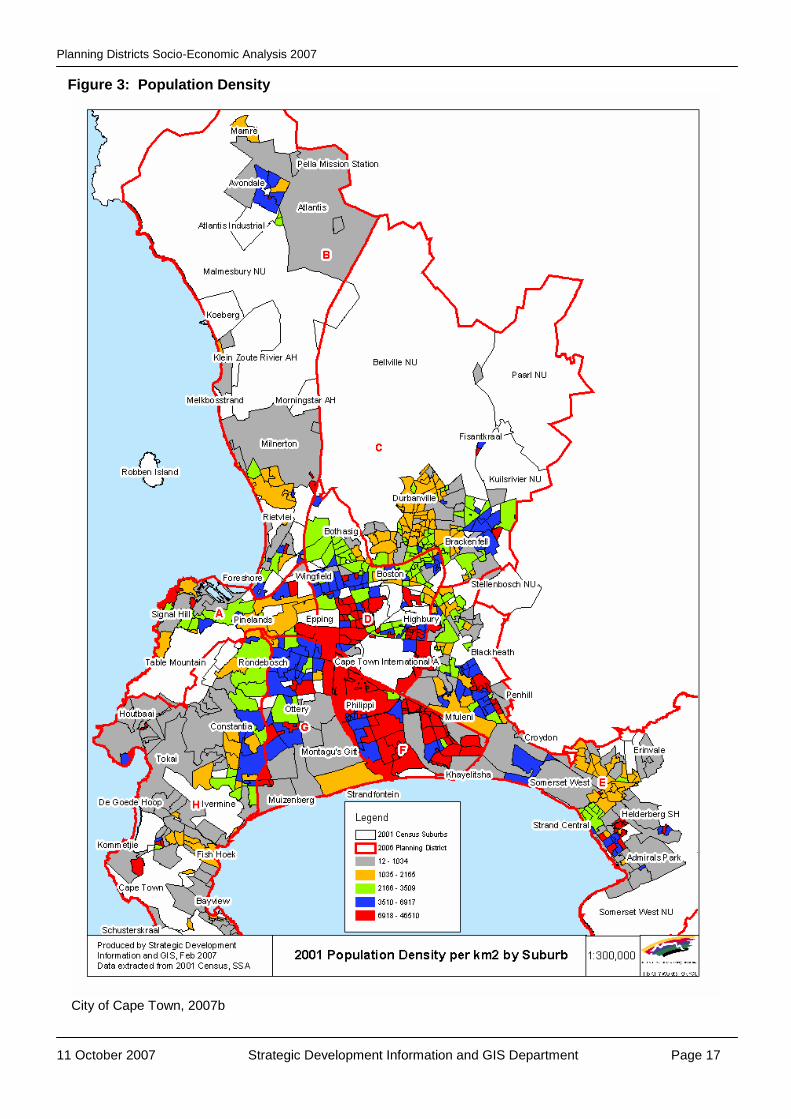
Cape Town is a sprawling city, characterised by a relatively low urban population density with approximately 2 644 people per square kilometre in 2001. Mumbai‟s population density, for instance, is approximately 11 times more than Cape Town, while Rio de Janeiro‟s density is 1,8 times more than Cape Town‟s. Although the density of cities like Cairo and Mumbai are obviously not ideal, the higher density range of other world cities indicates that Cape Town‟s density is low by comparison with some scope to increase density in many parts of the city. The highest densities in Cape Town are in the metro south-east, which represents many of the lowest income areas in the city. These areas are often characterised by overcrowding and poor ventilation, leading to increased tuberculosis and, especially, HIV-related tuberculosis. On the other extreme, 20% of housing value in the city takes up 40% of developed land, which reflects the current unsustainability of the city‟s neighbourhoods (City of Cape Town, 2006a). The city‟s population density, based on the 2001 population census, is shown in Table 2 and Figure 3, with the highest population densities in District F: Mitchells Plain / Khayelitsha (City of Cape Town, 2007b).
Table 2: District Population Density per square km
Planning District Population density square km
(whole district*)
Population density per square km
(district urban area only*)
A: Table Bay 1551 2989
B: West Coast 276 726
C: Northern 365 2263
D: Tygerberg 3299 5281
E: Eastern 775 1690
F: Mitchells Plain / Khayelitsha 8283 8051
G: Klipfontein / False Bay 3827 3823
H: Southern 680 206
* approximate figures
Planning Districts Socio-Economic Analysis 2007
11 October 2007 Strategic Development Information and GIS Department Page 17
Figure 3: Population Density
City of Cape Town, 2007b

Planning Districts Socio-Economic Analysis 2007
11 October 2007 Strategic Development Information and GIS Department Page 18
Low density sprawl has consumed large amounts of valuable agricultural land together with the loss of natural resource areas and cultural landscapes. Sprawl has had particular impact on the city‟s perimeter to the north, east and north-east, and in certain parts of the Peninsula where there is an attraction for undeveloped natural areas and agricultural land. This is an issue for a region dependent on its natural resources with agriculture as the most important primary sector and a unique biodiversity requiring protection for environmental and economic sustainability. This is especially relevant given that tourism and lifestyle (visitors and residents attracted to the city‟s location and natural environment) is expected to become one of the main contributing sectors (with the services sector) of the economy in the future (City of Cape Town 2007c). Middle and upper-income housing is largely responsible for the sprawl on the perimeter of the City‟s urban areas while low income and affordable housing has largely tended to concentrate on the Cape Flats and the Metropolitan South-East (M.S.E.), albeit in some environmentally inappropriate places. The constant pressure on the urban edge can be largely attributed to higher rather than low income housing developments. Middle to higher-income residential land development far exceeds that of low income although there has been a recent trend towards higher- density developments such as town houses and group housing complexes, due to reasons of security and maintenance costs. This pattern is evident in the existing urban fabric and in some of the newer development areas of Helderberg, Durbanville, Kraaifontein and Blaauwberg (City of Cape Town 2007c). The more qualitative higher-density developments are taking place in the middle to higher-income urban areas. With growing poverty and inequalities having impacted negatively on housing affordability together with the inappropriateness of the existing housing subsidy system for densification, quality higher-density housing and accommodation has become unaffordable for the less affluent areas of the city. These areas have high population densities due to overcrowding, backyarders and informal settlements, and require service provision and settlement upgrading as a priority. The higher-density development focus is best targeted the city‟s middle to higher-income areas (existing and future), as well as adequate housing for the less affluent, where densities require increasing but with the proviso that quality higher-density developments are built in appropriate locations where there are existing and committed bulk infrastructure capacities (water, waste, sewerage, etc) (City of Cape Town 2007c).
In order to promote densification in the city, it is important that the District Planning process offer practical steps and principles to enable municipal departments to promote densification in their particular policy plans and implementation processes.
(iv) Age Profile
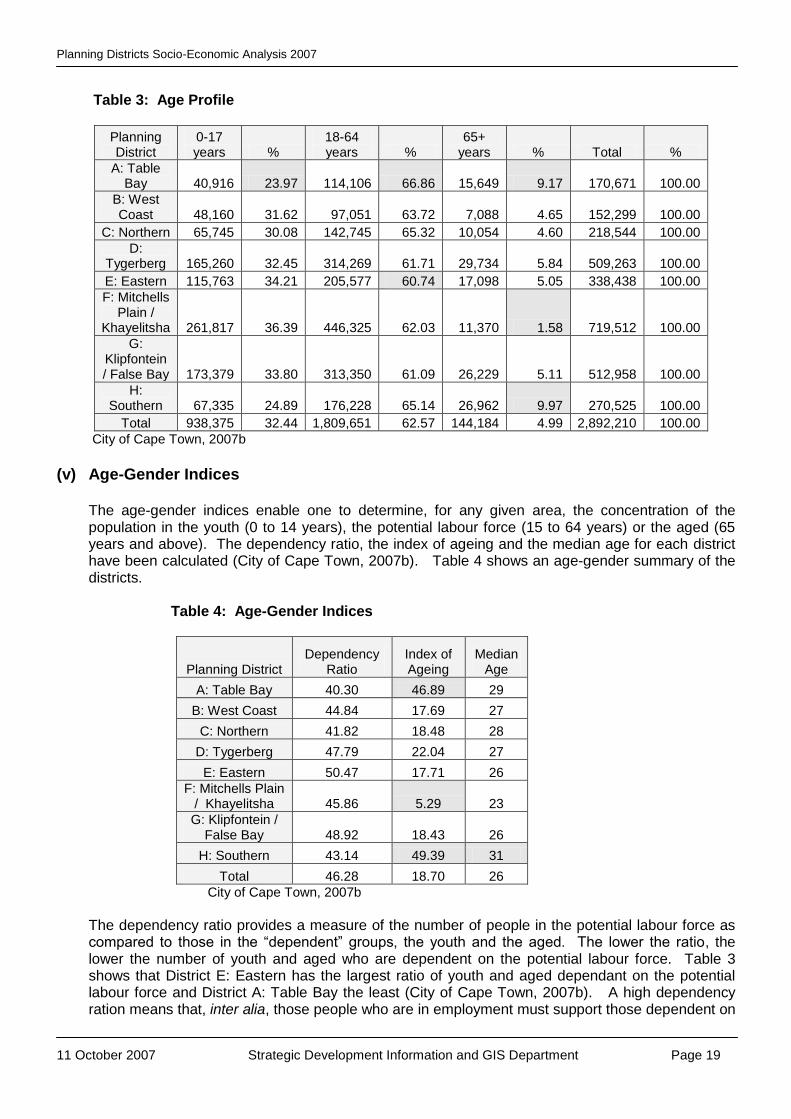
Table 3 shows the percentage of people in the 18 to 64 age group varies from 66.8% in District A: Table Bay to 60.7% in District E: Eastern. District F: Mitchells Plain / Khayelitsha has the highest percentage of youth (36.3%) and the lowest percentage of aged (1.5%). The highest percentage of aged (9.9%) occurs in District H: Southern and the lowest percentage of youth (23.9%) in District A: Table Bay (City of Cape Town, 2007b). The differences in the age profile of the various districts mean that the needs in each district are different and solutions should cater for these different needs. For example, a district with a younger population will need facilities and programmes geared towards a younger population. The same is true for districts with an older population, where facilities and programmes should also cater for the elderly. It is also important to remember that facilities and programmes should also cater for the youth as they move through the stages of life – a young population will mean very different needs in the future.
Planning Districts Socio-Economic Analysis 2007
11 October 2007 Strategic Development Information and GIS Department Page 19
Table 3: Age Profile
Planning District
0-17 years %
18-64 years %
65+ years % Total %
A: Table Bay 40,916 23.97 114,106 66.86 15,649 9.17 170,671 100.00
B: West Coast 48,160 31.62 97,051 63.72 7,088 4.65 152,299 100.00
C: Northern 65,745 30.08 142,745 65.32 10,054 4.60 218,544 100.00
D: Tygerberg 165,260 32.45 314,269 61.71 29,734 5.84 509,263 100.00
E: Eastern 115,763 34.21 205,577 60.74 17,098 5.05 338,438 100.00
F: Mitchells Plain /
Khayelitsha 261,817 36.39 446,325 62.03 11,370 1.58 719,512 100.00
G: Klipfontein / False Bay 173,379 33.80 313,350 61.09 26,229 5.11 512,958 100.00
H: Southern 67,335 24.89 176,228 65.14 26,962 9.97 270,525 100.00
Total 938,375 32.44 1,809,651 62.57 144,184 4.99 2,892,210 100.00
City of Cape Town, 2007b
(v) Age-Gender Indices
The age-gender indices enable one to determine, for any given area, the concentration of the population in the youth (0 to 14 years), the potential labour force (15 to 64 years) or the aged (65 years and above). The dependency ratio, the index of ageing and the median age for each district have been calculated (City of Cape Town, 2007b). Table 4 shows an age-gender summary of the districts.
Table 4: Age-Gender Indices
Planning District Dependency
Ratio Index of Ageing
Median Age
A: Table Bay 40.30 46.89 29
B: West Coast 44.84 17.69 27
C: Northern 41.82 18.48 28
D: Tygerberg 47.79 22.04 27
E: Eastern 50.47 17.71 26
F: Mitchells Plain / Khayelitsha 45.86 5.29 23
G: Klipfontein / False Bay 48.92 18.43 26
H: Southern 43.14 49.39 31
Total 46.28 18.70 26
City of Cape Town, 2007b
The dependency ratio provides a measure of the number of people in the potential labour force as compared to those in the “dependent” groups, the youth and the aged. The lower the ratio, the lower the number of youth and aged who are dependent on the potential labour force. Table 3 shows that District E: Eastern has the largest ratio of youth and aged dependant on the potential labour force and District A: Table Bay the least (City of Cape Town, 2007b). A high dependency ration means that, inter alia, those people who are in employment must support those dependent on

Planning Districts Socio-Economic Analysis 2007
11 October 2007 Strategic Development Information and GIS Department Page 20
them. This has economic implications as these employed people can, for instance, not save adequately, which means they cannot progress financially over time. The index of ageing provides a measure of the number of aged relative to the number of youth. The higher the index the larger the number of aged in proportion to the youth. District H: Southern has the highest index with 49 aged for every 100 youth and District F: Mitchells Plain / Khayelitsha the lowest with only 5 aged for every 100 youth (City of Cape Town, 2007b). This has implications for the provision of services and amenities with regard to the needs for the various age groups. The median age is the age of that person at the mid-point of the age distribution and is an indication of the young or old character of the population. Once again District H: Southern has the highest value (indicating an aging population) and District F: Mitchells Plain / Khayelitsha the lowest (indicating a young population) (City of Cape Town, 2007b). Again, the differences in the age-gender profiles of the various districts mean that the needs in each district are different and solutions should cater for this.
(vi) Household Size
Table 5 shows over half of the households in Districts A: Table Bay and H: Southern have either 1 or 2 people. At the other end of the scale, District G: Klipfontein / False Bay has the largest percentage (14%) of households with 7 or more people, followed by District F: Mitchells Plain / Khayelitsha (11.9%) and District D: Tygerberg (10.7%). Other than Districts A and H, the percentage of households having 3 to 6 people varies between 52% and 60% (City of Cape Town, 2007b). The differences in the sizes of households in the districts have implications for housing developments and property developers, particularly with regard to the provision of the number of bedrooms in housing units. A high percentage of larger households could imply potential overcrowding and social problems. Larger households in areas with a young population indicate that the demands for services by these households will change over time as the households mature. Districts with larger households also mean that these households (and districts) are generally less affluent.
Table 5: Household Size
Planning District
1 to 2 people %
3 to 6 people %
7+ people % Total %
A: Table Bay 32,742 56.37 22,334 38.45 3,003 5.17 58,079 100.00
B: West Coast 17,938 40.55 23,348 52.78 2,953 6.68 44,240 100.00
C: Northern 28,335 42.66 34,823 52.43 3,265 4.92 66,423 100.00
D: Tygerberg 39,277 30.93 74,108 58.36 13,594 10.71 126,979 100.00
E: Eastern 33,913 36.40 52,129 55.95 7,133 7.66 93,175 100.00
F: Mitchells Plain /
Khayelitsha 57,820 32.16 100,524 55.92 21,436 11.92 179,780 100.00
G: Klipfontein / False Bay 29,977 25.16 72,510 60.85 16,681 14.00 119,167 100.00
H: Southern 46,433 52.14 39,512 44.37 3,112 3.49 89,058 100.00
Total 286,435 36.87 419,289 53.97 71,177 9.16 776,901 100.00
City of Cape Town, 2007b

Planning Districts Socio-Economic Analysis 2007
11 October 2007 Strategic Development Information and GIS Department Page 21
3.2 Human and Social Development (i) Levels of Living
Cape Town is faced with immense human and social development challenges over the long term. This is due to decades of distorted development in the city manifested in highly-skewed distribution of income and wealth. This in turn is reflected in growing levels of absolute poverty, inadequate housing, poor health status and the exclusion of certain segments of the population from full participation in the development of the city (City of Cape Town 2006a, p32). There has been rising poverty in the city (from 25% in 1996 to 38% of households living below or marginally above the household poverty line in 2005); increasing HIV prevalence among women visiting public health clinics (from 1,2% in 1994 to 15% in 2005) and increasing tuberculosis cases (from 13 870 in 1997 to 26 754 in 2005) (City of Cape Town, 2007b).
(ii) Socio-Economic Status Index
The Socio-Economic Status Index (S.E.S.) is an important concept in measuring social and economic well-being. To measure S.E.S. in the city, the following indicators were used:
Percentage of households earning less than R19 200 per annum (2001)
Percentage of adults (20+) with highest educational level less than matric
Percentage of the economically active population that was unemployed
Percentage of the labour force employed in elementary/unskilled occupations
Each of these indicators represents a single dimension of S.E.S., such as household income or education. These indicators are combined to form an index, which represent a wider understanding of socio-economic status. In each case, the higher the score on the indicator or index, the worse off is the district concerned. District F: Mitchells Plain / Khayelitsha is the worst off at 54.12 followed by District G: Klipfontein / False Bay at 40.43. District H: Southern is the best off at 22.16 (See Table 6) (City of Cape Town, 2007b). Programmes to change the poor socio-economic status should focus on the districts (or areas within districts) which are worse off in terms of SES. To achieve this, the three spheres of government and civil society should work together to ensure a range of coordinated interventions that maximize opportunities for human and economic capital development at all stages of life. This may include improving the level of education through expanded training programmes and youth development programmes, integrated health action and social capital development programmes which support community-based organizations. Also important is that poverty alleviation and job creation should be addressed through minimising the loss of valuable agricultural land for housing purposes, developing small garden schemes to improve health of less affluent communities, promoting urban agriculture to provide training and start funds for agricultural projects. The City‟s Economic and Human Development Strategy and Policy (2006) recognizes this important link hence the economic and human aspects in the strategy.

Planning Districts Socio-Economic Analysis 2007
11 October 2007 Strategic Development Information and GIS Department Page 22
Table 6: Socio-Economic Status Index (S.E.S.)
Planning District
% Adults (20+) with highest
qualification < matric
% of economically
active unemployed
% Households earning <
R19200 pa
% of labour force in
unskilled occupations
S.E.S. Index
A: Table Bay 46.68 22.67 34.70 14.61 29.67
B: West Coast 54.28 22.11 29.22 15.28 30.22
C: Northern
46.35 19.26 28.82 17.31 27.94
D: Tygerberg 62.63 23.19 28.22 15.09 32.28
E: Eastern
61.67 26.85 38.90 23.42 37.71
F: Mitchells Plain /
Khayelitsha 76.72 45.16 62.44 32.15 54.12
G: Klipfontein / False Bay 70.52 31.05 40.28 19.86 40.43
H: Southern 40.60 13.43 22.20 12.39 22.16
Total
62.03 29.38 39.00 21.46 37.97
City of Cape Town, 2007b
3.3 Housing and Services (i) Dwelling Type
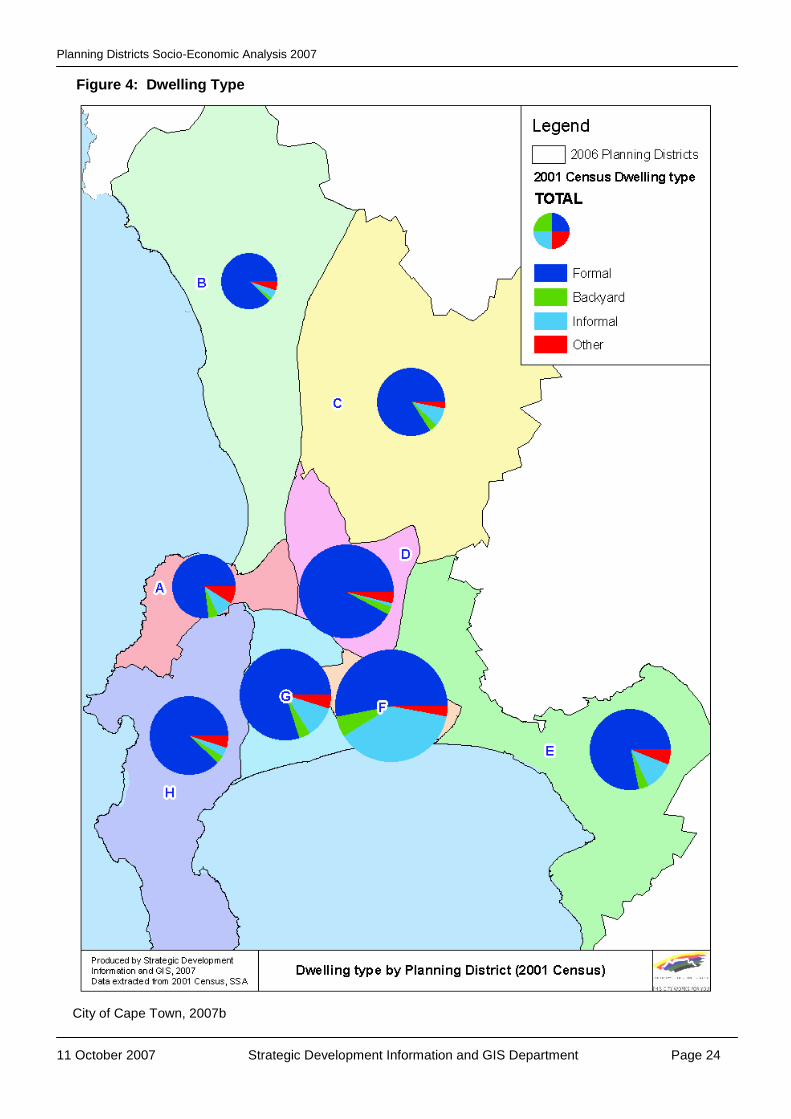
Approximately 30% of households (almost one million people) in Cape Town live in inadequate housing and depressed physical environments, including informal settlements. There has been growth in the number of people living in informal settlements in the city, from 23 000 families in 1993 to approximately 120 000 families in 2007. These areas are characterised by severe social and economic conditions, which manifest in high levels of poverty, unemployment, illiteracy, alcoholism, low health status and deviant behaviour such as crime and delinguency. The low health status of residents in informal settlements, for example, is due to poor living conditions and a lack of health facilities. In short, there is clearly a need for the upgrading of the living conditions of these residents (City of Cape Town 2006a). At just over 90% District D: Tygerberg has the largest percentage of formal dwellings followed by Districts B and H at 88%. District F: Mitchells Plain / Khayelitsha has the highest percentage of informal dwellings at 43.7% followed by District E: Eastern (15.6%) and District G: Klipfontein / False Bay (15.1%). Informal dwelling includes those in back yards. „Other‟ includes traditional dwellings, caravans, tents, private ships or boats and institutions. Table 7 shows the dwelling types for each district (City of Cape Town, 2007b). While the distribution of the different dwelling types can be seen in Figure 4.

Planning Districts Socio-Economic Analysis 2007
11 October 2007 Strategic Development Information and GIS Department Page 23
Table 7: Dwelling Type
Planning District
Formal Dwelling %
Informal Dwelling %
Other (including backyard) % Total %
A: Table Bay 44,550 76.71 8,059 13.88 5,470 9.42 58,079 100.00
B: West Coast 38,956 88.06 3,225 7.29 2,059 4.65 44,240 100.00
C: Northern
56,385 84.89 8,232 12.39 1,806 2.72 66,423 100.00
D: Tygerberg 116,111 91.44 5,629 4.43 5,239 4.13 126,979 100.00
E: Eastern
73,286 78.65 14,557 15.62 5,332 5.72 93,175 100.00
F: Mitchells Plain /
Khayelitsha 95,839 53.31 78,629 43.74 5,312 2.95 179,780 100.00
G: Klipfontein / False Bay 94,735 79.50 18,097 15.19 6,335 5.32 119,167 100.00
H: Southern 77,948 87.52 6,328 7.11 4,782 5.37 89,058 100.00
Total
597,810 76.95 142,756 18.38 36,335 4.68 776,901 100.00
City of Cape Town, 2007b
Planning Districts Socio-Economic Analysis 2007
11 October 2007 Strategic Development Information and GIS Department Page 24
Figure 4: Dwelling Type
City of Cape Town, 2007b
Planning Districts Socio-Economic Analysis 2007
11 October 2007 Strategic Development Information and GIS Department Page 25
Figure 5 shows distribution of informal settlements and Table 8 the informal settlement counts in the city1. District F: Mitchells Plain / Khayelitsha has the largest number of informal dwellings which has increased significantly over the four years. This is followed by District G: Klipfontein / False Bay. District D: Tygerberg has the lowest number of informal dwellings. The biggest decrease in informal dwellings has occurred in District E: Eastern (City of Cape Town, 2007b). The districts with the greatest proportion of informal dwellings (and pockets of informal dwellings within other districts) should be prioritized in an incremental approach to the development of housing, to focus on the provision of a broad range of housing opportunities. This housing should be integrated with other services (e.g. economic and social development) to ensure the development of integrated settlements. The incremental approach to development should include the release of land for housing, upgrading of informal settlements, provision of basic municipal services, supporting communities to complete their own homes over time, emergency housing and the development of social housing in the right locations - and links and access to areas of economic opportunity.
1 Counts of dwellings in informal settlements have been done from aerial photographs

Planning Districts Socio-Economic Analysis 2007
11 October 2007 Strategic Development Information and GIS Department Page 26
Figure 5 - Distribution of Informal Dwellings
City of Cape Town, 2007b

Planning Districts Socio-Economic Analysis 2007
11 October 2007 Strategic Development Information and GIS Department Page 27
Table 8: Informal Settlement Counts Planning District
Count Count Count Count Count
Jun-06 % Jan-05 % Jan-04 % Jul-03 % Feb-02 %
A: Table Bay
3,478 3.34 3,880 3.96 5,045 5.31 5,766 5.95 4,843 5.79
B: West Coast
5,303 5.09 4,676 4.77 4,491 4.73 4,766 4.92 3,096 3.7
C: Northern 4,005 3.84 2,226 2.27 2,482 2.61 4,022 4.15 3,254 3.89
D: Tygerberg
1,245 1.19 908 0.93 845 0.89 812 0.84 805 0.96
E: Eastern 8,936 8.57 9,894 10.09 9,792 10.31 11,063 11.41 11,633 13.9
F: Mitchells Plain/
Khayelitsha
60,727 58.27
60,019 61.22 56,425 59.41 53,147 54.82 46,424 55.48
G: Klipfontein/ False Bay
16,942 16.26
13,331 13.6 13,181 13.88 13,894 14.33 11,439 13.67
H: Southern
3,580 3.44 3,097 3.16 2,711 2.85 3,481 3.59 2,190 2.62
Total 104,216 100 98,031 100 94,972 100 96,951 100 83,684 100
City of Cape Town, 2007b
(ii) Level of Services
There has been an increasing housing backlog in the city - from 150 000 in 1998 to 350 000 in 2007. Apart from the housing backlogs in the city, the need to provide new infrastructure to accommodate economic, urban and population growth, coupled with competing funding demands has meant that Cape Town is suffering from a combination of bulk infrastructure backlog and backlogs in the provision of basic services (City of Cape Town 2006a). See Table 9 for service levels in the metropolitan area.
Table 9: Service Levels in Cape Town
City of Cape Town 1996 2001 2004 2005
Demograph
Number of Households 651 972 759 765 875 774
Population 2 563 095 2 893 251 3 151 006
Refuse Removal
% of households without weekly refuse removal
10,2% 5,8% 2,0% 3,93%
Number of households without weekly refuse removal
65 882 45 031 34 413
Water Supply
% of households without piped water on site
10,2% 15,6% 6,0% 7,01%
Number of households without piped water on site
66 133 121 258 61 387
Toilet Facilities
% of households without flush toilet
10,4% 12,5% 9,7% 7,85%
Number of households without flush toilet
67 785 96 799 68 782
Electricity Supply
% of households without electricity supply
12,8% 11,2% 3,0% 4,54%
Number of households without electricity supply
82 928 87 024 39 770
City of Cape Town 2006a

Planning Districts Socio-Economic Analysis 2007
11 October 2007 Strategic Development Information and GIS Department Page 28
The majority of households in Cape Town have access to basic services. In order to highlight those households that lack access to basic services, 2001 Census indicators (which are summarized by the service level index), were used to determine the percentage of households with no access to certain levels of services (City of Cape Town, 2007b).
The Service Level Index (S.L.I.) reflects a partial understanding of deprivation and needs to be complemented by indicators showing access to services and amenities (City of Cape Town, 2007b). The following indicators, to measure the level of access to basic services, were derived from the 2001 Census data:
Percentage households living in informal dwellings
Percentage households with no access to electricity for lighting
Percentage households with no flush or chemical toilets
Percentage households with no potable water on the site or in the dwelling
Percentage households with no refuse removal by local authorities weekly or less (City of Cape Town, 2007b).
The higher the score on the indicator or index, the worse off is the District concerned. Once again District F: Mitchells Plain/Khayelitsha is the worst off with a value of 26.37 followed by District E: Eastern with a value of 13.04. With a value of 3.30 District D: Tygerberg is the best off (see Table 10) (City of Cape Town, 2007b). This means that the districts that are worst off in terms of the provision of services (as well as areas within districts that are worst off), should be the focus of basic service provision and be prioritised.
Table 10: Service Level Index
Planning District
% Households
living in Informal
Dwellings
% Households with no access
to electricity for lighting
% Households with no flush or chemical
toilet
% Households with no potable water on-site or
in-dwelling
% Households with no refuse
removal by local authority weekly
or less Service Index
A: Table Bay 13.88 9.96 10.80 14.97 1.76 10.27
B: West Coast 7.29 9.30 8.56 10.50 6.69 8.47
C: Northern
12.39 12.92 6.99 10.76 4.87 9.59
D: Tygerberg 4.43 2.30 3.28 5.26 1.21 3.30
E: Eastern
15.62 12.41 11.63 17.59 7.93 13.04
F: Mitchells Plain/
Khayelitsha 43.74 22.54 27.43 29.98 8.15 26.37
G: Klipfontein/ False Bay 15.19 8.96 12.61 14.95 2.80 10.90
H: Southern 7.11 3.32 3.72 6.65 1.23 4.41
Total
18.90 11.19 12.47 15.58 4.18 12.46
City of Cape Town 2006b
Planning Districts Socio-Economic Analysis 2007
11 October 2007 Strategic Development Information and GIS Department Page 29
3.4 Crime
One of the Cape Town‟s main challenges is its high crime rate. The current state of the city‟s crime rate over the past few years has demonstrated a stabilising situation in some sectors, although far from normalised. Cape Town has one of the highest murder rates in the world with an annual murder rate of more than 62 per 100 000 people – which is an average of five murders every day (City of Cape Town 2006a). The city also has one of the highest reported rape rates in the world (roughly three and a half times as high as the average American city). The city also has a high incidence of drug-related crime which has been increasing dramatically over the past few years.
(i) Murder
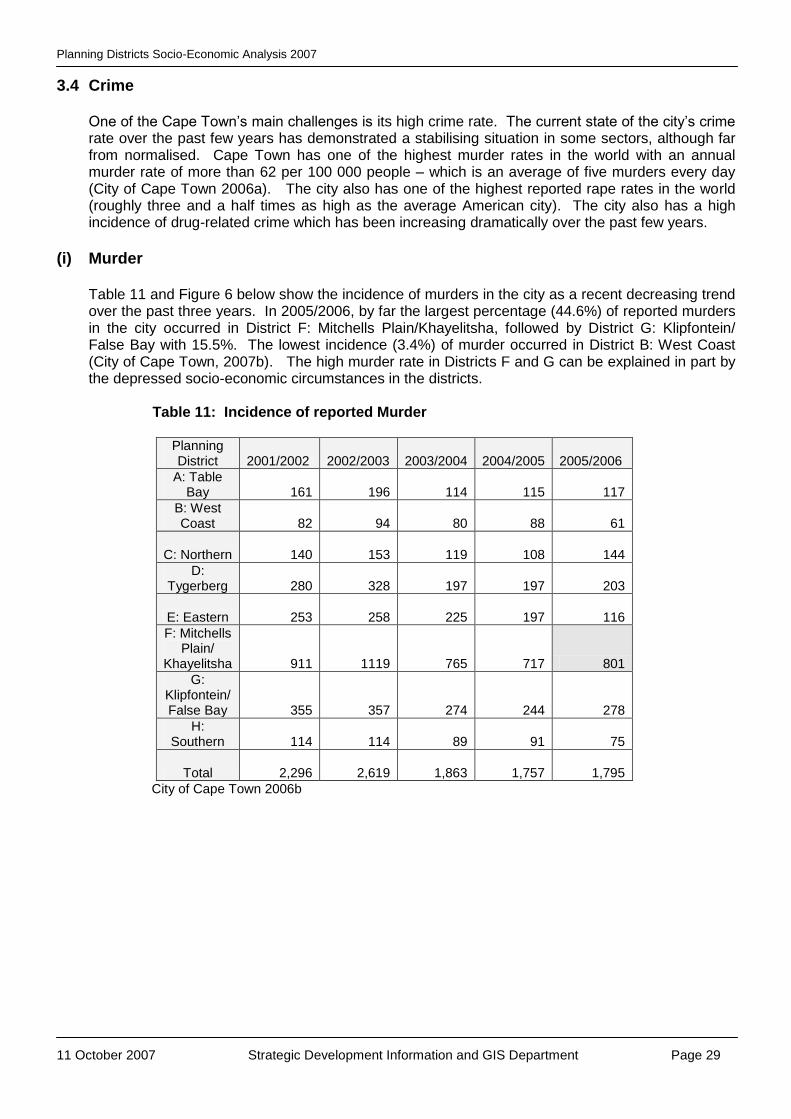
Table 11 and Figure 6 below show the incidence of murders in the city as a recent decreasing trend over the past three years. In 2005/2006, by far the largest percentage (44.6%) of reported murders in the city occurred in District F: Mitchells Plain/Khayelitsha, followed by District G: Klipfontein/ False Bay with 15.5%. The lowest incidence (3.4%) of murder occurred in District B: West Coast (City of Cape Town, 2007b). The high murder rate in Districts F and G can be explained in part by the depressed socio-economic circumstances in the districts. Table 11: Incidence of reported Murder
Planning District 2001/2002 2002/2003 2003/2004 2004/2005 2005/2006
A: Table Bay 161 196 114 115 117
B: West Coast 82 94 80 88 61
C: Northern
140 153 119 108 144
D: Tygerberg 280 328 197 197 203
E: Eastern
253 258 225 197 116
F: Mitchells Plain/
Khayelitsha 911 1119 765 717 801
G: Klipfontein/ False Bay 355 357 274 244 278
H: Southern 114 114 89 91 75
Total
2,296 2,619 1,863 1,757 1,795
City of Cape Town 2006b

Planning Districts Socio-Economic Analysis 2007
11 October 2007 Strategic Development Information and GIS Department Page 30
Figure 6: Percentage of cases of reported Murder in 2005/2006
3.4
4.2
6.5
6.5
8.0
11.3
15.5
44.6
0 5 10 15 20 25 30 35 40 45 50
B
H
E
A
C
D
G
F
Pla
nn
ing
Dis
tric
t
%
City of Cape Town 2006b
(ii) Rape
Table 12 and Figure 7 show the incidence of reported rape in the city as a stabilising trend with a slight reduction in 2005/2006. In 2005/2006 District F: Mitchells Plain Khayelitsha has the highest incidence at 33.9% of reported rapes occurring in the city, followed by District D: Tygerberg with 14.9% and District G: Klipfontein / False Bay with 12.6%. The lowest incidence (6%) of reported rape occurs in District B: West Coast. The percentage of reported cases of rape in 2005/2006 is shown in Figure 7 (City of Cape Town, 2007b). The high occurrence of rape in some districts can be explained in part by the depressed socio-economic circumstances and the breakdown of the social fabric in these districts.
Table 12: Incidence of reported Rape
Planning District 2001/2002 2002/2003 2003/2004 2004/2005 2005/2006
A: Table Bay 283 301 295 293 265
B: West Coast 183 195 183 221 219
C: Northern
224 216 185 212 236
D: Tygerberg 718 642 673 618 546
E: Eastern
554 518 558 551 434
F: Mitchells Plain /
Khayelitsha 1,199 1,088 1,061 1,214 1,241
G: Klipfontein / False Bay 553 561 460 532 461
H: Southern 326 288 264 302 257
Total
4,040 3,809 3,679 3,943 3,659
City of Cape Town 2006b

Planning Districts Socio-Economic Analysis 2007
11 October 2007 Strategic Development Information and GIS Department Page 31
Figure 7: Percentage of reported cases of Rape in 2005/2006
6.0
6.4
7.0
7.2
11.9
12.6
14.9
33.9
0 5 10 15 20 25 30 35 40
B
C
H
A
E
G
D
F
Pla
nn
ing
Dis
tric
t
%
City of Cape Town 2006b
(iii) Business Crime
Incidents of reported business crime have shown a steady decline over the past five years (Table 13 and Figure 8). A quarter of the business crime in the city in 2005/2006 occurred in District A: Table Bay, with District D: Tygerberg (19.2%) as the next highest. District C: Northern (6.5%) has the lowest incidence of business crime (Figure 8) (City of Cape Town, 2007b). The high occurrence of business crime in District A: Table Bay and D can be explained by the large proportion and value of businesses situated in these districts. The decline in reported business crime may be due to the positive impact of increased private security in business areas. An important implication of the prevention of business crime for enforcement agencies such as the Metro Police is to be aware that safety and security issues are not only community-based but should also include security and safety in main business areas, as this has a direct impact on investors and investor decisions, indirectly affecting communities.
Table 13: Incidence of reported Business Crime
Planning District 2001/2002 2002/2003 2003/2004 2004/2005 2005/2006
A: Table Bay 3,643 3,170 2,945 2,674 2,673
B: West Coast 1,111 1,116 1,139 937 872
C: Northern
802 931 703 691 684
D: Tygerberg 3,229 3,082 2,946 2,144 2,031
E: Eastern
1,578 1,441 1,225 1,195 965
F: Mitchells Plain /
Khayelitsha 1,022 908 869 932 965
G: Klipfontein / False Bay 1,520 1,156 1,018 936 886
H: Southern 2,108 1,714 1,448 1,331 1,515
Total
15,013 13,518 12,293 10,840 10,591
City of Cape Town 2006b

Planning Districts Socio-Economic Analysis 2007
11 October 2007 Strategic Development Information and GIS Department Page 32
Figure 8: Percentage of reported cases of Business Crime in 2005/2006
6.5
8.2
8.4
9.1
9.1
14.3
19.2
25.2
0 5 10 15 20 25 30
C
B
G
E
F
H
D
A
Pla
nn
ing
Dis
tric
t
%
City of Cape Town 2006b
(iv) Drug-related Crime
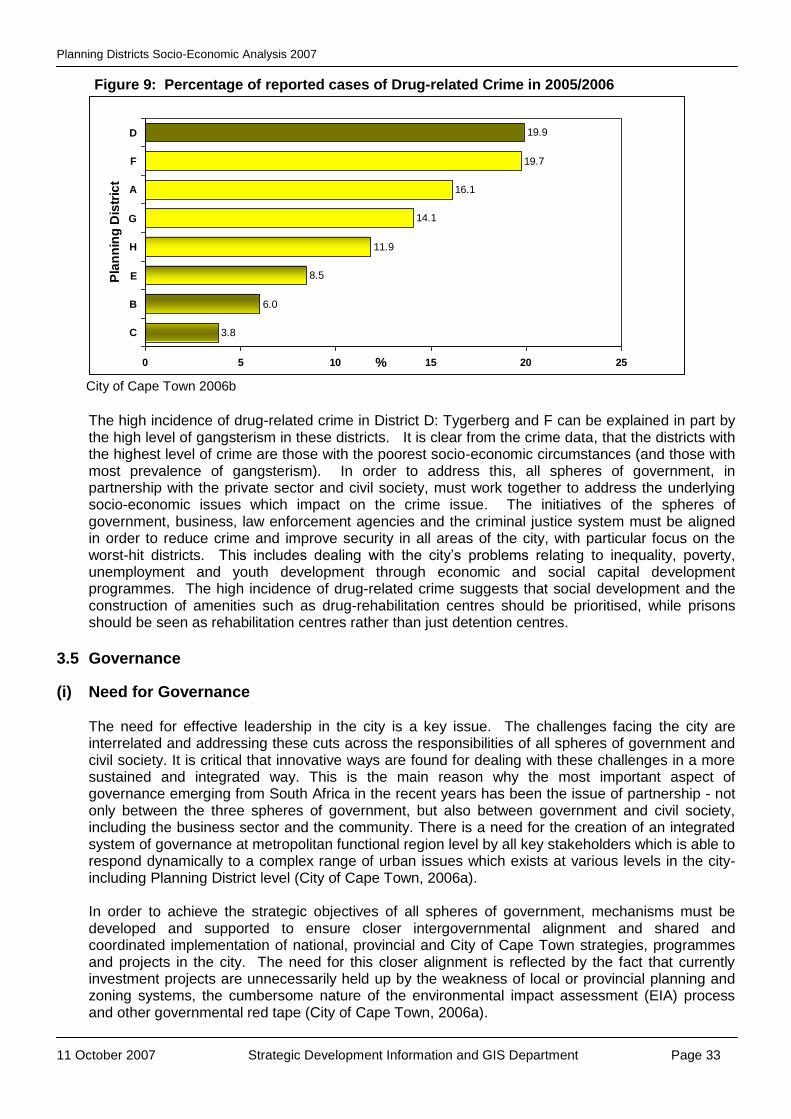
Alarmingly, the incidence of reported drug-related crime has show a significant increase since 2002/2003, from 232 per 100 000 to 402 per 100 000 in 2004/5. The incidence is highest (19.9%) in District D: Tygerberg followed by District F: Mitchells Plain / Khayelitsha (19.7%). District C: Northern has the lowest incidence (3.8%) (City of Cape Town, 2007b). This is mainly due to the introduction of Chrystal-meth („Tik‟) in the city. See Table 14 and Figure 9.
Table 14: Incidence of reported Drug-related Crime
Planning District 2001/2002 2002/2003 2003/2004 2004/2005 2005/2006
A: Table Bay 1,711 1,596 1,985 2,905 3,165
B: West Coast 442 553 775 1,084 1,184
C: Northern
200 111 299 478 756
D: Tygerberg 1,120 1,479 1,804 2,907 3,906
E: Eastern
491 384 840 1,507 1,667
F: Mitchells Plain /
Khayelitsha 1,062 894 1,476 2,113 3,873
G: Klipfontein / False Bay 1,443 1,351 1,843 2,409 2,766
H: Southern 746 721 759 1,903 2,328
Total
7,215 7,089 9,781 15,306 19,645
City of Cape Town 2006b
Planning Districts Socio-Economic Analysis 2007
11 October 2007 Strategic Development Information and GIS Department Page 33
Figure 9: Percentage of reported cases of Drug-related Crime in 2005/2006
3.8
6.0
8.5
11.9
14.1
16.1
19.7
19.9
0 5 10 15 20 25
C
B
E
H
G
A
F
D
Pla
nn
ing
Dis
tric
t
%
City of Cape Town 2006b
The high incidence of drug-related crime in District D: Tygerberg and F can be explained in part by the high level of gangsterism in these districts. It is clear from the crime data, that the districts with the highest level of crime are those with the poorest socio-economic circumstances (and those with most prevalence of gangsterism). In order to address this, all spheres of government, in partnership with the private sector and civil society, must work together to address the underlying socio-economic issues which impact on the crime issue. The initiatives of the spheres of government, business, law enforcement agencies and the criminal justice system must be aligned in order to reduce crime and improve security in all areas of the city, with particular focus on the worst-hit districts. This includes dealing with the city‟s problems relating to inequality, poverty, unemployment and youth development through economic and social capital development programmes. The high incidence of drug-related crime suggests that social development and the construction of amenities such as drug-rehabilitation centres should be prioritised, while prisons should be seen as rehabilitation centres rather than just detention centres.
3.5 Governance
(i) Need for Governance The need for effective leadership in the city is a key issue. The challenges facing the city are interrelated and addressing these cuts across the responsibilities of all spheres of government and civil society. It is critical that innovative ways are found for dealing with these challenges in a more sustained and integrated way. This is the main reason why the most important aspect of governance emerging from South Africa in the recent years has been the issue of partnership - not only between the three spheres of government, but also between government and civil society, including the business sector and the community. There is a need for the creation of an integrated system of governance at metropolitan functional region level by all key stakeholders which is able to respond dynamically to a complex range of urban issues which exists at various levels in the city- including Planning District level (City of Cape Town, 2006a). In order to achieve the strategic objectives of all spheres of government, mechanisms must be developed and supported to ensure closer intergovernmental alignment and shared and coordinated implementation of national, provincial and City of Cape Town strategies, programmes and projects in the city. The need for this closer alignment is reflected by the fact that currently investment projects are unnecessarily held up by the weakness of local or provincial planning and zoning systems, the cumbersome nature of the environmental impact assessment (EIA) process and other governmental red tape (City of Cape Town, 2006a).

Planning Districts Socio-Economic Analysis 2007
11 October 2007 Strategic Development Information and GIS Department Page 34
(ii) Subcouncils
In order to be part of a global, competitive world, it is part of the City‟s vision is to deliver services of a high standard which are effective, sustainable and in accordance with the wishes and needs of its inhabitants. The Council is client-focused and from its beginning promised to take governance closer to the people. The Council has therefore established 23 subcouncils which have as their base a political, community and a service interface, serving the 105 wards of the city. Each subcouncil is a structure:
Consisting of a number of adjoining wards, clustered together comprising ward councillors and proportional councillors
Which has the power in terms of the Municipal Structures Act to make recommendations on any matter affecting the area
Which can also in terms of law, be given delegated powers or be instructed to perform any duty of the Council (City of Cape Town, 2007c)
The Subcouncil boundaries and those of the planning districts do not correlate, with many districts including more than one subcouncil (Table 15). The subcouncil and planning district boundaries can be seen in Figure 10.
Table 15: Planning Districts and 2007 Subcouncils
Planning Districts and 2007 Subcouncils
District A: Table Bay 15, 16
District B: West Coast 1
District C: Northern 2, 3, 7
District D: Tygerberg 4, 5, 6, 23
District E: Eastern 8, 21, 22
District F: Mitchells Plain / Khayelitsha 9, 10, 12, 13, 14
District G: Klipfontein / False Bay 11, 17, 18
District H: Southern 19, 20

Planning Districts Socio-Economic Analysis 2007
11 October 2007 Strategic Development Information and GIS Department Page 35
Figure 10: Planning Districts and 2007 Subcouncils

Planning Districts Socio-Economic Analysis 2007
11 October 2007 Strategic Development Information and GIS Department Page 36
(iii) Integrated Development Plan
The City of Cape Town‟s five year Integrated Development Plan (IDP) (2011/2012) include seven strategic focus areas. It is essential that the district plans incorporate, support and implement these focus areas, which are:
Shared Economic Growth and Development: A strategy to attract investors, business and visitors and to grow and retain existing businesses is vital. This can be done by the creation of a strong enabling environment for business. This includes mechanisms to facilitate easy and regular interaction between investors, business and the City. Small business enterprise support with a specific emphasis on the development of the second economy and skills development are other key focus areas. Investment in transport and other infrastructure, including information communications technology are important enablers of economic growth and poverty reduction. Also important is the need to protect and manage its natural resource heritage. The delivery focus will be on unlocking economic development, job and business opportunities within the Cape Town area (City of Cape Town, 2007e).
Sustainable Urban Infrastructure and Services: A portion of the city‟s increasing population does not have access to basic services. Increasingly-stressed infrastructure is impairing sustainable service delivery, social development and economic growth in the city. The reality is that all the infrastructure requirements cannot be met simultaneously, given the limitations of the current budget and the financing models. Ecologically sustainable forms of infrastructure should also be taken into consideration. Reduced resource flows and lower levels of pollutants would also contribute to improved living environments. An approach based on demand management to relieve pressure on infrastructure development, resource impacts and capital expenditure is urgently needed (City of Cape Town, 2007e).
Public Transport Systems: Transforming and restructuring public transport systems to ensure that investment in public transport does not only focus on transport but also the improvement in the spatial development of the City. Integration of land use and transport through Integrated Transport Corridors and the building of homes close to transport corridors are needed to ensure improved access to community facilities and economic opportunities. The need for a public transport authority is a prerequisite to integration (City of Cape Town, 2007e).
Integrated Human Settlements: The need for integrated human settlements is one of the key challenges facing the city. The main human settlement challenges include the estimated 350 000 families without adequate access to shelter. The apartheid urban landscape remains largely unchanged with new assisted housing developments generally located on the periphery, far from work opportunities, amenities and facilities. New and existing settlement areas are characterised as uni-functional „housing areas‟ with a lack of integration with other land uses and transportation (City of Cape Town, 2007e).
Safety and Security: The negative impact of the current level of crime in Cape Town on attracting international and national investment on the quality of life and the retention of human capital and as well as the potential risk to the 2010 Word Cup Soccer event, is without doubt one of, if not the most important, strategic challenge. The focus is on integrating the efforts of all spheres of government, business and the public to work together to further strengthen and align the activities of law enforcement agencies, the criminal justice system, emergency and disaster risk management services (City of Cape Town, 2007e).
Health, Social and Human Capital Development: The city a reflection of the broader South African Society, with a dichotomy of the affluent and less affluent, skilled and unskilled, wellness and pathology. It is also characterized by vulnerable groups that find themselves on the margins of society i.e. youth, women, the disabled and those affected by extreme poverty. When social and human capital is low, the social fabric of society begins to disintegrate. In large parts of Cape Town this manifests as high incidences of drug and alcohol abuse, gang affiliation, crime

Planning Districts Socio-Economic Analysis 2007
11 October 2007 Strategic Development Information and GIS Department Page 37
against property and people, especially women and children. HIV/AIDS, Sexually Transmitted Diseases and Turbeculoses are yet other challenges that are closely linked to the social and human capital capacity of citizens (City of Cape Town, 2007e).
Good governance and regulatory reform: To effectively execute various institutional improvements and to give effect to the IDP challenges there is a high priority need to optimise the organization. The focus, therefore, is on an intensive effort to develop and sustain a much improved City Administration as well as improving the Regulatory Environment to maximise the impact of public investment and service delivery on the development potential of Cape Town (City of Cape Town, 2007e).

Planning Districts Socio-Economic Analysis 2007
11 October 2007 Strategic Development Information and GIS Department Page 38
3.6 Spatial Planning
Cape Town‟s current urban form is unsustainable, economically unproductive and prevents spatial, racial and economic integration. Cape Town grew by 40% in developed land area in the period 1985-2005. Compared to the period 1977 to 1988, when the city developed by an average of 701 hectares per year, the city is now developing at an average rate of 1 232 hectares per year (almost double previous averages) - reflecting the tremendous development boom the city is currently experiencing (See Figure 11 for a comparison between the city‟s footprint in 1977 versus 2005). Although much of the recent growth has contributed to sprawl with relatively low-density suburban residential development driving this process, higher density, higher income residential development in the Central Business District (CBD) has accelerated in the past few years. Sprawl contributes to increasing commuting times as well as the loss of valuable agricultural land and areas with high biodiversity conservation potential. More dense development as opposed to sprawl benefits the city by greatly reducing the unit cost of piped water, sewers, drains and roads. The use of environmentally friendly energy sources and transport can reduce these costs even further (City of Cape Town 2006a) Figure 11: Cape Town’s urban footprint 1977 versus 2005
City of Cape Town (2006a)
Planning the future begins with an understanding of place and people in the present and the social and economic forces underlying the trends that are shaping the future. Change and growth are inevitable, pressure for development a given, but the city can, with foresight and insight, shape change, guide and direct development to ensure the best possible outcome for the city and its people. When undertaking spatial planning, it is important to understand the economic forces and trends in the city. Spatial plans can not significantly redirect these economic forces, but should take the underlying economic forces into account and can, at most, „bend the trend‟ of the economical forces (City of Cape Town, 2006a). The district plans should include the identification of land which is available for development, along with the spatial representation of economic activity, as these are useful elements in determining optimal plans for each district
The future spatial planning for the city should include and promote the following principles:
Spatial plans should take account of economic forces and trends in the city and should direct or „bend‟ these forces (and not go against them)
Spatial planning visions and plans should be linked to shorter-term implementation plans and be implemented through projects by means of the IDP
It should recognise the functional linkages between the city and its hinterland and the regional nature of the Cape economy and be driven by a partnership approach between the spheres of government, civil society and other towns in the region
It should manage / curb urban sprawl, promote densification and locate housing near jobs and transport

Planning Districts Socio-Economic Analysis 2007
11 October 2007 Strategic Development Information and GIS Department Page 39
Metropolitan plans and local area planning should be aligned and the land use management system should support and implement spatial planning principles
Spatial planning should be based on the principles of racial, spatial and economic integration
Transport and land use integration should be promoted and should be based on a multi-modal transport system which focuses on current and future areas of development (City of Cape Town, 2006a)
3.7 Economy
(i) Economic Trends
The district plans should take into account both macro-economic and local areas economic development trends and interventions, thereby promoting an integrated approach to planning in the districts.
In 2006, Cape Town‟s formal economy contributed about 11,1% (or R123,58 billion) to South Africa‟s Gross Domestic Product (GDP). Between 1995 and 2006, the city contributed 15,9% of South Africa‟s economic growth, and 82% of new provincial economic growth (or growth in new Gross Geographic Product). However, the improving national economic scenario over recent years has been driven by the strong global demand for resources, partly driven by rapid growth in China‟s economy, and has not had strong spin offs for the city‟s economy. The relatively strong Rand has had negative impacts on the global competitiveness of the city‟s major economic sectors. Currently, a key strength of the city‟s economy is that it is relatively well diversified. However, in line with global trends, there has been a shift towards the services sector, with the sectors experiencing most growth recently being finance and business services, trade, catering and accommodation, and transport and communication. These sectors should be actively supported and developed. This is not to say that development efforts should neglect the other sectors; it simply highlights a supply and demand trend. Unfortunately, it also highlights a trend that is largely incongruent with the skills supply of the labour market - many of Cape Town‟s skills reside in sector activity that is not currently contributing a large amount to the city‟s GGP (see section ii below) (City of Cape Town, 2007d). The manufacturing and government services sectors both declined as a percentage of total employment, between 1995 and 2006. Manufacturing, which accounts for 19,4% of employment, is in decline. The services and real estate sectors have been the major drivers of growth, with the city performing particularly well in an era of low national growth, and a large post-democracy increase in tourism and agricultural exports (City of Cape Town, 2006a). With regard to more specific economic trends, the following underlying macro-economic conditions will influence future sector activity and associated land use:
Globalisation: Competitors from other parts of the country and abroad are able to enter the market in the city with goods and services that employ people elsewhere rather than in the city. The relaxation of trade barriers and improved systems for communication and distribution remove many of the advantages Capetonians had in the past when it comes to supplying the local economy. This means that continuous improvements in productivity and competitiveness are needed to compete and to grow. Globalisation provides a threat to many of our traditional jobs – but it also provides avenues for innovation and expansion (City of Cape Town, 2005).
Economic Growth Rate: Cape Town‟s economy is very tightly linked to the prospects of the national economy. While there is the hope and aspiration that the economy may move towards the 6% annual growth rate that is needed to make an impact on national unemployment, there are no convincing signs that this will occur. The positive economic environment provides a base for innovation and an opportunity to develop new income-generating activities. The best

Planning Districts Socio-Economic Analysis 2007
11 October 2007 Strategic Development Information and GIS Department Page 40
progress that can be achieved will be slow and steady. Cape Town is likely to grow more strongly than the national economy as a whole, but not by a large measure (City of Cape Town, 2005).
Inflation: Inflation is expected to increase to five or six percent a year. Prices are likely to increase at a slightly faster rate because of the gradual, though variable, depreciation in the exchange rate. The great unknown factor is the price of oil, which will have an increasingly severe impact on prices if it continues at its present high levels (City of Cape Town, 2005).
Mismatch between skills and jobs: Prospects for the employment of less-skilled people will remain bleak. The nature of the new jobs that are created in the region is likely to favour people with a solid educational foundation. Faster growth will intensify the skills mismatch in the economy (City of Cape Town, 2005).
Transport: A revitalisation of the transport sector in the city has great potential to stimulate new business and employment. It creates direct economic activities - in providing transport services and in selling goods to passengers - and provides the improved mobility that assists people to find work or to apply for better jobs in places further from their home bases. An efficient and better-affordable transport sector will have dramatically positive effects for less affluent communities (City of Cape Town, 2005).
Manufacturing: The decline in employment in the city‟s traditional manufacturing sectors is likely to continue. This is particularly true of the clothing sector where intense competition from low wage countries has undermined the ability of the local industry to compete, despite its technical competence and well-trained work force. Manufacturing employment is stagnant or in decline over a wide range of sectors in South Africa as productivity rises. The prospects for employment are most positive in the services sector - but here the lack of appropriate skills is a problem (City of Cape Town, 2005).
Construction: A construction boom, fed by major city infrastructure, public works and maintenance projects, will provide employment opportunities for lower-skilled workers. While much of this employment is of relatively short duration, it will provide an important contribution to the livelihoods of people in less affluent areas (City of Cape Town, 2005).
Tourism: Tourism already stimulates significant employment. Its impact is hard to measure because of the overlapping sectors it covers. Tourism is not a major area for labour-intensive or low-skilled employment openings. People need to be well-skilled and to have an ability to survive the seasonal fluctuations in the sector (City of Cape Town, 2005).
Growth Sectors: A number of sectors within the city economy are showing strong signs of growth or of employment potential. These include call centres and back office processing, the ICT sector, film, financial services (which have a strong historical presence in the City), and niche manufacturing activities in areas such as boat and yacht building and furniture. The craft sector is supported by technical and marketing services provided by government and has the potential to employ many more people. Manual skills need to be complemented by training in finance and business management for entrepreneurs in this area (City of Cape Town, 2005).

Planning Districts Socio-Economic Analysis 2007
11 October 2007 Strategic Development Information and GIS Department Page 41
Figure 12: Cape Town’s Economic Output by Sector Classification, 2006
GGP per SIC Sector Cape Town 2006
-2,000
3,000
8,000
13,000
18,000
23,0002
14
10 7 9
11
17 1
13
12 4 8 5 3 6
15
22
19
18
23
16
21
20
Sector Classification
Ran
d V
alu
e (
Mn
)
City of Cape Town, 2007d
According to the Department of Trade and Industry (2002), 93% of Cape Town businesses are small, contributing approximately 50% of total output and 40% of total formal employment (City of Cape Town, 2006a). Figure 12 indicates economic output in terms of sector activity2.
For many years to come the city‟s second economy will remain a strong feature of Cape Town life and many people from less affluent communities will be involved with it. The national and international trend towards outsourcing and casualisation slows the growth of formal employment. But it may build a bridge into the second economy, creating economic opportunities, although at low wages and under disadvantageous conditions. Increasing numbers of people will have to „invent‟ a livelihood for themselves and their families, given the lack of formal-sector jobs and the high levels of competition for employment. Government‟s greatest contribution to easing the life of the less affluent since 1994 has been in broadening of the system of social grants. Careful encouragement, and respect for market preferences, can make the second economy more vibrant and broad-based (City of Cape Town, 2005).
(ii) Employment Status
Unemployment in the city has grown from 13% in 1997 to almost 23% in 2004, with a drop in 2005 to 20,7%3. The distribution of economic activity in the city has been highly skewed towards those
2 As per the Standardised Industrial Classification (SIC) codes
3 In terms of the Labour Force Survey 2005 (Stats SA)
1 Agriculture, forestry and fishing
2 Mining
3 Food, beverages and tobacco
4 Textiles, clothing and leather goods
5 Wood and paper; publishing and printing
6 Petroleum products, chemicals, rubber and plastic
7 Other non-metal mineral products
8 Metals, metal products, machinery and equipment
9 Electrical machinery and apparatus
10 Radio, TV, instruments, watches and clocks
11 Transport equipment
12 Furniture and other manufacturing
13 Electricity
14 Water
15 Construction
16 Wholesale and retail trade
17 Catering and accommodation
18 Transport
19 Communication
20 Finance and insurance
21 Business services
22 Community, social and other personal services
23 General government services
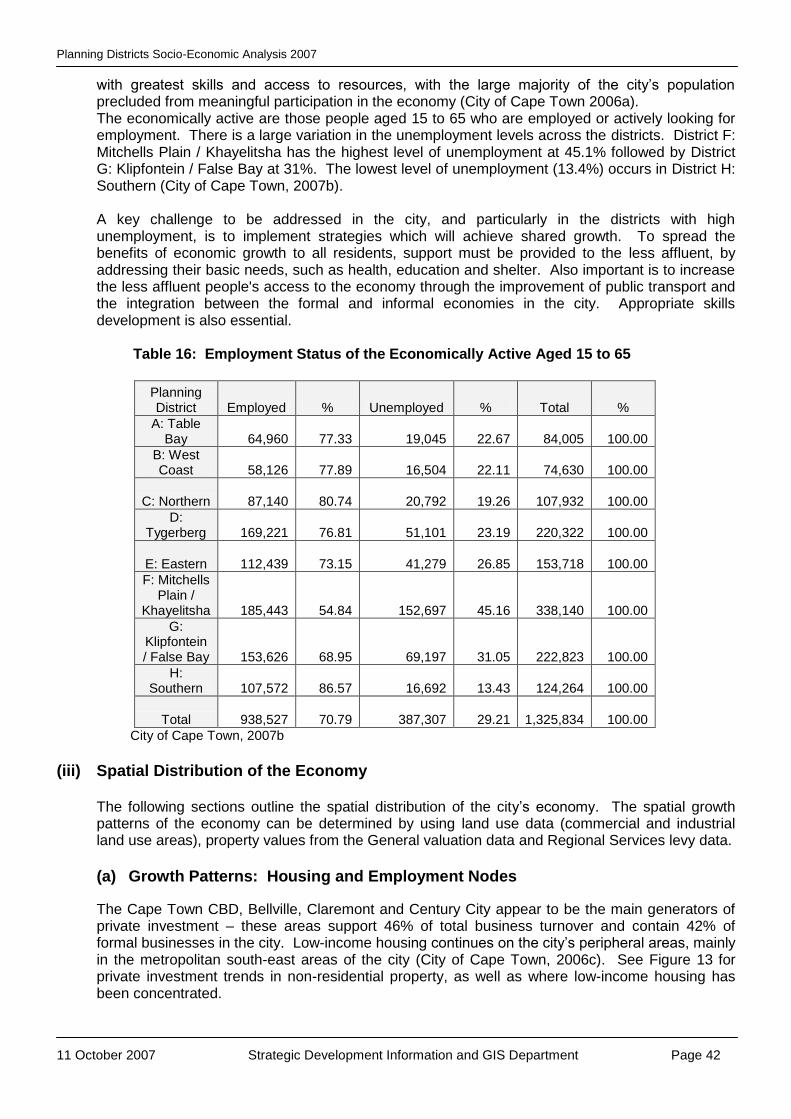
Planning Districts Socio-Economic Analysis 2007
11 October 2007 Strategic Development Information and GIS Department Page 42
with greatest skills and access to resources, with the large majority of the city‟s population precluded from meaningful participation in the economy (City of Cape Town 2006a). The economically active are those people aged 15 to 65 who are employed or actively looking for employment. There is a large variation in the unemployment levels across the districts. District F: Mitchells Plain / Khayelitsha has the highest level of unemployment at 45.1% followed by District G: Klipfontein / False Bay at 31%. The lowest level of unemployment (13.4%) occurs in District H: Southern (City of Cape Town, 2007b). A key challenge to be addressed in the city, and particularly in the districts with high unemployment, is to implement strategies which will achieve shared growth. To spread the benefits of economic growth to all residents, support must be provided to the less affluent, by addressing their basic needs, such as health, education and shelter. Also important is to increase the less affluent people's access to the economy through the improvement of public transport and the integration between the formal and informal economies in the city. Appropriate skills development is also essential.
Table 16: Employment Status of the Economically Active Aged 15 to 65
Planning District Employed % Unemployed % Total %
A: Table Bay 64,960 77.33 19,045 22.67 84,005 100.00
B: West Coast 58,126 77.89 16,504 22.11 74,630 100.00
C: Northern
87,140 80.74 20,792 19.26 107,932 100.00
D: Tygerberg 169,221 76.81 51,101 23.19 220,322 100.00
E: Eastern
112,439 73.15 41,279 26.85 153,718 100.00
F: Mitchells Plain /
Khayelitsha 185,443 54.84 152,697 45.16 338,140 100.00
G: Klipfontein / False Bay 153,626 68.95 69,197 31.05 222,823 100.00
H: Southern 107,572 86.57 16,692 13.43 124,264 100.00
Total
938,527 70.79 387,307 29.21 1,325,834 100.00
City of Cape Town, 2007b
(iii) Spatial Distribution of the Economy
The following sections outline the spatial distribution of the city‟s economy. The spatial growth patterns of the economy can be determined by using land use data (commercial and industrial land use areas), property values from the General valuation data and Regional Services levy data.
(a) Growth Patterns: Housing and Employment Nodes
The Cape Town CBD, Bellville, Claremont and Century City appear to be the main generators of private investment – these areas support 46% of total business turnover and contain 42% of formal businesses in the city. Low-income housing continues on the city‟s peripheral areas, mainly in the metropolitan south-east areas of the city (City of Cape Town, 2006c). See Figure 13 for private investment trends in non-residential property, as well as where low-income housing has been concentrated.

Planning Districts Socio-Economic Analysis 2007
11 October 2007 Strategic Development Information and GIS Department Page 43
Figure 13: Trends in Non-residential Property and Low-income Housing
City of Cape Town 2006c
(b) Commercial and Industrial Land-Use
Land use data gives some indication of the spatial distribution of the economy4. Commercial Land: Concentrations of commercial land-use are located in the Cape Town CBD and along several “activity corridor” roads including Voortrekker / Strand Road, Durban Road, Koeberg Road, Main Road (Salt River to Observatory and Claremont to Retreat), Lansdowne Road (Claremont to Lansdowne) and Main Road Strand. Large mall-type commercial developments such as Grand West, Somerset Mall, N1 City and V&A Waterfront are also shown (City of Cape Town 2007a). Industrial Land: The largest industrial areas (in terms of land use) are Epping, and Killarney and Montague Gardens (City of Cape Town 2007a).
Figure 14 shows commercial and industrial land-uses based on the 2000 General Valuation5 Industrial land uses showup more prominent in Figure 14 as industrial erven are typically larger than commercial erven (City of Cape Town 2007a).
4 However, land-use alone is not a good indicator of the spatial distribution of economic activity as the
intensity of land use is not taken into account. Space-extensive activities, such as warehousing, tend to be overemphasised, while multi-storey buildings are often underemphasised (City of Cape Town 2007a).
5 2006 General Valuation data was not yet finalised at the time of report

Planning Districts Socio-Economic Analysis 2007
11 October 2007 Strategic Development Information and GIS Department Page 44
Figure 14: Commercial and Industrial Land Use
City of Cape Town, 2007a

Planning Districts Socio-Economic Analysis 2007
11 October 2007 Strategic Development Information and GIS Department Page 45
(c) Commercial and Industrial Property Values
A good indicator of economic activity is the Rand value of the properties. The concentration of commercial and industrial land use indicate where main economic opportunities are situated. Table 16 shows property values of all commercial and industrial land use in the districts (a more detailed breakdown of economic land-uses can be found in the Appendix B) (City of Cape Town 2007a).
District A: Table Bay has by far the greatest value of all economic property (34%) and nearly 40% of all commercial properties. Aside from the Cape Town CBD, the district includes Epping (west of the N7), Paarden Island, Maitland, Salt River and Sea Point (City of Cape Town 2007a). This district has only 5.9% of the total population of the city. As District A: Table Bay has the highest incidence of business crime, it is important that the safety and security of business areas in the district be prioritised as this has a direct impact on investors and investor decisions. District B: West Coast and D contain significant industrial areas. District D: Tygerberg contains over 30% of all industrial property including Epping Industrial (west of N7), Airport Industria, Sacks Circle, Bellville, Parow, Stikland, Elsies River industrial areas. District B: West Coast contains the Killarney and Montague Gardens industrial areas (City of Cape Town 2007a). In order to provide a relative indication between districts, the Rand value of economic property per person is shown in Figure 15 below (City of Cape Town 2007a).
Table 16: Commercial and Industrial Property Values
A) Commercial Properties
Planning District Count
% Count
Total Property Value (R mill)
% Value
Building Value (R mill)
Land Value (R mill)
A: Table Bay 2,066 26.1% R 10,954 38.5% R 8,325 R 2,616
B: West Coast 395 5.0% R 2,033 7.1% R 1,433 R 600
C: Northern
588 7.4% R 3,599 12.6% R 2,742 R 857
D: Tygerberg 1,446 18.2% R 3,498 12.3% R 2,737 R 761
E: Eastern
792 10.0% R 1,678 5.9% R 1,166 R 512
F: Mitchells Plain /
Khayelitsha 289 3.6% R 850 3.0% R 551 R 299
G: Klipfontein / False Bay 920 11.6% R 980 3.4% R 710 R 270
H: Southern 1,430 18.0% R 4,872 17.1% R 3,445 R 1,427
Total
7,926 28,463 21,109 7,341
B) Industrial Properties
A: Table Bay 1,116 19.8% R 2,697 23.0% R 1,572 R 1,125
B: West Coast 953 16.9% R 2,762 23.5% R 1,928 R 834
C: Northern
445 7.9% R 530 4.5% R 367 R 163
D: Tygerberg 1,510 26.7% R 3,645 31.0% R 2,134 R 1,510
E: Eastern
784 13.9% R 814 6.9% R 536 R 278

Planning Districts Socio-Economic Analysis 2007
11 October 2007 Strategic Development Information and GIS Department Page 46
F: Mitchells Plain /
Khayelitsha 64 1.1% R 61 0.5% R 43 R 19
G: Klipfontein / False Bay 469 8.3% R 628 5.3% R 368 R 260
H: Southern 304 5.4% R 610 5.2% R 367 R 243
Total
5,645 11,746 7,315 4,431
C) Commercial and Industrial Properties (Sum of above 2 tables)
A: Table Bay 3,182 23.4% R 13,651 34.0% R 9,897 R 3,741
B: West Coast 1,348 9.9% R 4,795 11.9% R 3,361 R 1,434
C: Northern
1,033 7.6% R 4,128 10.3% R 3,109 R 1,019
D: Tygerberg 2,956 21.8% R 7,143 17.8% R 4,872 R 2,271
E: Eastern
1,576 11.6% R 2,492 6.2% R 1,701 R 791
F: Mitchells Plain /
Khayelitsha 353 2.6% R 911 2.3% R 594 R 317
G: Klipfontein / False Bay 1,389 10.2% R 1,608 4.0% R 1,078 R 529
H: Southern
1,734 12.8% R 5,482 13.6% R 3,811 R 1,670
Total
13,571 40,209 28,424 11,772
City of Cape Town 2007a
Figure 15: Economic Property per person (2000 Price/Rand value)
R 79,985
R 31,482
R 20,263 R 18,890
R 14,025
R 7,364
R 3,134R 1,266
R 0
R 10,000
R 20,000
R 30,000
R 40,000
R 50,000
R 60,000
R 70,000
R 80,000
R 90,000
A B H C D E G F
City of Cape Town 2007a
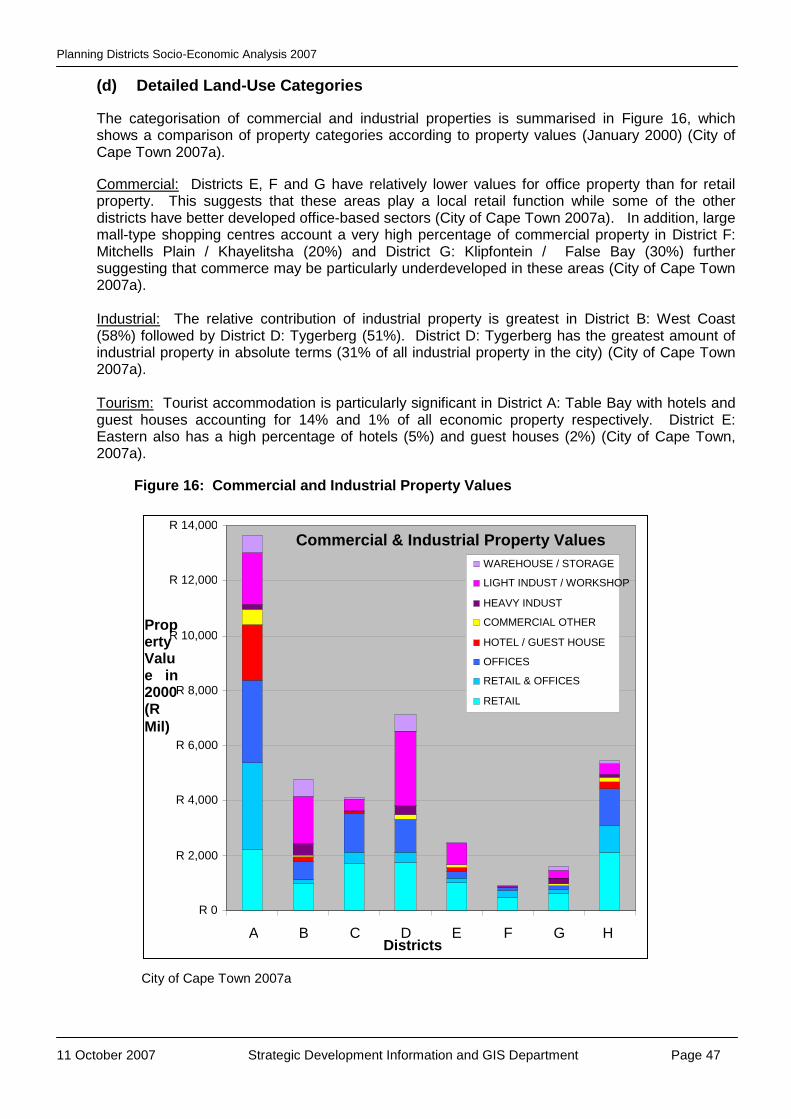
Planning Districts Socio-Economic Analysis 2007
11 October 2007 Strategic Development Information and GIS Department Page 47
(d) Detailed Land-Use Categories
The categorisation of commercial and industrial properties is summarised in Figure 16, which shows a comparison of property categories according to property values (January 2000) (City of Cape Town 2007a).
Commercial: Districts E, F and G have relatively lower values for office property than for retail property. This suggests that these areas play a local retail function while some of the other districts have better developed office-based sectors (City of Cape Town 2007a). In addition, large mall-type shopping centres account a very high percentage of commercial property in District F: Mitchells Plain / Khayelitsha (20%) and District G: Klipfontein / False Bay (30%) further suggesting that commerce may be particularly underdeveloped in these areas (City of Cape Town 2007a). Industrial: The relative contribution of industrial property is greatest in District B: West Coast (58%) followed by District D: Tygerberg (51%). District D: Tygerberg has the greatest amount of industrial property in absolute terms (31% of all industrial property in the city) (City of Cape Town 2007a). Tourism: Tourist accommodation is particularly significant in District A: Table Bay with hotels and guest houses accounting for 14% and 1% of all economic property respectively. District E: Eastern also has a high percentage of hotels (5%) and guest houses (2%) (City of Cape Town, 2007a).
Figure 16: Commercial and Industrial Property Values
City of Cape Town 2007a
Commercial & Industrial Property Values
R 0
R 2,000
R 4,000
R 6,000
R 8,000
R 10,000
R 12,000
R 14,000
A B C D E F G H Districts
WAREHOUSE / STORAGE
LIGHT INDUST / WORKSHOP
HEAVY INDUST
COMMERCIAL OTHER
HOTEL / GUEST HOUSE
OFFICES
RETAIL & OFFICES
RETAIL
Property Value in 2000 (R
Mil)

Planning Districts Socio-Economic Analysis 2007
11 October 2007 Strategic Development Information and GIS Department Page 48
(e) Economic Output / Turnover
Figure 17 shows economic output based on June 2006 Regional Services Levy Data6 - aggregated by postal code area7. Nevertheless only 67,502 out of 88,232 Levy Data records (77%) could be linked. This amounts to 83% of Levy Data economic output (City of Cape Town 2007a).
This data is useful as it indicates actual economic output / turnover rather than land use. It also includes economic activity outside of commercial and industrial areas (e.g. home-based businesses) which are missed by the land use based data. In terms of this, the most significant economic areas in the city are outlined in Table 18, which highlights where businesses are clustered and the value of businesses in the city. It also shows the skewed distribution of wealth and employment in the city (City of Cape Town 2007a).
6 The Regional Services Levy Database is for registered, formal businesses only (excludes non-levy
businesses as well as informal business). Although the Levy Database information is potentially a better source of information on economic spatial trends, it requires further cleaning of the “spatial-link” fields. Since 1 July 2006, after a National Treasury directive, the RSC Levy is no longer applicable to any business in South Africa, which means that this data source will not be updated and other alternative sources of information will need to be explored.
7 Postal codes currently provide the best spatial link to this data

Planning Districts Socio-Economic Analysis 2007
11 October 2007 Strategic Development Information and GIS Department Page 49
Figure 17: Formal Economic Output (in 2000 Rand Value)
City of Cape Town, 2007a

Planning Districts Socio-Economic Analysis 2007
11 October 2007 Strategic Development Information and GIS Department Page 50
Table 18: Main areas of economic clustering
Postal Code and Area Turnover % of Total
8001 (City Bowl, Foreshore and Waterfront) R62.9 mil 22.1%
7530 (Bellville, Durban Rd, Stikland) R34.4 mil 12.1%
7441 (Table View, Killarney and Montague Gardens) R27.5 mil 9.7%
7405 (Maitland, Ndabeni, Paarden Eiland) R22.2 mil 7.8%
7700 (Mowbray, Rondebosch, Claremont) R20.7 mil 7.3%
7460 (Epping, Goodwood) R19.3 mil 6.8%
City of Cape Town 2007a
(f) Spatial Economic Trends
Building plans submitted can also be used as an indicator of spatial economic trends. Figures 18 and 19 show building plans submitted between January 2005 and May 2006 for commercial and industrial properties respectively (City of Cape Town 2007a). Commercial Building Plans: The data indicates continuing investment in Districts A, B, C, D, E and H and again relatively little investment in Districts G and F. Significant concentrations of building plan submissions are evident in the CBD and Foreshore, Tableview, Somerset West, Durban Road and Claremont. Voortrekker Road is subject to a high number of relatively small building plan submissions (City of Cape Town 2007a). Industrial Building Plans: Districts B and D have the greatest value of building plans submitted. The data suggests significant investment in Montague Gardens, Parow, and Airport Industria (City of Cape Town 2007a). The implication of these spatial economic trends is that these areas have been and are important as economic growth catalysts. However, many of the areas are already full and the district plans should assist to identify new areas of opportunity and land use options for mixed use.

Planning Districts Socio-Economic Analysis 2007
11 October 2007 Strategic Development Information and GIS Department Page 51
Figure 18: Building Plans Submitted (Jan 2005 – May 2006): Commercial land
City of Cape Town, 2007a

Planning Districts Socio-Economic Analysis 2007
11 October 2007 Strategic Development Information and GIS Department Page 52
Figure 19: Building Plans Submitted (Jan 2005 – May 2006): Industrial Land
City of Cape Town, 2007a

Planning Districts Socio-Economic Analysis 2007
11 October 2007 Strategic Development Information and GIS Department Page 53
(g) Spatial Distribution of the Economy: Spatial Planning Implications Spatial planning should take account of economic forces and trends in the city and should direct these forces, and not go against them. While Districts A, B and D have a large proportion of the city‟s economic opportunities, Districts F and G are notably lacking in economic property (only 3.5% of all economic property). This is particularly significant considering that 42% of the city‟s population reside within these two districts. It is important that the criteria that businesses consider when investing are taken into account in the spatial planning for the city. As good access is important, large commercial developments usually follow highways. Locations where security will not be compromised are also favoured (which may be a reason why locations in the Cape Flats have been ignored by business in the past). The availability of infrastructure and services (i.e. roads, sewerage, water, etc.) a good quality attractive environment (especially for commercial development), and locations with a catchments of higher-order income wealth are also issues that are considered in making decisions about where to locate (City of Cape Town, 2006a). While it is necessary to maintain and reinforce the existing and growing commercial and industrial areas as current drivers of the economy and centres for employment (e.g. Districts A, B and D), it is crucial that new economic activity be attracted to the less affluent areas in the city (e.g. Districts F and G), to enable people to have access to closer services and job opportunities - thus reducing the need to travel. In this regard, spatial planning should promote the following:
the identification of development corridors
the promotion of public transport
the identification and release of land for economic activity at appropriate locations
the investment in infrastructure
the location of housing opportunities near economic opportunities
identification of facilities for the informal economy
the integration of land uses and promotion of mixed use (residential and non-residential)
the interaction between transport and land use are all necessary to achieve more equitable patterns of development.
Effective and realistic spatial planning for the city to promote the economy will only be achieved if effective partnerships are developed between the three spheres of government and the private sector. This is important due to the following reasons: a fundamental shift from metropolitan planning towards „regionalism‟ has taken place; intergovernmental action on a scale not seen before is needed to achieve the required results; and significant funding beyond the municipal budget is needed in order to implement the spatial vision for the city.
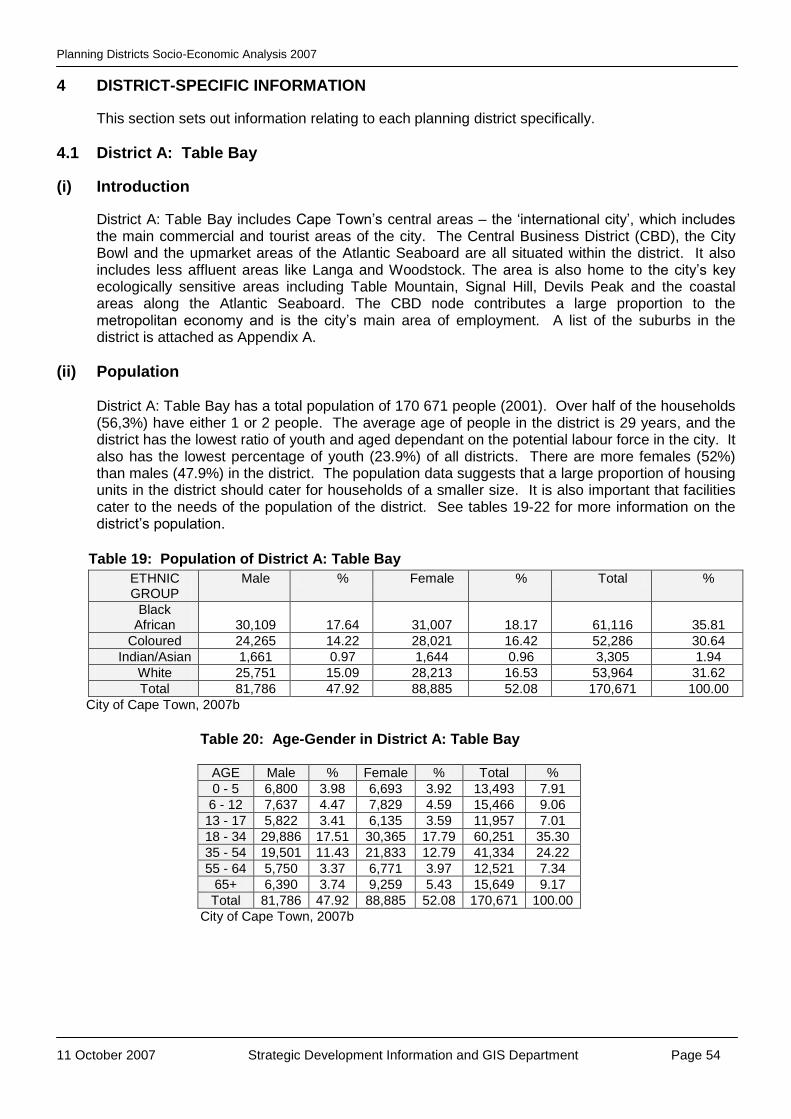
Planning Districts Socio-Economic Analysis 2007
11 October 2007 Strategic Development Information and GIS Department Page 54
4 DISTRICT-SPECIFIC INFORMATION
This section sets out information relating to each planning district specifically.
4.1 District A: Table Bay
(i) Introduction
District A: Table Bay includes Cape Town‟s central areas – the „international city‟, which includes the main commercial and tourist areas of the city. The Central Business District (CBD), the City Bowl and the upmarket areas of the Atlantic Seaboard are all situated within the district. It also includes less affluent areas like Langa and Woodstock. The area is also home to the city‟s key ecologically sensitive areas including Table Mountain, Signal Hill, Devils Peak and the coastal areas along the Atlantic Seaboard. The CBD node contributes a large proportion to the metropolitan economy and is the city‟s main area of employment. A list of the suburbs in the district is attached as Appendix A.
(ii) Population
District A: Table Bay has a total population of 170 671 people (2001). Over half of the households (56,3%) have either 1 or 2 people. The average age of people in the district is 29 years, and the district has the lowest ratio of youth and aged dependant on the potential labour force in the city. It also has the lowest percentage of youth (23.9%) of all districts. There are more females (52%) than males (47.9%) in the district. The population data suggests that a large proportion of housing units in the district should cater for households of a smaller size. It is also important that facilities cater to the needs of the population of the district. See tables 19-22 for more information on the district‟s population.
Table 19: Population of District A: Table Bay
City of Cape Town, 2007b
Table 20: Age-Gender in District A: Table Bay
AGE Male % Female % Total %
0 - 5 6,800 3.98 6,693 3.92 13,493 7.91
6 - 12 7,637 4.47 7,829 4.59 15,466 9.06
13 - 17 5,822 3.41 6,135 3.59 11,957 7.01
18 - 34 29,886 17.51 30,365 17.79 60,251 35.30
35 - 54 19,501 11.43 21,833 12.79 41,334 24.22
55 - 64 5,750 3.37 6,771 3.97 12,521 7.34
65+ 6,390 3.74 9,259 5.43 15,649 9.17
Total 81,786 47.92 88,885 52.08 170,671 100.00
City of Cape Town, 2007b
ETHNIC GROUP
Male % Female % Total %
Black African 30,109 17.64 31,007 18.17 61,116 35.81
Coloured 24,265 14.22 28,021 16.42 52,286 30.64
Indian/Asian 1,661 0.97 1,644 0.96 3,305 1.94
White 25,751 15.09 28,213 16.53 53,964 31.62
Total 81,786 47.92 88,885 52.08 170,671 100.00

Planning Districts Socio-Economic Analysis 2007
11 October 2007 Strategic Development Information and GIS Department Page 55
Table 21: Age in District A: Table Bay
Dependency Ratio 40.30
Index of Ageing 46.89
Median Age 29 years
City of Cape Town, 2007b
Table 22: Household Size in District A: Table Bay
HOUSEHOLD SIZE Number %
1 17,794 30.64
2 14,948 25.74
3 to 4 15,584 26.83
5 to 6 6,751 11.62
7 to 8 1,960 3.37
9+ 1,043 1.80
Total 58,079 100.00
City of Cape Town, 2007b
(iii) Economy8
District A: Table Bay is the main area of economic opportunity in the city with the largest concentration of economic activities - including most of the higher order services. It has by far the greatest value of all economic property (34%) and nearly 40% of all commercial properties. Tourist accommodation is particularly significant with hotels and guest houses in the district accounting for 14% and 1% of all economic property respectively. In terms of turnover, the district represents R62.9 million - which is 22.1% of the total in the city (City of Cape Town 2007a). Major changes have taken place within the Central Business District (CBD) - many previous office blocks have been converted to residential and office occupancies have decreased to some of the lowest rates in recent years. It has also seen major development of new office-, residential- and hotel developments on the Foreshore, especially the area closest to the Waterfront, including the new Cape Town International Conference Centre. Aside from the CBD, the district also includes other significant commercial and industrial areas, e.g. Epping (west of the N7), Paarden Island, Maitland, Salt River, Green Point and Sea Point. It is home to the Cape Town harbour and one of South Africa‟s top tourist attractions, the V&A Waterfront. The Waterfront was recently bought by a Dubai-based consortium which is planning to develop the area further. New residential and commercial development has also taken place in Woodstock. This trend is likely to continue due to the relative low property values and close proximity to the CBD. According to Census data 2001, most formal development (applications for residential and commercial) in the district took place in Langa (Proper), Pinelands and Sea Point. Commercial properties account for 26.1% (in terms of value) and industrial properties 19.8% in the district (see Table 23) (City of Cape Town 2007b).
8 The information in this section relates to the formal economy only and excludes the informal economy due
to the relevant data being unavailable

Planning Districts Socio-Economic Analysis 2007
11 October 2007 Strategic Development Information and GIS Department Page 56
Table 23: Commercial and Industrial Property Values
Commercial Properties
Count %
Count Total Property Value (R mill)
% Value
Building Value (R mill)
Land Value (R mill)
2,066 26.1% R 10,954 38.5% R 8,325 R 2,616
Industrial Properties
1,116 19.8% R 2,697 23.0% R 1,572 R 1,125
Commercial and Industrial Properties (Sum of above 2 tables)
3,182 23.4% R 13,651 34.0% R 9,897 R 3,741
City of Cape Town 2007a
Most of the economically active people in the district are employed (52.9%), while 15.5% are unemployed (Table 24).
Table 24: Employment status in District A: Table Bay
EMPLOYMENT STATUS - Aged 15 to 65
Male % Female % Total %
Employed 34,713 28.28 30,247 24.64 64,960 52.92
Unemployed 9,549 7.78 9,496 7.74 19,045 15.51
Economically Active Total 44,262 36.06 39,743 32.38 84,005 68.43
Not Economically Active 15,064 12.27 23,686 19.30 38,750 31.57
Grand Total 59,326 48.33 63,429 51.67 122,755 100.00
City of Cape Town 2007b
(iv) Crime
A quarter of the reported business crime in the city in 2005/2006 occurred in District A: Table Bay. The reason for the high level of business crime in the area may be due the fact that most major economic activity in the city takes place in the district (City of Cape Town 2007b). It should be noted, however, that since the Central City Improvement District was created in 2000, crime in the CBD has decreased significantly. The hiring of private security firms to patrol business areas has also had a significant impact on the business areas in the district.
(v) Housing
The majority of dwellings in District A: Table Bay consist of formal dwellings (76.71%), compared to 13.8% informal dwellings (Table 25). The area in the district with the most informal dwellings is Joe Slovo, with significant numbers also in District 6 (see Figure 20). As can be seen from Figure 18, the district is relatively well serviced, except for areas in Langa and Maitland Garden Village which have the lowest service levels in the district.
Table 25: Type of dwellings - District A: Table Bay
TYPE OF DWELLING Number %
Formal Dwelling 44,550 76.71
Informal Dwelling in back yard 3,042 5.24
Informal Dwelling not in back yard 5,017 8.64
Other 5,470 9.42
Total 58,079 100.00
City of Cape Town 2007b

Planning Districts Socio-Economic Analysis 2007
11 October 2007 Strategic Development Information and GIS Department Page 57
Figure 20: Informal Settlements - District A: Table Bay
City of Cape Town, 2007b
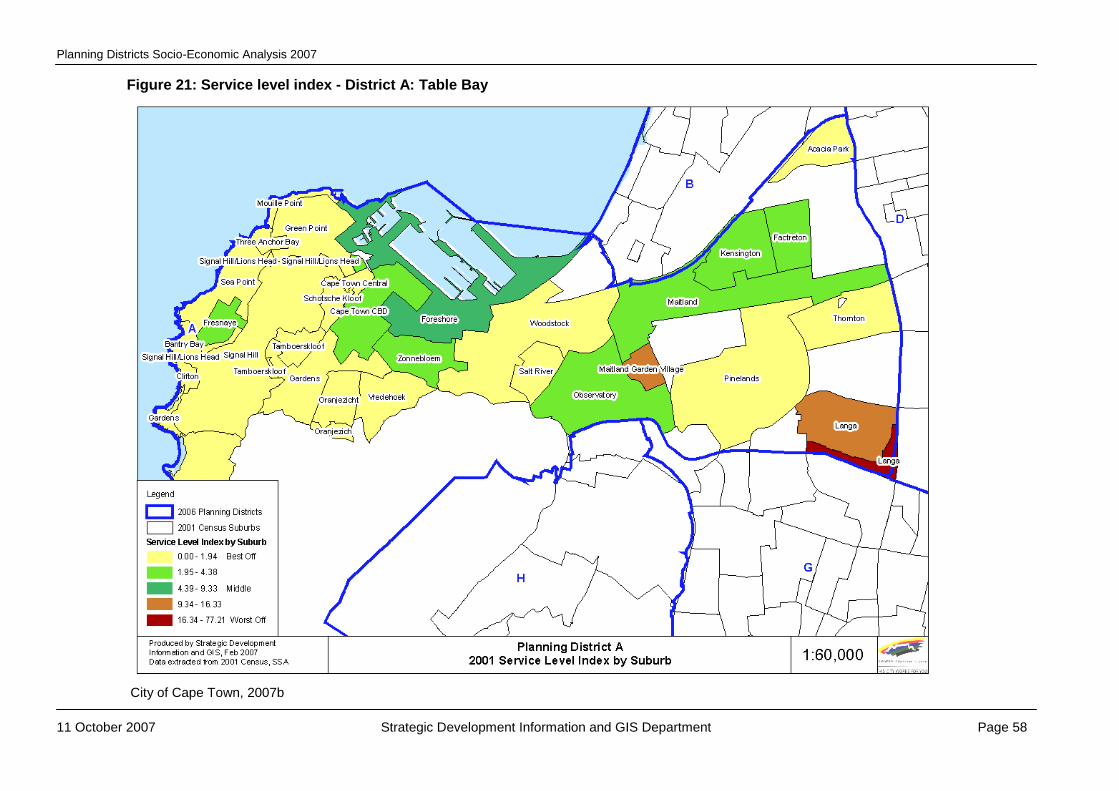
Planning Districts Socio-Economic Analysis 2007
11 October 2007 Strategic Development Information and GIS Department Page 58
Figure 21: Service level index - District A: Table Bay
City of Cape Town, 2007b

Planning Districts Socio-Economic Analysis 2007
11 October 2007 Strategic Development Information and GIS Department Page 59
(vi) Human and Social Development
The district has some of the highest income areas in the city, including on the Atlantic Seaboard and in the City Bowl. This is in strong contrast with areas like Langa, which is far less affluent and the area worst off in socio-economic indicator terms. Other areas with less affluent populations include Zonnebloem, Woodstock, Salt River, Maitland, Kensington, Factreton and Maitland Garden Village (Figure 22).

Planning Districts Socio-Economic Analysis 2007
11 October 2007 Strategic Development Information and GIS Department Page 60
Figure 22: Socio-economic status index - District A: Table Bay
City of Cape Town, 2007b

Planning Districts Socio-Economic Analysis 2007
11 October 2007 Strategic Development Information and GIS Department Page 61
(vii) Challenges and Opportunities
As the focal point of tourism in Cape Town, the district will continue to play a key role in tourism development in the city, especially relating to the World Cup 2010.
In order to enhance an equitable pattern of access, key sites within the district need to be released for appropriate development. Potential areas for development include the former District 6 area, the Culemborg site, the Wingfield site, the Green Point Common areas (development of a „special place/urban park‟ in preparation for Soccer World Cup 2010) and expansions to the V&A Waterfront. An area of opportunity for economic development is to extend the areas to the east of the CBD running parallel to the N1 and Voortrekker Road. Support for this economic „corridor‟ and the historic CBD is needed by ensuring appropriate high density development with the redevelopment of District 6 (City of Cape Town 2006b). The upgrading of the Cape Town station and the Grand Parade Revitalisation project are two major projects which will have an impact not only on the district, but on the city as a whole. Also important is the development of entertainment and retail opportunities at street level to compliment the residential component of the CBD - thus contributing to the vitality of the CBD and its „24-hour economy‟. Regeneration should prioritise the areas with the worst socio-economic conditions, including Joe Slovo, Langa, Kensington and Maitland. The revitalisation of areas like Woodstock and Salt River is likely to continue. It is also essential that effective strategies be implemented in the less affluent areas of the district to address poverty alleviation and job creation in an integrated way. This could include skills development programmes, minimising the loss of valuable agricultural land for housing purposes, small garden schemes to improve health of less affluent communities, and the promotion of urban agriculture to provide training and start funds for agricultural projects. The densification of the district, especially along transport corridors and near public transport facilities should be continued, including mixed use developments in appropriate locations. A challenge for the district (especially in the CBD / City Bowl) is to ensure that more housing opportunities for the less affluent close to the economic opportunities of these areas be developed. The development of social housing in the CBD and City Bowl (including District 6 and Culemborg) can play a vital role in this. Given the fact that a large proportion of the district‟s households consist of one or two persons, a large proportion of units in housing developments should contain smaller units to cater to these households. Smaller units will also enable younger people to live closer to economic and social opportunities. As the district has a relatively older population than many of the other districts, adequate facilities for the aged should be developed. Environmentally, it is necessary to consolidate, protect and improve access to natural resources including the Table Mountain chain. Security concerns on the mountain should be addressed as it is vital to tourism in the city.
With the highest occurrence of business crime in the city, crime prevention strategies should include programmes to deal appropriately with this type of crime, especially considering the direct impact of business crime on the economy and the cost of doing business in the city. Lastly, the district plan for the area should further unpack the timing, coordination and identify locations for the various physical and socio-economic opportunities in the district.

Planning Districts Socio-Economic Analysis 2007
11 October 2007 Strategic Development Information and GIS Department Page 62
4.2 District B: West Coast
(i) Introduction District B: West Coast is one of the largest districts in the city and has some of the fastest growing areas and with a mix of urban, rural and farming areas. Fast growing areas in the district include Big Bay, Melkbosstrand, West Beach, Century City, Sunningdale and Parklands. Although the area is vast and the area is mostly affluent, especially along the Atlantic Coast, it also includes pockets of lower-income areas including informal settlements with poor access to amenities and other services - especially economic opportunities. The district includes some of the most important industrial areas in the city, e.g. Killarney Gardens, Montague Gardens and Paarden Island. Century City is a key residential and commercial node in the city and will become increasingly so as the area is further developed. A list of the suburbs in the district is attached as Appendix A.
(ii) Population
District B: West Coast has a total population of 152,299 people (2001). This is the smallest population of any district and account for just over 5% of the city‟s population. The average age in the district is 27 years. Over half of the households (56.3%) have either 1 or 2 people. As with all the districts, there are more females (51.5%) than males (48.4%). The population data suggests that a large proportion of housing units in this district should cater for households of a smaller size. See tables 26-29 for more information.
Table 26: Population - District B: West Coast
ETHNIC GROUP Male % Female % Total %
Black African 13,677 8.98 12,857 8.44 26,534 17.42
Coloured 33,932 22.28 37,539 24.65 71,471 46.93
Indian/Asian 730 0.48 781 0.51 1,511 0.99
White 25,512 16.75 27,271 17.91 52,783 34.66
Total 73,851 48.49 78,448 51.51 152,299 100.00
City of Cape Town, 2007b
Table 27: Age-Gender - District B: West Coast
AGE Male % Female % Total %
0 - 5 8,402 5.52 8,071 5.30 16,473 10.82
6 - 12 9,198 6.04 9,280 6.09 18,478 12.13
13 - 17 6,548 4.30 6,661 4.37 13,209 8.67
18 - 34 24,256 15.93 25,352 16.65 49,608 32.57
35 - 54 18,585 12.20 20,289 13.32 38,874 25.52
55 - 64 3,970 2.61 4,599 3.02 8,569 5.63
65+ 2,892 1.90 4,196 2.76 7,088 4.65
Total 73,851 48.49 78,448 51.51 152,299 100.00
City of Cape Town, 2007b
Table 28: Age - District B: West Coast
Dependency Ratio 44.84 Index of Ageing 17.69 Median Age 27 years
City of Cape Town, 2007b

Planning Districts Socio-Economic Analysis 2007
11 October 2007 Strategic Development Information and GIS Department Page 63
Table 29: Household Size - District B: West Coast HOUSEHOLD SIZE Number %
1 7,334 16.58
2 10,604 23.97
3 to 4 15,995 36.16
5 to 6 7,353 16.62
7 to 8 2,086 4.72
9+ 867 1.96
Total 44,240 100.00
City of Cape Town, 2007b
(iii) Economy9
The most significant economic activity areas in the district are Table View, Killarney and Montague Gardens (with turnover of R27.5 million or 9.7% of the total) (City of Cape Town 2007a). According to Census 2001 data, most formal development10 took place in Table View and Avondale (City of Cape Town 2007b). The district contains two of the city‟s most significant industrial areas- e.g. Killarney and Montague Gardens. In fact, the relative contribution of industrial property is greatest (58%) and the area has the greatest value of industrial building plans submitted in the city (especially in Montague Gardens). Industrial properties account for 16.9% of the value of properties in the district. Table View is experiencing continuing commercial investment with commercial properties accounting for 5.0% (see Table 30) (City of Cape Town 2007a). In strong contrast, Atlantis is very isolated with very little economic activity.
Table 30: Commercial and Industrial Property Values- District B: West Coast
Commercial Properties
Count %
Count Total Property Value (R mill)
% Value
Building Value (R mill)
Land Value (R mill)
395 5.0% R 2,033 7.1% R 1,433 R 600
Industrial Properties
953 16.9% R 2,762 23.5% R 1,928 R 834
Commercial and Industrial Properties (Sum of above 2 tables)
1,348 9.9% R 4,795 11.9% R 3,361 R 1,434
City of Cape Town, 2007a
Most of the economically active people in the district are employed (54.9%), with 15.6% unemployed (Table 31).
Table 31: Employment Status - District B: West Coast
EMPLOYMENT STATUS - Aged 15 to 65 Male % Female % Total %
Employed 32,067 30.32 26,059 24.64 58,126 54.96
Unemployed 8,247 7.80 8,257 7.81 16,504 15.61
Economically Active Total 40,314 38.12 34,316 32.45 74,630 70.57
Not Economically Active 10,920 10.33 20,208 19.11 31,128 29.43
Grand Total 51,234 48.44 54,524 51.56 105,758 100.00
City of Cape Town, 2007b
(iv) Crime District B: West Coast has the lowest incidence of murder (3.4%) and rape (6%) of all districts in the city (City of Cape Town 2007b).
9 The information in this section relates to the formal economy only and excludes the informal economy due
to the relevant data being unavailable
10 More than 3000 land use and building plan applications

Planning Districts Socio-Economic Analysis 2007
11 October 2007 Strategic Development Information and GIS Department Page 64
(v) Housing
The district has the second largest proportion of formal dwellings in the city (88%), with only 7.2% informal dwellings (Table 32). Areas with informal dwellings include Doornbach, Du Noon, Saxonworld, Witsand and Tafelozono (Figure 23). The district is relatively well serviced, with the lowest level of services in Vissershok and Witsand. Atlantis has a less than average level of service provision (Figure 24).
Table 32: Types of Dwellings- District B: West Coast
TYPE OF DWELLING Number %
Formal Dwelling 38,956 88.06
Informal Dwelling in back yard 848 1.92
Informal Dwelling not in back yard 2,377 5.37
Other 2,059 4.65
Total 44,240 100.00
City of Cape Town 2007b
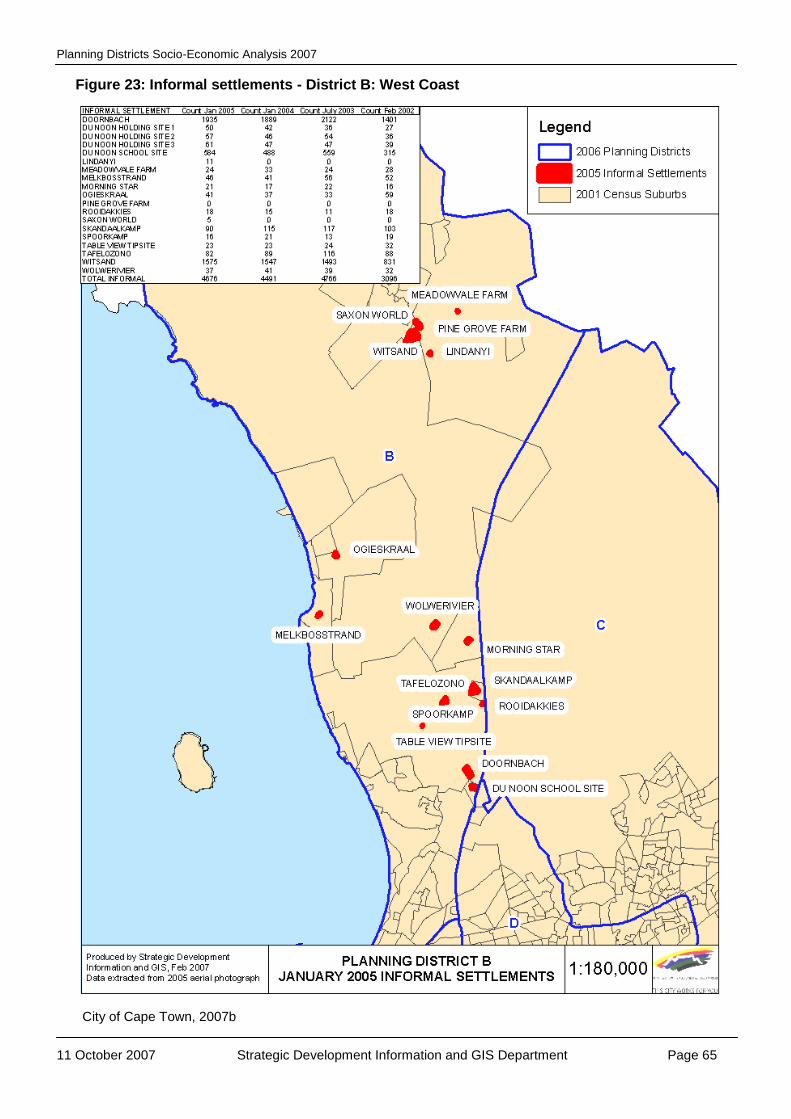
Planning Districts Socio-Economic Analysis 2007
11 October 2007 Strategic Development Information and GIS Department Page 65
Figure 23: Informal settlements - District B: West Coast
City of Cape Town, 2007b
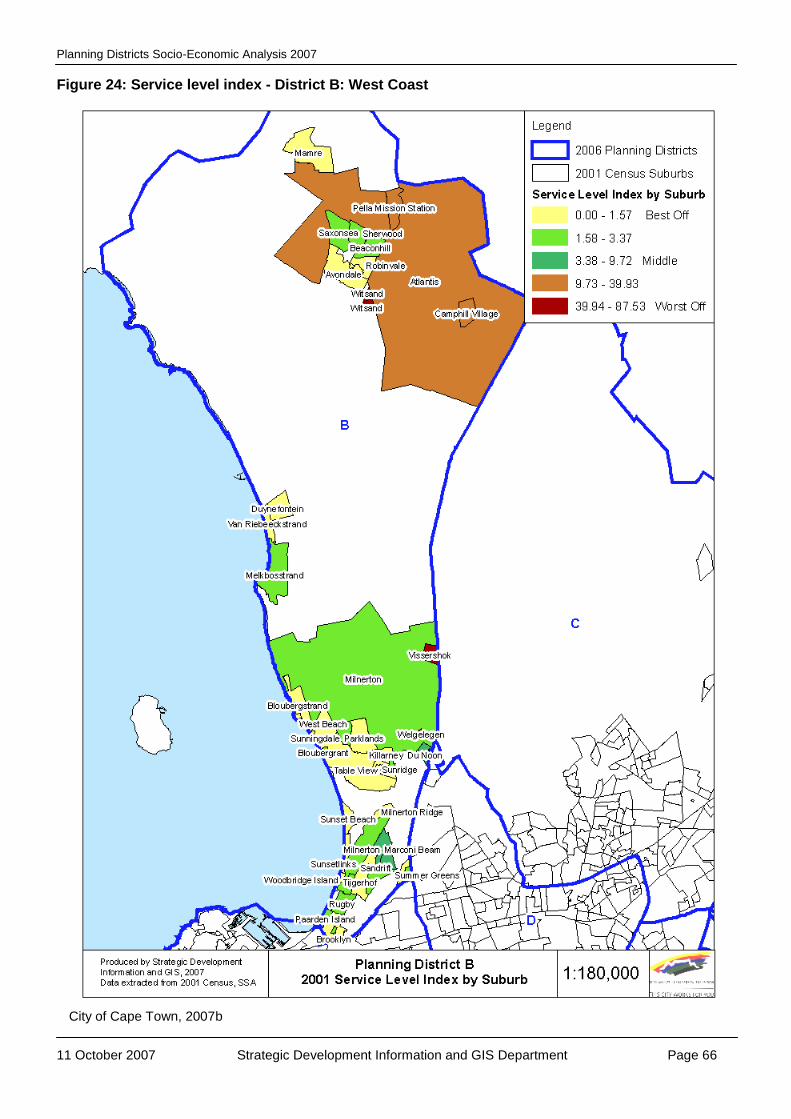
Planning Districts Socio-Economic Analysis 2007
11 October 2007 Strategic Development Information and GIS Department Page 66
Figure 24: Service level index - District B: West Coast
City of Cape Town, 2007b

Planning Districts Socio-Economic Analysis 2007
11 October 2007 Strategic Development Information and GIS Department Page 67
(vi) Human and Social Development
Many residents in the district live in abject poverty, which include residents in areas like Du Noon, Witsand, Vissershok and Sandrift. See Figure 25 for more information.

Planning Districts Socio-Economic Analysis 2007
11 October 2007 Strategic Development Information and GIS Department Page 68
Figure 25: Socio-economic status index - District B: West Coast
City of Cape Town, 2007b
Planning Districts Socio-Economic Analysis 2007
11 October 2007 Strategic Development Information and GIS Department Page 69
(vii) Challenges and Opportunities
Curbing urban sprawl remains one of the key challenges facing the district, and is threatening the biodiversity and agriculture of the rural areas in the district. In order to address this, it is essential that the densification of the district at appropriate locations be intensified, especially along transport corridors and near public transport facilities – with mixed use developments where appropriate. With a relative small population comparing many other districts, there is capacity for growth and to absorb more people. However, this growth must go hand-in-hand with adequate service infrastructure and public transport provision. An equitable pattern of access should be created with the creation of more job opportunities and the development of a public transport system. This is necessary as transport infrastructure has not been upgraded in line with the rapid growth of the district. Transport improvements could include the creation of dedicated bus lanes on main roads as well as a railway link to the CBD. The creation of more employment opportunities is especially important in the northern areas of the district - especially Atlantis, which is isolated from the rest of the city. The areas with the worst socio-economic conditions (low level of services and levels of living) should be prioritised for future upgrading and regeneration, coupled with poverty alleviation and job creation measures in an integrated way. This could include skills development programmes, minimising the loss of valuable agricultural land for housing purposes, small garden schemes to improve health of less affluent communities, and the promotion of urban agriculture to provide training and start funds for agricultural projects. The role and function of Atlantis and how it integrates with the bigger urban context needs to be unpacked and resolved in order to regenerate the area. Some areas in the district have potential for the development of tourism. The Atlantic coastline is an area with potential for new urban special places - these special places along the coast need to be identified and existing ones reinforced (City of Cape Town 2006b). As a large proportion of the households in the district consist of one or two persons, housing developments should cater for an appropriate number of smaller units. Lastly, the district plan for the area should further unpack the timing, coordination and identify locations for the various physical and socio-economic opportunities in the district.
4.3 District C: Northern
(i) Introduction
District C: Northern is located in the north of the metropolitan area and consists of an urban component and a vast rural hinterland. Over the past decade or two this area has been one of the metropolitan area‟s main growth areas and much productive agricultural land has been taken up by development. The urban areas of the district are characterized by low density, predominantly middle- to high income suburban residential developments, with a well-developed service and institutional infrastructure and a relatively large proportion of open space. Commercial development is concentrated in the Brackenfell, Kraaifontein and Durbanville CBD's and in the Tygervalley Waterfront area, with limited industrial development is present in Kraaifontein and Brackenfell. A list of suburbs in the district is attached as Appendix A.

Planning Districts Socio-Economic Analysis 2007
11 October 2007 Strategic Development Information and GIS Department Page 70
(ii) Population
The district has a total population of 218,544 people (2001), with the average age of people being 28 years. Over half of the households (52.4%) have either 3-4 or 5-6 people. There are more females (52.0%) than males (47.9%). Refer to tables 33-36 for more information.
Table 33: Population - District C: Northern
ETHNIC GROUP Male % Female % Total %
Black African 23,405 10.71 22,108 10.12 45,513 20.83
Coloured 31,358 14.35 35,207 16.11 66,565 30.46
Indian/Asian 510 0.23 555 0.25 1,065 0.49
White 51,216 23.44 54,185 24.79 105,401 48.23
Total 106,489 48.73 112,055 51.27 218,544 100.00
City of Cape Town, 2007b
Table 34: Age-Gender - District C: Northern
AGE Male % Female % Total %
0 - 5 11,305 5.17 10,830 4.96 22,135 10.13
6 – 12 12,713 5.82 12,611 5.77 25,324 11.59
13 - 17 8,922 4.08 9,364 4.28 18,286 8.37
18 - 34 34,318 15.70 36,019 16.48 70,337 32.18
35 - 54 28,491 13.04 30,375 13.90 58,866 26.94
55 - 64 6,465 2.96 7,077 3.24 13,542 6.20
65+ 4,275 1.96 5,779 2.64 10,054 4.60
Total 106,489 48.73 112,055 51.27 218,544 100.00
City of Cape Town, 2007b
Table 35: Age - District C: Northern
Dependency Ratio 41.82
Index of Ageing 18.48
Median Age 28 years
City of Cape Town, 2007b
Table 36: Household Size - District C: Northern
HOUSEHOLD SIZE Number %
1 11,893 17.90
2 16,443 24.75
3 to 4 25,145 37.86
5 to 6 9,677 14.57
7 to 8 2,309 3.48
9+ 956 1.44
Total 66,423 100.00 (City of Cape Town, 2007b)
(iii) Economy11
District C: Northern includes some of the most important commercial areas in the city. These are mainly located in the south of the district and include the Bracken fell-, Kraaifontein- and Durbanville CBD's, and the Tygervalley Waterfront area - especially along Durban Road. Of these the most significant economic areas in terms of value are Bellville and Durban Road with a
11
The information in this section relates to the formal economy only and excludes the informal economy due to the relevant data being unavailable

Planning Districts Socio-Economic Analysis 2007
11 October 2007 Strategic Development Information and GIS Department Page 71
turnover of R34.4 million or 12.1% of the total. Commercial properties account for 7.4% and industrial properties for 7.9% in terms of property value (Table 37) (City of Cape Town 2007a).
According to Census 2001 data, most formal development12 in the district took place in Durbanville and Bloekombos (City of Cape Town 2007b).
Table 37: Commercial and Industrial Property Values- District C: Northern
Commercial Properties
Count %
Count Total Property Value (R mill)
% Value
Building Value (R mill)
Land Value (R mill)
588 7.4% R 3,599 12.6% R 2,742 R 857
Industrial Properties
445 7.9% R 530 4.5% R 367 R 163
Commercial and Industrial Properties (Sum of above 2 tables)
1,033 7.6% R 4,128 10.3% R 3,109 R 1,019
City of Cape Town 2007a
Most of the economically active people in the district are employed (56.13%) and the district has an unemployment rate of 13.3% (Table 38).
Table 38: Employment Status - District C: Northern
EMPLOYMENT STATUS - Aged 15 to 65
Male % Female % Total %
Employed 47,948 30.89 39,192 25.25 87,140 56.13
Unemployed 10,441 6.73 10,351 6.67 20,792 13.39
Economically Active Total 58,389 37.61 49,543 31.91 107,932 69.53
Not Economically Active 16,904 10.89 30,402 19.58 47,306 30.47
Grand Total 75,293 48.50 79,945 51.50 155,238 100.00
City of Cape Town 2007b
(iv) Crime
The district has one of the lowest crime rates in the city. The district has the lowest incidence of business crime (6.5%) and the lowest incidence of drug-related crime (3.8%) (City of Cape Town 2007b).
(v) Housing
The majority of the dwellings are of a formal nature (84.8%), while informal dwellings account for 12.3% (Table 39). These informal dwellings are mainly situated in Klipheuwel, Goliath and Wallacedene (Figure 26). Although most of the district is well serviced, areas like Wallacedene, St Michaels, some areas in Brackenfell and Excelsior have very low levels of services (Figure 27).
Table 39: Types of dwellings - District C: Northern
TYPE OF DWELLING Number %
Formal Dwelling 56,385 84.89
Informal Dwelling in back yard 2,500 3.76
Informal Dwelling not in back yard 5,732 8.63
Other 1,806 2.72
Total 66,423 100.00
City of Cape Town 2007b
12
More than 3000 land use and building plan applications

Planning Districts Socio-Economic Analysis 2007
11 October 2007 Strategic Development Information and GIS Department Page 72
Figure 26: Informal settlements - District C: Northern
City of Cape Town, 2007b

Planning Districts Socio-Economic Analysis 2007
11 October 2007 Strategic Development Information and GIS Department Page 73
Figure 27: Service level index - District C: Northern
City of Cape Town, 2007b
Planning Districts Socio-Economic Analysis 2007
11 October 2007 Strategic Development Information and GIS Department Page 74
(vi) Human and Social Development
The worst socio-economic conditions occur in Fisantkraal, Bloekombos and Kraaifontein East - see Figure 28 for more information.
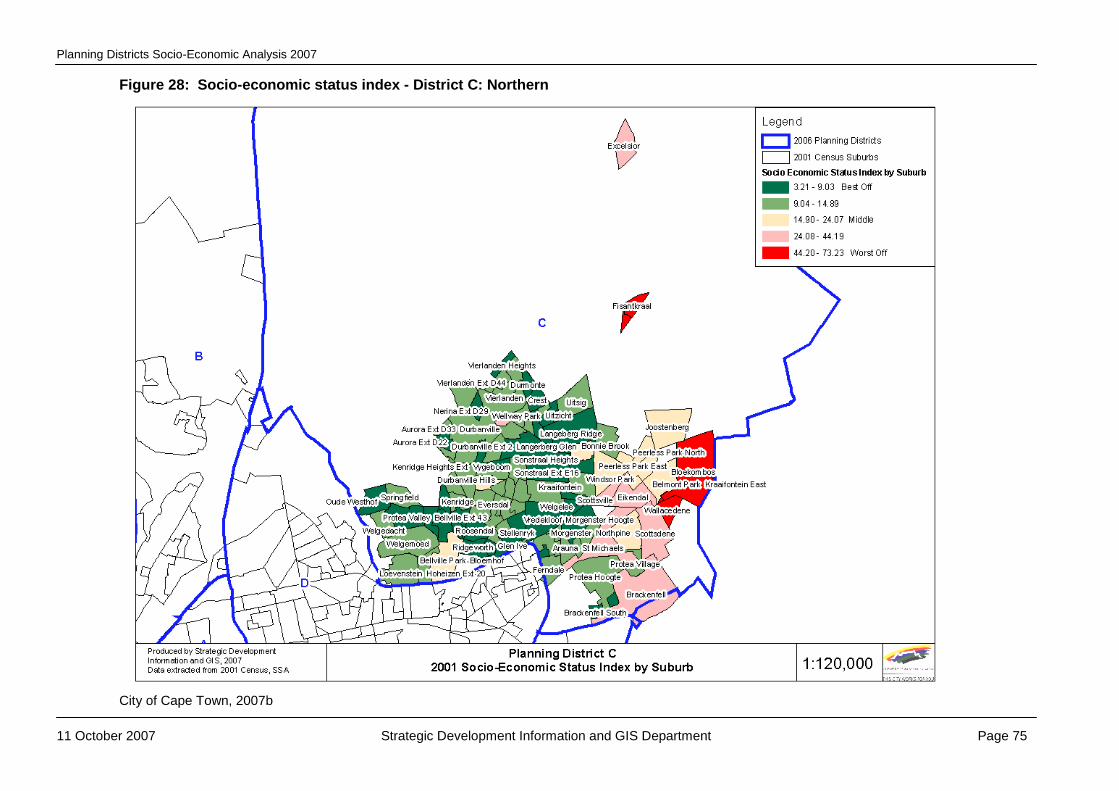
Planning Districts Socio-Economic Analysis 2007
11 October 2007 Strategic Development Information and GIS Department Page 75
Figure 28: Socio-economic status index - District C: Northern
City of Cape Town, 2007b

Planning Districts Socio-Economic Analysis 2007
11 October 2007 Strategic Development Information and GIS Department Page 76
(vii) Challenges and Opportunities There is an opportunity to curb urban sprawl and promote residential densification in the district. The current urban edge should remain the city‟s growth boundary further urban expansion should be channelled along a development axis to the north of Durbanville and Kraaifontein. Land which should be protected from development will have to be identified timeously and the necessary spatial, transportation and services planning will have to be undertaken. In the short term, however, the focus should be on methods to make better use of land and existing infrastructure within the city‟s current footprint. At the local level vacant and underutilized land should be identified and developed, and residential densification should be promoted in appropriate areas (City of Cape Town 2006b). The performance of the urban areas of the district is threatened by, inter alia, the absence of an efficient public transportation system, a lack of engineering services capacity, limited affordable housing opportunities and a deteriorating urban landscape due to low density urban sprawl, limited urban structuring and a poor streetscape. The district contains a vast rural area with significant agricultural and natural resources and an urban area richly endowed with open spaces. These assets in the urban and rural environment should be identified, protected and appropriately utilized. There may be an opportunity to create and develop a continuous and linked open space system. In this regard the abundance of water courses, wetlands and natural habitat remnants in both the rural and urban environment provide a unique opportunity for recreation and tourism (City of Cape Town 2006b). The district contains a number of less affluent communities, including Bloekombos, Fisantekraal and Wallacedene. Priority must be given to improving the lives of these communities by, inter alia, the upgrading of the public environment and ensuring easy access to essential services, facilities, amenities and economic opportunities (City of Cape Town 2006b). The upgrading of the less affluent areas should be implemented in an integrated way by including poverty alleviation and job creation strategies. This could include skills development programmes, minimising the loss of valuable agricultural land for housing purposes, small garden schemes to improve health of less affluent communities, and the promotion of urban agriculture to provide training and start funds for agricultural projects. The role and function of Atlantis and how it integrates with the bigger urban context needs to be unpacked and resolved in order to regenerate the area. The large proportion of larger households in the district requires adequate provision of larger units in housing developments. Higher density residential and mixed-use developments should continue near the major commercial areas of the district, including Kraaifontein, Durbanville, Tygervalley and Durban Road. Lastly, the district plan for the area should further unpack the timing, coordination and identify locations for the various physical and socio-economic opportunities in the district.
4.4 District D: Tygerberg
(i) Introduction
District D: Tygerberg is centrally situated in the north of the metropolitan area. It is made up of a number of well-established, older suburbs such as Goodwood, Elsies River, Bonteheuwel, Bishop Lavis, Parow and Bellville, as well as newer suburbs such as Delft, Belhar, Bothasig, Panorama, Ridgewood and Edgemead. It contains a broad spectrum of urban land uses, including residential development ranging from low to high density and low to high income, a number of industrial areas, commercial development concentrated in the Goodwood, Parow and Bellville CBD's and along Voortrekker Road. The district also includes the Cape Town International Airport, the University of the Western Cape, the Tygerberg Hospital and various open spaces dispersed throughout the area. Refer to Appendix A for a list of suburbs in the district.

Planning Districts Socio-Economic Analysis 2007
11 October 2007 Strategic Development Information and GIS Department Page 77
(ii) Population
The district has a total population of 509 263 people (2001), which account for nearly 18% of the city‟s population. The average age of people is 27 years and there are more females (52.5%) than males (47.4%) in the district. Over half of the households (58.3%) have either 3-4 or 4-6 people, which is the third largest percentage of households of 7 or more people (10.7%) of any district in the city. Considering the large proportion of larger households in this district, it is important that housing opportunities cater sufficiently for these households. See Tables 40-43 for more information. Table 40: Population - District D: Tygerberg
ETHNIC GROUP Male % Female % Total %
Black African 16,671 3.27 18,162 3.57 34,833 6.84
Coloured 160,432 31.50 177,855 34.92 338,287 66.43
Indian/Asian 4,353 0.85 4,351 0.85 8,704 1.71
White 60,333 11.85 67,106 13.18 127,439 25.02
Total 241,789 47.48 267,474 52.52 509,263 100.00
City of Cape Town, 2007b
Table 41: Age-Gender - District D: Tygerberg
AGE Male % Female % Total %
0 - 5 25,425 4.99 25,145 4.94 50,570 9.93
6 – 12 33,248 6.53 32,653 6.41 65,901 12.94
13 - 17 24,162 4.74 24,627 4.84 48,789 9.58
18 - 34 73,101 14.35 79,350 15.58 152,451 29.94
35 - 54 60,324 11.85 69,502 13.65 129,826 25.49
55 - 64 14,167 2.78 17,825 3.50 31,992 6.28
65+ 11,362 2.23 18,372 3.61 29,734 5.84
Total 241,789 47.48 267,474 52.52 509,263 100.00
City of Cape Town, 2007b
Table 42: Age - District D: Tygerberg
Dependency Ratio 47.79 Index of Ageing 22.04 Median Age 27 years
City of Cape Town, 2007b
Table 43: Household Size - District D: Tygerberg
HOUSEHOLD SIZE Number %
1 16,298 12.84
2 22,979 18.10
3 to 4 46,782 36.84
5 to 6 27,326 21.52
7 to 8 8,723 6.87
9+ 4,871 3.84
Total 126,979 100.00
City of Cape Town, 2007b

Planning Districts Socio-Economic Analysis 2007
11 October 2007 Strategic Development Information and GIS Department Page 78
(iii) Economy13 Large areas in the district are made up of industrial areas. In fact, the district has the greatest amount of industrial property in the city in absolute terms (31% of all industrial property). These areas include Epping Industrial (west of N7), Airport Industria, Sacks Circle, Bellville, Parow, Stikland and Elsies River industrial areas. In terms of property value, Industrial property account for 26.7%. The district also has the greatest value of industrial building plans submitted in the city - especially in Parow and Airport Industria (City of Cape Town 2007a). In terms of the Census 2001 data, most formal development14 in the district took place in Bellville South, Bishop Lavis, Bonteheuwel, Bothasig, Delft South, Edgemead and Ravensmead (City of Cape Town 2007b). There is continuing commercial investment in the district with the value of commercial property accounting for 18.2% (Table 44). Epping and Goodwood represent some of the most significant economic areas in the city (turnover of R19.3 million or 6.8% of the total). Significant concentrations of building plan submissions are also evident in Durban Road, with Voortrekker Road subject to a high number of relatively „small‟ building plan submissions (City of Cape Town 2007a). Table 44: Commercial and Industrial Property Values - District D: Tygerberg
Commercial Properties
Count %
Count
Total Property Value (R
mill) %
Value
Building Value
(R mill)
Land Value
(R mill)
1,446 18.2% R 3,498 12.3% R 2,737 R 761
Industrial Properties
1,510 26.7% R 3,645 31.0% R 2,134 R 1,510
Commercial and Industrial Properties (Sum of above 2 tables)
2,956 21.8% R 7,143 17.8% R 4,872 R 2,271
City of Cape Town 2007a
Most of the economically active people in the district are employed (48.7%), with 14,7% of people in the district being unemployed (see table 45). Table 45: Employment status - District D: Tygerberg EMPLOYMENT STATUS - Aged 15 to 65 Male % Female % Total %
Employed 89,395 25.74 79,826 22.99 169,221 48.73
Unemployed 27,115 7.81 23,986 6.91 51,101 14.71
Economically Active Total 116,510 33.55 103,812 29.89 220,322 63.44
Not Economically Active 47,661 13.72 79,292 22.83 126,953 36.56
Grand Total 164,171 47.27 183,104 52.73 347,275 100.00
City of Cape Town, 2007b
(iv) Crime
The district has some of the worst crime rates in the city. In 2005/2006, the incidence of drug-related crime was highest (19.9%) in the district, and it had the second highest incidence of rape (14.9%) and business crime (19.2%) in the city (City of Cape Town 2006b).
13
The information in this section relates to the formal economy only and excludes the informal economy due to the relevant data being unavailable
14
More than 3000 land use and building plan applications

Planning Districts Socio-Economic Analysis 2007
11 October 2007 Strategic Development Information and GIS Department Page 79
(v) Housing
At just over the district has the largest percentage of formal dwellings and the lowest number of informal dwellings in the city (Table 46). Large numbers of informal dwellings are situated in Belhar, Freedom Park Airport, Malawi and Richwood (Figure 29). With a Service level index value of 3.30, the district is the best off of all districts in terms of services with very few „worst off‟ areas in the district (see Figure 30). Table 46: Type of dwellings - District D: Tygerberg
TYPE OF DWELLING Number %
Formal Dwelling 116,111 91.44
Informal Dwelling in back yard 4,283 3.37
Informal Dwelling not in back yard 1,346 1.06
Other 5,239 4.13
Total 126,979 100.00
City of Cape Town, 2007b

Planning Districts Socio-Economic Analysis 2007
11 October 2007 Strategic Development Information and GIS Department Page 80
Figure 29: Informal settlements - District D: Tygerberg
City of Cape Town, 2007b
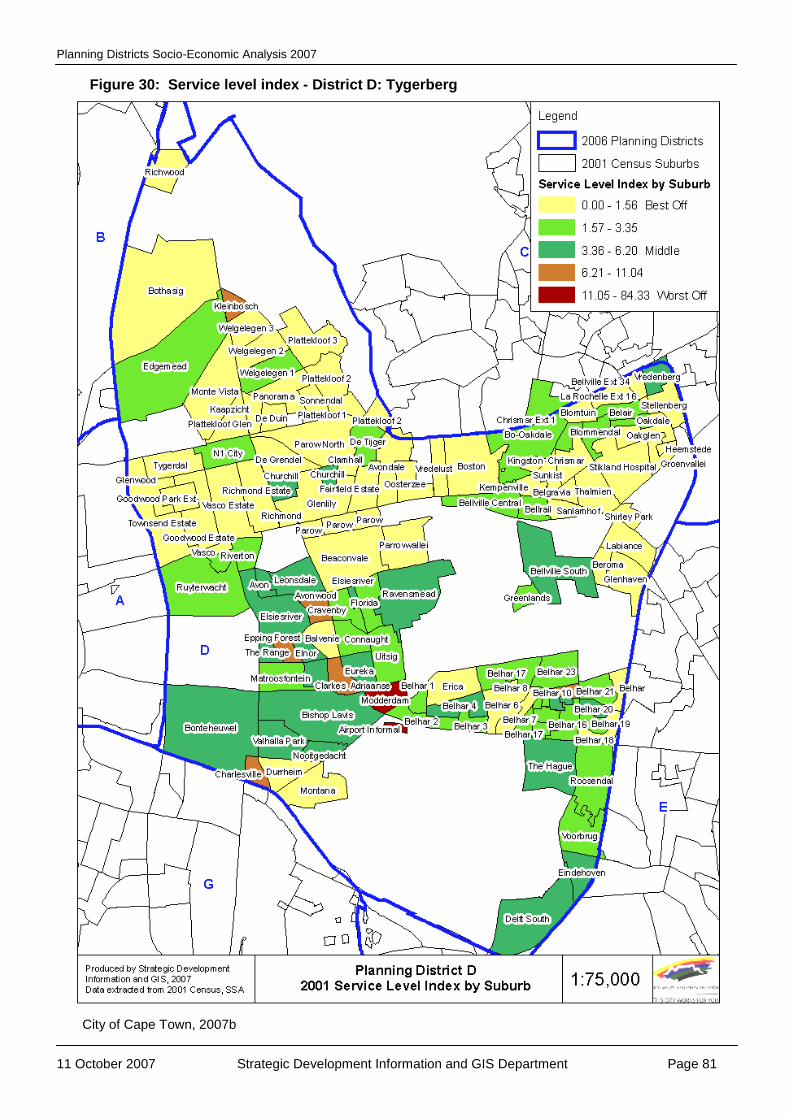
Planning Districts Socio-Economic Analysis 2007
11 October 2007 Strategic Development Information and GIS Department Page 81
Figure 30: Service level index - District D: Tygerberg
City of Cape Town, 2007b

Planning Districts Socio-Economic Analysis 2007
11 October 2007 Strategic Development Information and GIS Department Page 82
(vii) Human and Social Development
The worst-off areas in terms of their socio-economic status are Greenlands, Leonsdale, Roosendal, The Haque, Bonteheuwel, Valhalla Park and Uitsig. See Figure 31 for more information.

Planning Districts Socio-Economic Analysis 2007
11 October 2007 Strategic Development Information and GIS Department Page 83
Figure 31: Socio-economic status index - District D: Tygerberg
City of Cape Town, 2007b

Planning Districts Socio-Economic Analysis 2007
11 October 2007 Strategic Development Information and GIS Department Page 84
(vii) Challenges and Opportunities
The district has the potential to attract a broad range of investment, development and economic activity and to act as a central place integrating the less affluent areas to the south and more affluent areas to the north. A large portion of the district makes up the „economic backbone‟ of the city - which extends eastwards from the Cape Town CBD in a broad band running parallel to the N1 and Voortrekker Road. The existing employment nodes in the area, namely Bellville, Parow and Goodwood CBD's and the Epping, Parow, Boquinar and Bellville industrial areas have under-utilized potential which could be unlocked through urban renewal initiatives, including the development of essential infrastructure. The redevelopment of strategic vacant or underutilized sites such as the Bellrail Marshalling Yards and Stikland Hospital for a mix of high density residential and commercial purposes should be investigated. At the local level vacant or under-utilized sites should be identified with a view to using them for appropriate infill development. The reinforcement of activity routes such as Voortrekker Road will also contribute to the strengthening of economic opportunities in the district (City of Cape Town 2006b). Due to the presence of significant industrial and commercial activities, as well as its well-developed transport infrastructure, the district is important for the provision of formal employment opportunities in the city, and it has the potential to play an even more important role in this regard. Opportunities exist for residential densification, improvements to the public transport system, and the development of vacant or underutilized sites and the upgrading of the public environment so as to facilitate economic activity in the area (City of Cape Town 2006b). Most of the less affluent areas in the district perform poorly as living environments because of a lack of commercial, recreational and community facilities and general environmental decay in these areas. To address this situation these dormitory suburbs must be transformed into neighbourhoods with the necessary amenities and environmental attributes associated with successful urban places (City of Cape Town 2006b). These less affluent residential areas (e.g. Bonteheuwel, Bishop Lavis, Elsies River, Ravensmead, Bellville South and Delft) perform poorly as living environments and proactive urban renewal processes to transform these areas should be initiated. The focus should be on upgrading the public environment and ensuring ease of access to amenities and services. The upgrading of the less affluent areas should be implemented in an integrated way by including poverty alleviation and job creation strategies. This could include skills development programmes, minimising the loss of valuable agricultural land for housing purposes, small garden schemes to improve health of less affluent communities, and the promotion of urban agriculture to provide training and start funds for agricultural projects. Considering the large proportion of larger households in the district, an adequate provision of larger housing units should be included in housing developments. Also important is to locate new housing opportunities near the job opportunities, especially industrial job opportunities in the district. Although the district generally lacks natural environments and developed open spaces, it does contain a few remnants of natural vegetation which warrant protection. Furthermore, as access to open spaces are poor and, as open spaces are generally not well developed, opportunities exist for the upgrading of the existing public open space system and the creation of multi-purpose parks (City of Cape Town 2006b). The high incidence of drug-related crime, as well as incidences of rape and business crime should be addressed in crime prevention strategies for the district. This should include human and social development programmes to address the underlying socio-economic issues in the district. Lastly, the district plan for the area should further unpack the timing, coordination and identify locations for the various physical and socio-economic opportunities in the district.
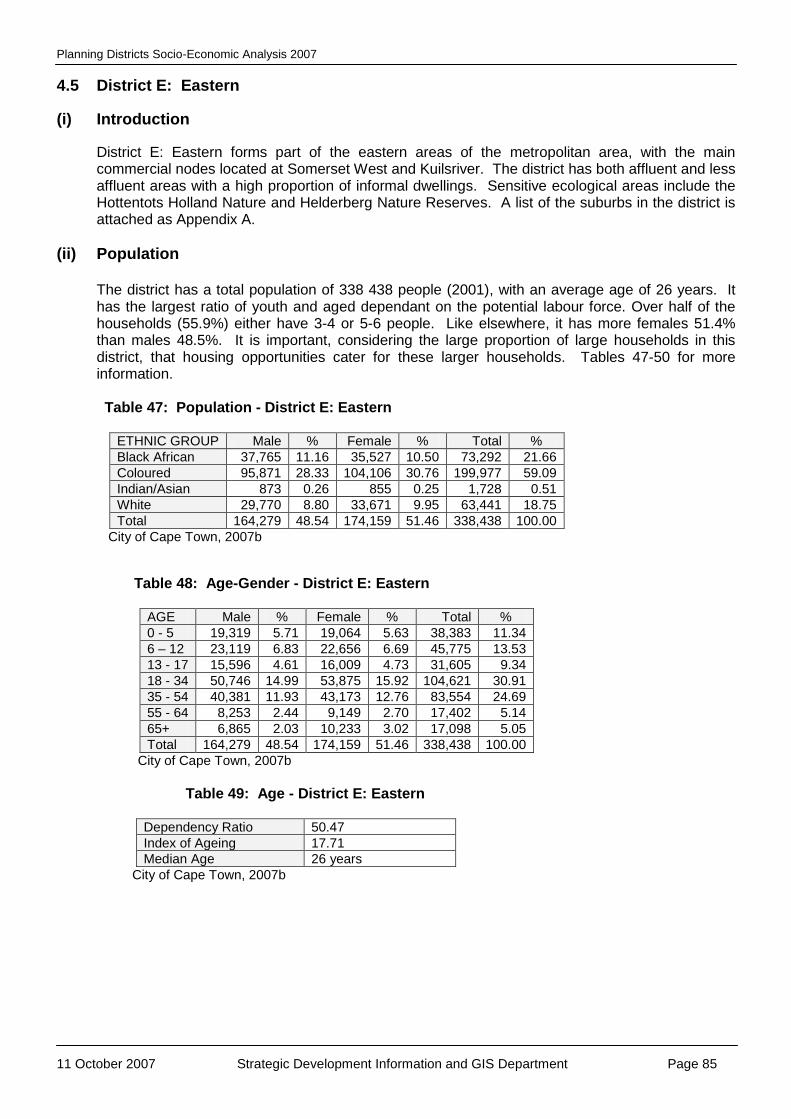
Planning Districts Socio-Economic Analysis 2007
11 October 2007 Strategic Development Information and GIS Department Page 85
4.5 District E: Eastern
(i) Introduction
District E: Eastern forms part of the eastern areas of the metropolitan area, with the main commercial nodes located at Somerset West and Kuilsriver. The district has both affluent and less affluent areas with a high proportion of informal dwellings. Sensitive ecological areas include the Hottentots Holland Nature and Helderberg Nature Reserves. A list of the suburbs in the district is attached as Appendix A.
(ii) Population The district has a total population of 338 438 people (2001), with an average age of 26 years. It has the largest ratio of youth and aged dependant on the potential labour force. Over half of the households (55.9%) either have 3-4 or 5-6 people. Like elsewhere, it has more females 51.4% than males 48.5%. It is important, considering the large proportion of large households in this district, that housing opportunities cater for these larger households. Tables 47-50 for more information.
Table 47: Population - District E: Eastern
ETHNIC GROUP Male % Female % Total %
Black African 37,765 11.16 35,527 10.50 73,292 21.66
Coloured 95,871 28.33 104,106 30.76 199,977 59.09
Indian/Asian 873 0.26 855 0.25 1,728 0.51
White 29,770 8.80 33,671 9.95 63,441 18.75
Total 164,279 48.54 174,159 51.46 338,438 100.00
City of Cape Town, 2007b
Table 48: Age-Gender - District E: Eastern
AGE Male % Female % Total %
0 - 5 19,319 5.71 19,064 5.63 38,383 11.34
6 – 12 23,119 6.83 22,656 6.69 45,775 13.53
13 - 17 15,596 4.61 16,009 4.73 31,605 9.34
18 - 34 50,746 14.99 53,875 15.92 104,621 30.91
35 - 54 40,381 11.93 43,173 12.76 83,554 24.69
55 - 64 8,253 2.44 9,149 2.70 17,402 5.14
65+ 6,865 2.03 10,233 3.02 17,098 5.05
Total 164,279 48.54 174,159 51.46 338,438 100.00
City of Cape Town, 2007b
Table 49: Age - District E: Eastern
Dependency Ratio 50.47 Index of Ageing 17.71 Median Age 26 years
City of Cape Town, 2007b

Planning Districts Socio-Economic Analysis 2007
11 October 2007 Strategic Development Information and GIS Department Page 86
Table 50: Household Size - District E: Eastern
HOUSEHOLD SIZE Number %
1 14,828 15.91
2 19,084 20.48
3 to 4 33,665 36.13
5 to 6 18,464 19.82
7 to 8 5,037 5.41
9+ 2,096 2.25
Total 93,175 100.00
City of Cape Town, 2007b
(iii) Economy15
Kuilsriver and Somerset West are the main economic activity areas in the district. The district is experiencing continuing commercial investment, with significant concentrations of building plan submissions especially in Somerset West. In terms of property value, commercial properties account for 10% and industrial properties for 13.9% (Table 51). It has relatively lower values for office property than for retail property, which suggests that it plays a local retail function while the other districts have better developed office-based sectors. The district has a high percentage of hotels (5%) and guest houses (2%) which indicate the importance of tourism in the area (City of Cape Town 2007a).
Table 51: Commercial and Industrial Property Values - District E: Eastern
Commercial Properties
Count %
Count Total Property Value (R mill)
% Value
Building Value (R mill)
Land Value (R mill)
792 10.0% R 1,678 5.9% R 1,166 R 512
Industrial Properties
784 13.9% R 814 6.9% R 536 R 278
Commercial and Industrial Properties (Sum of above 2 tables)
1,576 11.6% R 2,492 6.2% R 1,701 R 791
City of Cape Town 2007a
Most of the economically active people in the district are employed (49.6%). The district‟s unemployment rate is 18,2% (see Table 52).
Table 52: Employment status - District E: Eastern
EMPLOYMENT STATUS - Aged 15 to 65 Male % Female % Total %
Employed 63,481 28.04 48,958 21.63 112,439 49.67
Unemployed 19,986 8.83 21,293 9.41 41,279 18.24
Economically Active Total 83,467 36.87 70,251 31.03 153,718 67.91
Not Economically Active 26,348 11.64 46,303 20.45 72,651 32.09
Grand Total 109,815 48.51 116,554 51.49 226,369 100.00
City of Cape Town, 2007b
(iv) Crime
The district has an average crime rate compared to other districts.
15 The information in this section relates to the formal economy only and excludes the informal economy
due to the relevant data being unavailable
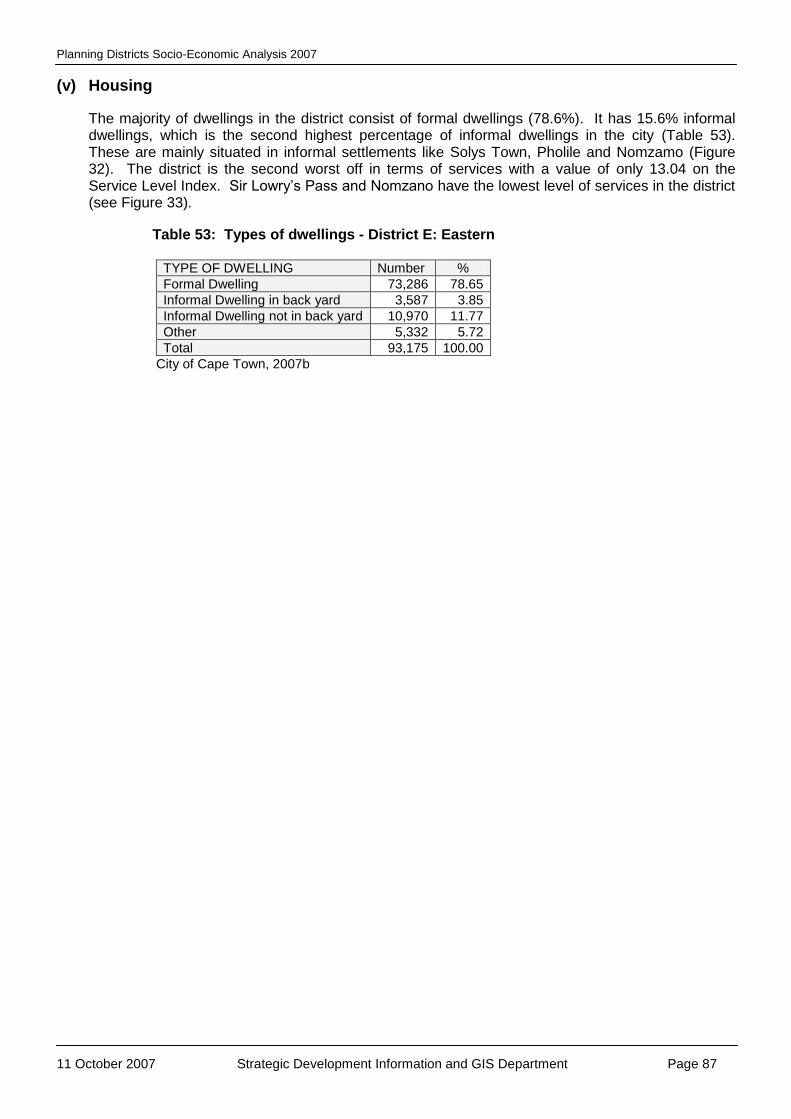
Planning Districts Socio-Economic Analysis 2007
11 October 2007 Strategic Development Information and GIS Department Page 87
(v) Housing
The majority of dwellings in the district consist of formal dwellings (78.6%). It has 15.6% informal dwellings, which is the second highest percentage of informal dwellings in the city (Table 53). These are mainly situated in informal settlements like Solys Town, Pholile and Nomzamo (Figure 32). The district is the second worst off in terms of services with a value of only 13.04 on the Service Level Index. Sir Lowry‟s Pass and Nomzano have the lowest level of services in the district (see Figure 33).
Table 53: Types of dwellings - District E: Eastern
TYPE OF DWELLING Number %
Formal Dwelling 73,286 78.65
Informal Dwelling in back yard 3,587 3.85
Informal Dwelling not in back yard 10,970 11.77
Other 5,332 5.72
Total 93,175 100.00
City of Cape Town, 2007b

Planning Districts Socio-Economic Analysis 2007
11 October 2007 Strategic Development Information and GIS Department Page 88
Figure 32: Informal settlements in district – District D: Tygerberg
City of Cape Town, 2007b

Planning Districts Socio-Economic Analysis 2007
11 October 2007 Strategic Development Information and GIS Department Page 89
Figure 33: Service level index - District E: Eastern
City of Cape Town, 2007b

Planning Districts Socio-Economic Analysis 2007
11 October 2007 Strategic Development Information and GIS Department Page 90
(vi) Human and Social Development Socio-economically, Drift Sands, Mfuleni and Electricity City are the worst off in the district. See
Figure 34 for more information.

Planning Districts Socio-Economic Analysis 2007
11 October 2007 Strategic Development Information and GIS Department Page 91
Figure 34: Socio-economic status index - District E: Eastern
City of Cape Town, 2007b

Planning Districts Socio-Economic Analysis 2007
11 October 2007 Strategic Development Information and GIS Department Page 92
(vii) Challenges and Opportunities
There is an opportunity to identify Van Riebeeck Rd (linking Kuilsrivier with Somerset West/ Strand), with the linkage from Van Riebeeck Rd into the existing N2 (between Somerset West and Strand, leading towards Sir Lowry‟s Pass) as development corridors. The densification of development in the district should be pursued, especially in and near the main commercial areas of Somerset West and Kuilsriver. The AECI / Somchem site has potential as a strategic site for the development of integrated human settlement. The densification of the district should be undertaken in coordination with the enforcement of the Urban Edge (City of Cape Town, 2006b). With the second highest number of informal units of all districts in the city, and with low service levels that the upgrading of informal areas be a priority. The ugrading of the less affluent areas should be implemented in an integrated way by including poverty alleviation and job creation strategies. This could include skills development programmes, minimising the loss of valuable agricultural land for housing purposes, small garden schemes to improve health of less affluent communities, and the promotion of urban agriculture to provide training and start funds for agricultural projects. The high level of dependence of youth and the aged in the district requires appropriate facilities and programmes to cater for the needs of both; while the large proportion of larger households requires adequate provision of larger units in new housing developments. Lastly, the district plan for the area should further unpack the timing, coordination and identify locations for the various physical and socio-economic opportunities in the district.
4.6 District F: Mitchells Plain / Khayelitsha (i) Introduction
The district represents some of the most marginalised areas in the city and is characterised by low
income dormitory type residential areas with very limited economic activity. It is the district in most need of regeneration, economic development, the provision of services, and the provision of adequate housing and effective transport systems. The district includes areas like Crossroads, Khayelitsha, Philippi and Mitchells Plan. It has the largest population of any district and has the highest population density. It is characterised by the lowest standard of living and has the highest unemployment in the city. A list of the suburbs in the district is attached as Appendix A.
(ii) Population
The district has a total population of 719 512 people (2001), which is a quarter of the city‟s population. The district has the highest percentage of youth (36.3%) and the lowest percentage of aged (1.5%), in fact, there are only 5 aged people for every 100 youth. Over half of the households (55.9%) in the district have either 3-4 or 5-6 people. Refer to Tables 54-57 for more information.
Table 54: Population - District F: Mitchells Plain / Khayelitsha
ETHNIC GROUP Male % Female % Total %
Black African 235,148 32.68 252,889 35.15 488,037 67.83
Coloured 110,220 15.32 119,015 16.54 229,235 31.86
Indian/Asian 751 0.10 751 0.10 1,502 0.21
White 368 0.05 370 0.05 738 0.10
Total 346,487 48.16 373,025 51.84 719,512 100.00
City of Cape Town, 2007b

Planning Districts Socio-Economic Analysis 2007
11 October 2007 Strategic Development Information and GIS Department Page 93
Table 55: Age-Gender - District F: Mitchells Plain / Khayelitsha
AGE Male % Female % Total %
0 - 5 43,706 6.07 43,219 6.01 86,925 12.08
6 – 12 49,101 6.82 50,808 7.06 99,909 13.89
13 - 17 35,321 4.91 39,662 5.51 74,983 10.42
18 - 34 126,100 17.53 137,056 19.05 263,156 36.57
35 - 54 76,069 10.57 82,888 11.52 158,957 22.09
55 - 64 11,494 1.60 12,718 1.77 24,212 3.37
65+ 4,696 0.65 6,674 0.93 11,370 1.58
Total 346,487 48.16 373,025 51.84 719,512 100.00
City of Cape Town, 2007b
Table 56: Age - District F: Mitchells Plain / Khayelitsha
Dependency Ratio 45.86 Index of Ageing 5.29 Median Age 23 years
City of Cape Town, 2007b
Table 57: Household size - District F: Mitchells Plain / Khayelitsha
HOUSEHOLD SIZE Number %
1 28,065 15.61
2 29,755 16.55
3 to 4 60,255 33.52
5 to 6 40,270 22.40
7 to 8 14,985 8.34
9+ 6,451 3.59 Total 179,780 100.00
City of Cape Town, 2007b
(iii) Economy16
The district is notably lacking in economic property, with very low commercial and industrial property values. Commercial properties account for 3.6% and industrial properties only 1.1%, which are the lowest proportions of commercial and industrial activity of all the districts (Table 58). The district has lower values for office property than for retail property, which suggests that the local retail function is more prominent in the district than office-based sectors. Large mall-type shopping centres account a very high percentage of commercial property in the district (20%), further suggesting that commerce is particularly underdeveloped. Measured by the number of commercial building plans, there is relatively little investment in the district (City of Cape Town 2007a). According to the Census 2001 data, most formal development17 took place in Beacon Valley, Crossroads SP, Eastridge, Khayelitsha TV-V1, Khayelitsha T1-V4, Philippi, Portlands, Rocklands (Part F), Tafelsig, Weltevreden Valley, Westridge and Woodlands (City of Cape Town 2007b).
16
The information in this section relates to the formal economy only and excludes the informal economy due to the relevant data being unavailable
17 More than 3000 land use and building plan applications

Planning Districts Socio-Economic Analysis 2007
11 October 2007 Strategic Development Information and GIS Department Page 94
Table 58: Commercial and Industrial Property Values - District F: Mitchells Plain / Khayelitsha
Commercial Properties
Count %
Count Total Property Value (R mill)
% Value
Building Value (R mill)
Land Value (R mill)
289 3.6% R 850 3.0% R 551 R 299
Industrial Properties
64 1.1% R 61 0.5% R 43 R 19
Commercial and Industrial Properties (Sum of above 2 tables)
353 2.6% R 911 2.3% R 594 R 317
City of Cape Town 2007a
At a staggering 30,8%, the district has the highest level of unemployment in the city (Table 59). This is particularly significant considering that 42% of the city‟s population reside within this district and District G: Klipfontein / False Bay.
Table 59: Employment status - District F: Mitchells Plain / Khayelitsha
EMPLOYMENT STATUS - Aged 15 to 65 Male % Female % Total %
Employed 105,784 21.39 79,659 16.10 185,443 37.49
Unemployed 70,585 14.27 82,112 16.60 152,697 30.87
Economically Active Total 176,369 35.66 161,771 32.71 338,140 68.36
Not Economically Active 59,794 12.09 96,693 19.55 156,487 31.64
Grand Total 236,163 47.75 258,464 52.25 494,627 100.00
City of Cape Town, 2007b
(iv) Crime
The district has one of the worst „social fabric‟ crime rates of all districts. In 2005/2006, it had by far the largest percentage (44.6%) of reported murders and reported rapes (33.9%) in the city. It also has the second highest incidence of drug-related crime (19.7%) in the city (City of Cape Town 2006b).
(v) Housing
With 43,7%, the district has the highest percentage of informal dwellings in the city (Table 60). It has a number of very large informal settlements which include Browns Farm, Boys Town, Kosovo, Enkanini and Monwabisi Park (Figure 35). It is also worst off in terms of service levels, with the worst areas in the district being Crossroads, Khayelitsha Site C, Khayelitsha T1-V2 and T2-V2b (Figure 36).
Table 60: Types of dwellings - District F: Mitchells Plain / Khayelitsha
TYPE OF DWELLING Number %
Formal Dwelling 95,839 53.31
Informal Dwelling in back yard 10,622 5.91
Informal Dwelling not in back yard 68,007 37.83
Other 5,312 2.95
Total 179,780 100.00
City of Cape Town, 2007b
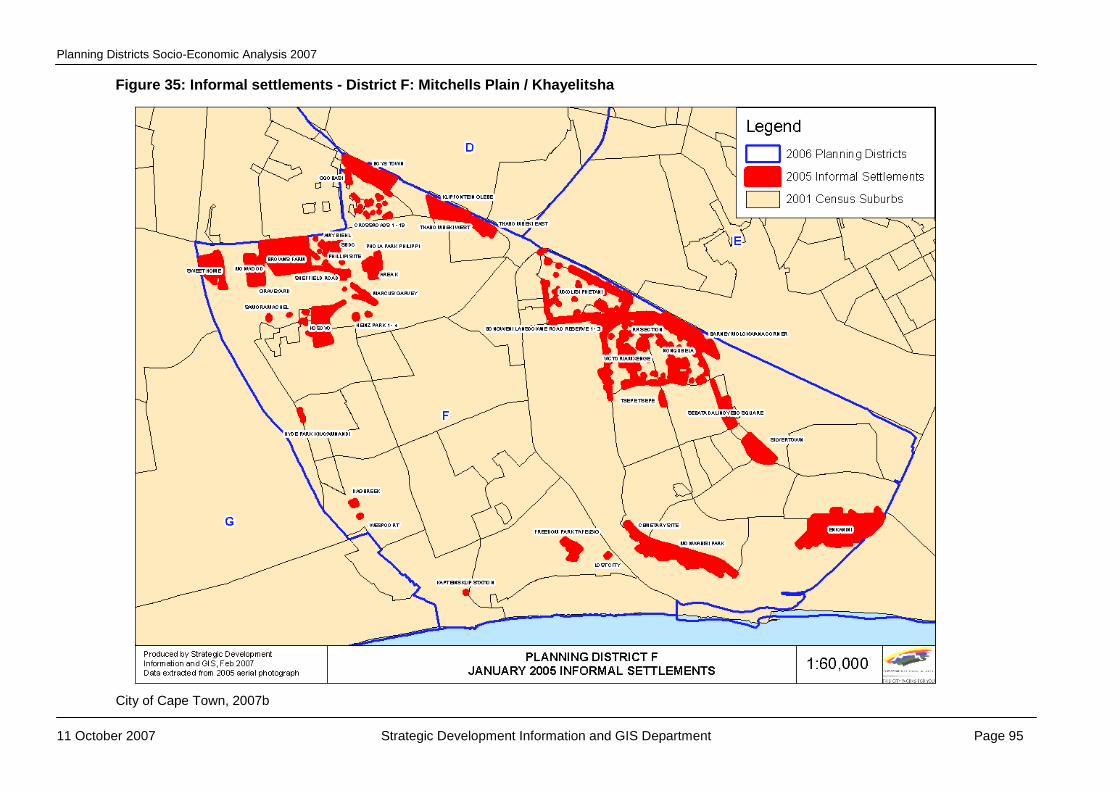
Planning Districts Socio-Economic Analysis 2007
11 October 2007 Strategic Development Information and GIS Department Page 95
Figure 35: Informal settlements - District F: Mitchells Plain / Khayelitsha
City of Cape Town, 2007b

Planning Districts Socio-Economic Analysis 2007
11 October 2007 Strategic Development Information and GIS Department Page 96
Figure 36: Service level index - District F: Mitchells Plain / Khayelitsha
City of Cape Town, 2007b

Planning Districts Socio-Economic Analysis 2007
11 October 2007 Strategic Development Information and GIS Department Page 97
(vi) Human and Social Development District F: Mitchells Plain / Khayelitsha is the worst off of all districts in terms of levels of living
(54.12 S.E.S.), with the worst areas being Khayelitsha T1 V3 and V4, Khayelitsha T2 V2b, Site C and Philippi (Figure 37). This has implications for regeneration, job creation, youth and skills development in the district.

Planning Districts Socio-Economic Analysis 2007
11 October 2007 Strategic Development Information and GIS Department Page 98
Figure 37: Socio-economic status index - District F: Mitchells Plain / Khayelitsha
City of Cape Town, 2007b

Planning Districts Socio-Economic Analysis 2007
11 October 2007 Strategic Development Information and GIS Department Page 99
(vii) Challenges and Opportunities
Due to the low level of economic activity in the district, economic development should be a priority. This increase in economic activity should include addressing the current constraints to investment, in order to „normalise‟ the economic forces in the area. In order to address the high unemployment rate, job opportunities should be promoted by implementing training programmes to ensure that the right skills for the economy. In addition to more employment opportunities for local people, it will also reduce the need to travel as residents would be able to work within the district. To this effect, public funding should be invested in the district in order to act as potential catalyst for private investment. This public investment should, however, be done in a coordinated way, in conjunction with the private sector, by locating it at nodal locations identified in the Urban Renewal Programme. There is opportunity for:
linking Khayelitsha and Mitchell‟s Plain to the sea, by means of developments towards Monwabisi and Kapteinsklip, which will also improve access to natural resources
the development of Mew Way intersection and Oliver Tambo Hall Area as part of the economic backbone of Khayelitsha
the development of the Swartklip site as an opportunity for integrating the two communities of Khayelitsha and Mitchell‟s Plain
locating economic opportunities along roads such as Klipfontein, Lansdowne, Walter Sisulu Rd, Spine Rd etc. (City of Cape Town 2006b).
As the district already has a high population density, it is the upgrading of the urban fabric that should be a priority here rather than the densification of the area. However, new development, especially those near transport infrastructure and job opportunities, should consist of higher density, mixed-use developments.
The district should be a priority district for regeneration, the provision of services and the upgrading of informal settlements, starting with the worst hit areas in the district. This upgrading of the less affluent areas should be implemented in an integrated way by including poverty alleviation and job creation strategies. This could include skills development programmes, minimising the loss of valuable agricultural land for housing purposes, small garden schemes to improve health of less affluent communities, and the promotion of urban agriculture to provide training and start funds for agricultural projects. Due to the district‟s young population and large proportion of youth, it is essential to provide youth facilities and youth development programmes in the districts. The large proportion of larger households in the district, requires a sufficient number of larger housing units should be provided in new housing developments. Addressing the high crime rate should be a priority. This should include not only programmes to deal with the crime problem directly, but also to deal with the underlying socio-economic circumstances which contributes to the crime problem. Partnerships between spheres of government, business, NGO‟s and the public are key to achieve this. Lastly, the district plan for the area should further unpack the timing, coordination and identify locations for the various physical and socio-economic opportunities in the district.

Planning Districts Socio-Economic Analysis 2007
11 October 2007 Strategic Development Information and GIS Department Page 100
4.7 District G: Klipfontein / False Bay
(i) Introduction
The district represents some of the most marginalised areas in the city and is characterised by low income dormitory type residential areas with very limited economic activity. It is the district in most need of regeneration, economic development, the provision of services, and the provision of adequate housing and effective transport systems. The district includes areas like Grassy Park, Hanover Park, Guguletu, Crossroads, Nyanga and Phillipi. District G: Klipfontein / False Bay has one of the largest populations of all the districts and also a very high population density. The district is characterised by a low standard of living with a very high unemployment rate. A list of the suburbs in the district is attached as Appendix A.
(ii) Population
The district has a total population of 512 958 people (2001), which represent nearly 18% of the city‟s population. The average age of people in the district is 26 years. It has the highest index of the number of aged with 49 aged for every 100 youth. A very large proportion of households (60.8%) have either 3-4 or 5-6 people. As in the other districts, there are also more females (52.6%) than males (47.32). See Tables 61-64 for more information.
Table 61: Population - District G: Klipfontein / False Bay
ETHNIC GROUP Male % Female % Total %
Black African 71,763 13.99 79,332 15.47 151,095 29.46
Coloured 156,894 30.59 176,428 34.39 333,322 64.98
Indian/Asian 9,195 1.79 9,364 1.83 18,559 3.62
White 4,876 0.95 5,106 1.00 9,982 1.95
Total 242,728 47.32 270,230 52.68 512,958 100.00
City of Cape Town, 2007b
Table 62: Age-Gender issues - District G: Klipfontein / False Bay
AGE Male % Female % Total %
0 - 5 27,635 5.39 27,070 5.28 54,705 10.66
6 – 12 34,138 6.66 34,118 6.65 68,256 13.31
13 - 17 24,713 4.82 25,705 5.01 50,418 9.83
18 - 34 76,293 14.87 83,249 16.23 159,542 31.10
35 - 54 55,920 10.90 66,103 12.89 122,023 23.79
55 - 64 14,092 2.75 17,693 3.45 31,785 6.20
65+ 9,937 1.94 16,292 3.18 26,229 5.11
Total 242,728 47.32 270,230 52.68 512,958 100.00
City of Cape Town, 2007b
Table 63: Age - District G: Klipfontein / False Bay
Dependency Ratio 48.92
Index of Ageing 18.43
Median Age 26 years
City of Cape Town, 2007b

Planning Districts Socio-Economic Analysis 2007
11 October 2007 Strategic Development Information and GIS Department Page 101
Table 64: Household size - District G: Klipfontein / False Bay
HOUSEHOLD SIZE Number %
1 12,261 10.29
2 17,716 14.87
3 to 4 43,225 36.27
5 to 6 29,285 24.57
7 to 8 10,620 8.91
9+ 6,061 5.09
Total 119,167 100.00
City of Cape Town, 2007b
(iii) Economy18
The district is notably lacking in economic activity with only 3.5% of all economic property. Commercial properties, in terms of property value, account for 11.6% while industrial properties account for only 8.3% (Table 65). The district has relatively lower values for office property than for retail property, which suggests that the area plays a local retail function with limited office-based sectors. In addition, large mall-type shopping centres account a very high percentage of commercial property in the district (30%), further suggesting that commerce is particularly underdeveloped in the district (City of Cape Town 2007a). According to the Census 2001 data, most formal development19 (residential and commercial) in this district took place in Grassy Park, Guguletu SP, Hanover Park, Lansdowne, lavender Hill, Lotus River, Manenberg, Nyanga SP, Ottery and Strandfontein (City of Cape Town 2007b).
Table 65: Commercial and Industrial Property Values - District G: Klipfontein / False Bay
Commercial Properties
Count %
Count Total Property Value (R mill)
% Value
Building Value (R mill)
Land Value (R mill)
920 11.6% R 980 3.4% R 710 R 270
Industrial Properties
469 8.3% R 628 5.3% R 368 R 260
Commercial and Industrial Properties (Sum of above 2 tables)
1,389 10.2% R 1,608 4.0% R 1,078 R 529
City of Cape Town 2007a
The district has the second highest level of unemployment of all districts at 19.9% (Table 66). This is particularly significant considering that 42% of the city‟s population reside within Districts G and F.
Table 66: Employment status - District G: Klipfontein / False Bay
EMPLOYMENT STATUS - Aged 15 to 65 Male % Female % Total %
Employed 81,057 23.36 72,569 20.91 153,626 44.26
Unemployed 35,761 10.30 33,436 9.63 69,197 19.94
Economically Active Total 116,818 33.66 106,005 30.54 222,823 64.20
Not Economically Active 45,747 13.18 78,494 22.62 124,241 35.80
Grand Total 162,565 46.84 184,499 53.16 347,064 100.00
City of Cape Town, 2007b
18
The information in this section relates to the formal economy only and excludes the informal economy due to the relevant data being unavailable
19 More than 3000 land use and building plan applications

Planning Districts Socio-Economic Analysis 2007
11 October 2007 Strategic Development Information and GIS Department Page 102
(iv) Crime
District G: Klipfontein / False Bay has the second largest percentage of murders (15.5%) and third highest incidence of rape (12.6%) in the city (City of Cape Town 2006b).
(v) Housing
The district has the third highest percentage of informal dwellings in the city (15.1%) (Table 61). These are mainly situated in the large informal settlements in the district such Kanana, Barcelona, KTC and New Rest (Figure 38). The area worst off in terms of services is Crossroads. Schaap Kraal, Phillipi AH and Montagu‟s Gift also have a low level of services but this may be explained by their rural character (Figure 39).
Table 67: Types of dwellings - District G: Klipfontein / False Bay
TYPE OF DWELLING Number %
Formal Dwelling 94,735 79.50
Informal Dwelling in back yard 5,106 4.28
Informal Dwelling not in back yard 12,991 10.90
Other 6,335 5.32
Total 119,167 100.00
City of Cape Town 2007b

Planning Districts Socio-Economic Analysis 2007
11 October 2007 Strategic Development Information and GIS Department Page 103
Figure 38: Informal settlements - District G: Klipfontein / False Bay
City of Cape Town, 2007b
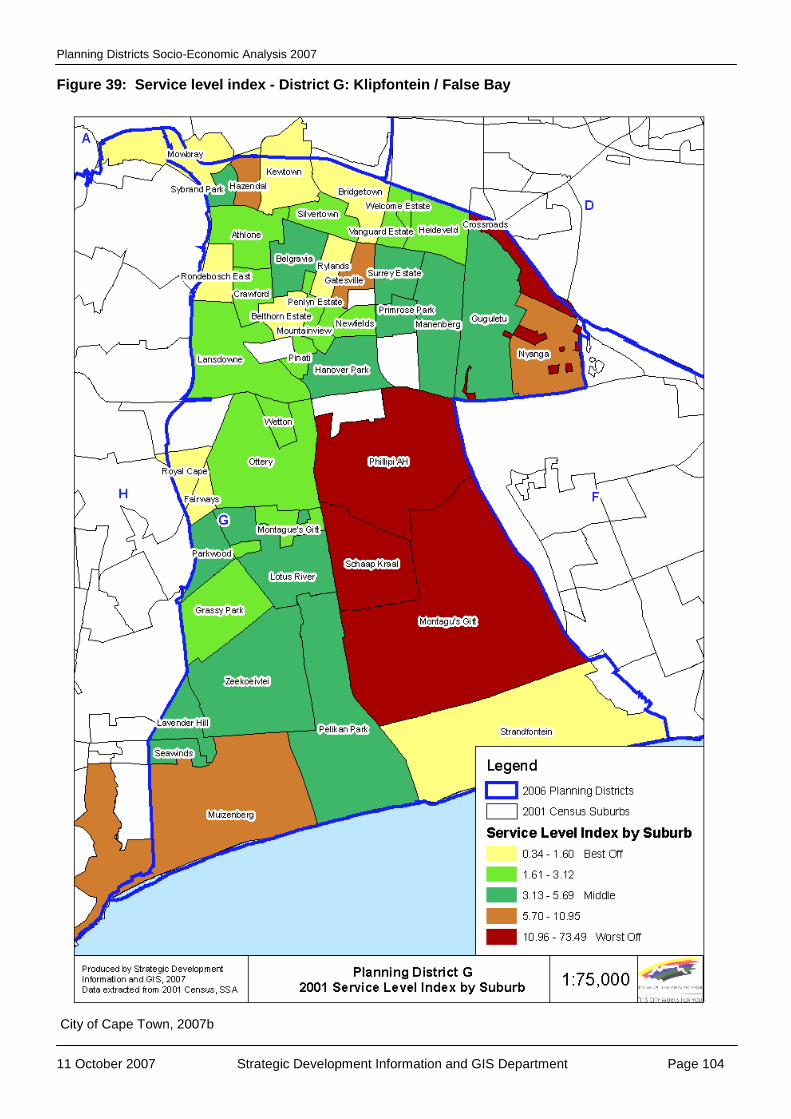
Planning Districts Socio-Economic Analysis 2007
11 October 2007 Strategic Development Information and GIS Department Page 104
Figure 39: Service level index - District G: Klipfontein / False Bay
City of Cape Town, 2007b
Planning Districts Socio-Economic Analysis 2007
11 October 2007 Strategic Development Information and GIS Department Page 105
(vi) Human and Social Development
District G: Klipfontein / False Bay is the second worst off of all districts in terms of levels of living (40.43), with the worst off area being Nyanga (Figure 40).

Planning Districts Socio-Economic Analysis 2007
11 October 2007 Strategic Development Information and GIS Department Page 106
Figure 40: Socio-economic status index - District G: Klipfontein / False Bay
City of Cape Town, 2007b

Planning Districts Socio-Economic Analysis 2007
11 October 2007 Strategic Development Information and GIS Department Page 107
(vii) Challenges and Opportunities
Due to the low level of economic activity in the district, economic development should be a priority. This increase in economic activity should include addressing the current constraints to investment, in order to „normalise‟ the economic forces in the area. In order to address the high unemployment rate, job opportunities should be promoted by implementing training programmes to ensure that the right skills for the economy. In addition to more employment opportunities for local people, it will also reduce the need to travel as residents would be able to work within the district. To this effect, public funding should be invested in the district in order to act as potential catalyst for private investment. As the district already has a high population density, it is the upgrading of the urban fabric that should be a priority here rather than the densification of the area. However, new development, especially those near transport infrastructure and job opportunities, should consist of higher density, mixed-use developments. The district should be a priority district for regeneration, the provision of services and the upgrading of informal settlements, starting with the worst hit areas in the district. Hanover Park, Guguletu and Nyanga can be developed as urban renewal areas, which may include a programme of public space upgrades and provision of essential facilities. The development potential of the strategic sites of Youngsfield and other vacant / underutilised land (such as Pelican Park) need to be maximized (City of Cape Town 2006b). This upgrading of the less affluent areas should be implemented in an integrated way by including poverty alleviation and job creation strategies. This could include skills development programmes, minimising the loss of valuable agricultural land for housing purposes, small garden schemes to improve health of less affluent communities, and the promotion of urban agriculture to provide training and start funds for agricultural projects. The consolidation, protection and improvement of access to natural resources is a priority for the protection of the Philippi horticultural area, as this is an area of high agricultural opportunity. False Bay Coastal Park is also a valuable resource that is located within the district. There is a need to improve the quality of open spaces and water systems such as Zeekoevlei, which is recognised for its biodiversity as well as recreation opportunities. Improved public transport access to the False Bay coastal resorts is also needed. There is potential for the development of a continuous open space system, including a multi-functional park on the False Bay coast (e.g. land fill / Capricorn east areas) and riverine / vlei connections (City of Cape Town 2006b). There is potential to identify „cross roads‟ as development corridors. Examples in these may include Ottery Road / Prince Georges Drive. It is suggested that the potential of the N2 off ramp sites, on the northern border of the district, be recognised. As the proposed economic backbone develops, the need for efficient public transport connections between these and the dormitory suburbs of the district will increase. A development route (and associated line haul public transport route) is planned for Strandfontein / Jan Smuts as well as for Klipfontein Roads. These will form major structuring elements in the district (City of Cape Town 2006b). The newly opened Phillip Market may become a potential catalyst for economic development in the area. There is an opportunity to create special recreational places along the underutilised False Bay edge and improving public access to these facilities. It is expected that the City‟s Dignified Place programme will have relevance to the lower income residential areas of the district, and an example of this could be the Old cement factory in Nyanga / Crossroads (City of Cape Town 2006b). Due to the district‟s young population and large proportion of youth, it is essential to provide youth facilities and youth development programmes in the districts. Due to the large proportion of larger households in the district, a sufficient number of larger housing units should be provided in new housing developments.

Planning Districts Socio-Economic Analysis 2007
11 October 2007 Strategic Development Information and GIS Department Page 108
Lastly, the district plan for the area should further unpack the timing, coordination and identify locations for the various physical and socio-economic opportunities in the district.
4.8 District H: Southern
(i) Introduction
District H: Southern is located in the south of the metropolitan area which includes many of the city‟s southern suburbs as well as the coastal suburbs in the south peninsula. The district contains some of the most sensitive ecological areas in the city and is a major tourism-orientated area. The district also contains some of the most affluent areas in the city, including areas like Bishopscourt and Llandudno. Claremont is one of the key commercial areas in the city and is located within the district. A list of the suburbs in the district is attached as Appendix A.
(ii) Population
The district has a total population of 270 525 people (2001). It has the highest value median age20 of all districts, which is 31 years. Just over half of the households (52.1%) have either 1 or 2 people. Again, there are more females (52.5%) than males (48.5%) in the district. Refer to Tables 68-71 for more information.
Table 68: Population - District H: Southern
ETHNIC GROUP Male % Female % Total %
Black African 19,267 7.12 17,423 6.44 36,305 13.42
Coloured 47,583 17.59 50,508 18.67 97,511 36.05
Indian/Asian 3,024 1.12 3,144 1.16 6,109 2.26
White 61,363 22.68 71,076 26.27 130,600 48.28
Total 131,237 48.51 142,151 52.55 270,525 100.00
City of Cape Town, 2007b
Table 69: Age-Gender - District H: Southern
AGE Male % Female % Total %
0 - 5 10,621 3.93 10,269 3.80 20,890 7.72
6 – 12 13,182 4.87 12,938 4.78 26,120 9.66
13 - 17 10,523 3.89 9,802 3.62 20,325 7.51
18 - 34 43,494 16.08 40,213 14.86 83,707 30.94
35 - 54 33,244 12.29 37,759 13.96 71,003 26.25
55 - 64 9,758 3.61 11,760 4.35 21,518 7.95
65+ 10,415 3.85 16,547 6.12 26,962 9.97
Total 131,237 48.51 139,288 51.49 270,525 100.00
City of Cape Town, 2007b
Table 70: Age - District H: Southern
Dependency Ratio 43.92 Index of Ageing 49.43 Median Age 31 years
City of Cape Town, 2007b
20
the age of that person at the mid-point of the age distribution and is an indication of the young or old character of the population

Planning Districts Socio-Economic Analysis 2007
11 October 2007 Strategic Development Information and GIS Department Page 109
Table 71: Household size in District H: Southern
HOUSEHOLD SIZE Number %
1 21,552 24.20
2 24,882 27.94
3 to 4 29,267 32.86
5 to 6 10,245 11.50
7 to 8 2,241 2.52
9+ 871 0.98
Total 89,058 100.00 City of Cape Town, 2007b
(iii) Economy21
The district is experiencing continuing commercial investment, with commercial properties accounting for 18% in terms of property value. Claremont in the district is one of the most important commercial areas in the city. Industrial properties account for 5,4% in terms of property value in the district (Table 65) (City of Cape Town 2007a). According to the Census 2001 data, most formal development22 in this district took place in Claremont, Kenilworth, Ocean View, Plumstead, Wynberg Central, Retreat and Rondebosch (City of Cape Town 2007b).
Table 72: Commercial and Industrial Property Values - District H: Southern
Commercial Properties
Count %
Count Total Property Value (R mill)
% Value
Building Value (R mill)
Land Value (R mill)
1,430 18.0% R 4,872 17.1% R 3,445 R 1,427
Industrial Properties
304 5.4% R 610 5.2% R 367 R 243
Commercial and Industrial Properties (Sum of above 2 tables)
1,734 12.8% R 5,482 13.6% R 3,811 R 1,670
City of Cape Town, 2007a
At only 13,4%, the district has the lowest level of unemployment in the city. See Table 73 for more information.
Table 73: Employment status - District H: Southern City of Cape Town, 2007b
(iv) Crime
The district has an average crime rate compared to the other districts.
21
The information in this section relates to the formal economy only and excludes the informal economy due to the relevant data being unavailable
22 More than 3000 land use and building plan applications
EMPLOYMENT STATUS - Aged 15 to 65 Male % Female % Total %
Employed 56,444 29.56 51,128 26.77 107,572 56.33
Unemployed 9,115 4.77 7,577 3.97 16,692 8.74
Economically Active Total 65,559 34.33 58,705 30.74 124,264 65.07
Not Economically Active 28,812 15.09 95,284 49.89 66,712 34.93
Grand Total 94,371 49.42 153,989 80.63 190,976 100.00

Planning Districts Socio-Economic Analysis 2007
11 October 2007 Strategic Development Information and GIS Department Page 110
(v) Housing
District H: Southern has the second largest percentage of formal dwellings in the city (87.5%) (Table 74). Imizamo Yethu in the district has the largest proportion of informal dwellings (Figure 41); whilst Red Hill has the lowest level of services (Figure 42).
Table 74: Types of dwellings - District H: Southern
TYPE OF DWELLING Number %
Formal Dwelling 77,948 87.52
Informal Dwelling in back yard 2,510 2.82
Informal Dwelling not in back yard 3,818 4.29
Other 4,782 5.37
Total 89,058 100.00
City of Cape Town, 2007b

Planning Districts Socio-Economic Analysis 2007
11 October 2007 Strategic Development Information and GIS Department Page 111
Figure 41: Informal Settlements - District H: Southern
City of Cape Town, 2007b

Planning Districts Socio-Economic Analysis 2007
11 October 2007 Strategic Development Information and GIS Department Page 112
Figure 42: Service level index - District H: Southern
City of Cape Town, 2007b

Planning Districts Socio-Economic Analysis 2007
11 October 2007 Strategic Development Information and GIS Department Page 113
(vi) Human and Social Development
Of all the districts, District H: Southern is the best off in terms of levels of living with an S.E.S of 22.16. However, there are areas in the district that are worst off, including Imajamojea and Lekkerwater (Figure 43).

Planning Districts Socio-Economic Analysis 2007
11 October 2007 Strategic Development Information and GIS Department Page 114
Figure 43: Socio-economic status index - District H: Southern
City of Cape Town, 2007b

Planning Districts Socio-Economic Analysis 2007
11 October 2007 Strategic Development Information and GIS Department Page 115
(vii) Challenges and Opportunities
There is a need to protect the natural resources of the South Peninsula mountains, coast and riverine / vlei systems e.g. Sandvlei), for biodiversity and recreational purposes. This should include improving the multi functionality and connectivity of open spaces; and providing better access to open spaces. These decisions are expected to relate, in a major way, to residential densification in areas in close proximity to natural resources. The pressure on the mountain (e.g. Silvermine and Imizano Yethu) and coastal edge sites for high value as well as lower income housing potentially could threaten the scenic assets that these areas provide, as well as compromise recreation and biodiversity associated with these areas. Similarly the pressure to erode valuable agricultural land, such as in the Tokai area, by housing development should be recognised (City of Cape Town 2006b). There is opportunity to manage urbanisation through residential densification in high opportunity locations such as along established public transport corridors such as the Southern Suburbs Main Road, and where there are also already urban amenities such as schools, sports facilities and work opportunities. There is also a need for an appropriate infill and Greenfield densification plan for the rest of the district. It is important to use existing services infrastructure optimally and to allow for an integrated pattern of income levels (City of Cape Town 2006b). An important challenge in the district is to transform dormitory townships into suburbs with appropriate amenities and opportunities. This is focused in most of the previously disadvantaged areas, such as Steenberg, as well as more recently established informal settlements, such as Red Hill. The Steenberg / Retreat area has been highlighted as an urban renewal area, which is appropriate. Decisions relating to the potential development of Retreat Industria could play a key role in this renewal. The less affluent areas, of for instance, Masiphumelele and Imizano Yethu need to be added to the list of renewal sites (City of Cape Town 2006b). This upgrading of the less affluent areas should be implemented in an integrated way by including poverty alleviation and job creation strategies. This could include skills development programmes, minimising the loss of valuable agricultural land for housing purposes, small garden schemes to improve health of less affluent communities, and the promotion of urban agriculture to provide training and start funds for agricultural projects. Due to the fact that a large proportion of households in the district consist of smaller households, it is important that housing developments cater to these households by containing an appropriate proportion of smaller units. The rich heritage assets of the district should be protected, including those in Simonstown, Kalk Bay, Wynberg and Mowbray. There are opportunities for the creation of special places on the False Bay coast, which will provide less affluent communities with better levels of natural amenity. Of importance is also the City‟s Dignified Places programme, which is planned to be expanded, with the aim of improving the quality of life in the less affluent areas. There are many opportunities for this programme in the district, namely at high accessibility points and where community facilities are clustered (City of Cape Town 2006b). The creation of an efficient public transport system is important, particularly to areas that do not have existing rail facilities and are separated geographically from the rest of the city (such as Hout Bay and Kommetjie / Red Hill). The goal of improving access indicates the need to maximize the use of existing transport facilities, such as the existing rail route along the coast. This action would have the potential of improving access to residential as well as access for other city residents to recreational amenities of the district. Kommetjie Road / Fish Hoek Road have been marked as a development route (and associated line haul public transport) that links up with the Main Road and the parallel rail facility. This development route would provide a major structuring element in this area of the district (City of Cape Town 2006b). There is an opportunity for stronger east / west transport connections linking the residential areas in the east of the district with the work and commercial opportunities in the west. This would have

Planning Districts Socio-Economic Analysis 2007
11 October 2007 Strategic Development Information and GIS Department Page 116
the potential of aligning the movement system and the pattern of land use. This link could be facilitated by the possible Steenberg Road connection, which could also integrate different parts of the city, bringing the up market and less affluent areas closer together. The district also has the potential to achieve desired pattern of equitable access by way of public / private partnerships. This is evidenced in the City‟s agreement with the Claremont City Improvement District to share costs for the upgrading of the transport interchange and access routes to at the Claremont CBD (City of Cape Town 2006b). Lastly, the district plan for the area should further unpack the timing, coordination and identify locations for the various physical and socio-economic opportunities in the district.
Planning Districts Socio-Economic Analysis 2007
11 October 2007 Strategic Development Information and GIS Department Page 117
5 CONCLUSION
The challenges facing Cape Town are numerous and the socio-economic trends for the city strongly indicate the need for a change in strategy to address these challenges. The city is facing a crossroad - it can either continue with its current path of economic growth benefiting only a few, or it can change its path towards shared growth in which the entire population benefits from economic growth and human development. Although there are many positive trends in the city, including a growing economy, healthy tourism and real estate sectors, Other factors like growing unemployment, increasing HIV/Aids prevalence rates, an ineffective public transport system and unsustainable urban sprawl should be addressed. It must be acknowledged, however, that many of the challenges, such as HIV/Aids, crime and the housing backlog, will remain for a long time and there will be a very limited chance of totally eradicating them. It is thus important to be realistic about what can actually be achieved over certain time periods. In a globalised world, Cape Town is competing with other national and international cities. Advantages that the city has include the diversity of our people, the beauty of our physical environment, sophisticated technology, efficient banking systems, a number of high quality educational institutions as well as a relative high level of education. International companies, which are highly mobile due to the break down of borders, look to invest in cities that have strong local economies, can give their employees a good quality of life, where there is stability with little inequality, a low crime and supportive legislative and administrative systems. Cape Town‟s planning and management should support these objectives, by inter alia, supporting economic growth, providing adequate infrastructure, making land available at appropriate locations, and reducing the cost of doing business. Integration between functional areas in order to achieve integrated solutions to the city‟s challenges is crucial. Planning, including spatial planning and land use management to implement it, should support the City‟s IDP objectives in all the districts. This planning should be based not just on the metropolitan area, but on the city as part of a broader region. Metropolitan-wide, urban sprawl remains a challenge, as it contributes to increasing commuting times, the loss of valuable agricultural land and areas with high biodiversity conservation potential. Attention should be given to the promotion of more dense development as opposed to sprawl to contribute to a more sustainable city. The promotion of public transport, mixed-use development and the integration between land use and transport planning (locating housing and economic opportunities near transport infrastructure) and the reduction of red tape should remain priorities for the city. Land use management should support and implement spatial planning directives. Spatial planning decisions should be based on proper socio-economic research and in consultation with all spheres of government, civil society, the residents of the city and the private sector (especially business). Consistency in promoting socio-economic, spatial and regulatory objectives should be pursued in all districts. To this effect, the Integrated Zoning Scheme will contribute to more uniform regulations and consistency in all the districts. However, integrating the „first‟ and „second‟ world components of the city in terms of land use management remains an issue, as is the lack of integration. The most effective scale for integration in order to achieve mixed and balanced communities (in terms of race and income) is at district level. More effective governance of the city will be achieved through partnerships between spheres of government, with the civil society and with the private sector. Effective public participation and the effective functioning of the subcouncils can play a role in increased democratization of the city. The city‟s population growth is expected to slow over the next 15 years, with an expected growth of approximately 30 000 people between 2006 and 2021 and a growing proportion of the aged and youth relative to total population. More specifically on a planning district level, almost a quarter of the population of the city resides in District F: Mitchells Plain / Khayelitsha. Districts D and G each
Planning Districts Socio-Economic Analysis 2007
11 October 2007 Strategic Development Information and GIS Department Page 118
have nearly 18% of the population. With just over 5% District B: West Coast has the fewest residents. District A: Table Bay is likely to continue to play a major role not only in Cape Town, but also in the region. Districts B, C and E will become increasingly important as growth in these districts continues, which will continue to impact on transport problems in the city and on neighbouring agricultural land. Major growth in the future is likely to take place in District B: West Coast. The protection of the ecologically-sensitive environment in District H: Southern will continue to be a challenge as development continues to take place in the district. Low-income housing continues on the city‟s peripheral areas mainly in the metropolitan south-east sector of Cape Town. Districts F and G, being the areas that are lacking behind in terms socio-economical indicators compared to the other districts and which contain some of the most marginalized areas in the country, will require substantial regeneration and support in order to narrow the gap between these districts and the other higher-income districts in the city. But although these districts are universally lacking in infrastructure, decent housing and economic opportunities and should be prioritized for regeneration, „islands‟ of poverty remain in most districts which should also prioritized. This upgrading of the less affluent areas should be implemented in an integrated way by including poverty alleviation and job creation strategies. The city‟s economy is distorted and the role of spatial planning to achieve more equitable development should be further unpacked in the district plans. Cape Town, Bellville, Claremont and Century City appear to be the main generators of commercial investment. The three former areas support 46% of total business turnover and contain 42% of formal businesses in the city. Commercial development data shows continuing investment in Districts A, B, C, D, E and H and relatively little investment in Districts G and F. Significant concentrations of building plan submissions are evident in the Cape Town CBD / Foreshore, Tableview, Somerset West, Durban Road and Claremont, with Voortrekker Road subjected to a high number of relatively small building plan submissions. Districts B and D have the greatest value of industrial building plans submitted and continued industrial investment is taking place in Montague Gardens, Parow and Airport Industria. Districts E, F and G play a local retail function while the other districts have better developed office-based sectors.
There is a large variation in the unemployment levels across the districts. District F: Mitchells Plain / Khayelitsha has the highest level of unemployment at 45.1% followed by District G: Klipfontein / False Bay at 31%. District H: Southern has the lowest level of unemployment (13.4%) of all districts. Job creation strategies, of which training should be a key component, should be implemented in these districts in order to provide the residents of these districts with appropriate skills for the economy. Also important is to ensure they have access to economic opportunities. To conclude, it is clear from the data, that there are great variations between the various planning districts – with each district having its own characteristics and needs. However, it is essential that the spatial planning, with other development initiatives to be undertaken for the future development of each district, be undertaken within the overall metropolitan perspective and principles for the development of the city.

Planning Districts Socio-Economic Analysis 2007
11 October 2007 Strategic Development Information and GIS Department Page 119
REFERENCES
City of Cape Town (2007a). Planning District Profiles - Spatial Economic Information, Spatial Planning and Urban Design Department, p16. City of Cape Town (2007b). Planning District Profiles, Strategic Development information and GIS, p16. City of Cape Town (2007c). Densification for Cape Town - Background, Argument, Factors, Development and Locational criteria, Spatial Planning and Urban Design Department, p25. City of Cape Town (2007d). Economic Output Figures, Department of Economic and Human Development, p2. City of Cape Town (2007e). IDP, Performance, Participation Department, Five Year Plan for Cape Town: Integrated Development Plan (IDP) 2007/8 – 2011/12, p98. City of Cape Town (2006a). State of Cape Town Report 2006: Development issues in Cape Town, Strategic Development Information and GIS, p81. City of CapeTown (2006b). Report on Audit and Review of Local Area Spatial Plans and Identification of priority Local Spatial Planning Action for the Planning Districts City of Cape Town (2006c). „Emme/2‟ Transport Model, Transport, Roads and Stormwater Department, p34. City of Cape Town (2005). N2 Economic and Human Development Framework, Economic and Human Development Department, p35.