Embed Size (px)
Citation preview

Kitsap County Department of Community Development Page 1 of 2
Planning Commission Executive Summary
Issue Title: Kitsap County Buildable Lands Update
Meeting Date: December 15, 2020
Time Required: 45 minutes
Department: Department of Community Development (DCD)
Attendees: Angie Silva, Dave Ward, and Liz Williams
Action Requested At This Meeting: Review current approach to Land Capacity Analysis (LCA) framework and assumptions, discuss issues to consider in the 2020 Buildable Lands Program Update, and provide an update on coordination with the cities.
Background
Kitsap County, in coordination with local cities, is updating its Buildable Lands Program pursuant to the requirements set forth in the State’s Growth Management Act, RCW 36.70A.215 and WAC 365-196-315. The Growth Management Act requires Kitsap County and its cities to issue a Buildable Lands Report once every eight years. The purpose and scope of the Buildable Lands Program and subsequent report is to:
• look back at development trends between 2013 and 2019 to review consistency with local policies and plans;
• look forward and evaluate if there is adequate land supply in urban growth areas to support anticipated population and employment growth targets, and
• identify reasonable measures, if necessary, to address any inconsistencies that may be identified by the review and evaluation.
In addition to the requirements in state law, Kitsap’s Countywide Planning Policies (CPPs) require local jurisdictions to use an agreed-upon methodology for the forward-looking Land Capacity Analysis (LCA) to determine if there is adequate land supply. Within each step, jurisdictions can use different assumptions to account for local circumstances that may be unique to that community. As part of the last Buildable Lands Report and current residential LCA approach, a nine (9) step method was developed to evaluate future land supply. The steps included: Step 1 - Define vacant and underutilized parcels by zone. Step 2 - Identify underutilized lands likely to redevelop over the next 20-years. Step 3 - Identify critical areas. Step 4 - Identify future roads/right of way needs.

Kitsap County Department of Community Development Page 2 of 2
Step 5 – Identify future public facility needs. Step 6 - Account for unavailable lands (market factor). Step 7 - Determine available net acres by zone. Step 8 - Apply density in each zone to yield housing unit capacity. Step 9 – Apply average household size (single-family and multi-family) to housing unit capacity to yield net population capacity. A detailed summary of the current LCA approach, variations used by the cities, and issues to consider based on new statutory requirements passed by the state legislature in 2017 (SB 5254) is in Attachment 1. In addition, the presentation from the December 8th Jurisdiction Coordination Meeting is in Attachment 2. At the December 15th briefing, DCD will review the previous LCA approach and provide an update on the status of coordination with jurisdictions to identify an agreed-upon methodology for the 2020 update. Attachments:
1. Summary of current Land Capacity Analysis (LCA) approach and considerations for 2020 update.
2. Presentation from the Jurisdiction Coordination Meeting on December 8, 2020.

Kitsap County Buildable Lands Program Update, 2020 Review of 2014 Land Capacity Analysis (LCA) Approach and Considerations for Updates
Exhibit 1 summaries the LCA approach used by the county and jurisdictions in 2014 and identifies issues to consider in the 2020 update. Some of these issues correspond to new requirements passed by the state legislature in 2017 (SB 5254). More detailed discussions of these requirements are provided in the Additional Considerations section following Exhibit 1. Commercial and industrial LCA methods are included in Exhibit 2 at the end of this document.
Exhibit 1. Residential LCA Methods
Topic/Step 2014 county approach City variations Issues to consider in 2020 BLP
Step 1: Define Vacant and Underutilized Parcels by Residential Zone
Use County Assessor data to categorize all parcels:
Vacant (parcels without development, no minimum size)
Underutilized (parcels with remaining capacity for residential development. Exclude parcels<0.5 Acres, multifamily, commercial/industrial)
Bremerton: Underutilized threshold (LDR) =12,500 sq ft for SF parcels, 18,000 for duplex. (Bremerton used an alternative threshold in an area served by a private sewer system. This is a good example of an infrastructure gap analysis. See additional discussion below.)
Poulsbo: Underutilized threshold: Remove parcels that are less than 2x minimum lot size
County approach doesn’t allow for possibility of redevelopment in zones that allow for more intense use, such as replacement of a parking lot in a zone that allows for higher-density multifamily. New Commerce Guidelines recommend breaking down the county’s “underutilized” category into two different categories:
o Partially-utilized: Developed parcels that contains enough land to be furthersubdivided – recommended for single family zones.
o Under-utilized: Developed parcels that are zoned for a more intensive use andtherefore has potential to be redeveloped – recommended for multifamily zones.
Breaking the land supply into these categories would allow for making different assumptions regarding which types of parcels to exclude and what deductions apply in later steps. Here are Step 1 considerations:
o Partially-utilized: Rather than excluding parcels<0.5 acres, County is consideringmax lot size as threshold (18,000 sq ft) in UL and UCR. Also, how to account forfact that many SF lots are restricted by covenant and can’t be subdivided?
o Under-utilized: Consider lower assumption for minimum lot size. Don’t excludemultifamily, commercial, industrial. These could be redevelopable under somecircumstances in multifamily zones.
Consider adding pipeline as a fourth category. Exclude and set aside these parcels prior to identifying vacant, partially-utilized, and under-utilized (see detailed discussion below).
New requirement for infrastructure gap analysis could be addressed in this stage by identifying targeted areas where development may be partially or fully constrained. See detailed discussion under Additional Considerations, below.
1 of 11 December 4, 2020
Attachment 1

Topic/Step 2014 county approach City variations Issues to consider in 2020 BLP
Step 2: Identify Underutilized Lands Likely to Redevelop over the next 20 Years
For single family parcels, use a set of formulas including ratio of home value to median home value as well as density ratio to identify underutilized parcels with additional development potential.
Bremerton: Simpler approach: Exclude homes value > 2.75*median
Consider different approaches for partially- and under-utilized land:1
o Partially-utilized: County could simplify method by using two steps. For example:First exclude parcels where allowed DU/Acre is greater than 2.5X existingDU/Acre. Then identify and exclude parcels with homes valued significantly morethan the median (such as home value>2.75x median home value).
o Under-utilized: For parcels with existing residential use, use similar approach asfor partially-utilized. For parcels with non-residential use, consider improvementto land value ratio threshold (such as <0.5).
Step 3: Identify Critical Areas
Identify critical area acres among vacant and underutilized parcels. Assume 75% reduction for ‘critical areas’ and 50% reduction for areas of moderate geologic hazard
Poulsbo: Apply a flat 26.5% reduction factor. Bainbridge: Added a liquefaction layer
Update for 2017 CAO buffer
Step 4: Identify Future Roads/Right of Way Needs
Applied 20% reduction factor to buildable land supply for both vacant and underutilized.
Bainbridge: Skipped step (used a gross density approach.)
Consider different approaches for partially- and under-utilized land:
o Partially-utilized: Analyze recent plat data to determine actual % of acreagefor ROW. When evaluating, consider differences in % for plats with privateroads and plats with public ROW. Update reduction factor if appropriate.
o Under-utilized: Consider using a significantly lower assumption, since theseparcels are typically already in urbanized areas where infrastructure is alreadypresent and new development will be consolidated (multifamily buildings insteadof dispersed SF homes).
1 See examples from other jurisdictions at end of this document.
2 of 11 December 4, 2020
Attachment 1

Topic/Step 2014 county approach City variations Issues to consider in 2020 BLP
Step 5: Identify Future Public Facilities Needs
Applied 20% reduction factor to buildable land supply for both vacant and underutilized.
Bainbridge and Bremerton: 15% reduction factor for both vacant and underutilized.
Consider new stormwater requirements in 2019.2 County adopted new standards in 2017.
Consider applying different (lower) assumption for under-utilized parcels, which are typically in already urbanized areas with existing infrastructure and facilities.
Step 6: Account for Unavailable Lands (Market Factor)
Vacant: remaining lands supply is reduced by 5%
Underutilized remaining land supply is reduced by 15%.
Bremerton: Custom market factors for centers. Much higher.
New RCW and WAC emphasizes that cities and counties should consider local circumstances, and may use a market factor to account for “the estimated percentage of developable acres contained within an urban growth area that, due to fluctuating market forces, is likely to remain undeveloped over the course of the twenty-year planning period” (Commerce, 2018, p. 48). So, the topic is broader than just considering landowner intent. This issue will be considered as part of BERK’s Housing Availability & Affordability Memo.
Heartland will be reviewing 2014 approaches and may provide additional recommendations for changes based on current real estate market characteristics in communities across the county. Heartland’s review may also be considered as part of BERK’s Housing Availability & Affordability Memo.
Consider whether different assumptions should be used based on PSRC typology.
Step 7: Determine Available Net Acres by Zone
Sum net developable acres (vacant and underutilized together) following deductions, by zone.
Underutilized plats: Add 25% of platted lot acres back into underutilized land supply.
Vacant plats: Add 100% of the vacant platted lots previously removed. Assume one unit per lot and add
Consider not adding plats (or any pipeline) into the land supply at this stage. Instead these can be added in at the end of Step 8 when calculating housing unit capacity based on actual permitted lots or units.
2 Ecology published a new stormwater management manual in 2019: https://ecology.wa.gov/Regulations-Permits/Guidance-technical-assistance/Stormwater-permittee-guidance-resources/Stormwater-manuals
3 of 11 December 4, 2020
Attachment 1

Topic/Step 2014 county approach City variations Issues to consider in 2020 BLP
directly to housing unit capacity.
Step 8: Apply Density in each Zone to Yield Housing Unit Capacity
Multiply remaining buildable acreage in each zone by the assumed dwelling units per acre for that zone.
Subtract existing units from underutilized capacity.
Consider using achieved density from the “look back” analysis as the default assumption for all zones.
In cases where zoning or development regulations have recently changed, and insufficient permit data is available to evaluate the market response, adjusted density assumptions should be developed. Consider looking at achieved densities in other jurisdiction with similar zoning and market characteristics.
For pipeline development: Use actual permitted units or lots associated with pipeline development. Do not use density assumptions unless actual permitted unit counts do not exist.
For ADU capacity on existing SF lots: Add this unit capacity at the end of this step, similar to pipeline development. Jurisdiction must use assumptions or analysis to determine the number of new ADUs that could reasonably be expected based on development regulations and a fairly large market factor to account for homeowners that would not choose to add an ADU.
New requirement for infrastructure gap analysis could be addressed in this stage by applying lower density assumptions to parcels in targeted areas. See discussion below.
Step 9: Apply Average Household Size (SF/MF) to Housing Unit Capacity to Yield Net Population Capacity
Total population capacity for each zone and UGA is derived by multiplying the dwelling unit capacity by the average household size for applicable single-family and multi-family zones.
Consider adding a vacancy rate assumption to more accurately measure capacity. In other words, reduce the supply by 5% before multiplying by household size.
Clarify source for average household size. ACS data includes average household sizes for both ownership and rental households. One option is to apply the ownership HH size to single family capacity and the renter HH size to multifamily capacity to calculate total population capacity.
4 of 11 December 4, 2020
Attachment 1

ADDITIONAL CONSIDERATIONS
Pipeline Development This land capacity analysis is designed to measure capacity for new growth as of January 1, 2020. Pipeline development refers to permitted growth that was not built yet before January 1, 2020, the baseline data of the land capacity analysis. Unless there is a reason to believe the growth will not actually be completed, this growth should be accounted for in the capacity calculations. BERK recommends that planned developments be removed from the land supply at the outset and added back in based on approved final permits or development agreements. 3 Consider doing this for three different types of “pipeline” development:
Final platted lots that have not yet been approved for building permits: set aside the acreage in advance of deductions for critical areas, ROW, and public facilities. Assume one unit per single family platted lot.
Parcels with final land use permits or development proposals approved after the “cutoff” date for the “look back” (e.g. January 1, 2020). Set these parcels aside as “pipeline” to be considered later in the LCA with approved density level.
Approved master planned or phased development with development agreements. Set these parcels aside as “pipeline” to be considered later in the LCA with approved density level. If something is preliminary and still pending, consider the proposed density as assumed densities but do not set aside the land. 4
Infrastructure Gaps New statutory requirements require that jurisdictions consider the impact of infrastructure gaps (including transportation, water, sewer, and stormwater) on land suitable for development or redevelopment (RCW 36.70A.215(3)(b)(i)). Commerce guidance advises that jurisdictions evaluate factors, identify a rationale, and potentially reasonable measures:
In determining whether there is an infrastructure gap, jurisdictions should consider several factors: Is there a long-term lack of urban development in the area?
How did the recent comprehensive plan address the needed infrastructure provision, and is that information still valid?
If the infrastructure is anticipated to be provided later in the planning period, is development likely to occur quickly so that planned development is realized within the planning period, or will some of the area remain undeveloped?
3 BERK Consulting, March 24, 2014, “Kitsap County Commercial Buildable Lands Methods.” Planned developments. The ULCA was not clear on how planned developments (permitted but not built yet or planned under an approved development agreement) are being handled. Parcels for these projects should be removed from the buildable land supply and have their planned capacity added directly to final buildable land inventories. This practice could be applied for developments receiving final land use approval. 4 Examples: Pierce County – Pipeline projects include those projects that have an active development application. For parcels that have pipeline projects, the number of units applied for are counted toward the capacity. ‘Major Projects’ are large scale planned development projects.” Snohomish County – Pending – parcels with pending applications for new construction. King County – Major Planned Developments: Parcels where large known future developments are located may also be excluded from the land supply analysis; identify anticipated year of completion. Whatcom County – “pending” projects, those projects approved but not yet built.
5 of 11 December 4, 2020
Attachment 1

The key is to make sure the issue is documented so measures, including reasonable measures, can be implemented where appropriate. Depending upon how the county and cities choose to address infrastructure gaps, this analysis could be integrated into an existing step or included as a brand-new step. Presently, Kitsap County’s BLR method accounts for applying deductions for rights-of-way and public facilities (e.g. stormwater). The deeper review of ability to serve and methods is left to the Capital Facilities Plans and supporting system plans of each jurisdiction during the Comprehensive Plan process. Another targeted and thorough example of infrastructure gap analysis is the City of Bremerton’s 2014 analysis of capacity on Marine Drive, an area served by a private septic system. The city recognized that it does not anticipate extending sewer to the area in the foreseeable future. Therefore, it used an alternative standard to determine whether lots that are not served by sewer are potentially subdividable. This effectively reduced the capacity for new development in that area of the city. In this case, the city integrated the infrastructure analysis during Step 1 of the LCA methodology, when identifying underutilized parcels, and possibly Step 8 when determining the assumed density on just the parcels in that gap area.
To meet the statutory requirements guidance, jurisdictions could document that they have conducted the evaluation of the effect of infrastructure gaps on land suitability for development or redevelopment, and potentially factor in findings in a few ways:
Document the effect of infrastructure gaps in the planning period on land supply.
Identify how infrastructure plans can be amended to address the concerns, or identify other reasonable measures.
Snohomish County has continued such an evaluation process from its 2012 BLR approach, using more recent case studies to document how it its long-standing process holds to the new guidance. It’s current steps are to: 1) identify potential gaps through a map review with each city, 2) assess the factors leading to lack of development which may be infrastructure or other reasons, and 3) document a rationale for reduced capacity or application of reasonable measures to address the infrastructure gap.5 The County does not automatically or broadly remove land from the supply or change deduction factors; rather it is a process that results in targeted reviews and tailored responses around individual community issues.
Other counties intend to use an evaluation process to potentially address adjustments to land supply and potentially other deduction factors. 6
After reviewing guidance from Commerce as well as the work of other buildable lands counties, BERK identified the following kinds of issues that may be considered when evaluating whether there may be an infrastructure gap:
Unserved areas: Use GIS analysis to identify parcels that are located in unserved areas without planned infrastructure improvements, or where infrastructure investments are not likely to be in place before late in the study period.
System capacity: Review capital facilities plan to determine if growth in an area of the jurisdiction is dependent upon the provision of significant new public infrastructure due to capacity constraints. If so, determine if there are any expected barriers to that infrastructure capacity being provided within the 20-year planning period.
5 Personal Communication, Steve Toy, November 5, 2020, Snohomish County did not go down the path of removing land from the supply either partially or fully, just due to distance from infrastructure anticipating that is accounted in a developer’s proforma. The County considered case studies that supported the County’s current approach with more emphasis on county-city review of maps and potential reasonable measures. See: https://www.snohomishcountywa.gov/DocumentCenter/View/72633/20200207-Snohomish-BLP-Task-3-memo-corrected-date. 6 Examples: King County is identifying properties greater than 200 feet from water/sewer. Pierce County is identifying properties greater than 200 feet from sewer, and intending to use the information to potentially calibrate its deduction factors for public facilities, ROW, or market factors. (Personal Communication, Jessica Gwilt, October 22, 2020.)
6 of 11 December 4, 2020
Attachment 1

If an infrastructure gap is identified, the jurisdiction will require a rationale for how to account for that gap. For instance, determine whether the gap is likely to be resolved within the planning period. The jurisdiction can also evaluate whether the gap is a partial or full gap (in other words would the gap prevent all development, or just reduce the amount of expected growth in an area). The jurisdiction should consider whether the gap is already accounted for through other deductions (such as market factor), to avoid double-counting. As noted in the Commerce guidebook, documentation and evaluation may help identify appropriate reasonable measures.
In Kitsap County, the County and cities could consider recent water and sewer capital plans, the Wastewater Infrastructure Task Force results, Kitsap County Health Department identification of existing failing septic systems, and alternative wastewater treatment options for urban areas. Using a stepwise evaluation approach, the County and cities would limit instances of partial or full deduction from the land supply and also moderate changes to deductions appropriately.
Impact of Development Regulations “RCW 36.70A.215(3)(b)(i) states that the evaluation of land suitable for development or redevelopment must also evaluate land use designation and zoning/development regulations including environmental regulations and other regulations that could prevent assigned densities from being achieved.” (Commerce 2018, p. 30) The impacts of development regulations on capacity should typically be accounted for in achieved density calculations, and therefore no additional action would be necessary to address this requirement during the LCA. However, if new development regulations were adopted during the evaluation period, then additional analysis may be warranted to evaluate the potential impacts on development capacity. Some development regulations are already accounted for in deductions during Steps 3, 4, and 5. However others, such as parking minimums, could have an impact that are not consider elsewhere in this analysis.
SELECTED APPROACHES FROM OTHER JURISDICTIONS
Thresholds for Identifying Under-utilized or Partially-utilized Parcels (Residential)
Snohomish County (2020) Snohomish county differentiates redevelopable (under-utilized) land from partially vacant land. The term “partially vacant” is synonymous with the concept of “partially-utilized” used by Commerce.
King County (2020) The county used the following thresholds in unincorporated areas. Many cities adopted the same thresholds, while others customized to local conditions.
Single Family parcels: Allowed DUs/Acre > 2.5x existing DUs/Acre
Multifamily: Allowed DUs/Acre > 2.5x existing DUs/Acre
Mixed-use/Non-residential: Improvement Value/Land Value < 0.5
For cities which use FAR (floor area ratio) to define density, the county encourages them to use density ratio threshold (potential floor area/existing floor area) based on FAR.
7 of 11 December 4, 2020
Attachment 1

Pierce County (2014) Underutilized – Existing Residential Use. For an existing residential use parcel, it may be classified as “underutilized” if one of the following criteria are met: 1. “Residential or mixed-use zoning classification: a. The ATR use code is single family/mobile home, multi-family, or mobile home park. i. For existing single-family housing units, the improvement value is less than $500,000 ii. For multi-family and mobile home parks, the improvement value is less than $1,000,000 b. The ratio of assumed housing build-out to existing housing units is greater than or equal to 2.5.
Exhibit 2. Commercial/Industrial LCA Methods
Topic/Step 2014 county approach City variations Issues to consider in 2020 BLP
Step 1: Define Exempt Parcels
Properties with the following property class codes are considered exempt/excluded:
Utility; Transportation; Marinas; Cemeteries; Hospitals; Government; Services; Schools; Churches; Cultural, Entertainment, and Parks/Recreation; Tidelands and water area
Current Use exempt parcels (RCW 84.34)
Multifamily (assumed that they are already maximizing allowed density)
Bremerton: Within Centers, remove right-of-way, water systems, tidelands, fully encumbered easements, common areas, and gas stations.
Is the list of exemptions still relevant? Any changes/adjustments to this list?
Should multifamily property continue to be considered exempt? Have any zoning changes over the past 6 years impacted the height/density limits enough to reconsider this approach? For example, a duplex in a zone allowing for higher-density mixed use.
Step 2: Define Vacant and Underutilized Parcels
Parcels currently classified as vacant are labeled as “Vacant Land”. No minimum lot size exclusion.
Parcels with single family, mobile homes, sheds/garages, or cabins are considered underutilized.
Parcels where improvements are valued less than the land are considered underutilized.
Platted and Planned lots are removed from the vacant and underutilized land supply.
Bremerton: Land area in identified ‘Centers’ are considered underutilized with the exception of structures built after 2005.
Consider adding pipeline as a fourth category. Exclude these and set aside these parcels prior to identifying vacant, and under-utilized (see detailed discussion above).
Reevaluate if the improvement to land value ratio is still at the right level. Compare to other jurisdictions and conduct targeted analysis of recent redevelopment activity to confirm.
8 of 11 December 4, 2020
Attachment 1

Step 3: Identify Critical Areas
Use currently adopted Critical Areas Ordinance to determine critical area coverage. Vacant and underutilized parcels that overlap with critical areas are reduced in land area by LCA reduction factors: 75% reduction for critical areas and 50% reduction for areas of moderate geologic hazard.
Poulsbo: 26.5% Critical Areas reduction factor. Update for 2017 CAO buffer
Step 4: Identify Future Roads/Right of Way Needs
Reduce remaining totals for vacant and underutilized land supply by 20% for future roads and rights-of-ways.
Bainbridge Island: Reduction not taken.
Bremerton: Reduce Centers land area by one-time 15% to account for ROW, public facilities, and undevelopable terrain.
Vacant: Consider using look back results to identify % ROW in actual commercial or mixed-use developments.
Under-utilized: Consider using a significantly lower assumption, since these parcels are typically already in urbanized areas where infrastructure is already present and new development will be consolidated.
Step 5: Identify Future Public Facilities Needs
Reduce remaining land area by 20% for both vacant and underutilized land to account for future public facility needs.
Bainbridge Island: 15% reduction rate used.
Bremerton: Centers do not take additional reduction.
Consider new stormwater requirements in 2019. 7 County adopted new standards in 2017.
Consider applying lower assumption for under-utilized parcels given that they are typically in urbanized areas with less need for new public facilities.
Step 6: Account for Unavailable Land (Market Factor)
Vacant land supply reduced by 20% and underutilized land supply reduced by 25%.
Bremerton assumptions varied by district:
a. Downtown Regional Center: -50%
b. Charleston District Center: -80%
c. Wheaton / Riddell District Center: -50%
d. Wheaton / Sheridan District Center: -70%
Bremerton District reductions are based on estimated build-out times. Would these be reduced to account for the 6 years that have passed? Is build-out occurring on pace with previous expectations?
Heartland is developing recommendations that vary based on PSRC typology and
7 Ecology published a new stormwater management manual in 2019: https://ecology.wa.gov/Regulations-Permits/Guidance-technical-assistance/Stormwater-permittee-guidance-resources/Stormwater-manuals
9 of 11 December 4, 2020
Attachment 1

e. Oyster Bay Neighborhood Center -80%
f. Bay Vista Neighborhood Center Site: -10%
g. Manette Neighborhood Center: -60%
h. Perry Avenue Neighborhood Center: -80%
i. Sylvan / Pine Neighborhood Center: -90%
j. Haddon Park Neighborhood Center: -90%
k. Harrison Employment Center: -50%
local market characteristics. It will also include guidance for local circumstances that may justify varying from these recommendations.
Step 7: Convert Net Available Acres into Building Square Footage by Zone
Multiply net developable acres by 43,560 to convert into building square footage. This is then multiplied by a lot coverage estimate. In commercial zones, this is 32% and for industrial zones this is 38%.
Silverdale UGA: Business Center and Mixed-Use zones use a lot coverage calculation of 25%
Bremerton
Neighborhood Centers: Commercial acreage estimated at 30% of base net land area. Then apply factor of 10,000 SF building area per acre.
District and Employment Centers: Commercial acreage at 40% of base land area for each. Apply factor of 10,000 SF building area per acre.
Downtown Regional Center: Commercial land as 100% of base land area, apply 10,000 SF of building area per acre.
Bay Vista: Commercial land as 15% of base land area.
Commerce guidance indicate that achieved densities must serve as basis for this capacity conversion. Use look-back data findings to calculate, by zone and jurisdiction/UGA the achieved FAR. Multiply by lot square footage for commercial/industrial floor area.
For mixed-use zones, consider whether the look-back findings can calculate achieved FAR for the commercial parts only. If so, that FAR can be directly used in this step. If not, a commercial/residential split percentage assumption will be needed in this step.
For any pipeline development, use actual plans for building square footage instead of estimates based on lot size.
Step 8: Vacancy Rate Reduction
Reduction of 5% from remaining square footage
10 of 11 December 4, 2020
Attachment 1

Step 9: Apply Employment Density Rate to Determine Employment Capacity
Density assumption for industrial zones is 969 SF/employee and 500 SF/employee in commercial zones
Bremerton Centers: 3 jobs per 1,000 SF of commercial space.
Consider updating these density assumptions. The county assumptions are significantly lower than the achieved employment density calculations BERK recently competed for King County. BERK can provide sample ranges from nearby jurisdictions and explore potential of direct measurement of achieved densities in Kitsap County by city.
11 of 11 December 4, 2020
Attachment 1

This page intentionally left blank.

Kitsap County Buildable Lands Program
Jurisdiction Coordination Meeting #2 LCA Concurrence
December 8, 2020
Attachment 2
December 4, 2020

Agenda
▪ Meeting Objective:
❑ Concurrence on LCA steps. New BLP recommendations fit into existing steps.
▪ Review LCA Steps and Areas of Agreement/Questions
▪ Review Market Factor Approach
▪ LCA Approach, Options, and Linkage to Affordable Housing
▪ Next Steps
2
Attachment 2
December 4, 2020

Land Capacity Analysis: Fit/Timing in Process
▪ Addresses land supply in the look forward
▪ Depends on the look backward with development trends
▪ Based on LCA framework and recommendations discussed in this meeting BERK and Heartland will develop guidance/methodology for LCA
▪ BERK will document final methodology in a technical memo
3
Attachment 2
December 4, 2020

Process Overview
2019 20362013
Looking backwardAre we on-target?
Is growth consistent with plans?
Looking forwardIs there planned capacity to accommodate
growth?
What needs to change?
Land Supply
Analysis
Development
Trend Review
informs
2020Analysis period Analysis period
4
Attachment 2
December 4, 2020

Timeline and RolesOctober2020
November 2020
December 2020
January 2021
February 2021
March 2021
April 2021
May 2021
June2021
Jurisdiction Meetings:
Role Phase 1: “Look back” review Phase 2 – Land Capacity
Analysis (LCA)
Phase 3 – Buildable Lands
Report
BERK • Support and
recommendations for data
collection process
• Compare growth trends to targets
• Prepare guidance/
methodology for LCA
(technical memo)
• Analyze regulatory barriers
and prepare draft housing
memo
• Prepare draft and final
Buildable Lands Report (BLR) and spreadsheet with results
• Prepare final Housing memo
• Reviews reasonable measures
framework, provides recommendations
County • Guidance for permit data
preparation and analysis
• Public/stakeholder outreach
• Public/stakeholder outreach
• Facilitate public comment
period
• Facilitate public comment
period
• Release final BLR by June 30
Cities* • Compile permit data
• Evaluate achieved densities
• Local public outreach (if
desired)
• Carry out LCA
• Review draft technical
memo and draft housing
memo
• Review draft BLR and provide
comments
* County will conduct these activities for unincorporated areas.
5
Attachment 2
December 4, 2020

LCA Steps and Areas of Agreement/Questions
6
1
Step 1: Define Vacant and Underutilized Parcels by Residential Zones
2
Step 2: Identify Underutilized Lands Likely to Redevelop over the next 20 Years
3
Step 3: Identify Critical Areas
4
Step 4: Identify Future Roads/Right of Way Needs
5
Step 5: Identify Future Public Facilities Needs
6
Step 6: Account for Unavailable Lands (Market Factor)
7
Step 7: Determine Available Net Acres by Zone
8
Step 8: Apply Density in each Zone to Yield Housing Unit Capacity
9
Step 9: Apply Average Household Size (SF/MF) to Housing Unit Capacity to Yield Net Population Capacity
Discuss Discuss ✓ ✓ ✓ Discuss ✓ ✓ Discuss
• Split of land
types
• Pipeline
• Infrastructure
Gap
• Support
step, need to
define
• Particular
subarea
adjustments
• General
agreement
• Split
moderate and
high geo haz
• General
agreement
• General
agreement
• Private +
Public (yes)
• Infrastructure
gap –
relationship
• Review
method
• Land with
covenants
• General
agreement
• ADUs,
Difficult to plat
lots, addressed
in other steps
• General
agreement
• Desire
guidance on
densities
• Basis for
5%?
• General
concurrence on
diff HH sizes
(ACS)
Attachment 2
December 4, 2020

Step 1: Pipeline
Projects in the development pipeline should count towards capacity for growth over the 20-year period.
▪ In Step 1: Set aside parcels with the following characteristics:
❑ Final platted lots that have not yet been approved for building permits.
❑ Parcels with final land use permits or development proposals approved after the “cutoff” date for the “look back” (January 1, 2020).
❑ Approved master planned or phased development with development agreements.
▪ In Step 8: Add these pipeline parcels back in
❑ Assume one unit per single family platted lot
❑ Use approved density level for permitted, development proposals, or MPD
7
Attachment 2
December 4, 2020

Step1: Defining vacant parcels
Vacant Parcels
▪ Parcels of land that have no structures or have buildings with little value.
8
SF
SINGLE FAMILY
RESIDENTIAL
MULTIFAMILY
RESIDENTIAL
COMMERCIAL
ZONING DESIGNATION
SF
SF
Attachment 2
December 4, 2020

Steps 1 and 2: Partially-utilized land
Partially-Utilized Land
▪ Parcels occupied by a use, but which contain enough land to be further subdivided without
rezoning.
▪ For example: a single house on a 10-acre parcel, where urban densities are allowed, may
be considered partially utilized land.
9
SINGLE FAMILY
RESIDENTIAL
MULTIFAMILY
RESIDENTIAL
COMMERCIAL
ZONING DESIGNATION
SFHSF SF SF
SF
SF SF SF
SF
SF
Attachment 2
December 4, 2020

Steps 1 and 2: Under-Utilized Land
Under-utilized Land
▪ Parcels of land that have some current development, but are zoned for more intensive use than that which currently occupies the property.
▪ An LCA identifies under-utilized parcels that are potentially redevelopable❑ Due to present or expected market forces,
there is strong potential for the existing development to be converted to more intensive uses during the planning period.
❑ A single-family home on multifamily-zoned land may be considered under-utilized.
❑ Improvement to land value ratio is a common method of identifying under-utilized parcels with commercial uses
10
SINGLE FAMILY
RESIDENTIAL
MULTIFAMILY
RESIDENTIAL
COMMERCIAL
ZONING DESIGNATION
MF
MF MF
Retail
SF SF Parking
SF
SF
Attachment 2
December 4, 2020

Objectives
• Provide an improved framework and methodology for determining and applying a
Market Factor
• Better reflect market realities present across the County
• Facilitate a clear process and resource for Cities to leverage
Market Factor Guidance
12/4/2020Kitsap County Market Factor Guidance 11
Attachment 2
December 4, 2020

Approach to market factor in King County
• Analyze development patterns over the last 20 years by market area/jurisdiction and
product type
- What was delivered over the last 20 years by product type?
- How do historical rates of deliveries align with future capacity planned in the area?
- Leverage this data to inform market factor recommendations
• Provide recommendations for determining market factor based on:
- Product type, jurisdiction type, market conditions
- Other known market constraints
Step 6: Market Factor Guidance
12/4/2020Kitsap County Market Factor Guidance 12
Attachment 2
December 4, 2020

Why use this approach?
• To inform a market factor assumption, we’re using historic product delivery and projected
capacity for that product to derive a more realistic market factor assumption
• Historic deliveries by product type data is the best proxy for the nexus of real estate
market conditions, willingness to sell and other factors that limit the development of land
•Serves as a nexus between proposed densities, economic conditions needed to
achieve those densities
12/4/2020Kitsap County Market Factor Guidance 13
Step 6: Market Factor GuidanceAttachment 2
December 4, 2020

Step 6: Market Factor Guidance FRAMEWORK
12/4/2020Kitsap County Market Factor Guidance 14
Attachment 2
December 4, 2020

DetailsDefinitions and
Reference
Explanation of
step
PSRC Definitions Alignment
Market Conditions Alignment
Identify the predominant
product type in each zone of
the City where capacity
exists
Menu of typologies (PSRC)
Market Conditions index
Explanation of each product
type
• Framework of Location typologies is PSRC
• Variation on PSRC typologies based on market
conditions
• Pick the correct City typology
• Review market indicators to evaluate whether City
is a low or high growth market (or somewhere in
between) for that product type
• Find correct table, review and use to inform market
factor assumption
• Select the product types that align with the zones
within your City that have capacity.
• The product type would be the predominant use
expected in a given zone
For each product type select
a market suitable for your
CityMarket Factor Ranges
Step
4. Adjustments
• Review know conditions that impact MkF
• Evaluate applicability in your City
• Adjust market factor assumption based on on-the-
ground conditions that you are aware of
Adjust selected assumption
based on know conditionsConditions Considerations
12/4/2020Kitsap County Market Factor Guidance 15
3. Select from MkF Ranges
2. Identify City Typology
1. Identify Zoning by Product
type
Example
Attachment 2
December 4, 2020

City Types (PSRC)
Metropolitan Core CitiesHigh Capacity Transit
Communities Cities and Towns
Bremerton & Bremerton Urban Growth Area (UGA)
Silverdale Bainbridge Island None
Poulsbo & Poulsbo UGA
Kingston
Port Orchard & Port Orchard UGA
12/4/2020Kitsap County Market Factor Guidance 16
PSRC Designations
1 2 Attachment 2
December 4, 2020

12/4/2020Kitsap County Market Factor Guidance 17
1 2 3
Table 3a: Core City Market Factor Ranges
RESIDENTIAL Market Factor Segments
Product Type Low Market Factor Medium Market Factor High Market Factor
Multifamily and Residential Mixed
Use 1% -15% 16%-35% 36% - 55%
Single Family Residential 1%-10% 11% - 20% 21% - 40%
NON-RESIDENTIAL Market Factor Segments
Low Market Factor Medium Market Factor High Market Factor
Industrial 1% - 15% 16% - 30% 31% - 50%
Commercial - Office 1% - 10% 16% - 30% 31% - 50%
Commercial - Retail 1% - 10% 16% - 30% 31% - 50%
Commercial - Mixed 1%-20% 21% -35% 36% - 55%
Example
Attachment 2
December 4, 2020

Step 9: Conversion to Population Capacity
▪ Convert housing unit capacity to households
❑ Calculate by reducing unit capacity by 5% to account for the need for vacancy
❑ A healthy housing market needs enough vacancy to allow movers enough options. Without sufficient vacancies, housing prices and rents can escalate quickly.
▪ Convert households to population
❑ Best source: American Community Survey (B25010)
❑ Household size assumptions:▪ Single Family: Average household size – owner occupied
▪ Multifamily: Average household size - renter occupied
18
Attachment 2
December 4, 2020

LCA, Options & Linkage to Affordable Housing
19
Attachment 2
December 4, 2020

LCA Steps and Relationship to Affordable Housing
20
1
Step 1: Define Vacant and Underutilized Parcels by Residential Zones
2
Step 2: Identify Underutilized Lands Likely to Redevelop over the next 20 Years
3
Step 3: Identify Critical Areas
4
Step 4: Identify Future Roads/Right of Way Needs
5
Step 5: Identify Future Public Facilities Needs
6
Step 6: Account for Unavailable Lands (Market Factor)
7
Step 7: Determine Available Net Acres by Zone
8
Step 8: Apply Density in each Zone to Yield Housing Unit Capacity
9
Step 9: Apply Average Household Size (SF/MF) to Housing Unit Capacity to Yield Net Population Capacity
• Review permit history, and
remaining supply regarding housing
variety, choice, tenure and price
points.
• Review infrastructure in Step 1 or
8: avoid overly reducing land base
or applying broad assumption
• Review
constrained land
esp. if passed
over.
• Right density/
zone?
• Partial buffer
reduction?
• Future effect of pending standards
on cost of housing.
• Consider if addressed in market
factor or infrastructure.
• See left. • Review again
for effective
housing variety,
choice, tenure
and price points.
• Enough
available land
to meet need for
affordable
ownership/
rental?
• For under-
performing
zones, consider
reasonable
measures that
address needed
housing types.
• If considering
future projected
household sizes
rather than
existing, may
result in need for
more housing
units and
greater need for
land supply.
Attachment 2
December 4, 2020

LCA
Ste
pStep 1: Define Vacant and
Underutilized Parcels by Residential Zones
Step 2: Identify Underutilized
Lands Likely to Redevelop over the next 20 Years
Step 3: Identify Critical Areas
Step 4: Identify Future Roads/Right
of Way Needs
Step 5: Identify Future Public
Facilities Needs
Step 6: Account for Unavailable Lands
(Market Factor)
Step 7: Determine Available Net
Acres by Zone
Step 8: Apply Density in each
Zone to Yield Housing Unit Capacity
Step 9: Apply Average
Household Size (SF/MF) to Housing Unit Capacity to
Yield Net Population
Capacity
Re
co
mm
en
da
tio
ns
Breakdown into:▪ Vacant
▪ Partially-Utilized▪ Underutilized▪ Pipeline
Targeted
infrastructure gap analysis as appropriate.
Partially-utilized: • 2 steps - density
and valueUnder-utilized:• Residential
parcels: density ratio
• Non-residential parcels: improvement to
land value
▪ Map based reduction for
critical areas▪ Update for
recent buffer
widths
▪ Partially-utilized: Actual % ROW,
public & private from look-back analysis.
▪ Under-utilized: Lower % in
developed areas
▪ Consider new stormwater
requirements ▪ Under-utilized:
Lower
assumption in developed
areas
▪ Pending▪ Vary by real
estate market and PSRC typology
▪ Modify current method: Wait
to add in plats and pipeline and ADUs until
Step 8.
▪ Default: Achieved
▪ Use examples for new zones
▪ Add in plats,
pipeline and ADUs here
▪ Infrastructure gap option: Lower density in
target area
▪ For occupancy reduce the
supply by 5% before multiplying by
household size▪ Update
average HH size. Consider ACS tenure
information.
Op
tio
ns
Consider including some “tax exempt” land with development potential per AH
Strategy #2 to increase capacity for affordable housing development.
Parcel-based rev iew of %
constraints if desired to fine tune supply.
Does zoned capacity reflect investments in multimodal transportation or regional
stormwater facilities? That could result in area-specific discounts that differ from Steps 4 and 5.
Develop matrix of assumptions by
land type, market conditions (past & future). Could
assist with centers.
Apply assumed densities in under
performing zones to avoid reducing capacity where
plan addresses.
Consider future household sizes
per PSRC VISION 2050.
Lan
d C
ap
ac
ity
C
ha
ng
e
▪ Breakdown: Neutral▪ Infrastructure Analysis: –
▪ Potential Tax Exempt: +
• Critical areas: –• Buffer: Full or
partial –
• ROW and Pub Fac: Vacant and Partially Utilized: Greater –
• ROW and Pub Fac Underutilized: Lesser –
• Vacant: lesser –• Partially-utilized
Underutilized: greater –
Neutral Effect of achieved or assumed
densities could be + or –
Vacancy rate: –HH size: could be +
or –
Affo
rda
ble
Ho
usi
ng
R
ela
tio
nsh
ip
▪ Gross land supply by zone; Review permit history, and remaining supply
regarding housing variety, choice, tenure and price points.
▪ Infrastructure costs on housing:
Consider alternative technologies per WIT and recommendations of AH
Strategy #2. Compare effect of Step 1 versus Step 8 to address infrastructure: avoid overly reducing land base or
applying broad assumption.
Review land constrained by
critical areas / potentially passed over. Is it zoned to
account for constraints? Does
buffer density transfer apply? A lesser buffer
deduction may apply.
Are ROW and public facilit ies deductions reflecting past standards and costs on
housing – what is future effect of pending standards? Should future infrastructure uncertainties be accounted in market
factor? Is it already addressed in infrastructure gap analysis?
See left. Once deductions are taken, rev iew
again for effective housing variety, choice, tenure
and price points. Enough available
land to meet need for affordable ownership/ rental?
If plan does not adequately
address strategies for under-performing zones,
consider reasonable
measures that address needed housing types.
If considering future projected
household sizes rather than existing, may result
in need for more housing units and
greater need for land supply.
Attachment 2
December 4, 2020
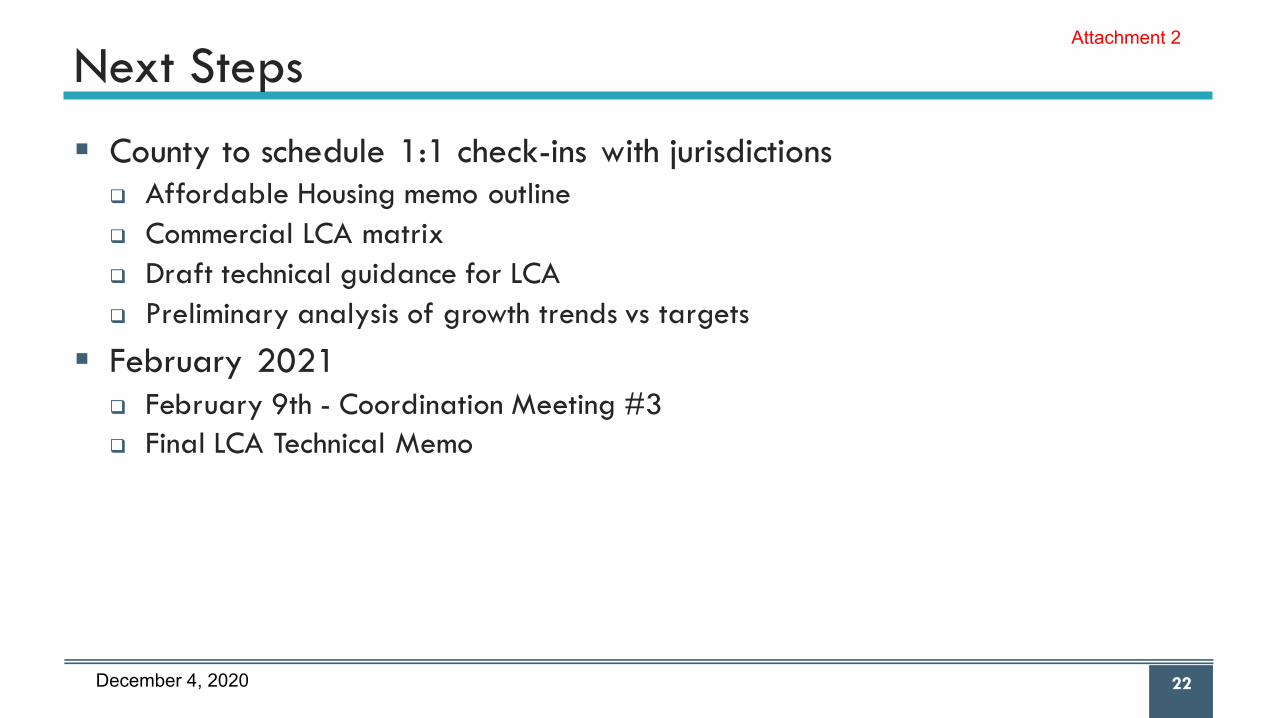
Next Steps
▪ County to schedule 1:1 check-ins with jurisdictions
❑ Affordable Housing memo outline
❑ Commercial LCA matrix
❑ Draft technical guidance for LCA
❑ Preliminary analysis of growth trends vs targets
▪ February 2021
❑ February 9th - Coordination Meeting #3
❑ Final LCA Technical Memo
22
Attachment 2
December 4, 2020