Embed Size (px)
Citation preview

PJM©2013
Future Generation Mix in PJM
Governor’s Conference on EnergyRichmond, VA
Steven R. Herling
Vice President, Planning
PJM Interconnection
October 17, 2013

PJM©20132
PJM Well Positioned for Growth in Gas-Fired Generation

PJM©20133
Where the Drilling Action is Today
PJM©20134
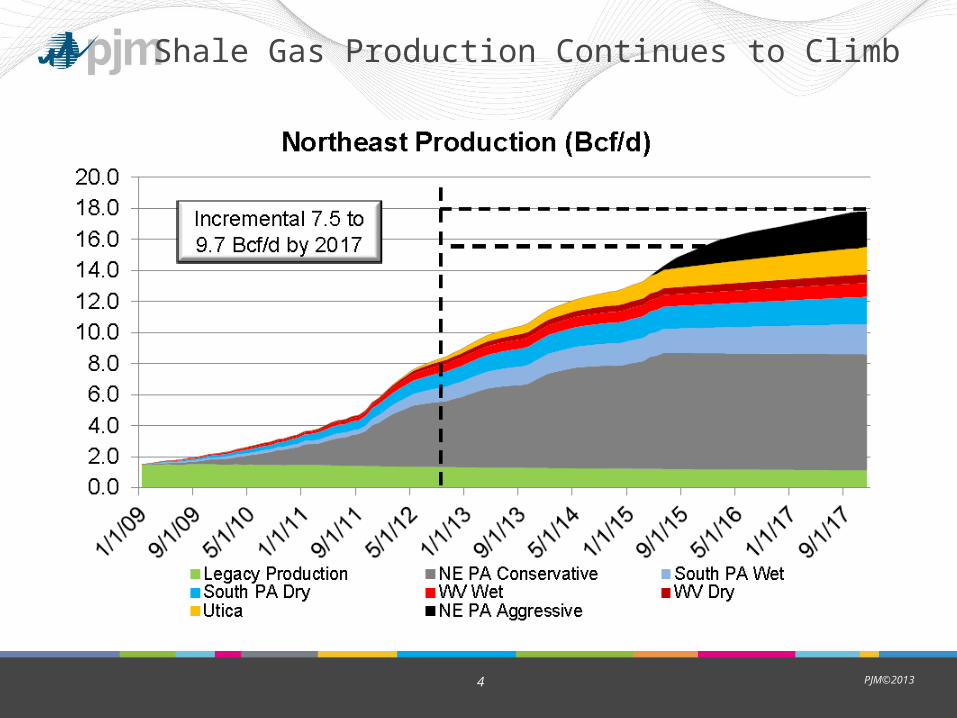
Shale Gas Production Continues to Climb

PJM©20135
Delivered Fuel Price
Source: IHS-CERA, September 2013

PJM©20136
Lingering Low Electricity Demand

PJM©20137
Spot Power Price Projections
Source: IHS-CERA, September 2013

PJM©2013
Evolving Generation Mix in PJM

PJM©20139
Evolving Generation Mix

PJM©201310
Projected Generation Mix
Source: IHS-CERA, September 2013

PJM©201311
Generation Deactivations
Over 20 GW of Actual & Announced Deactivations 2011-2016

PJM©201312
Natural Gas Dominates Current Active Projects in the Queue
Natural Gas43,701 82%
Wind2,623 5%
Coal2,188 4%
Nuclear2,556 5%
Other1,934 4%
MW Capacity Value
Natural Gas
Wind
Coal
Nuclear
Other
Natural Gas45,722 63%
Wind17,293 24%
Coal2,201 3%
Nuclear2,696 4%
Other4,542 6%
MW Energy Value
Natural Gas
Wind
Coal
Nuclear
Other
As of July 2013
As of July 2013
PJM©201313
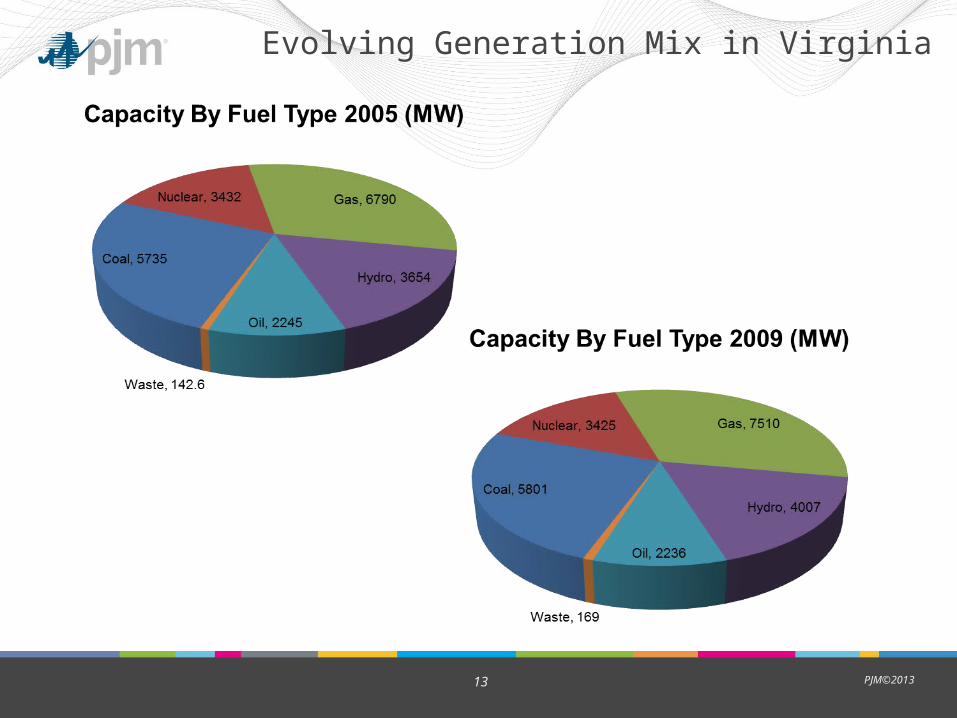
Evolving Generation Mix in Virginia

PJM©201314
Evolving Generation Mix in Virginia

PJM©201315
Generation Under Construction in Virginia
NuclearNatural Gas
PJM©201316
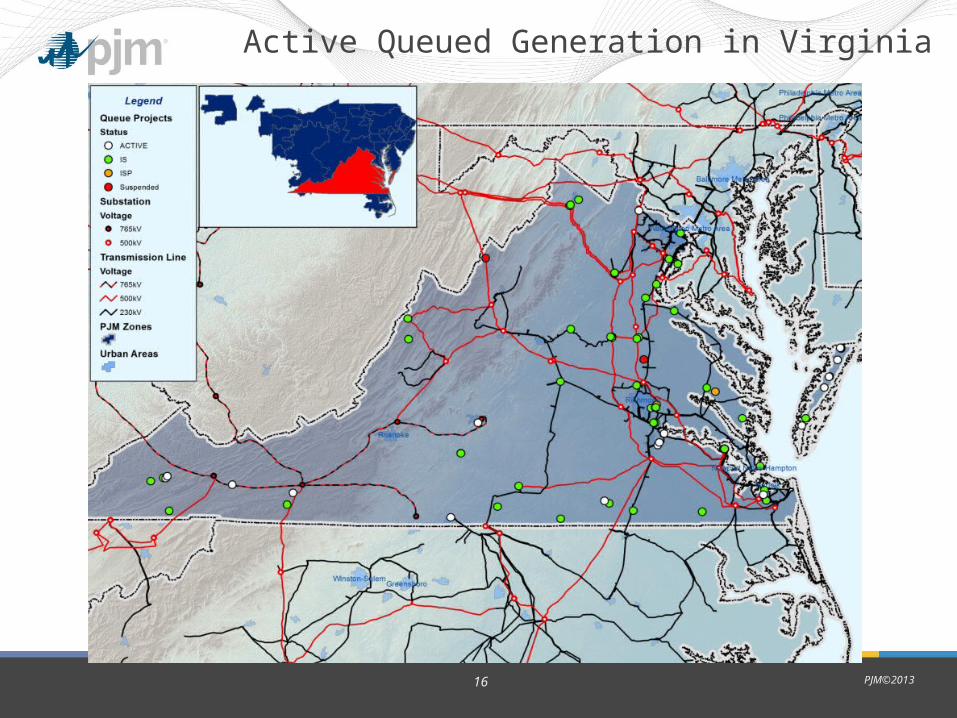
Active Queued Generation in Virginia

PJM©201317
Evolving Generation Mix in Virginia

PJM©201318
Decreasing Emission Rates
Source: PJM EIS

PJM©201319
Natural Gas Impact to PJM Capacity Pricing
from $136.00
from $167.46
from $357.00
from $167.46
2015/2016 Base Residual Auction Results (last year)

PJM©201320
Increasing Power Generation Natural Gas Consumption
Most other categories of natural gas consumption have had flat or decreasing usage trends!

PJM©201321
Power Generation is NOT the Ideal Gas Customer
Power generation gas use does not fit neatly into the gas contractual construct
•Electricity demand, like gas demand, fluctuates and is subject to steep ramps, especially in winter
•Increased wind and other intermittent resources don’t help
•Fastest starting generation resources, generally are gas-fired combustion turbines which can go to full output in about 10 minutes or less

PJM©201322
Some Electric/ Gas Coordination Issues
• Language barrier
• “Intermittency” of electric demand
• Power generation use of interruptible service
• Gas Day vs. “Electric Day”
• Natural gas has some storage -- “just-in-time” fuel source

PJM©201323
Firm vs. Interruptible Service
Majority of PJM gas-fired generators have interruptible gas delivery service
•Generators buy available firm service from others, via capacity release or bi-lateral arrangement
•Use marketers to acquire a bundle of commodity and delivery
•Risk curtailment for local delivery issues
– Northern NJ – January 2013
– Cleveland – July 2013
What PJM is doing: Discussing changes to market rules, dual fuel requirements, etc. as part of the PJM
Gas Electric Senior Task Force
What PJM is doing: Discussing changes to market rules, dual fuel requirements, etc. as part of the PJM
Gas Electric Senior Task Force
PJM©201324
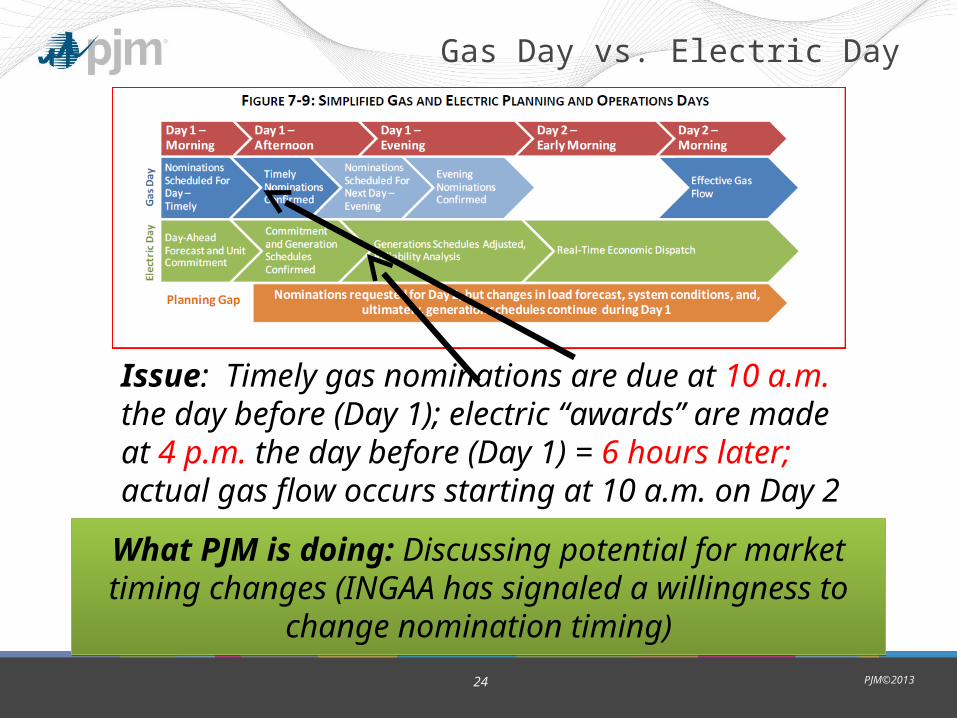
Gas Day vs. Electric Day
Issue: Timely gas nominations are due at 10 a.m. the day before (Day 1); electric “awards” are made at 4 p.m. the day before (Day 1) = 6 hours later; actual gas flow occurs starting at 10 a.m. on Day 2
What PJM is doing: Discussing potential for market timing changes (INGAA has signaled a willingness to
change nomination timing)
What PJM is doing: Discussing potential for market timing changes (INGAA has signaled a willingness to
change nomination timing)

PJM©201325
Natural Gas is a Just-in time Fuel Source
• We’re used to having significant fuel at the generation site—coal piles, nuclear fuel, etc.
• Gas moves at ~35 mph – it takes days to arrive from the Gulf of Mexico, although proximity to Marcellus/Utica helps
• Pipeline can “line pack” to some degree, but advanced planning is necessary
• Pipelines do have storage to some degree, but generators have to contract for it
What PJM is doing: Learning about gas pipeline capabilities and anticipating “big picture” look from the
EIPC Gas Study
What PJM is doing: Learning about gas pipeline capabilities and anticipating “big picture” look from the
EIPC Gas Study

PJM©201326
What is FERC Doing?
• Bringing the industries together
– Series of technical conferences
• Some finger pointing, but also
• Some very useful information exchange
– Trying to exert leadership to bring solutions (Moeller)
• NOPR on communications
– Remove barriers between gas control and system operators to exchange non-public information
What PJM is doing: Supporting the FERC efforts through participation and comments
What PJM is doing: Supporting the FERC efforts through participation and comments

PJM©201327
In the Meantime….
• Pipeline expansion process is working (hopefully, in time to save New England!)
• Large majority of gas-fired generators use interruptible service in PJM and other markets (and PJM has had some operational issues)
• We continue to exchange large amounts of data via electronic bulletin boards, but is minimally useful in operations
• Operators on both sides stand ready to respond to surprises that will pop up periodically (daily in New England!)
PJM©201328
Summary
• Power generation is a “double edged sword” for the gas business– Largest growth market– Potential to cause problems in operations
• Working together, we can minimize the operational problems– Awareness of the limitations on each side– Increased real time communications across the aisle– Use of the demand side resources on each side

PJM©201329
Questions