Embed Size (px)
Citation preview

Piyush Shanker and Howard Zebker

C-band (6 cm)– ERS and Envisat satellites from ESA.
L-band (24 cm)– ALOS PALSAR from JAXA.
Comparison of Conventional InSAR (C-band and L-band)
InSAR stacking (C-band)
Persistent Scatterer InSAR (C-band)
Implications for DESDynI and future missions.
• Does the amount of fault creep vary as a function of location along the fault?
• Does the fault creep at the same rate over time?
Ryder and Burgmann (2008)
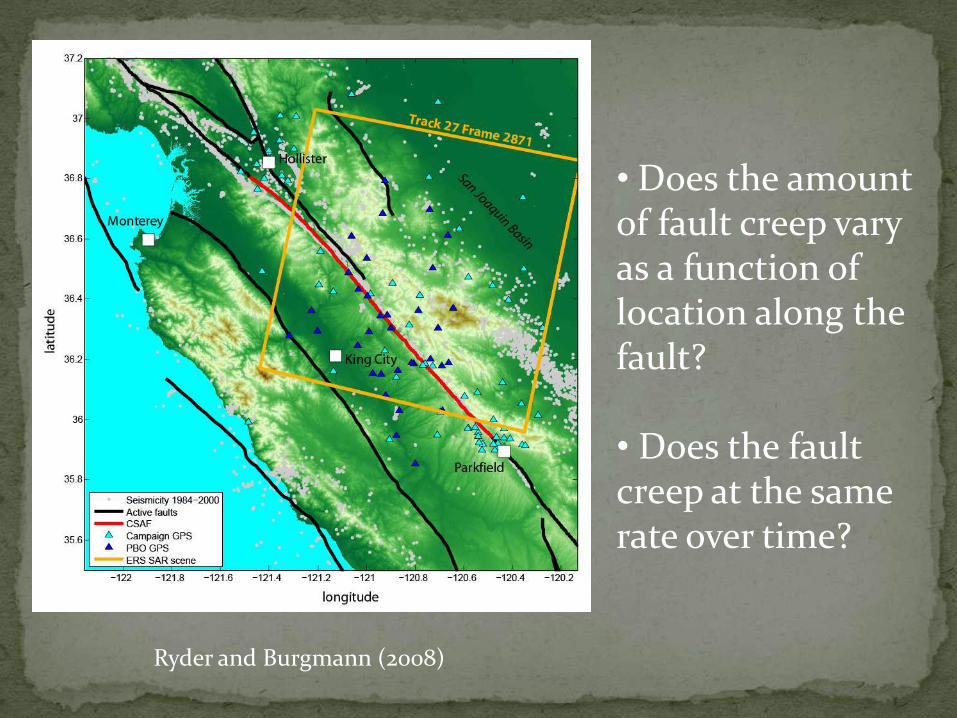
• Baseline of 3 meters.• Time separation of 420 days.• First aseismic creep observation using InSAR.
Rosen et al (1998)
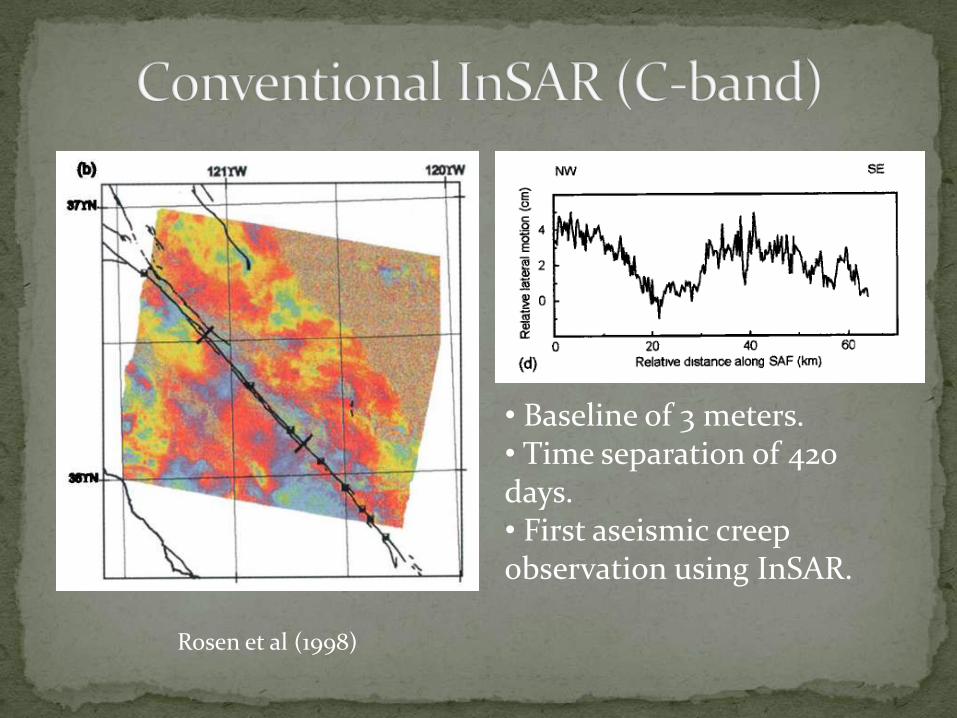
• 13 C-band ERS interferograms. • The fault is locked at the surface near Parkfield.• The estimated shallow creep rate is 30-35 mm/yr.• 20-25 mm/yr around Monarch peak.
Ryder and Burgmann (2008)
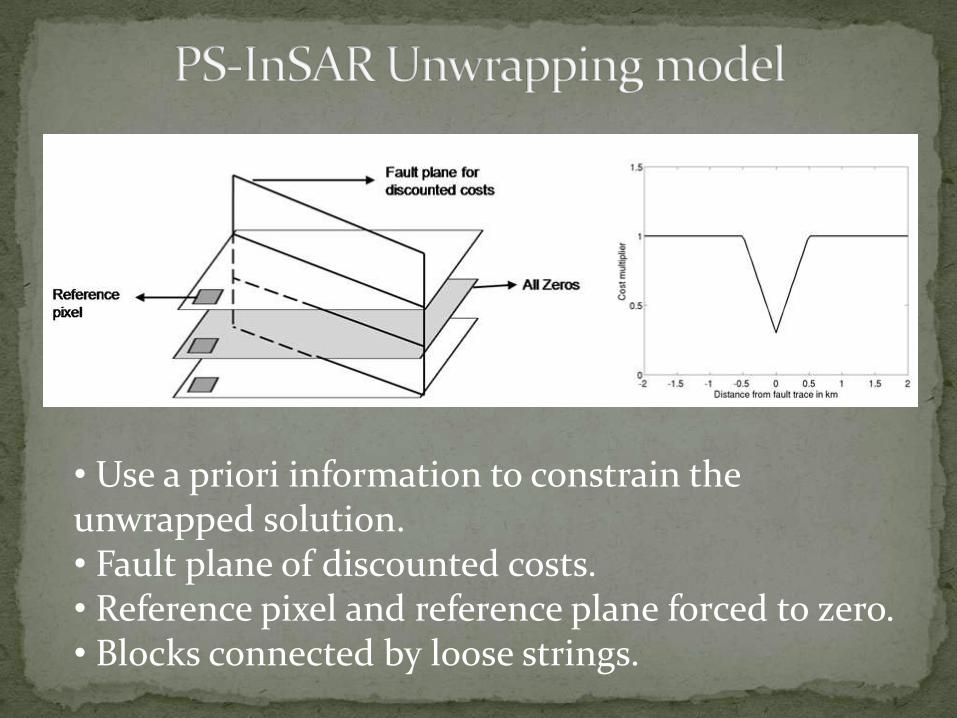
• Use a priori information to constrain the unwrapped solution.• Fault plane of discounted costs.• Reference pixel and reference plane forced to zero.• Blocks connected by loose strings.

•The velocity plot clearly shows block like motion.• The average creep is 22 mm/yr.

• Solution agrees well with creep meters.• GPS stations after 2005.• Microseismicity is a suggested proxy for fault creep.• Non-uniform creep rate?

March 2007 - Dec 2009. 31 m baseline.
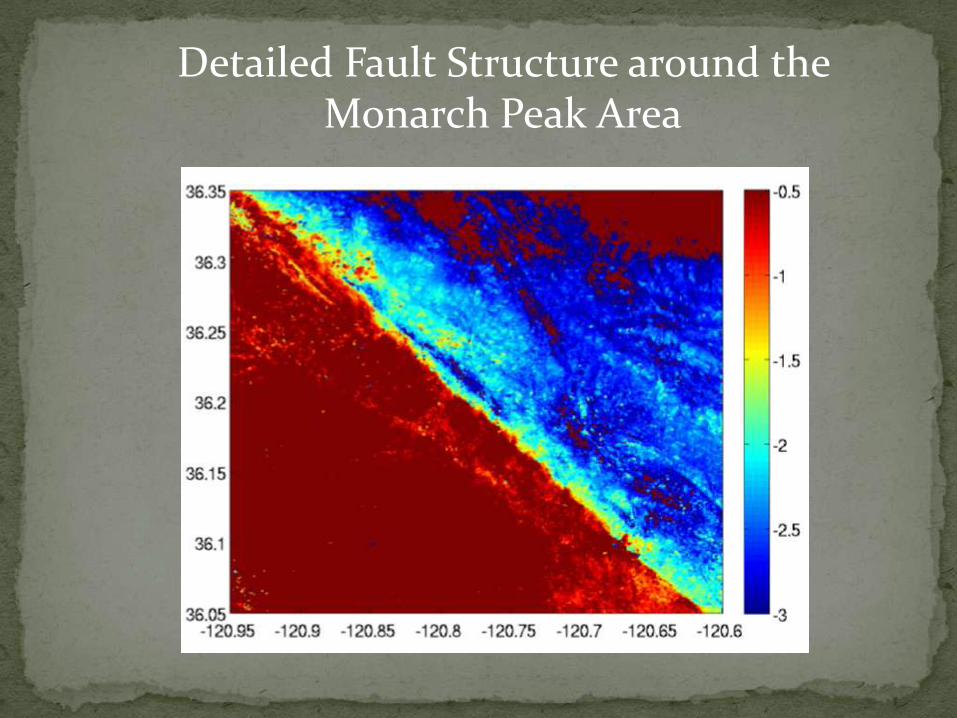
Detailed Fault Structure around the Monarch Peak Area

Profiles across the Fault

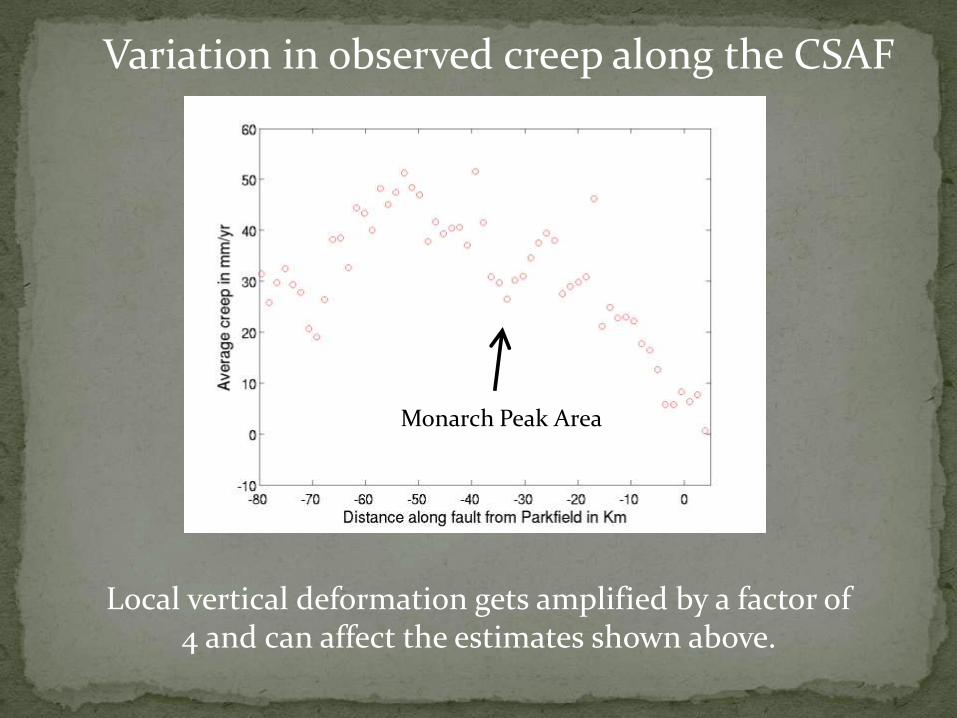
Variation in observed creep along the CSAF
Monarch Peak Area
Local vertical deformation gets amplified by a factor of 4 and can affect the estimates shown above.

Oct 2007 – Mar 2007Baseline: 1000 m
Sep 2009 – Mar 2007Baseline: 500 m

L-band system. Expected to outperform existing C-band ESA systems.
Greater coherence and possibly higher resolution.
Multiple imaging geometries will help separate out local vertical deformation.
The deformation at the “lock” location can be better characterized.
Systematic baseline drift of ALOS PALSAR does not allow us to estimate DEM error.
Better baseline control on DESDynI will also enable us account for DEM and sub-pixel position error.
12 ALOS scenes each for the Parkfield and San Juan Batista areas.
15-20 viable interferograms with “ubiquitous” coherence.
Invert for time-series of creep across the fault.
Invert the time-series using Elastic half-space models.
Comparison with X-band InSAR.