Embed Size (px)
Citation preview

- 1 -
PIV MEASUREMENTS OF FLOW IN AN AERATED TANK
STIRRED BY A DOWN- AND AN UP-PUMPING AXIAL FLOW IMPELLER
J. AUBIN†‡, N. LE SAUZE†, J. BERTRAND†, D.F. FLETCHER‡ AND C. XUEREB†*
† Laboratoire de Génie Chimique, UMR CNRS 5503, FRANCE
‡ Department of Chemical Engineering, University of Sydney, AUSTRALIA
Aubin J., Le Sauze N., Bertrand J., Fletcher D.F. and Xuereb C., ‘PIV Measurements in an Aerated
Tank Stirred by a Down- and Up-Pumping Axial Flow Impeller’, Experimental, Thermal and Fluid
Science, 28, 447-456, (2004).
*Author to whom correspondence should be addressed. Email : [email protected] ; LGC, 5 rue
Paulin Talabot, BP- 1301, 31106 Toulouse Cedex 1, FRANCE.

- 2 -
Abstract: Liquid phase hydrodynamics in an aerated tank stirred by a down- and an up-pumping pitched blade
turbine have been investigated using Particle Image Velocimetry. The effect of agitator configuration and the gas
phase on the mean velocity fields and turbulent quantities in the vessel have been investigated. The global mean
gas holdup has also been evaluated for the two pumping conditions. For the gas flow rate used, the presence of
gas only slightly alters the liquid flow patterns produced by both the down- and up-pumping configurations and
causes a general decrease in the mean liquid velocities. The turbulent kinetic energy in the impeller discharge
region was not affected by the presence of gas, but in the bulk of the tank, aeration caused a decrease in this
value. Global gas holdup was found to be ~36% greater for the up-pumping impeller and a large amount of gas
was found to be entrained by the primary circulation loop.
Keywords: mixing, gas-liquid, pitched blade turbine, up-pumping, Particle Image Velocimetry
INTRODUCTION
Fermentation, wastewater aeration, oxidation and hydrogenation represent only a small number of the complex
mixing processes where gas dispersion is employed in mechanically agitated tanks. Traditionally, gas dispersion
in agitated vessels is carried out using radial disc turbines, such as the Rushton turbine. With the aim of reducing
the weaknesses of disc turbines in gas-liquid applications, an increased interest in axial flow impellers for such
operations has evolved. Customarily, the axial impellers are used in the down-pumping mode and have provided
significant advantages over radial flow agitators (McFarlane and Nienow [1, 2]). Recently, the up-pumping
concept, which was first conceived in the early 1980s (Kuboi and Nienow [3]; Nienow et al. [4]), has been
shown to provide advantages over the down-pumping operation (Nienow [5, 6, 7]) especially for gas-liquid
applications. Since the mid-1990s, the investigation of up-pumping impellers aerated and non-aerated tanks has
primarily been focused on power characteristics and mixing times (McFarlane [8]; Hari-Prajitno et al. [9]; Hari-
Prajitno [10]).
The local investigation of velocity fields of two-phase flows in stirred tanks has been the subject of few
reported works (Patterson [11]; Mishra and Joshi [12]; Rousar and Van den Akker [13]; Deen and Hjertager
[14]; Ranade et al. [15]). Most of these use Laser Doppler Velocimetry (LDV) to study flows produced by
Rushton turbines. Particle Image Velocimetry (PIV) is a recent non-intrusive experimental technique used for the
study of instantaneous flow fields, both single phase and multiphase. Due to the inherent difficulties associated
with the highly 3-dimensional flow in stirred tanks, PIV has been used very little for the investigation of

- 3 -
hydrodynamics in such configurations. Lamberto et al. [16] used PIV results to validate Computational Fluid
Dynamics (CFD) simulations of the laminar flow in a tank stirred by a Rushton turbine. In the turbulent flow
regime, Sheng et al. [17] used PIV to determine the mean flow field and turbulence characteristics produced by a
down-pumping 4-bladed pitched blade turbine and compared these results with imposed boundary condition
CFD simulations. Meyers et al. [18] investigated flow instabilities induced by a down pumping 4-bladed pitched
blade turbine and a down-pumping HE-3 (Chemineer), and compared these instantaneous flow fields with time-
averaged data. Gas-liquid flows in agitated vessels provide additional complications with respect to data
acquisition and processing, and therefore published work in this area is very scarce. A gas-liquid study was
carried out by Deen and Hjertager [14] using PIV measurements. They compared single phase flow patterns
produced by a Rushton turbine with the liquid velocity fields in a two-phase system. Ranade et al. [15] also used
PIV to study the liquid flow field of an aerated stirred tank, concentrating on the effect of the gas flow rate on the
trailing vortices behind the blades of a Rushton turbine.
In this work, the hydrodynamics of the liquid phase in an aerated vessel stirred with a 6-blade pitched
blade turbine (PBT) have been investigated using PIV. A preliminary study has involved the determination of the
single phase flow fields in order to provide a reference point for the two phase study. For the two phase case, the
influence of the presence of gas on the mean liquid velocity field has been studied, as well as the effect of the
axial agitator configuration, i.e. down-pumping or up-pumping, on the turbulent liquid flow field. With respect
to the gas phase, the bubble distribution and global gas holdup have been assessed and discussed. In addition, the
effect of aeration on the pumping number has been evaluated for the different pumping configurations.
EXPERIMENTAL APPARATUS
PIV measurements of instantaneous radial and axial velocity components were performed in a dished-bottom
cylindrical vessel made of Perspex. An aspect ratio of 1 was used, i.e. the liquid height (H) in the vessel is equal
to the tank diameter (T), where T=0.19 m. The tank is equipped with four transparent baffles made of Perspex
(b=0.1T), which are placed 90º from one another, flush against the vessel wall. The impeller clearance is
C=0.33T, where C is defined as the distance from the vessel bottom to the lowest horizontal plane swept by the
impeller. The cylindrical vessel is placed inside a square tank whose front panel is transparent to allow
distortion-free measurements. This tank was filled with plain water in order to minimize refraction at the
cylindrical surface of the inner vessel. A 6-blade 45° pitched blade turbine operating in the down- and up
pumping modes was investigated. The impeller diameter was equal to D=0.5T and the agitator shaft (s=0.008 m)

- 4 -
extended to the bottom of the vessel where it fitted into a Teflon hub to avoid ‘wobbling’ of the impeller. The
rotational speed of the agitator was 300 rpm which is equivalent to a Reynolds number of 45000. Air was
sparged into the tank using a ring sparger with diameter Ds=0.8D at a position, Cs=0.6C. The gas is introduced
into the vessel at 0.5 vvm and an aeration number, NA, equal to 0.01, which corresponds to a complete dispersion
regime.
The PIV measurements were taken using a double pulsed Minilite Nd:YAG laser (Continuum) that has
a variable frequency between 1 and 15Hz, and a wavelength of 532nm (green). A black and white CCD camera
(Kodak) with a resolution of 1008 × 1018 pixels2 was used to record simultaneous images of the flow on a plane
midway between two baffles. A MasterBox links the lasers, camera and computer, and allows several operating
parameters to be optimized. The experimental set-up is shown in Figure 1. The liquid phase was seeded using
30µm hollow glass particles with fluorescent rhodamine (Dantec) implanted on the surface. These particles
diffuse light at a wavelength of 575nm which is greater than the wavelength of light diffused by the air bubbles,
550nm. A filter is fitted to the camera which enables only light with a wavelength greater than 550nm to be
captured. Images are acquired at 10Hz with an exposure time delay of 500µs and are not synchronized with the
passage of the impeller blade. These images are processed using a commercial software VISION+ V2ZIP (Lot
Oriel / Coria, France). Each image is divided up into interrogation areas of 64 × 64 pixels2 (8.6 × 8.6 mm2) with
50% overlap, and the cross-correlation function in each area is then calculated using fast Fourier transforms in
order to determine the corresponding spatially averaged displacement vector. The instantaneous velocity data
attained for a number of image pairs are used to determine the time-averaged radial-axial velocity fields. The
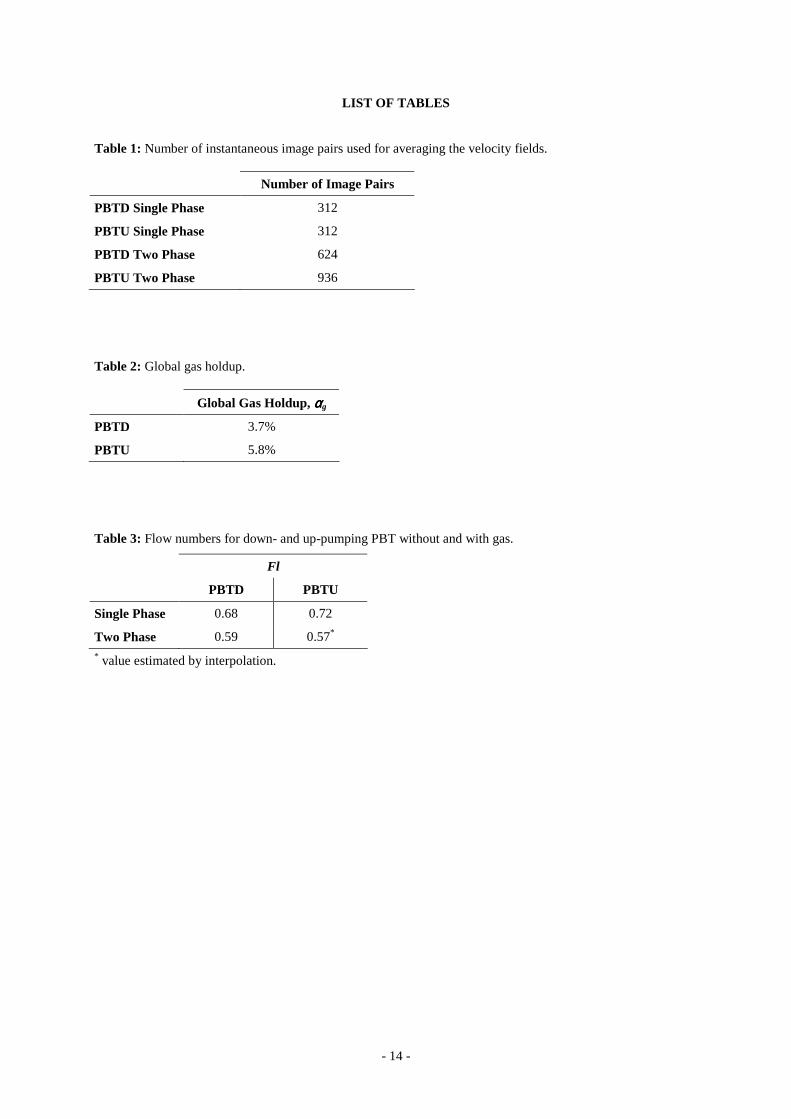
number of image pairs used to determine the mean fields for each case are summarized in Table 1. As spurious
data results when bubbles pass the interrogation area, two correction criteria have been applied whilst averaging
the instantaneous data. The first criterion assumes that all vectors with a signal to noise ratio (SNR) less than 2.0
are erroneous due to the gas phase and are therefore not taken into account in the calculation of the mean value.
The second criteria is applied for the two-phase studies only. If less than 15% of the vectors at a specific point
have a valid SNR (i.e. SNR > 2.0), then it is assumed that at that point, the gas phase is often present and a liquid
phase vector is not effectuated.
RESULTS AND DISCUSSION
Bubble Distribution and Gas Holdup
Figures 2 (a) and (b) are instantaneous photographic images of the aerated vessel stirred by the PBT in the down-
and up-pumping modes, respectively. In the down-pumping mode, the agitator disperses the bubbles throughout

- 5 -
the vessel with oscillations between hydrodynamic flow patterns, and some gas accumulation occurs behind the
impeller blades. These observations are comparable with gassed flow patterns described in previous studies
(Bujalski et al. [19]; McFarlane et al., [20]). In the up-pumping mode, the bubble distribution can be divided into
two parts. In the lower half of the tank, an extremely large number of bubbles are entrained in a lower circulation
loop, such that impeller is surrounded by the gas phase. It was noticed that even when the gas flow rate was
halted, a significant number of bubbles remained entrained in this loop for at least three minutes. In the upper
half of the vessel, the gas holdup appears to be less than in the lower half, however, and the bubbles are well
dispersed. Furthermore, the hydrodynamic fluctuations noted in the down-pumping case do not exist with the
PBTU, which agrees with the observations made in other reported works concerning up-pumping axial flow
impellers (Bujalski et al. [19]; Nienow [7, 21]).
The global gas holdup, αg, for the down- and up-pumping configurations was estimated by simple
observation of the liquid level without gassing, x, and with gassing, xg. The difference, x-xg, divided by the
liquid level without aeration, x, is the global gas holdup, αg (assuming a flat bottomed vessel). The values of αg
for the PBTD and PBTU are given in Table 2. In the up-pumping mode, the PBT entrains approximately 36%
more gas in the vessel than in the down-pumping configuration. These results correspond well with the visual
observations made, represented by Figure 2.
Effect of Aeration on Mean Liquid Velocity Fields
Vector plots of the mean velocity fields in the r-z plane at 45° to the baffle plane for the PBTD and PBTU
without and with aeration are shown in Figures 3 and 4, respectively. In the ungassed case, Figure 3 (a), the flow
pattern is typical for down-pumping pitched blade turbines (Ranade and Joshi [22]; Aubin et al. [23]). A primary
circulation loop exists in the lower part of the tank and extends up to almost three-quarters of the vessel. In the
upper quarter of the tank, the liquid velocities are low and circulation is poor. Just below the center of the
impeller a region of up-flowing liquid exists, which is evidence of a secondary recirculation loop. Due to the
dished bottom of the vessel, this entire secondary circulation loop could not be captured with the PIV. For the
aerated case, Figure 3 (b), the liquid velocity vectors show that the principal circulation loop is still present,
although its form is slightly smaller than that of the single phase case, extending up to only about two-thirds of
the vessel height. This ‘shortening’ of the circulation loop is due to the change in pressure around the impeller
upon gassing. The flat, inclined blade of the pitched blade turbine leads to the formation of a low pressure
trailing vortex at the rear of the blade (Warmoeskerken et al. [24]). Upon aeration, gas is concentrated in these

- 6 -
low pressure regions forming gas cavities. The presence of these low pressure zones may cause the liquid to be
drawn in by the vertical side of the impeller as well as the top, which in turn may decrease the flow path of the
circulation loop. This also results in the displacement of the circulation center towards the vessel base. In the
upper third of the vessel, the velocities are smaller than for the single phase system which suggests that the flow
in this region is controlled not only by the impeller but also by the gas phase. In the outflow of the impeller, the
fluid is discharged strongly at about 30° from the vertical, which is different from the single phase case where
the fluid jet is at about 45° from the vertical. As a result, the conical up-flow region is significantly smaller in the
case of the two phase flow. This phenomenon could be due to the build up of gas behind the impeller blades and
consequent change in the pressure field.
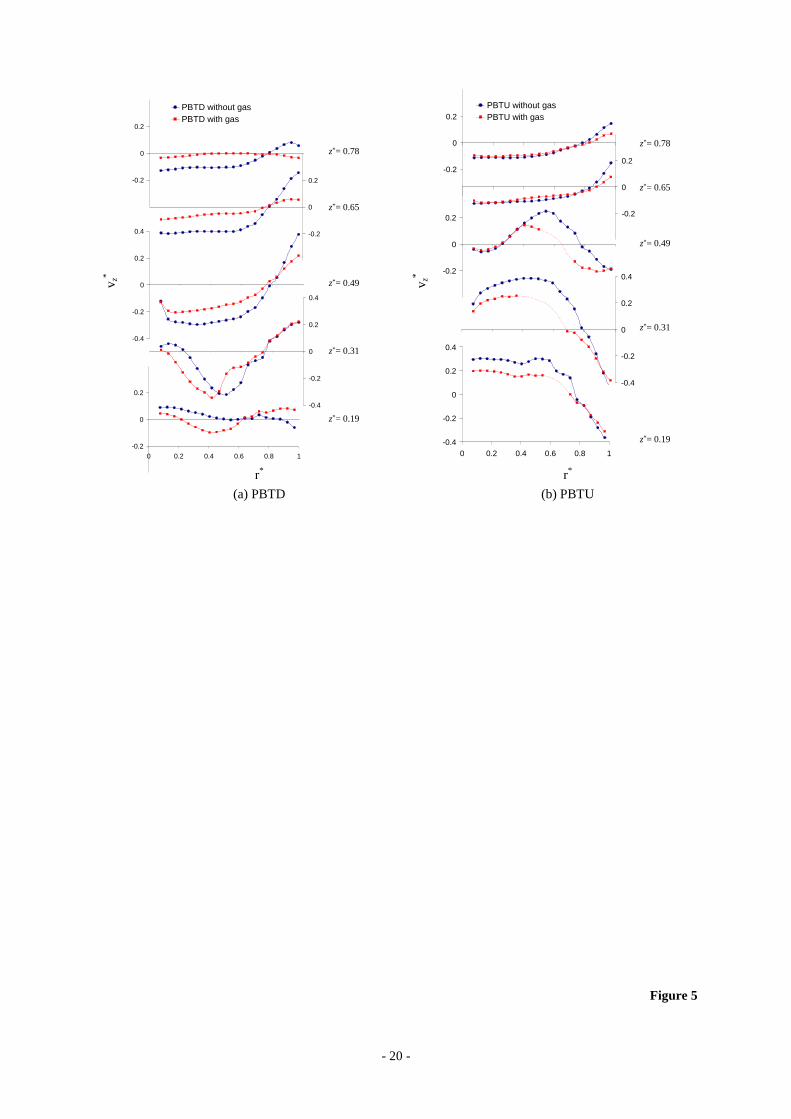
In a more quantitative manner, radial profiles of the axial velocity for the PBTD at several vertical
positions in the vessel are shown in Figure 5 (a). Just above the gas sparger, in the lower part of the tank
(z*=0.19), the axial velocity is greater for the aerated case than for without gassing. This may be due to the
upward rising flow of bubbles from the sparger that consequently entrain nearby liquid. In the impeller discharge
region at z*=0.31, the magnitude of the axial velocity for both the gassed and ungassed case are very similar.
Above the impeller, however, at positions z*=0.49, 0.65 and 0.78, the presence of gas causes a significant
decrease in the axial velocity. This suggests that the liquid flow in the upper part of the vessel is controlled not
only by the impeller but also by the gas phase. Similar results of liquid velocity profiles produced by a Rushton
turbine in a two phase system have been reported by Deen and Hjertager [14] and Ranade et al. [15].
The mean vector plots for the up-pumping PBT without and with gassing are presented in Figure 4.
The single phase flow produced by the PBTU, Figure 4 (a), results in two distinct circulation loops, in the lower
and upper parts of the vessel, and a well defined cone-shaped region of down-flowing liquid just above the
impeller. These results agree well with previous studies on up-pumping pitched blade turbines and hydrofoil
impellers using LDV (Aubin et al. [23]; Meyers and Bakker [25]; Mishra et al. [26]). The liquid phase velocity
vectors for the two-phase case, Figure 4 (b), show that the lower circulation loop is conserved in the presence of
gas. The liquid is drawn in by the underside of the PBT at an angle towards the impeller shaft and is then
projected at approximately 45° towards the vessel wall by the upper side of the impeller. The liquid moves down
the vessel wall towards the bottom, where it is taken up by the impeller once again, forming the first circulation
loop. As for the single phase case, down-flowing liquid is present in the center of the upper plane of the impeller.
In the region around the agitator tip, many liquid velocity vectors are not present, which indicates high local gas

- 7 -
holdup according to the criteria used during the post-processing in this work. These results agree well with the
observations of gas dispersion shown in the photographic image in Figure 2.
In the upper half of the vessel, the flow patterns for the single and two phase flows are rather different.
In the presence of gas, the strong down-flowing velocities coming from the center of the vessel are apparent.
This flow joins the impeller jet and is projected towards the tank wall. Most of the liquid then follows the
movement of the circulation loop, however, some liquid is deflected and moves up the vessel wall, forming a
secondary circulation loop. This second loop is much less well-defined in the two-phase case and it appears that
conservation of mass is not satisfied, suggesting that the flow rate and patterns may be dependent on the position
of the baffles and /or the tangential velocity component is non-negligible. It would be therefore interesting to
compare these results with measurements taken in the baffle plane. Unfortunately, the latter is not currently
possible due to the existing experimental setup.
Figure 5 (b) shows the radial profiles of the axial velocity for a range of heights in the tank stirred by
the PBTU. Below the impeller, at z*=0.19 and 0.31, and in the discharge region at z*=0.49, the presence of gas
causes a decrease in the axial velocity of about 30%. In the upper part of the vessel, however, closer to the liquid
surface, the effect of gassing on the liquid flow is negligible. This indicates that the impeller is still controlling
the liquid flow even in the presence of gas which suggests that the flow of gas bubbles is dominated by the liquid
flow pattern and are entrained in the tank by the second circulation loop.
Effect of Aeration on Turbulence
Contour diagrams of rms velocities and turbulent kinetic energy for the PBTD and PBTU are shown in Figures 6
and 7, respectively. Without aeration, the maximum velocity fluctuations for the PBTD are found in the impeller
discharge (0.12Vtip for the axial component and 0.15Vtip for the radial component). Above the impeller, rms
velocities range from 0.06Vtip to 0.1Vtip and the distributions for the two components are different. These results
suggest that the flow is generally anisotropic in the impeller discharge and also in the bulk of the tank. Upon
gassing, the maximum rms are found in the impeller discharge but vary in magnitude for the two components
(0.12Vtip for the axial component and 0.17Vtip for the radial component) which shows anisotropy. In the upper
part of the tank, however, the rms velocities are generally not greater than 0.04Vtip and the flow field tends
towards isotropy. Comparing the turbulent kinetic energy distributions, Figures 6 (a-iii) and (b-iii), shows that
the maximum value is found in the impeller discharge for both cases. Without aeration, relatively high k* is
found in the region of the primary circulation loop and into the upper part of the vessel. Upon gassing, however,

- 8 -
the energy in this upper region is damped, with values close to zero. It is important to point out that the
maximum k* found in the impeller discharge is equivalent (with a value of 0.028Vtip2), whether gas is present or
not. Bubble break-up occurs through bubble interactions with turbulent eddies that have sufficient turbulent
kinetic energy (Hinze [27]). These results therefore suggest that the impeller’s performance for the production of
turbulent kinetic energy is not decreased with the addition of gas and will therefore favor bubble break-up.
Radial profiles of k* at different heights in the vessel for the PBTD are shown in Figure 8 (a). Below the
impeller, the magnitudes of k* are similar whether gas is present or not. Above the impeller, however, it can be
seen that upon gassing k* is decreased by more than 50%.
In the up-pumping mode without aeration, the highest rms velocities (0.11Vtip for the axial component
and 0.13Vtip for the radial component) are found in the impeller discharge and the bottom half of the tank,
corresponding to the lower circulation loop. In the upper part of the tank, the velocity fluctuations are generally
low, not greater than 0.04Vtip. In comparison with the single phase rms velocity fields of the PBTD, the
turbulence produced by the PBTU has an overall more isotropic nature. The addition of gas does not decrease the
maximum values of the fluctuations but the spatial distribution of these high fluctuations is reduced. Above the
impeller, however, the presence of gas slightly increases the rms velocities. Overall, for the aerated case, the
flow field tends to be slightly more anisotropic than without aeration. Maximum turbulent kinetic energy is
located in the impeller discharge with values of 0.020Vtip2 without gas and 0.022Vtip
2 with gas, and relatively
high values are found in the region of the lower circulation loop, although the spatial distribution is decreased
upon gassing. Even though the maximum values are approximately 30% smaller than the down-pumping results,
the addition of gas increases k* which favors bubble break-up. In both cases, the turbulent kinetic energy is close
to zero in the upper part of the tank (corresponding to the upper circulation loop) which suggests that minimal
bubble break-up will occur in the region.
In a more quantitative manner, the radial profiles of k* are presented in Figure 8 (b). As for the PBTD,
the magnitudes of k* in the impeller discharge are similar. In the lower part of the tank, however, the presence of
gas decreases the k* by approximately 50%. Like for the axial velocities produced by the PBTU, there appears to
be no effect of aeration on the turbulent kinetic energy in the upper part of the tank at z*=0.65 and z*=0.78.
Flow Number
Table 3 presents the flow numbers for the down- and up-pumping PBT in a non-aerated and aerated tank.
Comparison of the single phase results shows that the Fl for the down- and up-pumping modes are quite similar,

- 9 -
having a value of about 0.7. These values are also similar to those found using LDV (Aubin et al. [23]). For the
down-pumping case with gassing, Fl is approximately 20% less than the Fl without gas. This decrease in
pumping capacity is due to the accumulation of gas in the low pressure regions behind the impeller blades. For
the up-pumping PBT, the value of the gassed Fl is again about 20% lower than the single phase case. It should
be noted, however, that this value was estimated by interpolation of the radial profile of axial velocity at the
impeller discharge because due to high local gas holdup some measurement points were not obtained. Up-
pumping pitched blade turbines have been found to handle more gas before flooding occurs and less pumping
capacity is lost than in the down-pumping mode (Bujalski et al. [19]). Hence, it would be expected that the
gassed Fl value for the PBTU would be greater than for the PBTD. Therefore, the value given here is perhaps
underestimated due interpolation.
CONCLUSIONS
PIV measurements have been carried out in an aerated vessel stirred by a 6-bladed PBT operating in the down-
and up-pumping mode. Mean velocity vector fields and turbulent fields of the liquid phase have shown the effect
of gassing on the liquid and have been compared with single phase results. Instantaneous photographs have
enabled the bubble distribution of the up- and down-pumping PBT to be assessed.
In the down-pumping mode, the presence of gas causes a shortening of the primary circulation loop and
the flow in the upper part of the vessel no longer appears to be controlled by the liquid phase. Furthermore, the
liquid jet is projected with a stronger axial component and the cone-shaped up-flow region is consequently
reduced. In the up-pumping mode, a strong primary circulation loop is well defined and entrains a large amount
of gas in the impeller region. A second circulation loop also exists in the upper part of the tank but is not so well
defined as in single phase flow. Relatively strong downward velocities are present in the upper center of the
vessel which join the lower circulation loop. Furthermore, the 2D flow appears not to satisfy conservation of
mass, which suggests that the flow may be dependent on the position relative to the baffle. Quantitatively, the
presence of the gas has been shown to decrease liquid velocities, which agrees well with previous gas-liquid
mixing studies.
In general, for both the up- and down-pumping cases, turbulent kinetic energy is similar in the impeller
discharge, whether gas is present or not. This suggests that the ability of the impeller to provide turbulent energy
does not decrease in the presence of gas and that bubble break-up may be favored. In the bulk of the tank,

- 10 -
however, the turbulent kinetic energy is decreased upon aeration which suggests that minimal break-up will
occur.
Instantaneous photographs of the PBTD- and PBTU-stirred tanks have shown that the gas holdup is
concentrated in the impeller region for the PBTU with good dispersion in the upper part of the vessel, whereas
the PBTD entrains less gas and disperses it throughout the tank. The global gas holdup has been determined for
both configurations and the PBTU has shown to entrain approximately 36% more gas than the PBTD. This
suggests an improved process performance and /or efficiency with up-pumping axial flow impellers.
This work has concentrated on a local study of the liquid phase hydrodynamics which could be
complemented by further studies which aim to characterize the gas phase in a local manner. It would be
interesting to undertake mass transfer studies for the determination of the mass transfer coefficient, kL a, and also
to investigate the effect of bubble size on the hydrodynamics, in order to further assess the performance of up-
pumping impellers in agitated tanks. Nevertheless, the detailed results on the liquid phase can be used to start the
validation of two phase CFD simulations in stirred tanks.
NOTATION
b baffle width (m)
C impeller clearance (m)
Cs sparger clearance (m)
D impeller diameter (m)
Ds sparger diameter (m)
αg global gas holdup (-)
Fl flow number (QFl/ND3)
k turbulent kinetic energy (m2s-1)
k* turbulent kinetic energy (m2s-1)
kLa volumetric mass transfer coefficient (s-1)
H liquid height (m)
N impeller rotational speed (rev.s-1)
NA aeration number (Qg/ND3)
QFl impeller pumping rate (m3s-1)
Qg gas sparging rate (m3s-1)
- 11 -
s shaft diameter (m)
T tank diameter (m)
vr, vz velocity components (ms-1)
v′r, v′z rms velocity components (ms-1)
Vtip impeller tip speed (ms-1)
x liquid level without gas (m)
xg liquid level with gas (m)
REFERENCES
1. C.M. McFarlane and A.W. Nienow, ‘Studies of High Solidity Ratio Hydrofoil Impellers for Aerated
Bioreactors. 1. Review’, Biotechnol. Prog., 11, (1995), 601-607.
2. C.M. McFarlane and A.W. Nienow, ‘Studies of High Solidity Ratio Hydrofoil Impellers for Aerated
Bioreactors. 4. Comparison of Impeller Types’, Biotechnol. Prog., 12, (1996), 9-15.
3. R. Kuboi and A.W. Nienow, ‘The Power Drawn by Dual Impeller Systems Under Gassed and Ungassed
Conditions’, Paper G2, 4th European Conference on Mixing, Leeuwenhorst, BHRA Fluid Engineering U.K.,
(1982), 247-261.
4. A.W. Nienow, R. Kuboi, C.M. Chapman. and K. Allsford, ‘The Dispersion of Gases into Liquids by Mixed
Flow Impellers’, Paper K1, International Conference on the Physical Modelling of Multi-Phase Flow,
Coventry, BHRA Fluid Engineering, U.K., (1983), 417-437.
5. A.W. Nienow, ‘Gas Dispersion Performance in Fermenter Operation’, Chem. Eng. Prog., 85, 2, (1990a), 61-
71.
6. A.W. Nienow, ‘Agitators for mycelial fermentations’, TIBTECH, 8, (1990b), 224-233.
7. A.W. Nienow, ‘Gas-Liquid Mixing Studies : A Comparison of Rushton Turbines with Some Modern
Impellers’, Trans IChemE, 74 A, (1996), 417-423.
8. C.M. McFarlane, Gas-Liquid Mixing Studies on Hydrofoil Impellers, PhD Thesis, The University of
Birmingham, U.K., (1991).
9. D. Hari-Prajitno, V.P. Mishra, K. Takenaka, W. Buljalski, A.W. Nienow and J. McKemmie, ‘Gas-Liquid
Mixing Studies with Multiple Up- and Down-Pumping Hydrofoil Impellers : Power Characteristcs and
Mixing Time’, Can. J. Chem. Eng., 76, (1998), 1056-1068.

- 12 -
10. D. Hari-Prajitno, An Experimental Study of Unaerated and Aerated Single, Dual and Triple Hydrofoil
Impellers, PhD Thesis, The University of Birmingham, U.K., (1999).
11. G.K. Patterson, ‘Measurements and Modelling of Flow in Gas Sparged, Agitated Vessels’, Proceedings of
7th European Conference on Mixing, Brugges, Belgium, (1991), 209-214.
12. V.P. Mishra and J.B. Joshi, ‘LDA Measuremensts of Flow in Stirred Gas-Liquid Reactors’, Proceedings of
7th European Conference on Mixing, Brugges, Belgium, (1991), 217-224.
13. I. Rousar and H.E.A. Van den Akker, ‘LDA Measurements of Liquid Velocities in Sparged Agitated Tanks
with Single and Multiple Rushton Turbines’, Proceedings of 8th European Conference on Mixing, IChemE,
Rugby, U.K, (1994), 89-96.
14. N.G. Deen and B.H. Hjertager, ‘Multiphase Particle Image Velocimetry Measurements in an Aerated Stirred
Tank’, 1999 Annual Meeting of the American Institute of Chemical Engineers, Dallas, TX, Oct. 31- Nov. 5,
(1999), Unpublished.
15. V.V. Ranade, M. Perrard, C. Xuereb, N. Le Sauze and J. Bertrand, ‘Influence of Gas Flow Rate on Structure
of Trailing Vortices of Rushton Turbine : PIV Measurements and CFD Simulations’, Proceedings of 4th
International Symposium on Mixing in Industrial Processes, Toulouse, France, 14-16 May, (2001).
16. D.J. Lamberto, M.M. Alvarez and F.J. Muzzio, ‘Experimental and Computational Investigation of the
Laminar Flow Structure in a Stirred Tank’, Chem. Eng. Sci., 54, (1999), 919-942.
17. J. Sheng, H. Meng and R.O. Fox, ‘Validation of CFD Simulations of a Stirred Tank Using Particle Image
Velocimetry Data’, Can. J. Chem. Eng., 76, (1998), 611-625.
18. K.J. Meyers, R.W. Ward and A. Bakker, ‘A Digital Particle Image Velocimetry Investigation of Flow Field
Instabilities of Axial Flow Impellers’, J. Fluids Eng., 119, (1997), 623-632.
19. W. Bujalski, M. Konno and A.W. Nienow, ‘Scale-up of 45º Pitch Blade Agitators for Gas Dispersion and
Solid Suspension’, Proceedings of the 6th European Conference on Mixing, Pavia, Italy, BHRA Fluid
Engineering Centre, Cranfield, UK, (1988), 389-398.
20. C.M. McFarlane, X-M. Zhao, and A.W. Nienow, ‘Studies of High Solidity Ratio Hydrofoil Impellers for
Aerated Bioreactors. 2. Air-Water Studies’, Biotechnol. Prog., 11, (1995), 608-618.
21. A.W. Nienow, ‘The Versatility of Up-Pumping, Wide-Blade Hydrofoil Agitators’, Proceedings of the 3rd
International Symposium on Mixing in Industrial Processes (ISMIP3), Osaka, Japan, (1999), 173-180.
22. V.V. Ranade and J.B. Joshi, ‘Flow Generated by Pitched Blade Turbines I : Measurements Using Laser
Doppler Anemometer’, Chem. Eng. Comm., 81, (1989), 197-224.

- 13 -
23. J. Aubin, P. Mavros, D.F. Fletcher, C. Xuereb and J. Bertrand, ‘Effect of Axial Agitator Configuration (Up-
Pumping, Down-Pumping, Reverse Rotation) on Flow Patters Generated in Stirred Vessels’, Trans IChemE,
79 A, (2001), 845-856.
24. M.M. Warmoeskerken, J. Speur and J.M. Smith, ‘Gas-Liquid Dispersion with Pitched Blade Turbines’,
Chem. Eng. Commun., 25, (1984), 11-29.
25. K.J. Meyers and A. Bakker, ‘Solids Suspension with Up-Pumping Pitched Blade and High-Efficiency
Impellers’, Can. J. Chem. Eng., 76, (1998), 433-440.
26. V.P. Mishra, K.N. Dyster, Z. Jaworski, A.W. Nienow and J. McKemmie, ‘A Study of an Up- and a Down-
Pumping Wide Blade Hydrofoil Impeller : Part I. LDA Measurements’, Can. J. Chem. Eng., 76, (1998),
577-588.
27. J.O. Hinze, ‘Fundamentals of the Hydrodynamic Mechanism on Splitting in Dispersion Processes’, AIChE
J., 1, (1955), 289.
- 14 -
LIST OF TABLES
Table 1: Number of instantaneous image pairs used for averaging the velocity fields.
Number of Image Pairs
PBTD Single Phase 312
PBTU Single Phase 312
PBTD Two Phase 624
PBTU Two Phase 936
Table 2: Global gas holdup.
Global Gas Holdup, ααααg
PBTD 3.7%
PBTU 5.8%
Table 3: Flow numbers for down- and up-pumping PBT without and with gas.
Fl
PBTD PBTU
Single Phase 0.68 0.72
Two Phase 0.59 0.57*
* value estimated by interpolation.

- 15 -
LIST OF FIGURES
Figure 1: Experimental set-up. (1) double pulsed Nd:Yag laser source; (2) optics; (3) lens; (4) laser sheet; (5)
Masterbox; (6) computer; (7) CDD camera.
Figure 2: Images of gas-liquid flow in the vessel stirred with a (a) PBTD and (b) PBTU.
Figure 3: Mean radial-axial vector plots for the PBTD without and with aeration.
Figure 4: Mean radial-axial vector plots for the PBTU without and with aeration.
Figure 5: Radial profiles of dimensionless axial velocity at different height in the vessel.
Figure 6: Contour maps of rms velocities and dimensionless turbulent kinetic energy for the PBTD (a) without
aeration and (b) with aeration.
Figure 7: Contour maps of rms velocities and dimensionless turbulent kinetic energy for the PBTU (a) without
aeration and (b) with aeration.
Figure 8: Radial profiles of dimensionless turbulent kinetic energy at different height in the vessel: (a) PBTD;
(b) PBTU.

- 16 -
IBM PS/2
2
6
1 1
3
4
57
Figure 1

- 17 -
(a) PBTD with gas (b) PBTU with gas
Figure 2

- 18 -
0.25 Vtip
0.25 Vtip
(a) PBTD without gas (b) PBTD with gas
Figure 3

- 19 -
0.25 Vtip 0.25 Vtip
(a) PBTU without gas (b) PBTU with gas
Figure 4
- 20 -
v z*
-0.2
0
0.2
0 0.2 0.4 0.6 0.8 1
-0.4
-0.2
0
0.2
0.4
0 0.2 0.4 0.6 0.8 1
-0.4
-0.2
0
0.2
0.4
0 0.2 0.4 0.6 0.8 1
-0.2
0
0.2
0 0.2 0.4 0.6 0.8 1
-0.2
0
0.2
0 0.2 0.4 0.6 0.8 1
z*= 0.78
z*= 0.65
z*= 0.49
z*= 0.31
z*= 0.19
PBTD without gasPBTD with gas
v z*
-0.4
-0.2
0
0.2
0.4
0 0.2 0.4 0.6 0.8 1
-0.4
-0.2
0
0.2
0.4-0.2
0
0.2 -0.2
0
0.2-0.2
0
0.2
z*= 0.78
z*= 0.65
z*= 0.49
z*= 0.31
z*= 0.19
PBTU without gasPBTU with gas
r* r*
(a) PBTD (b) PBTU
Figure 5

- 21 -
Wit
hout
aer
atio
n 0.20.180.160.140.120.10.080.060.040.020
0.20.180.160.140.120.10.080.060.040.020
0.0250.02250.020.01750.0150.01250.010.00750.0050.00250
(a-i) vz'/Vtip (a-ii) vr'/Vtip (a-iii) k*
Wit
h ae
rati
on
0.20.180.160.140.120.10.080.060.040.020
0.20.180.160.140.120.10.080.060.040.020
0.0250.0220.020.0170.0150.0120.010.0070.0050.0020
(b-i) vz'/Vtip (b-ii) vr'/Vtip (b-iii) k*
Figure 6

- 22 -
Wit
hout
aer
atio
n 0.20.180.160.140.120.10.080.060.040.020
0.20.180.160.140.120.10.080.060.040.020
0.0250.0220.020.0170.0150.0120.010.0070.0050.0020
(a-i) vz'/Vtip (a-ii) vr'/Vtip (a-iii) k*
Wit
h ae
rati
on
0.20.180.160.140.120.10.080.060.040.020
0.20.180.160.140.120.10.080.060.040.020
0.0250.0220.020.0170.0150.0120.010.0070.0050.0020
(b-i) vz'/Vtip (b-ii) vr'/Vtip (b-iii) k*
Figure 7

- 23 -
v z*
0
0.015
0 0.2 0.4 0.6 0.8 1
0
0.015
0.03
0 0.2 0.4 0.6 0.8 1
0
0.015
0 0.2 0.4 0.6 0.8 1
0
0.015
0 0.2 0.4 0.6 0.8 1
0
0.015
0 0.2 0.4 0.6 0.8 1
z*= 0.78
z*= 0.65
z*= 0.49
z*= 0.31
z*= 0.19
PBTD without gasPBTD with gas
v z*
0
0.015
0 0.2 0.4 0.6 0.8 1
0
0.015
0 0.2 0.4 0.6 0.8 1
0
0.015
0 0.2 0.4 0.6 0.8 1
0
0.015
0 0.2 0.4 0.6 0.8 1
0
0.015
0 0.2 0.4 0.6 0.8 1
z*= 0.78
z*= 0.65
z*= 0.49
z*= 0.31
z*= 0.19
PBTU without gasPBTU with gas
r* r*
(a) PBTD (b) PBTU
Figure 8


![PIV MEASUREMENTS IN TWIN SYNTHETIC JETS · PIV MEASUREMENTS IN TWIN SYNTHETIC JETS C. S. GRECO c, A. IANIRO, M ... [16], Chaudhari et al. [17] and Arik [18] worked on synthetic jets](https://img.dokumen.tips/doc/110x75/5f0763487e708231d41cbbfa/piv-measurements-in-twin-synthetic-piv-measurements-in-twin-synthetic-jets-c-s.jpg)