Embed Size (px)
Citation preview

DAVID TEMPERLEY AND ELIZABETH WEST MARVIN
Eastman School of Music of the University of Rochester
THIS STUDY EXAMINES THE DISTRIBUTIONAL VIEW OF
key-finding, which holds that listeners identify key bymonitoring the distribution of pitch-classes in a pieceand comparing this to an ideal distribution for each key.In our experiment, participants judged the key ofmelodies generated randomly from pitch-class distri-butions characteristic of tonal music. Slightly morethan half of listeners’ judgments matched the generat-ing keys, on both the untimed and the timed condi-tions. While this performance is much better thanchance, it also indicates that the distributional view isfar from a complete explanation of human key identifi-cation. No difference was found between participantswith regard to absolute pitch ability, either in the speedor accuracy of their key judgments. Several key-findingmodels were tested on the melodies to see which yieldedthe best match to participants’ responses.
Received October 4, 2006, accepted September 4, 2007.
Key words: key, key perception, probabilistic models,absolute pitch, music psychology
HOW DO LISTENERS IDENTIFY THE KEY OF A PIECE
as they hear it? This is surely one of the mostimportant questions in the field of music per-
ception. In tonal music, the key of a piece governs ourinterpretation of pitches and chords; our understand-ing of a note and its relations with other notes will bevery different depending on whether it is interpreted asthe tonic note (scale degree 1), the leading-tone (scaledegree 7), or some other scale degree. Experimentalwork has shown that listeners’ perception of key affectsother aspects of musical processing and experience aswell. Key context affects the memory and recognition ofmelodies (Cuddy, Cohen, & Mewhort, 1981; Cuddy,Cohen, & Miller, 1979; Marvin, 1997), conditions ourexpectations for future events (Cuddy & Lunney, 1995;Schmuckler, 1989), and affects the speed and accuracy
with which notes can be processed (Bharucha &Stoeckig, 1986; Janata & Reisberg, 1988). For all of thesereasons, the means whereby listeners identify the key ofa piece is an issue of great interest.
Several ideas have been proposed to explain how lis-teners might identify key. One especially influentialview of key-finding is what might be called the distribu-tional view. According to this view, the perception ofkey depends on the distribution of pitch-classes in thepiece. Listeners possess a cognitive template that rep-resents the ideal pitch-class distribution for eachmajor and minor key; they compare these templateswith the actual pitch-class distribution in the pieceand choose the key whose ideal distribution best matchesthat of the piece. While this idea has had numerousadvocates, the distributional approach to key perceptionhas had many critics as well. Some musicians and musictheorists (in our experience) find the distributionalview implausible, because it seems so unmusical and“statistical,” and ignores all kinds of musical knowledgethat we know to be important—knowledge about con-ventional melodic patterns, cadential gestures, impliedharmonies, large-scale melodic shape, and so on. Criticsof the distributional approach have argued that keyperception depends crucially on pitch ordering and onthe intervallic and scale-degree patterns that pitchesform. We might call this general view of key-findingthe structural view, as it claims a role for musical struc-ture in key perception beyond the mere distribution ofpitch-classes.
How can we test whether listeners use a distributionalapproach or a structural approach to key identification?In real music, both distributional and structural cuesare present: the key may be identifiable by distribu-tional means, but no doubt there are also structuralcues that could be used to determine the key. Thus realmusic can tell us little about which strategy listeners areusing. To answer this question, we would need to testlisteners’ key perceptions in musical stimuli designed tomatch the pitch-class distributions of each key butwithout any structural cues, or conversely, in stimulithat feature structural cues suggestive of a particularkey but lacking the appropriate pitch-class distribution
PITCH-CLASS DISTRIBUTION AND THE IDENTIFICATION OF KEY
Music Perception VOLUME 25, ISSUE 3, PP. 193–212, ISSN 0730-7829, ELECTRONIC ISSN 1533-8312 © 2008 BY THE REGENTS OF THE UNIVERSITY OF CALIFORNIA. ALL
RIGHTS RESERVED. PLEASE DIRECT ALL REQUESTS FOR PERMISSION TO PHOTOCOPY OR REPRODUCE ARTICLE CONTENT THROUGH THE UNIVERSITY OF CALIFORNIA PRESS’S
RIGHTS AND PERMISSIONS WEBSITE, HTTP://WWW.UCPRESSJOURNALS.COM/REPRINTINFO.ASP. DOI:10.1525/MP.2008.25.3.193
Pitch-Class Distribution and Key Identification 193
Music2503_02 1/9/08 2:24 PM Page 193
for that key. In the current study, we take the formerapproach: we examine listeners’ perception of key inmelodies generated randomly from pitch-class distri-butions drawn from a classical music corpus. Since thekeys of such melodies are (presumably) not reliablyindicated by structural cues, a high rate of success inkey identification will suggest that listeners are using adistributional approach.
Previous Studies of Key Identification
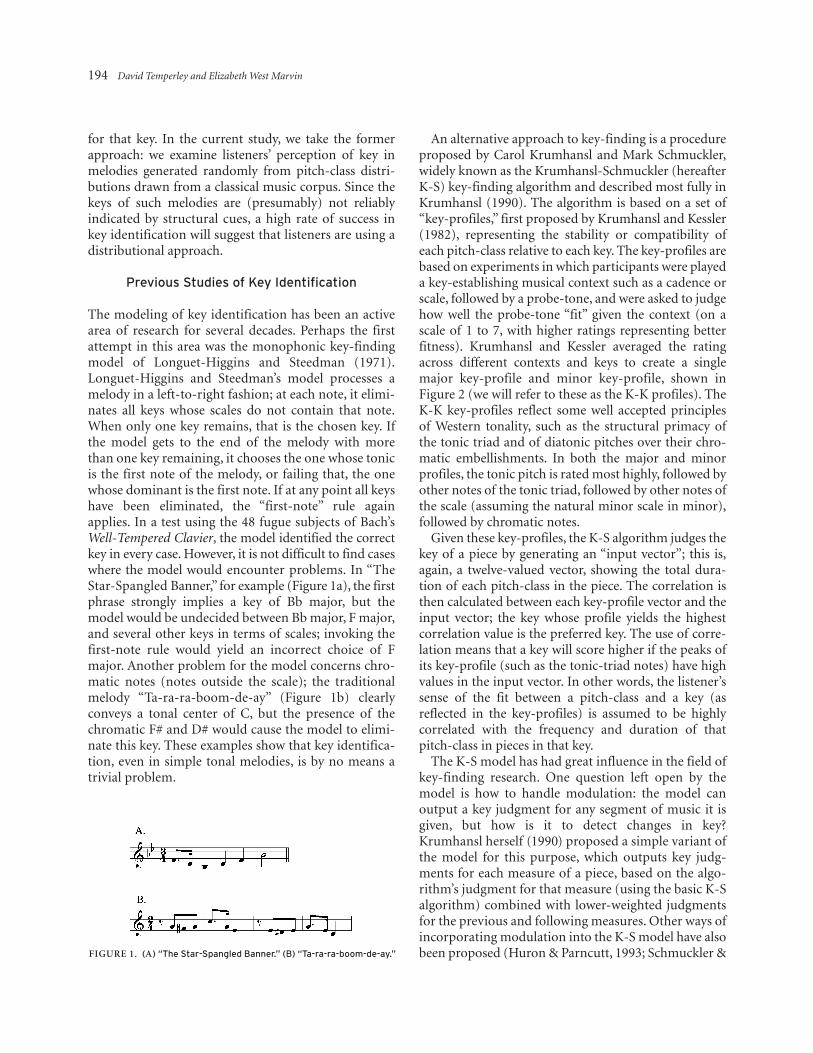
The modeling of key identification has been an activearea of research for several decades. Perhaps the firstattempt in this area was the monophonic key-findingmodel of Longuet-Higgins and Steedman (1971).Longuet-Higgins and Steedman’s model processes amelody in a left-to-right fashion; at each note, it elimi-nates all keys whose scales do not contain that note.When only one key remains, that is the chosen key. Ifthe model gets to the end of the melody with morethan one key remaining, it chooses the one whose tonicis the first note of the melody, or failing that, the onewhose dominant is the first note. If at any point all keyshave been eliminated, the “first-note” rule againapplies. In a test using the 48 fugue subjects of Bach’sWell-Tempered Clavier, the model identified the correctkey in every case. However, it is not difficult to find caseswhere the model would encounter problems. In “TheStar-Spangled Banner,” for example (Figure 1a), the firstphrase strongly implies a key of Bb major, but themodel would be undecided between Bb major, F major,and several other keys in terms of scales; invoking thefirst-note rule would yield an incorrect choice of Fmajor. Another problem for the model concerns chro-matic notes (notes outside the scale); the traditionalmelody “Ta-ra-ra-boom-de-ay” (Figure 1b) clearlyconveys a tonal center of C, but the presence of thechromatic F# and D# would cause the model to elimi-nate this key. These examples show that key identifica-tion, even in simple tonal melodies, is by no means atrivial problem.
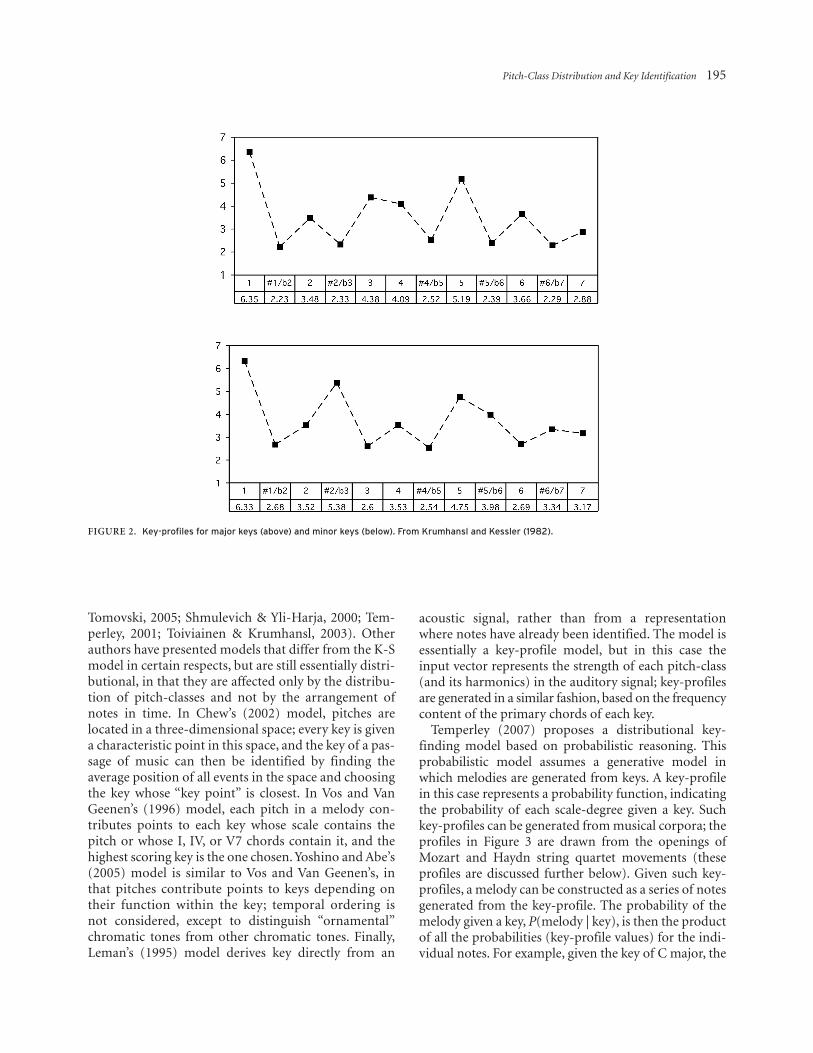
An alternative approach to key-finding is a procedureproposed by Carol Krumhansl and Mark Schmuckler,widely known as the Krumhansl-Schmuckler (hereafterK-S) key-finding algorithm and described most fully inKrumhansl (1990). The algorithm is based on a set of“key-profiles,” first proposed by Krumhansl and Kessler(1982), representing the stability or compatibility ofeach pitch-class relative to each key. The key-profiles arebased on experiments in which participants were playeda key-establishing musical context such as a cadence orscale, followed by a probe-tone, and were asked to judgehow well the probe-tone “fit” given the context (on ascale of 1 to 7, with higher ratings representing betterfitness). Krumhansl and Kessler averaged the ratingacross different contexts and keys to create a singlemajor key-profile and minor key-profile, shown inFigure 2 (we will refer to these as the K-K profiles). TheK-K key-profiles reflect some well accepted principlesof Western tonality, such as the structural primacy ofthe tonic triad and of diatonic pitches over their chro-matic embellishments. In both the major and minorprofiles, the tonic pitch is rated most highly, followed byother notes of the tonic triad, followed by other notes ofthe scale (assuming the natural minor scale in minor),followed by chromatic notes.
Given these key-profiles, the K-S algorithm judges thekey of a piece by generating an “input vector”; this is,again, a twelve-valued vector, showing the total dura-tion of each pitch-class in the piece. The correlation isthen calculated between each key-profile vector and theinput vector; the key whose profile yields the highestcorrelation value is the preferred key. The use of corre-lation means that a key will score higher if the peaks ofits key-profile (such as the tonic-triad notes) have highvalues in the input vector. In other words, the listener’ssense of the fit between a pitch-class and a key (asreflected in the key-profiles) is assumed to be highlycorrelated with the frequency and duration of thatpitch-class in pieces in that key.
The K-S model has had great influence in the field ofkey-finding research. One question left open by themodel is how to handle modulation: the model canoutput a key judgment for any segment of music it isgiven, but how is it to detect changes in key?Krumhansl herself (1990) proposed a simple variant ofthe model for this purpose, which outputs key judg-ments for each measure of a piece, based on the algo-rithm’s judgment for that measure (using the basic K-Salgorithm) combined with lower-weighted judgmentsfor the previous and following measures. Other ways ofincorporating modulation into the K-S model have alsobeen proposed (Huron & Parncutt, 1993; Schmuckler &
194 David Temperley and Elizabeth West Marvin
FIGURE 1. (A) “The Star-Spangled Banner.” (B) “Ta-ra-ra-boom-de-ay.”
Music2503_02 1/9/08 2:24 PM Page 194
Tomovski, 2005; Shmulevich & Yli-Harja, 2000; Tem-perley, 2001; Toiviainen & Krumhansl, 2003). Otherauthors have presented models that differ from the K-Smodel in certain respects, but are still essentially distri-butional, in that they are affected only by the distribu-tion of pitch-classes and not by the arrangement ofnotes in time. In Chew’s (2002) model, pitches arelocated in a three-dimensional space; every key is givena characteristic point in this space, and the key of a pas-sage of music can then be identified by finding theaverage position of all events in the space and choosingthe key whose “key point” is closest. In Vos and VanGeenen’s (1996) model, each pitch in a melody con-tributes points to each key whose scale contains thepitch or whose I, IV, or V7 chords contain it, and thehighest scoring key is the one chosen. Yoshino and Abe’s(2005) model is similar to Vos and Van Geenen’s, inthat pitches contribute points to keys depending ontheir function within the key; temporal ordering isnot considered, except to distinguish “ornamental”chromatic tones from other chromatic tones. Finally,Leman’s (1995) model derives key directly from an
acoustic signal, rather than from a representationwhere notes have already been identified. The model isessentially a key-profile model, but in this case theinput vector represents the strength of each pitch-class(and its harmonics) in the auditory signal; key-profilesare generated in a similar fashion, based on the frequencycontent of the primary chords of each key.
Temperley (2007) proposes a distributional key-finding model based on probabilistic reasoning. Thisprobabilistic model assumes a generative model inwhich melodies are generated from keys. A key-profilein this case represents a probability function, indicatingthe probability of each scale-degree given a key. Suchkey-profiles can be generated from musical corpora; theprofiles in Figure 3 are drawn from the openings ofMozart and Haydn string quartet movements (theseprofiles are discussed further below). Given such key-profiles, a melody can be constructed as a series of notesgenerated from the key-profile. The probability of themelody given a key, P(melody | key), is then the productof all the probabilities (key-profile values) for the indi-vidual notes. For example, given the key of C major, the
Pitch-Class Distribution and Key Identification 195
FIGURE 2. Key-profiles for major keys (above) and minor keys (below). From Krumhansl and Kessler (1982).
Music2503_02 1/9/08 2:24 PM Page 195

probability for the melody C-F#-G (scale degrees 1-#4-5) would be .223 × .019 × .189 = .00080.
A basic rule of probability, Bayes’ rule, then allows usdetermine the probability of any key given the melody,P(key | melody):
(1)
The denominator of the expression on the right,P(melody), is just the overall probability of a melodyand is the same for all keys. As for the numerator, P(key)is the “prior” probability of each key occurring. If weassume that all keys are equal in prior probability, thenthis, too, is constant for all keys (we discuss thisassumption further below). Thus
P(key | melody) ∝ P(melody | key) (2)
PP P
P(key |melody) =
(melody | key) (key)
(mellody)
To identify the most probable key given a melody, then,we simply need to calculate P(melody | key) for all 24keys and choose the key yielding the highest value. Thismodel was tested on a corpus of European folk songs,and identified the correct key in 57 out of 65 melodies.1
196 David Temperley and Elizabeth West Marvin
FIGURE 3. Key-profiles generated from the string quartets of Mozart and Haydn, for major keys (above) and minor keys (below).
1The model described here is a somewhat simplified version of themonophonic key-finding model described in Chapter 4 of Temperley(2007). The model generates monophonic pitch sequences using fac-tors of key, range, and pitch proximity, and can be used to model key-finding, expectation, and other phenomena. The model used heredoes not consider range and pitch proximity, but these factors have lit-tle effect on the model’s key-finding behavior in any case (see Temper-ley, 2007, Chapter 4, especially Note 6). As Temperley notes (pp. 79-81),this approach to key-finding is likely to be less effective for polyphonicmusic; treating each note as generated independently from the key-profile is undesirable in that case given the frequent use of doubledand repeated pitch-classes. For polyphonic music, Temperley pro-poses instead to divide the piece into short segments and label eachpitch-class as “present” or “absent” within the segment. For melodies,however, the approach of counting each note seems to work well.
Music2503_02 1/9/08 2:24 PM Page 196

Despite the number of researchers who have embracedthe distributional approach to key-finding, not all haveaccepted it. Some have suggested that distributionalmethods neglect the effect of the temporal ordering ofpitches in key perception. Butler and colleagues (Butler,1989; Brown, Butler, & Jones, 1994) have argued thatkey detection may depend on certain “goal-orientedharmonic progressions” that are characteristic of tonalmusic. Butler et al. focus especially on tritones—whatthey call a “rare interval”—becauses tritones occur onlybetween two scale degrees (4 and 7) within the majorscale, whereas other intervals occur more often,between multiple scale degrees (e.g., an ascending per-fect fourth may be found between scale degrees 1 to 4, 2to 5, 3 to 6, 5 to 1, 6 to 2, and 7 to 3). Butler et al. alsoargue that the ordering of the notes of the tritone isimportant: a tritone F-B implies a tonal center of Cmuch more strongly than B-F. Similarly, Vos (1999) hasargued that a rising fifth or descending fourth at thebeginning of a melody can be an important cue to key.These arguments are examples of what we earlier calleda “structural” view of key perception. In support ofsuch a view, some experiments have shown that theordering of pitches does indeed have an effect on keyjudgments. Brown (1988) found, for example, thatthe pitches D-F#-A-G-E-C# elicited a strong prefer-ence for D major, whereas the sequence C#-D-E-G-A-F#was more ambiguous and yielded a judgment of G majorslightly more often than D major (see also Auhagen,1994; Bharucha, 1984; West & Fryer, 1990). Similarly,Matsunaga and Abe (2005) played participants tonesequences constructed from the pitch set {C, D, E, G, A, B}played in different orders. They found that the orderingaffected key judgments, with certain orderings elicitinga strong preference for C major, some for G major, andsome for A minor.2
While the studies of Brown (1988), Matsunaga andAbe (2005), and others might be taken to support thestructural view of key perception, it would be a mistaketo interpret them as refuting the distributional viewaltogether. For one thing, the sequences used in thesestudies are all extremely short; one might argue that
such short sequences hardly provide listeners withenough “evidence” for a distributional strategy to beapplied. Moreover, in some cases, the pitch sets used aredeliberately constructed to be distributionally ambigu-ous. For example, the set {C, D, E, G, A, B} is fully con-tained in both the C major and G major scales, and alsocontains all three tonic triad notes of these two keys.The fact that structural cues are used by listeners insuch ambiguous situations may have little relevance toreal music, where distributional information generallyprovides more conclusive evidence as to key. We shouldnote, also, that the “structural” view of key perceptionhas yet to be worked out as a testable, predictive theory.It remains possible, however, that key perceptiondepends significantly on the detection of certain struc-tural musical patterns or on a combination of structuraland distributional strategies.
As noted earlier, this question is difficult to resolveusing real music, where both distributional and struc-tural cues tend to be present. A better way to examinethe role of distributional information would be to usemelodies generated randomly from typical pitch-classdistributions for different keys. In such melodies, thekey would be indicated by the distribution, but itwould presumably not be indicated by structural cuesthat depend on a particular temporal arrangement ofpitches, such as a particular ordering of an interval, animplied harmonic progression, or the occurrence ofcertain scale degrees at particular points in the melody.If listeners are indeed relying on such structural cues,they may be unable to determine the underlying keyand may even be misled into choosing another key.
Before continuing, we should briefly summarize otherrelevant studies that have explored listeners’ sensitivity topitch-class distribution. Several studies have employed aprobe-tone methodology using musical materials quitedifferent from those of Western tonal music. In a study byCastellano, Bharucha, and Krumhansl (1984), Americanparticipants were played passages of classical Indianmusic; probe-tone methods were used to see whetherthe responses reflected the distribution of pitch-classesin the input. Similarly, Oram and Cuddy (1995) andCreel and Newport (2002) did probe-tone studies usingmelodies generated from artificial pitch-class distribu-tions designed to be very dissimilar to any major orminor scale. In all three of these studies, listeners’responses were highly correlated with the pitch-classdistribution of the input—with tones occurring morefrequently in the context being given higher ratings—suggesting that listeners are indeed sensitive to pitch-class distribution. We should not take these studies to
Pitch-Class Distribution and Key Identification 197
2One model that does not fit neatly into our structural/distribu-tional taxonomy is Bharucha’s (1987) neural-network model. Thismodel consists of three levels of interconnected units representingpitches, chords, and keys; sounding pitches activate chord unitswhich that in turn activate key units. The model is similar to distrib-utional models in that it takes no account of the temporal orderingof pitches (except insofar as the activation of units decays graduallyover time); however, the effect of pitches is mediated by the chordsthat contain them.
Music2503_02 1/9/08 2:24 PM Page 197

indicate that probe-tone responses in general aremerely a reflection of the frequency of tones in the con-text (we return to this point below). But they do showthat listeners are sensitive to pitch-class distribution,and this suggests that they might use distributionalinformation in key identification as well.
A study by Smith and Schmuckler (2004) investigatedthe role of distributional information in key-finding. Inthis study, probability distributions were created usingthe Krumhansl-Kessler profiles, either in their originalform or with the profile values raised to various expo-nents (in order to increase the degree of differentiationbetween tones in the profile). These distributions wereused to control both the duration and the frequency ofoccurrence of pitches, which were then randomlyordered. Thus the experiment tested participants’ abil-ity to use distributional cues in the absence of structuralones. Participants were played these melodies, and theirperceptions of key were measured using a probe-tonemethodology. Profiles representing their responses werecreated, and these were correlated with Krumhansl andKessler’s probe-tone profiles. A high correlation withthe K-K profile of a particular key was taken to indicatethat participants heard the melody in that key. Theauthors found that listeners’ judgments did indeedreflect perception of the correct key, especially when thekey-profiles used to generate the melodies were raisedto high exponents. The authors found that the totalduration of each pitch-class in the melody is important;increasing the number of events of a certain pitch-classbut making them shorter (so that the total duration ofeach pitch-class is the same) does not result in a clearerperception of tonality for the listener.
Smith and Schmuckler’s (2004) study seems to pointto a role for distributional information in key percep-tion. However, it is open to two possible criticisms. Thefirst concerns the fact that participants’ judgments ofkey were measured by gathering probe-tone responsesand correlating these with the original K-K profiles.This is a highly indirect method of accessing key judg-ments (see Vos, 2000, for discussion). It is true thatprobe-tone studies using a wide variety of tonal con-texts have yielded quite consistent responses (Cuddy,1997; Krumhansl, 1990); this suggests that probe-toneprofiles are, indeed, a fairly reliable indicator of keyjudgments. But it is still possible that probe-toneresponses are affected by the precise context that isused, at least to some extent. An alternative method,which has been used in some earlier studies of key per-ception (Brown, 1988; Cohen, 1991; Matsunaga & Abe,2005), is to ask participants to report their key judg-ments directly. This “direct” method is impractical with
untrained participants, who may be unable to articulatetheir knowledge of key, but with trained participants—as will be used in this study—this problem does notarise.
A second criticism concerns Smith and Schmuckler’s(2004) analysis of their data. The authors indicate that,in some conditions at least, listeners’ probe-toneresponses to distributional melodies were highly corre-lated with the K-K profile for the correct key. But theydo not indicate whether the K-K profile of the correctkey was the most highly correlated with the probe-toneresponses. If the profile of the correct key matchedthe probe-tone responses better than any other, thismight be taken to indicate that the participants hadjudged the key correctly; but this information is notgiven. Thus, the results remain inconclusive as towhether listeners can judge key based on distributionalinformation alone.3
In this study, we present an experiment similar to thatdone by Smith and Schmuckler (2004), but with threedifferences. First, the probability distributions used tocreate our melodies were generated from a musical cor-pus, rather than from experimental perception data (asin Smith and Schmuckler’s study). Second, we meas-ured participants’ intuitions about key using explicitkey judgments, rather than using the more indirectprobe-tone method. Third, we measure the influence ofpitch-class distribution on listeners’ responses by look-ing at the proportion of key judgments that matchedthose predicted by the pitch-class distribution. In sodoing, we compare several different distributionalmodels of key-finding, to see which one achieves thebest fit with the participants’ responses. We consider theKrumhansl-Schmuckler model, Temperley’s probabilis-tic model (described above), and several variants of theprobabilistic model.
Finally, we examine the question of whether absolutepitch (AP) possession aids or hinders key-finding indistributional melodies. In general, the perception ofkey is assumed to be relative, not absolute. Most listeners
198 David Temperley and Elizabeth West Marvin
3We should note also that the distributions used to generate themelodies in Smith and Schmuckler’s (2004) study were based on theK-K profiles. Since these profiles are drawn from perception data,one might question whether they really reflect the distribution oftones in tonal music. It is clear that the K-K profiles are qualitativelyvery similar to pitch-class distributions in tonal music—a compari-son of Figures 2 and 3 demonstrates this. Quantitatively, they are notso similar (even when normalized to sum to 1), as the values forchromatic pitches are much too high; some kind of nonlinear scalingis needed to adjust for this, as seen in Smith and Schmuckler’s study.An alternative approach would be to generate the melodies using dis-tributions drawn from actual music, as we do in the current study.
Music2503_02 1/9/08 2:24 PM Page 198

cannot listen to a melody and say “that is in C major”;rather, they identify the key by recognizing that a par-ticular note is the tonic pitch and that the melody is inmajor or minor. A small fraction of the population—those with absolute pitch—are able to identify pitches(and therefore keys) in absolute terms (for an overview,see Levitin & Rogers, 2005; Takeuchi & Hulse, 1993;Terhardt & Seewann, 1983). Based on earlier research onabsolute pitch (Marvin, 1997), we hypothesized that par-ticipants with absolute pitch might differ in their key-finding strategy from those with relative pitch—perhapsidentifying key in a more deliberate and methodicalway, even explicitly counting pitches to determine a dis-tribution. To test this, we grouped participants accordingto their absolute pitch ability, and tested the groups inboth “timed” and “untimed” conditions. In Experiment 1(the untimed condition), participants heard the entiremelody and then made a key judgment; in Experiment 2(the timed condition), they stopped the melody whenthey felt they had identified the key, and then reportedtheir judgment. The stimuli in Experiments 1 and 2were different, but were generated by the same algo-rithm. Our hypothesis was that listeners with absolutepitch might use a more deliberate “counting” strategy todetermine the key, and therefore might take more timeto reach a judgment than those with relative pitch.
Method
Participants
Data are reported here for 30 participants (18 male, 12female) with a mean age of 19.08 years (SD = 0.97), whovolunteered to take part in both experiments and werepaid $10 for participating. All were undergraduatemusic students at the Eastman School of Music of theUniversity of Rochester. Participants began studying amusical instrument at a mean age of 7.65 years (SD =3.57), and thus had played for more than 11 years. Allparticipants had completed at least one year of colle-giate music theory study. Twenty-one participants iden-tified themselves as Caucasian, seven as Asian, one asHispanic, and one as African-American.
Although we initially asked participants to reporttheir status as AP or non-AP listeners, we administeredan AP posttest to all participants to confirm. Interest-ingly, the distribution of scores was trimodal, withhigh- and low-scoring groups and a distinct group ofscores in the middle. Based on the distribution ofscores, those who scored 85% or higher (M = 97%, n = 12)we classified as AP; those who scored 25% or lower (M= 10%, n = 11) we classified as non-AP; and participants
with scores between 40% and 60% (M = 53%, n = 7),we classified as “quasi-AP.” Of the seven quasi-AP par-ticipants, two self-identified as AP, two as non-AP, andthree as quasi-AP.4 AP participants began their instru-mental training at age 6.2 years, non-AP at 8.8 years,and quasi-AP at 8.1 years. All seven Asian participantsplaced either in the AP or quasi-AP group, and thefirst language of five of the seven was Mandarin, Can-tonese, or Korean (see Deutsch, Henthorn, Marvin, &Xu, 2006; Gregersen, Kowalsky, Kohn, & Marvin,2001). Of the AP and quasi-AP participants, all buttwo played a keyboard or string instrument. Of thenon-AP participants, none played a keyboard instru-ment, two played a string instrument, and one was asinger; the majority (n = 7) played woodwind andbrass instruments.
Apparatus
Two experiments were administered individually toparticipants in an isolated lab using a custom-designedprogram in Java on an iMac computer, which collectedall responses and timings for analysis. All participantresponses were made by clicking on-screen note-name buttons with the mouse. Stimuli were presentedvia BeyerDynamic DT770 headphones, and participantshad an opportunity to check note names on a KurzweilPC88mx keyboard next to the computer before complet-ing each trial. Before beginning the experiment, partici-pants were given an opportunity to adjust the loudness ofsample stimuli to a comfortable listening level.
Stimuli
Simuli for both experiments consisted of melodies gen-erated quasi-randomly from scale-degree distributions.The distributions were created from a corpus consistingof the first eight measures of each of the string quartetmovements by Mozart and Haydn.5 The pitches of each
Pitch-Class Distribution and Key Identification 199
4Responses for three of the “quasi-AP” participants, when askedwhether they had AP, were “sort of” and “I don’t think so, but myteaching assistant does.” One quasi-AP bassoon player wrote that hehas AP only for the “bottom half of the piano.”
5The corpus was taken from the Musedata archive (www.musedata.org). The archive contains the complete string quartets of Mozart (78movements) and Haydn (232 movements) encoded in so-called“Kern” format (Huron, 1999), representing pitches, rhythms, barlines, key symbols (indicating the main key of each movement), andother information. It was assumed that very few of the movementswould modulate before the end of the first eight measures; thus, inthese passages, the main key of the movement should also generallybe the “local” key.
Music2503_02 1/9/08 2:24 PM Page 199

8-measure passage were converted into scale degrees inrelation to the main key of the movement. A scale-degree profile, showing the proportion of events of eachscale degree, was then created for each passage. (Theseprofiles reflected only the number of events of each scaledegree, not their duration.) The profiles of all major-key passages were averaged to create the major key-profile (giving each passage equal weight), and the samewas done for minor-key passages. This led to the pro-files shown in Figure 3. It can be seen that the profiles inFigure 3 are qualitatively very similar to the Krumhansl-Kessler profiles shown in Figure 2 (recall that the K-Kprofiles were generated from experimental probe-tonedata). Both profile sets reflect the same three-level hier-archy of tonic-triad notes, scalar notes, and chromaticnotes. (One difference is that in the minor-key Mozart-Haydn profile, 7 has a higher value than b7, while in theKrumhansl-Kessler profiles the reverse is true; thus theMozart-Haydn profiles reflect the “harmonic minor”scale while the K-K profiles reflect the “natural minor.”)
The profiles in Figure 3 were used to generate scaledegrees in a stochastic fashion (so that the probabilityof a scale degree being generated at a given point wasequal to its value in the key-profile). Each melody wasalso assigned a randomly chosen range of 12 semi-tones (within an overall range of A3 to G5), so thatthere was only one possible pitch for each scale degree.Using this procedure, we generated 66 melodies (30 foreach experiment, and six additional for practice trials),using all 24 major and minor keys, each one 40 notes inlength. Figure 4 shows two of the melodies, generatedfrom the key-profiles for C Major and C minor. Themelodies were isochronous, with each note having a dura-tion of 250 ms, and were played using the QuickTime7.1.2 piano timbre.
Stimuli for the AP posttest were those of Deutsch,Henthorn, Marvin, and Xu (2006), used with permis-sion. Participants heard 36 notes spanning a three-octave range from C3 (131 Hz) to B5 (988 Hz). Thenotes were piano tones generated on a Kurzweil synthe-sizer and played via computer MP3 file. To minimizethe use of relative pitch as a cue, all intervals betweensuccessively presented notes were larger than an octave.6
Procedure
Participants took part in two experiments in a singlesession, with a rest between. Before each experiment,participants heard three practice trials and were givenan opportunity to ask questions and adjust the volume;no feedback was given. In Experiment 1, participantsheard 30 melodies as described above; the computerprogram generated a new random order for each par-ticipant. Pacing between trials was determined by theparticipant, who clicked on a “Play” button to begineach trial. After hearing each stimulus melody, the par-ticipant was permitted (but not required) to sing orwhistle his/her inferred tonic and then to locate thispitch on the keyboard in order to determine the pitchname. (This step was largely unnecessary for AP partic-ipants, but they were given the same opportunity tocheck their pitch names at the keyboard.) Participantsthen clicked on one of 12 buttons (C, C#/Db, D, D#/Eb,E, and so on) to register their tonic identification. A sec-ond screen asked them to click on “major” or “minor” toregister the perceived mode of the melody. Experiment 2
200 David Temperley and Elizabeth West Marvin
FIGURE 4. Two melodies used the experiments. Melody A, with a generating key of C major, was used in Experiment 1; Melody B, with a generatingkey of C minor, was used in Experiment 2.
6In scoring the AP posttest, we permitted no semitone deviationsfrom the correct pitch label, as is sometimes done in scoring suchtests.
Music2503_02 1/9/08 2:24 PM Page 200

was identical in format, except that the participants heard30 new melodies (generated in the same manner), andwere urged to determine the tonic and mode as quickly aspossible. When the participant could sing or hum a tonic,he/she clicked on a button that stopped the stimulus anda response time was collected at that point. Then extratime could be taken with the keyboard to determine thenote name and enter the participant’s response.
After the two experiments, participants took an APposttest. Pitches were presented in three blocks oftwelve, with 4-s intervals between onsets of noteswithin a block, and 30-s rest periods between blocks.Participants were asked to write the letter name of eachpitch on a scoring sheet (no octave designation wasrequired). The posttest was preceded by a practice blockof four notes. No feedback was provided, either duringthe practice block, or during the test itself. Studentswere not permitted to touch the keyboard for theposttest. Finally participants filled out a questionnaireregarding their age, gender, training, and AP status, aswell as the strategies they employed in completing theexperimental tasks.
Results
The main question of interest in our experiments is thedegree to which participants’ key judgments accordedwith the keys used to generate the melodies—what wewill call the “generating” keys.7 Before examining this,we should consider whether it is even possible to deter-mine the generating keys of the melodies. This wasattempted using Temperley’s probabilistic key-findingmodel, described earlier. Using the key-profiles takenfrom the Haydn-Mozart corpus (the same profiles usedto generate the melodies), this model chose the generat-ing key in all 60 melodies used in the experiment. Thisshows that it is at least computationally possible toidentify the generating key in all the melodies of ourexperiment using a distributional method.
Turning to the participant data, our 30 listeners eachjudged the key of 60 melodies: 30 in Experiment 1(untimed) and 30 in Experiment 2 (timed). Thisyielded 900 data points for each of the two experiments
and 1800 data points in all. Comparing participants’judgments to the generating keys, we found that .51(SE = .03) of the judgments matched the generating keyin the untimed experiment and .52 (SE = .03) in thetimed experiment. For each participant, the mean pro-portion correct was calculated, and these scores werecompared with a chance performance of 1/24 or 4.2%(since there are 24 possible keys), using a one-sample t-test (two-tailed). We found performance to be muchbetter than chance on both the untimed experiment,t(29) = 17.71, p < .0001, and the timed experiment,t(29) = 14.89, p < .0001.
We then examined the amount of agreement betweenparticipants. For each melody, we found the key thatwas chosen by the largest number of participants—wewill call this the “most popular key” (MPK) for themelody. The MPK judgments matched the generatingkeys in 50 out of the 60 melodies.8 Overall, the MPKjudgments accounted for only 56.1% of the 1800 judg-ments. This is an important result for two reasons. First,it is surprisingly low: One might expect general agree-ment in key judgments among our participants, whoare highly trained musicians. But with these melodies,the most popular key choices only accounted forslightly more than half of the judgments. We return tothis point later. Second, as we try to model listeners’judgments in various ways, we should bear in mind thatno model will be able to match more than 56.1% of thejudgments in the data. (One cannot expect a model tomatch 100% of participants’ judgments when the par-ticipants do not even agree with each other.)
As a second way of measuring agreement among lis-teners, we calculated the Coefficient of Concentrationof Selection (CCS) for the responses to each melody(Matsunaga & Abe, 2005). The CCS is a measure of thelevel of agreement on a categorical response task, and isdefined as
CCS = (χ2/{N(K – 1)})1/2 (3)
where χ2 is the chi-square of the distribution ofresponses, N is the number of responses, and K is thenumber of response categories. The CCS varies between 0(if responses are evenly distributed between all categories)and 1 (if all responses are in the same category). Forour melodies, the CCS values ranged from .31 to 1.00;
Pitch-Class Distribution and Key Identification 201
7We do not call them the “correct” keys, because the correct key ofa randomly generated melody is a problematic notion. Suppose thegenerative model, using the key of C major, happened to generate“Twinkle Twinkle Little Star” in F# major (F# F# C# C# . . . )—whichcould happen (albeit with very low probability). Would this meanthat the correct key of this melody was C major? Surely not. It seemsthat “correct” key of such a melody could only be defined as the onechosen by listeners.
8To be more precise: In 48 of the 60 cases, there was a single mostpopular key that was the generating key. In two other cases, two keyswere tied for most popular, but in both of these cases one of the twokeys was the generating key. For simplicity, we counted the generat-ing key as the most popular key in those two cases.
Music2503_02 1/9/08 2:24 PM Page 201

the average across our 60 melodies was .589.9 As acomparison, Matsunaga and Abe (2005) provide CCSvalues for the 60 six-note melodies used in theirexperiment; the average CCS value for these melodieswas .52.
We then considered the question of whether posses-sors of absolute pitch performed differently from otherlisteners. With regard to matching the generating keys,on the untimed experiment the AP participantsachieved an average score of .56 correct (SE = .051), thequasi-AP participants achieved .42 (SE = .03), and thenon-AP participants achieved .51 (SE = .04); the differ-ence between the groups was not significant, F(2, 27) =2.29, p > .05. On the timed experiment, too, the meanscores for the AP participants (M = .54, SE = .05), thequasi-AP participants (M = .51, SE = .07), and the non-AP participants (M = .49, SE = .05) did not significantlydiffer, F(2, 27) = 0.21, p > .05. We then examined theaverage time taken to respond on the timed experiment;we had hypothesized that AP participants might use anexplicit counting strategy and therefore might takelonger in forming key judgments. The AP participantsshowed an average time of 7.09 (SE = 0.34) seconds, thequasi-AP participants yielded an average time of 7.45(SE = 0.43) seconds, and the non-AP participantsyielded an average time of 7.16 (SE = 0.55) seconds. (Onaverage, then, the AP and non-AP participants heardabout 27 notes of each melody and the quasi-AP partici-pants heard about 28 notes.) The difference between thethree groups was not significant, F(2, 27) = 0.14, p > .05.Thus, we did not find any significant difference betweenAP, quasi-AP, and non-AP participants with regard toeither the speed of their judgments or the rate at whichthey matched the generating keys.
Discussion
The experiments presented above were designed toexamine whether listeners are able to identify the key ofa melody using distributional information alone. Theresults suggest that listeners can, indeed, perform thistask at levels much greater than chance. This result wasfound both in an untimed condition, where the com-plete melody was heard, and in a timed condition,where participants responded as quickly as possible.However, only slightly more than half of participants’judgments matched the generating key, both in the
timed and the untimed conditions. No significant dif-ference in key-finding performance was found withregard to absolute pitch.
One of our goals in this study was to test various dis-tributional models of key-finding to assess how wellthey matched listener judgments. In what follows, webegin by examining the performance of the Temperleyprobabilistic model described earlier; we then considerseveral other models and variants of this model. Oneissue to consider here is the distinction between timedand untimed conditions. In the untimed condition, lis-teners heard the entire melody before judging the key;in the timed condition, they generally did not hear theentire melody. (As noted above, participants on averageheard about 27 notes, or about two thirds, of themelody in the timed condition. In only 199 of the timedtrials, or 22.1% of the total, did participants “run outthe clock” and hear the entire melody.) It seems ques-tionable to compare the judgment of a model that hadaccess to the entire melody with that of a listener whoonly heard part of the melody; on the other hand, par-ticipants did hear most of the timed melodies, andadding in the timed melodies provides a larger body ofdata. For the most part, we focus here on the untimedmelodies, but in some cases we consider both untimedand timed melodies; this will be explained furtherbelow.
One simple way of testing a key-finding modelagainst our data is by comparing its key judgments tothe MPK judgments—the keys chosen by the largestnumber of participants. We noted above that theMPK judgments matched the generating key on 50out of 60 melodies (considering both untimed andtimed melodies), and the Temperley probabilisticmodel matched the generating key on all 60 melodies.Thus the Temperley probabilistic model matches theMPK judgments in 50 out of 60 melodies. On theuntimed melodies, the Temperley model matched 26out of 30 MPK judgments. (See the first row of Table 1.)
We also considered two other measurements of howwell the model’s output matched the participants’ judg-ments. One measure makes use of the fact that theprobabilistic model calculates a probability for each keygiven the melody, the key with the highest probabilitybeing the preferred key. The model’s probability for thegenerating key, what we will call P(Kg), can be used as ameasure of the model’s “degree of preference” for thatkey. The participants’ degree of preference for the gen-erating key can be measured by the number of responsesthat key received, or responses(Kg). If the probabilisticmodel is capturing participants’ key judgments, thenthe probability it assigns to the generating key should be
202 David Temperley and Elizabeth West Marvin
9We also wondered if the CCS was lower on melodies for which theMPK was not the generating key. For the 10 melodies on whichthe MPK was not the generating key, the average CCS was .48; forthe other 50 melodies, the average CCS was .61.
Music2503_02 1/9/08 2:24 PM Page 202

higher in cases where more participants chose that key.One problem is that, for the 30 untimed melodies,P(Kg) varies beween 0.98 and 0.9999999; the variationin these numbers is not well captured either by a linearscale or a logarithmic scale. A better expression for thispurpose is log(1– P(Kg)); if this value is low, that meansthe model strongly preferred the generating key. (Forour melodies, this varies between a low of −17.55 and ahigh of −4.01.) These values were calculated for each ofthe untimed melodies; Figure 5 plots log(1 − P(Kg)against responses(Kg) for each melody. The observed
relationship is in the predicted direction (in cases wherelog(1 – P(Kg)) is lower, the generating key received moreresponses); however, it is very small and statisticallyinsignificant (r = .24). Thus, by this measure, the Tem-perley model does not fare very well in predicting par-ticipants’ degree of preference for the generating key.
The two measures used so far both consider only themost preferred keys of the model and the participants.It would be desirable to compare the degree of prefer-ence for lower-ranked keys as well. Here we use Spear-man’s Rank Correlation, which correlates two rankingsfor a set of items without considering the numericalvalues on which those rankings were based. For each ofthe untimed melodies, we used the log probabilitiesgenerated by the Temperley probabilistic model foreach key, log(P(key | melody), to create a ranking of the24 keys; we then used the participant data to createanother ranking, reflecting the number of votes eachkey received (keys receiving the same number of voteswere given equal rank). For each melody, we calculatedthe Spearman coefficient between these two rankings;for the 30 untimed melodies, the average correlationwas .539.
Figure 6 shows two of the melodies in our experi-ment, and Figure 7 shows data for them: the number ofvotes for each key and the model’s probability judgmentfor each key, log(P(key | melody). For the first melody(with a generating key of D major), the participantresponses are fairly typical, both in the degree of partic-ipant agreement (CCS = .50) and the number of votesfor the generating key (15). The second melody (with agenerating key of Eb minor) is the one that yielded the
Pitch-Class Distribution and Key Identification 203
TABLE 1. Comparison of Key-Finding Algorithms.
No. of matches to Spearman correlation coefficientNo. of matches to MPKs (untimed between rankings of keys
No. of matches to MPKs (untimed and timed by participants and generating keys condition only, conditions, model (averaged over
Model (60 melodies) 30 melodies) 60 melodies) 30 untimed melodies)
Probabilistic model (PM) 60 (100.0%) 26 (86.7%) 50 (83.3%) .54
PM with Essen profiles 58 (96.6%) 25 (83.3%) 48 (80.0%) .53
Krumhansl-Schmuckler model 49 (81.7%) 23 (76.7%) 43 (71.7%) .45
PM ignoring last 20 notes 52 (86.7%) 22 (73.3%) 45 (75.0%) .52
PM ignoring first 5 notes 59 (98.3%) 27 (90.0%) 51 (85.0%) .53
PM favoring major-mode keys 59 (98.3%) 25 (83.3%) 49 (81.7%) .53(mf = .999)
“First-order” probabilistic model 56 (93.3%) 27 (90.0%) 49 (81.7%) .49
PM with profile value for tonic 59 (98.3%) 26 (86.7%) 51 (85.0%) .55multiplied by 1000 on first note
FIGURE 5. The model’s degree of preference for the generating key ofeach melody (log(1 − P(Kg)) (vertical axis) plotted against the number ofresponses for that key (horizontal axis), for the 30 melodies in theuntimed experiment.
−18
−16
−14
−12
−10
−8
−6
−4
−2
Mod
el
0 5 10 15 20 25 30 35Responses
Music2503_02 1/9/08 2:24 PM Page 203

minimum number of votes for the generating key; thiskey received only two votes. Comparing the model’sjudgments to the participant judgments for these twomelodies, we see that the fit is far from perfect; still,there is clearly some correspondence, in that the peaksin the participant data (the keys receiving votes) gener-ally correspond to peaks in the model’s values, espe-cially in the first melody. Perhaps the most strikingdifference is that on the second melody, Bb majorreceived the highest number of participant votes (8) butreceived a fairly low score from the model. The reasonfor the model’s low score for Bb major is clear: there are16 notes in the melody that go outside the Bb majorscale. As to why the participants favored Bb major, per-haps the Bb major triad at the beginning of the melodywas a factor (though bear in mind that only 8 out of 30participants voted for this key). We will return below tothe issue of what other factors besides pitch-class distri-bution may have affected the participants’ judgments.
We now consider whether any other model can befound that achieves a better “fit” to the participant datathan the Temperley probabilistic model. Table 1 showsthe results for various models. First we show the num-ber of matches between the model’s judgments and thegenerating keys (for untimed and timed melodies com-bined). We then show the number of matches betweenthe model’s preferred keys and the MPK judgments.(We give results for the 30 untimed melodies; since thisoffers only a small body of data, we also give results forthe timed and untimed melodies combined.) Finally,we show the Spearman correlation calculated betweenthe rankings of keys by the participants and the model(for the untimed melodies only).
In considering alternatives to the Temperley proba-bilistic model, we first wondered how much the model’sjudgments were affected by the specific key-profiles thatit used. To explore this, the model was run with a set ofprofiles gathered from another corpus. The corpus used
was the Essen folksong database, a corpus of 6,200European folk songs, annotated with pitch and rhyth-mic information as well as key symbols.10 The Essenprofiles (shown in Figure 8) are very similar to theMozart-Haydn profiles (Figure 3), though with a fewsubtle differences. (In the Essen profiles, b7 has a highervalue than 7 in minor, like the Krumhansl-Kessler pro-files and unlike the Mozart-Haydn profiles.) Using theEssen profiles, the model matched the generating keysin 58 out of 60 cases (as opposed to 60 out of 60 withthe Mozart-Haydn profiles). Thus the model’s identifi-cation of generating keys does not seem to dependheavily on the precise values of the profiles that are used.The model’s judgments when using the Essen profilesmatched the MPK judgments in 48 out of 60 cases. Thissuggests that, in modelling listeners’ distributionalknowledge of tonal music, classical string quartets andEuropean folk songs are almost equally good, thoughclassical string quartets may be marginally better.
The next model tested was the Krumhansl-Schmucklermodel. As discussed earlier, the K-S model operates bycreating an “input vector” for the piece—a profileshowing the total duration of all 12 pitch-classes in thepiece; the correlation is calculated between this vectorand the 24 K-K key-profiles, and the key is chosen yield-ing the highest correlation. Unlike the profiles of theprobabilistic model, which were set from a corpus ofmusic, the profiles of the K-S model were gathered fromexperimental data on human listeners (Krumhansl,1990).11 Thus, one might expect the K-S model tomatch our participants’ judgments better than theprobabilistic model. In fact, however, the K-S modelyielded a poorer match to our listener data, matchingonly 43 of the 60 MPK judgments. The K-S model alsofared worse at matching the generating keys; it matchedonly 49 out of 60 generating keys, whereas the proba-bilistic model matched all 60.
One suprising aspect of our experimental data is thatparticipants matched the generating key at almost thesame rate in the timed condition (where they made akey judgment as soon as they were able) as in theuntimed condition (where they heard the entire melody).
204 David Temperley and Elizabeth West Marvin
FIGURE 6. Two melodies used in the untimed experiment.
10The Essen database is available at <http://kern.ccarh.org/cgi-bin/ksbrowse?l=/essen/>. It was created by Schaffrath (1995) and compu-tationally encoded in “Kern” format by Huron (1999).
11In fact, the participants in Krumhansl and Kessler’s (1982) studywere rather similar to those of our experiment, namely undergradu-ates with high levels of music training. However, while Krumhansland Kessler’s subjects generally did not have training in music theory,most of our participants had studied collegiate music theory forthree semesters and therefore did have some theory background.
A.
B.
Music2503_02 1/9/08 2:24 PM Page 204

This suggested to us that perhaps participants wereusing a distributional strategy, but basing their judg-ment only on the first portion of the melody. In ourown experience of the melodies, too, we felt that wesometimes gave greater weight to notes early in themelody—perhaps forming a key judgment after just afew notes and then fitting any subsequent notes intothat key framework. Thus, we reasoned that the fit of
the probabilistic model to the participants’ judgmentsmight be improved by simply running it on only thefirst portion of the melody—ignoring the last n notes.This approach was tried, for various values of n; how-ever, no improvement in fit to the listeners’ responsescould be achieved in this way. Table 1 shows the resultsfor n = 20 (a number of other values were also tried).Using only the first 20 notes of each melody, the model
Pitch-Class Distribution and Key Identification 205
FIGURE 7. Data for the melodies shown in Figure 6A (above) and Figure 6B (below). The solid line shows the number of votes for each key; the dot-ted line shows the probabilistic model’s score for that key, log(P(key | melody). (The model’s scores have been normalized to allow comparison withparticipant responses.)
Music2503_02 1/9/08 2:24 PM Page 205

matched only 45 out of the 60 untimed and timedMPKs, as opposed to 50 when the entire melody wasconsidered. We then tried ignoring notes at the begin-ning of the melody—reasoning that perhaps partici-pants gave greater weight to notes near the end. (Aneffect of final position was observed by Creel & New-port, 2002.) The model was modified to ignore the firstn notes, using various values of n. Again, little improve-ment could be obtained. With n = 5 (ignoring the first 5notes of the melody), the number of matches to theMPKs on the combined untimed and timed melodiesincreased from 50 to 51; other values of n resulted infewer matches. In short, there is little evidence that par-ticipants considered only part of the melodies in makingtheir judgments; in general, the model seems to matchlisteners’ judgments most closely when it considers theentire melody.
Another issue concerns possible biases in the key judg-ments. The probabilistic model used here assumes thatall keys are equal in prior probability; but this may notbe the assumption of listeners. Certainly some tonics are
more common than others—there are more pieces in Cmajor than in F# major, and generally, it seems clear that“white-note” keys are more common than “black-note”keys. Perhaps these prior probabilities are reflected in lis-teners’ judgments. This possibility is of particular inter-est with regard to AP participants. Other studies havefound a “white-note” bias in AP listeners with regard topitch identification—such listeners can identify white-note pitches more rapidly than black-note pitches(Marvin & Brinkman, 2000; Miyazaki, 1989, 1990;Takeuchi & Hulse, 1991); we wondered if a similar biaswould affect their key judgments. (Although one mightnot expect such a bias with non-AP listeners, Marvinand Brinkman found that non-AP listeners also reflecteda white-note bias in pitch identification.) To address thisquestion, we examined the frequency of white-note versusblack-note key judgments, considering just the data fromthe untimed experiment.
Out of the 30 melodies in the untimed experiment,12 had generating keys with “black-note” tonics; thus,if there was no bias, we would expect the proportion
206 David Temperley and Elizabeth West Marvin
FIGURE 8. Key-profiles generated from the Essen Folksong Collection, for major keys (above) and minor keys (below).
Music2503_02 1/9/08 2:24 PM Page 206

of responses for black-note tonics to be 12/30 = .4. Forthe AP group, the actual proportion of responses forblack-note tonics (averaged across participants) wasexactly .4 (SE = .015), which obviously did not signifi-cantly differ from the expected value, t(11) = 0.00, p >.05. The proportion of responses for black-note tonicsfor the quasi-AP and non-AP groups also did not differsignificantly from the expected value. Thus we find noevidence for any bias towards white-note tonics.
We then considered whether listeners might have abias regarding mode. Again, it seems likely that majormode is more common than minor mode in most tonalstyles, and this might affect listeners’ judgments. Out ofthe 30 melodies in the untimed experiment, 15 hadminor-mode generating keys, thus we would expect theproportion of votes for minor-mode keys to be .50. Forboth the non-AP group and the AP group, the observedproportion of votes for minor-mode keys was signifi-cantly less than the expected value. For the non-APgroup, the mean was .397, SE = .035, t(10) = −2.95, p <.05; for the AP group, the mean was .401, SE = .020,t(11) = −4.62, p < .001. For the quasi-AP group, theobserved proportion was .529, not significantly differ-ent from the expected value, t(6) = 0.56, p > .05. Com-bining the three groups together, we find a meanproportion of .431 (SE = .021) for minor-mode keys,reflecting a significant bias towards major-mode keys,t(29) = −3.27, p < .01.
We then tried incorporating this bias into the model.Recall that our original expression for P(key | melody)(equation 1) contained a factor representing the priorprobability of the key—P(key)—but that this wasassumed to be equal for all keys and therefore neglected.We now assume that P(key) may be different for differ-ent keys. The probability of each major key can beexpressed as mf/12, where mf (mode factor) is the prob-ability of a major-mode form of a key. The probabilityof the parallel minor is then (1–mf )/12; this ensuresthat the probabilities for all 24 keys sum to 1. A highvalue of mf (close to 1) would give major keys a higherprior probability than minor keys. Various values of mfwere tried, but none yielded any improvement over theoriginal model in terms of matching the MPK judg-ments. With mf = .9, the model matched 50 of theuntimed and timed MPKs (the same as the originalmodel); with mf = .999, it matched 49 of the MPKs.
We then considered a distributional model of a ratherdifferent kind. Experiments have shown that listenersare sensitive to transitional probabilities between adja-cent surface elements, both in language and in music(Saffran & Griepentrog, 2001; Saffran, Johnson, Aslin,& Newport, 1999). We wondered if this was the case
with regard to key perception as well.12 Specifically, weconsidered a generative model again based on theMozart-Haydn corpus, in which the probability of anote Nn at a particular point depends on the key and onthe previous note, Nn − 1; the probability of an entiremelody is then the product of these probabilities overall notes:
P(melody | key) = Πn P(Nn | Nn − 1, key) (4)
(One could call this a “first-order Markov model”—conditional on the key—whereas our original modelwas a “zeroth-order Markov model.”)13 Again, usingBayesian logic, this expression is proportional to theprobability of a key given the melody. The probabilitieswere set using the Mozart-Haydn corpus, by findingthe probabilities of all “scale-degree transitions”—the probability of each scale degree, given the previousscale degree (within the same line). In a sense, this couldbe considered a kind of “structural” model, as it consid-ers the ordering of notes (in a very limited way). In par-ticular, it seemed that this model might improve themodel’s sensitivity to chromatic notes—notes outsidethe scale, which almost invariably resolve by a half-step.Incorporating scale-degree transitions gives the modelthe ability to capture this convention; it should know,for example, that a note that is not followed by half-stepis unlikely to be chromatic and almost certainly a noteof the scale.
As Table 1 shows, this “first-order” model once againfailed to yield any improvement over the original prob-abilistic model. Considering both the timed anduntimed melodies, it matched the MPKs on 49 out ofthe 60 melodies (though intriguingly, it got one pointmore than the original model on the untimed melodies).The model also performed worse than the originalmodel with regard to the generating keys, matching only56 out of 60. Thus, we find that a probabilistic modelbased on note transitions matches human judgementsof key no better than the original model.
Pitch-Class Distribution and Key Identification 207
12Earlier attempts to incorporate such information into key-find-ing models have had limited success. In particular, Toiviainen andKrumhansl (2003) incorporated information about note transi-tions—the probability of one note following another—into a distri-butional model, but found that it yielded no improvement over theKrumhansl-Schmuckler model. In that case, however, the transi-tional information used was gathered from perception data regard-ing the perceived “relatedness” of tones; in the present case, we set thetransitional probabilities based on a musical corpus.
13For the first note, the probability cannot be calculated in thisway, since there is no previous note; in this case, then, the “zeroth-order” profiles were used.
Music2503_02 1/9/08 2:24 PM Page 207
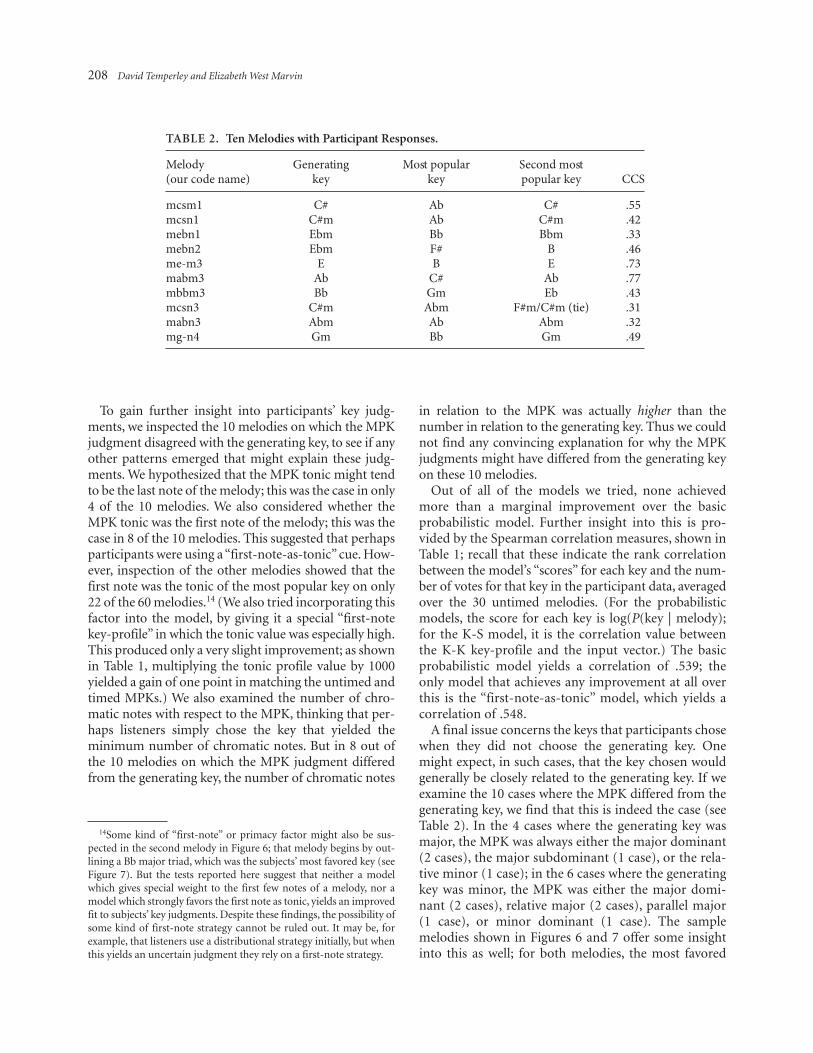
To gain further insight into participants’ key judg-ments, we inspected the 10 melodies on which the MPKjudgment disagreed with the generating key, to see if anyother patterns emerged that might explain these judg-ments. We hypothesized that the MPK tonic might tendto be the last note of the melody; this was the case in only4 of the 10 melodies. We also considered whether theMPK tonic was the first note of the melody; this was thecase in 8 of the 10 melodies. This suggested that perhapsparticipants were using a “first-note-as-tonic” cue. How-ever, inspection of the other melodies showed that thefirst note was the tonic of the most popular key on only22 of the 60 melodies.14 (We also tried incorporating thisfactor into the model, by giving it a special “first-notekey-profile” in which the tonic value was especially high.This produced only a very slight improvement; as shownin Table 1, multiplying the tonic profile value by 1000yielded a gain of one point in matching the untimed andtimed MPKs.) We also examined the number of chro-matic notes with respect to the MPK, thinking that per-haps listeners simply chose the key that yielded theminimum number of chromatic notes. But in 8 out ofthe 10 melodies on which the MPK judgment differedfrom the generating key, the number of chromatic notes
in relation to the MPK was actually higher than thenumber in relation to the generating key. Thus we couldnot find any convincing explanation for why the MPKjudgments might have differed from the generating keyon these 10 melodies.
Out of all of the models we tried, none achievedmore than a marginal improvement over the basicprobabilistic model. Further insight into this is pro-vided by the Spearman correlation measures, shown inTable 1; recall that these indicate the rank correlationbetween the model’s “scores” for each key and the num-ber of votes for that key in the participant data, averagedover the 30 untimed melodies. (For the probabilisticmodels, the score for each key is log(P(key | melody);for the K-S model, it is the correlation value betweenthe K-K key-profile and the input vector.) The basicprobabilistic model yields a correlation of .539; theonly model that achieves any improvement at all overthis is the “first-note-as-tonic” model, which yields acorrelation of .548.
A final issue concerns the keys that participants chosewhen they did not choose the generating key. Onemight expect, in such cases, that the key chosen wouldgenerally be closely related to the generating key. If weexamine the 10 cases where the MPK differed from thegenerating key, we find that this is indeed the case (seeTable 2). In the 4 cases where the generating key wasmajor, the MPK was always either the major dominant(2 cases), the major subdominant (1 case), or the rela-tive minor (1 case); in the 6 cases where the generatingkey was minor, the MPK was either the major domi-nant (2 cases), relative major (2 cases), parallel major(1 case), or minor dominant (1 case). The samplemelodies shown in Figures 6 and 7 offer some insightinto this as well; for both melodies, the most favored
208 David Temperley and Elizabeth West Marvin
TABLE 2. Ten Melodies with Participant Responses.
Melody Generating Most popular Second most(our code name) key key popular key CCS
mcsm1 C# Ab C# .55mcsn1 C#m Ab C#m .42mebn1 Ebm Bb Bbm .33mebn2 Ebm F# B .46me-m3 E B E .73mabm3 Ab C# Ab .77mbbm3 Bb Gm Eb .43mcsn3 C#m Abm F#m/C#m (tie) .31mabn3 Abm Ab Abm .32mg-n4 Gm Bb Gm .49
14Some kind of “first-note” or primacy factor might also be sus-pected in the second melody in Figure 6; that melody begins by out-lining a Bb major triad, which was the subjects’ most favored key (seeFigure 7). But the tests reported here suggest that neither a modelwhich gives special weight to the first few notes of a melody, nor amodel which strongly favors the first note as tonic, yields an improvedfit to subjects’ key judgments. Despite these findings, the possibility ofsome kind of first-note strategy cannot be ruled out. It may be, forexample, that listeners use a distributional strategy initially, but whenthis yields an uncertain judgment they rely on a first-note strategy.
Music2503_02 1/9/08 2:24 PM Page 208

keys are closely related to the generating key.15 Acomplete analysis of participants’ key choices in relationto the generating key would be of interest, but thiswould lead us into the complex topic of key relations(Krumhansl, 1990; Lerdahl, 2001) and is beyond thescope of this study.
Conclusions
Three general conclusions emerge from our study. First,when asked to determine the key of melodies generatedfrom pitch-class distributions—and without any inten-tional “structural” cues—listeners perceive the generat-ing key at better-than-chance levels but without highlevels of agreement. The most popular key choicesaccounted for only slightly more than half of partici-pants’ responses. Second, the behavior of participantswith absolute pitch on randomly generated melodiesappears to be very similar to that of non-AP partici-pants. Finally, to the extent that the participants doagree in their key judgments, the simple probabilisticmodel proposed here matches their judgments quitewell—a number of alternative models and modifica-tions to the model were tried, but none yielded betterperformance. We discuss each of these findings in turn.
The low level of agreement among participants in ourexperiment was quite surprising to us. We assume thatwith real tonal melodies the level of agreement wouldbe much higher. The fact that there was such low agree-ment on our melodies suggests to us that listeners wereoften uncertain about their tonality judgments.16 In ourview, this finding casts serious doubt on the distribu-tional view of key perception. One could argue that themelodies were too short for listeners to get an adequate“sample” of the distribution; with longer melodies, per-haps listeners would identify the generating key morereliably. But this argument seems unconvincing. Forone thing, the probabilistic model was able to identifythe generating key on all 60 melodies, showing that it isat least possible to identify the key in melodies of thislength. Second, many tonal melodies are as short orshorter than 40 notes—for example, “Mary Had a LittleLamb” has 26 notes and “Twinkle Twinkle Little Star” has42 notes. Listeners seem to have no trouble identifying
the tonality in such melodies. Our random melodiesseem to lack important cues to tonality—presumably,structural cues of some kind—that are present in realtonal music.
If listeners use other cues besides distribution toidentify tonality, what might those cues be? Here, weencounter a problem mentioned earlier: Proponents ofthe structural view of key-finding have so far failed toadvance any robust, testable key-finding model. Thestructural cues that have been proposed are, in them-selves, hardly adequate for a key-finding algorithm.Vos’s idea (1999) that an opening ascending fourth ordescending fifth is an important cue fails to accommo-date the many melodies that do not start with theseintervals. Similarly, Butler’s (1989) proposal about tri-tone ordering is weakened by the fact that many well-known melodies do not contain “fa-ti” tritones.(“Twinkle Twinkle Little Star” and “Mary Had A LittleLamb” are two examples of melodies that contain nei-ther an ascending-fourth/descending-fifth openingnor any fa-ti tritones.) These proposals also do notspecify how listeners distinguish parallel major andminor keys, which would share the same “fa-ti” tritoneand “sol-do” ascending fourth/descending fifth. Ourdata also gives little support for these particular inter-vals as key-defining cues. We examined the 10 melodiesin which the generating key was not the most popularkey, to see whether these proposed structural cuesexplained listeners’ judgments. In no case did themelody begin with an ascending fourth or descendingfifth in the most popular key. In only two melodies wasthere a “fa-ti” tritone (as a pair of consecutive notes) inthe most popular key. Thus it does not appear that thesecues are essential for key identification—though theymay play a small role, perhaps in nonconsecutivepitches or in combination with other structural cues.
Turning to our second conclusion, our study foundno difference in key-finding performance with regardto absolute pitch. The AP, quasi-AP, and non-AP groupswere almost the same in the level at which their judg-ments matched the generating key; they also did notsignificantly differ with regard to the time taken to forma key judgment on the timed experiment. None of thethree AP groups—AP, quasi-AP, or non-AP—showedany bias towards white-note tonics over black-note ton-ics; both the AP and non-AP groups (though not thequasi-AP group) showed a slight and significant biastowards major-mode keys. Thus, AP and non-AP lis-teners seem very similar in their use of distributionalinformation in key-finding.
Finally, despite the rather low level at which our par-ticipants’ key judgments matched the generating keys,
Pitch-Class Distribution and Key Identification 209
15Table 2 also shows the subject’s second most popular key for eachmelody. It can be seen that, in 6 of the 10 cases, the second-most pop-ular key was the generating key.
16If that is the case, one might wonder why participants usuallystopped the melody before it ended on the timed experiment. Butthis may be because they thought they were supposed to stop themelody before it ended.
Music2503_02 1/9/08 2:24 PM Page 209

it seems clear that they made some use of pitch-classdistribution in their key judgments. The match betweenparticipants’ judgments and the generating keys wasmuch greater than chance. Thus, while pitch-class dis-tribution does not completely determine key identifi-cation, it is at least part of the story. A question thenarises as to how this distributional component of keyperception can best be modeled. We first tried a verysimple probabilistic model, first proposed in Temperley(2007); this model matched the participants’ most pop-ular judgments on 83.3% of our melodies. Attempts toimprove the probabilistic model’s performance—byignoring a segment of the melody at the beginning orend, incorporating a bias for major-mode keys, consid-ering scale-degree “transitions,” and adding a biastowards interpreting the first note as tonic—all failed toproduce any significant improvement over the origi-nal model. The probabilistic model also outperformedthe Krumhansl-Schmuckler model. (We should bearin mind, however, that the K-S model was really the“original” distributional model of key-finding andthe inspiration for Temperley’s probabilistic model;indeed, one might well regard the probabilistic modelsimply as a variant of the K-S model.) Thus, in model-ing the distributional component of key identification,the simple probabilistic model proposed here worksremarkably well and further improvement is difficultto achieve.
So what can we conclude about the distributional viewof key-finding? This is, in a sense, a question of whetherthe glass is half empty or half full. On the one hand,pitch-class distribution is clearly one component of key
identification; and this component can be modeled quitewell by a simple probabilistic model. On the otherhand, the fact that only slightly more than half of ourparticipants’ key judgments matched the predictions ofthe distributional view suggests that there is much moreto key identification than pitch-class distribution. Itseems clear that structural cues of some kind—cuesrelating to the ordering and temporal arrangement ofpitches—play a role in key perception. Current propos-als, however, are hardly adequate in describing whatthese structural factors might be. Clearly, one of thechallenges for future research will be to characterizemore adequately the structural factors that affect listen-ers’ perception of key, and to incorporate these factorsinto predictive, testable models.
Author Note
We wish to acknowledge the help of a number of peopleon this project. Andy Flowers wrote the Java interfaceused in our experiments. Benjamin Anderson, Sara Bal-lance, Zachary Cairns, Sarana Chou, Nathan Fleshner,Jenine Lawson, and Gardiner von Trapp helped us runthe experiment. And Elissa Newport provided valuableadvice on experimental design and statistics. Any flawswith any aspect of the project, however, are entirely ourresponsibility.
Correspondence conerning this article should beaddressed to David Temperley, Eastman School ofMusic, 26 Gibbs St., Rochester, NY, 14604 USA; E-MAIL:[email protected]
210 David Temperley and Elizabeth West Marvin
References
AUHAGEN, W. (1994). Experimentelle Untersuchungen zur
auditiven Tonalitätbestimmung in Melodien. Kassel: Gustav
Bosse Verlag.
BHARUCHA, J. J. (1984). Anchoring effects in music: The
resolution of dissonance. Cognitive Psychology, 16, 485-518.
BHARUCHA, J. J., & STOECKIG, K. (1986). Reaction time and
musical expectancy: Priming of chords. Journal of
Experimental Psychology: Human Perception and Performance,
12, 403-410.
BROWNE, R. (1981). Tonal implications of the diatonic set. In
Theory Only, 5, 3-21.
BROWN, H. (1988). The interplay of set content and temporal
context in a functional theory of tonality perception. Music
Perception, 11, 371-407.
BROWN, H., BUTLER, D., & JONES, M. R. (1994). Musical and
temporal influences on key discovery. Music Perception, 11,
371-407.
BUTLER, D. (1989). Describing the perception of tonality in
music: A critique of the tonal hierarchy theory and a proposal
for a theory of intervallic rivalry. Music Perception, 6,
219-242.
CASTELLANO, M. A., BHARUCHA, J. J., & KRUMHANSL, C. L.
(1984). Tonal hierarchies in the music of North India. Journal
of Experimental Psychology: General, 113, 394-412.
CHEW, E. (2002). The spiral array: An algorithm for determining
key boundaries. In C. Anagnostopoulou, M. Ferrand, & A.
Smaill (Eds.), Music and artificial intelligence (pp. 18-31).
Berlin: Springer.
Music2503_02 1/9/08 2:24 PM Page 210

COHEN, A. J. (1991). Tonality and perception: Musical scales
primed by excerpts from the Well-Tempered Clavier of J. S.
Bach. Psychological Research, 53, 305-314.
CREEL, S. C., & NEWPORT, E. L. (2002). Tonal profiles of
artificial scales: Implications for music learning. In
C. Stevens, D. Burnham, G. McPherson, E. Schubert, &
J. Renwick (Eds.), Proceedings of the 7th International
Conference on Music Perception and Cognition (pp. 281-284).
Sydney, Australia: Causal Productions.
CUDDY, L. L. (1997). Tonal relations. In I. Deliege & J. Sloboda
(Eds.), Perception and cognition of music (pp. 329-352).
London: Taylor & Francis.
CUDDY, L. L., COHEN, A. J., & MEWHORT, D. J. K. (1981).
Perception of structure in short melodic sequences. Journal of
Experimental Psychology: Human Perception and Performance,
7, 869-883.
CUDDY, L. L., COHEN, A. J., & MILLER, J. (1979). Melody
recognition: The experimental application of rules. Canadian
Journal of Psychology, 33, 148-157.
CUDDY, L. L., & LUNNEY, C. A. (1995). Expectancies
generated by melodic intervals: Perceptual judgments of
melodic continuity. Perception and Psychophysics, 57, 451-62.
DEUTSCH, D., HENTHORN, T, MARVIN, E. W., & XU, H.
(2006). Absolute pitch among American and Chinese
conservatory students: Prevalence differences and evidence
for a speech-related critical period. Journal of the Acoustical
Society of America, 119, 719-722.
GREGERSEN, P., KOWALSKY, E., KOHN, N. & MARVIN, E. W.
(2001). Early childhood musical education and predisposition
to absolute pitch: Teasing apart genes and environment.
American Journal of Medical Genetics, 98, 280-282.
HURON, D. (1999). Music research using Humdrum: A user’s
guide. Stanford, California: Center for Computer Assisted
Research in the Humanities.
HURON, D., & PARNCUTT, R. (1993). An improved model of
tonality perception incorporating pitch salience and echoic
memory. Psychomusicology, 12, 154-171.
JANATA, P., & REISBERG, D. (1988). Response-time measures as
a means of exploring tonal hierarchies. Music Perception, 6,
161-172.
KRUMHANSL, C. L. (1990). Cognitive foundations of musical
pitch. New York: Oxford University Press.
KRUMHANSL, C. L., & KESSLER, E. J. (1982). Tracing the
dynamic changes in perceived tonal organization in a spatial
representation of musical keys. Psychological Review, 89, 334-
368.
LEMAN, M. (1995). Music and schema theory. Berlin: Springer.
LERDAHL, F. (2001). Tonal pitch space. Oxford: Oxford
University Press.
LEVITIN, D. J., & ROGERS, S. E. (2005). Absolute pitch:
Perception, coding, and controversies. Trends in Cognitive
Sciences, 9, 26-33.
LONGUET-HIGGINS, H. C., & STEEDMAN, M. J. (1971). On
interpreting Bach. Machine Intelligence, 6, 221-241.
MARVIN, E. W. (1997). Tonal/Atonal: Cognitive strategies for
recognition of transposed melodies. In J. Baker, D. Beach,
and J. Bernard (Eds.), Music theory in concept and practice
(pp. 217-236). Rochester: University of Rochester Press.
MARVIN, E. W., & BRINKMAN, A. (2000). The effect of key
color and timbre on absolute-pitch recognition in musical
contexts. Music Perception, 18, 111-137.
MATSUNAGA, A., & ABE, J. (2005). Cues for key perception of a
melody: Pitch set alone? Music Perception, 23, 153-164.
MIYAZAKI, K. (1989). Absolute pitch identification: Effects of
timbre and pitch region. Music Perception, 7, 1-14.
MIYAZAKI, K. (1990). The speed of musical pitch identification
by absolute-pitch possessors. Music Perception, 8, 177-188.
ORAM, N., & CUDDY, L. L. (1995). Responsiveness of Western
adults to pitch-distributional information in melodic
sequences. Psychological Research, 57, 103-118.
SAFFRAN, J. R., & GRIEPENTROG, G. J. (2001). Absolute pitch
in infant auditory learning: Evidence for developmental
reorganization. Developmental Psychology, 37, 74-85.
SAFFRAN, J.R., JOHNSON, E. K., ASLIN, R., & NEWPORT, E.
(1999). Statistical learning of tone sequences by human
infants and adults. Cognition, 70, 27-52.
SCHAFFRATH, H. (1995). The Essen Folksong Collection (D. Huron,
Ed.). Stanford, CA: Center for Computer–Assisted Research
in the Humanities.
SCHMUCKLER, M. (1989). Expectation and music: Investigation
of melodic and harmonic processes. Music Perception, 7,
109-150.
SCHMUCKLER, M., & TOMOVKSI, R. (2005). Perceptual tests of
an algorithm for musical key-finding. Journal of Experimental
Psychology, 31, 1124-1149.
SHMULEVICH, I., & YLI-HARJA, O. (2000). Localized key-
finding: Algorithms and applications. Music Perception, 17,
65-100.
SMITH, N. A., & SCHMUCKLER, M. A. (2004). The perception
of tonal structure through the differentiation and
organization of pitches. Journal of Experimental Psychology:
Human Perception and Performance, 30, 268-286.
TAKEUCHI, A. H., & HULSE, S. H. (1993). Absolute pitch.
Psychological Bulletin, 113, 345-61.
TAKEUCHI, A. H., & HULSE, S. H. (1991). Absolute-pitch
judgments of black- and white-key pitches. Music Perception,
9, 27-46.
TEMPERLEY, D. (2001). The cognition of basic musical structures.
Cambridge, MA: MIT Press.
TEMPERLEY, D. (2007). Music and probability. Cambridge, MA:
MIT Press.
TERHARDT, E., & SEEWANN, M. (1983). Aural key
identification and its relationship to absolute pitch. Music
Perception, 1, 63-83.
Pitch-Class Distribution and Key Identification 211
Music2503_02 1/9/08 2:24 PM Page 211

TOIVIAINEN, P., & KRUMHANSL, C. L. (2003). Measuring and
modeling real-time responses to music: The dynamics of
tonality induction. Perception, 32, 741-766.
VOS, P. G. (1999). Key implications of ascending fourth
and descending fifth openings. Psychology of Music,
27, 4-18.
VOS, P. G. (2000). Tonality induction: Theoretical problems
and dilemmas. Music Perception, 17, 403-416.
VOS, P. G., & VAN GEENEN, E. W. (1996). A parallel-
processing key-finding model. Music Perception, 14, 185-224.
WEST, R. J., & FRYER, R. (1990). Ratings of suitability of probe
tones as tonics after random orderings of notes of the
diatonic scale. Music Perception, 7, 253-258.
YOSHINO, I., & ABE, J. (2004). Cognitive modeling of key
interpretation in melody perception. Japanese Psychological
Research, 46, 283-297.
212 David Temperley and Elizabeth West Marvin
Music2503_02 1/9/08 2:24 PM Page 212