Embed Size (px)
Citation preview
Pipelining in Challenging Areas(Offshore Pipeline Applications)Presentation to the PHMSA R&D ForumMarriot Crystal City ● Thursday, June 25, 2009Presentation by Dr. Chris Alexander (Stress Engineering Services, Inc.)
Slide 2
Presentation Topics• Types of subsea damage
Dropped objectsAnchor snagsExcessive current and resulting uplift
• Role of analysis and testing • Developing a proactive response• Identification of knowledge gaps
Slide 3
Prior Subsea Pipeline Damage Studies
• Williams Gas Pipeline (and Midstream)• ConocoPhillips• BP• Shell Pipeline Company• ExxonMobil Pipeline Company• Chevron• Devon Energy• Marathon• Enbridge

Slide 4
-154000
-152000
-150000
-148000
-146000
-144000
-142000
-140000
-138000
1394000 1396000 1398000 1400000 1402000 1404000 1406000 1408000 1410000
X-Position (feet)
Y-P
ositi
on (f
eet)
As-laid positionDisplaced position
Analysis TechniquesUtilizing Survey Data
212
212 )()( yyxxa −+−=
223
223 )()( yyxxb −+−=
213
213 )()( yyxxc −+−=
abcbaq
2
222 −+=
212 q
cR−
=
a b
c
R
1
2
3
X
Y
Nodal points
a b
c
R
1
2
3
X
Y
Nodal points
RD2
=εRr
D = 2r
Nomenclaturee – Bending strainD – Diameter of piper – Radius of curvature (centerline)R – Radius of mandrel
Use survey data to determine membrane and bending strains using elongation and curvature calculations. Use API RP 1111 for establishing in-place bending strain limits.
Slide 5
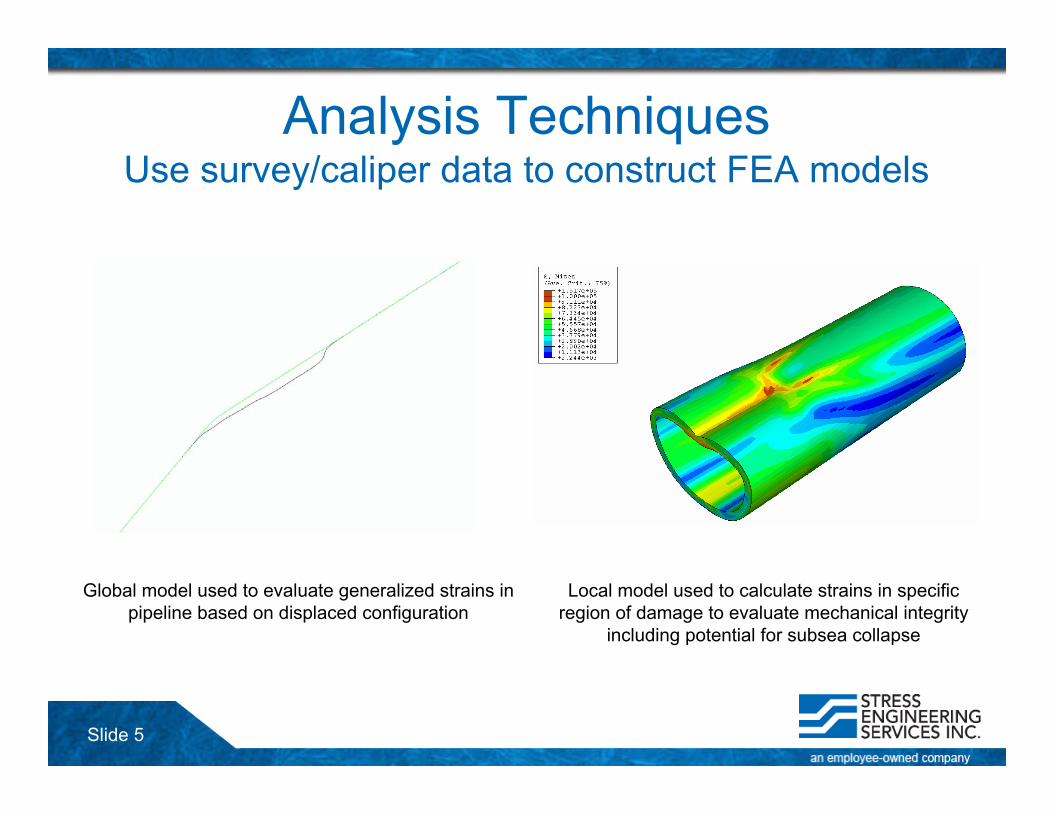
Analysis TechniquesUse survey/caliper data to construct FEA models
Global model used to evaluate generalized strains in pipeline based on displaced configuration
Local model used to calculate strains in specific region of damage to evaluate mechanical integrity
including potential for subsea collapse
Slide 6
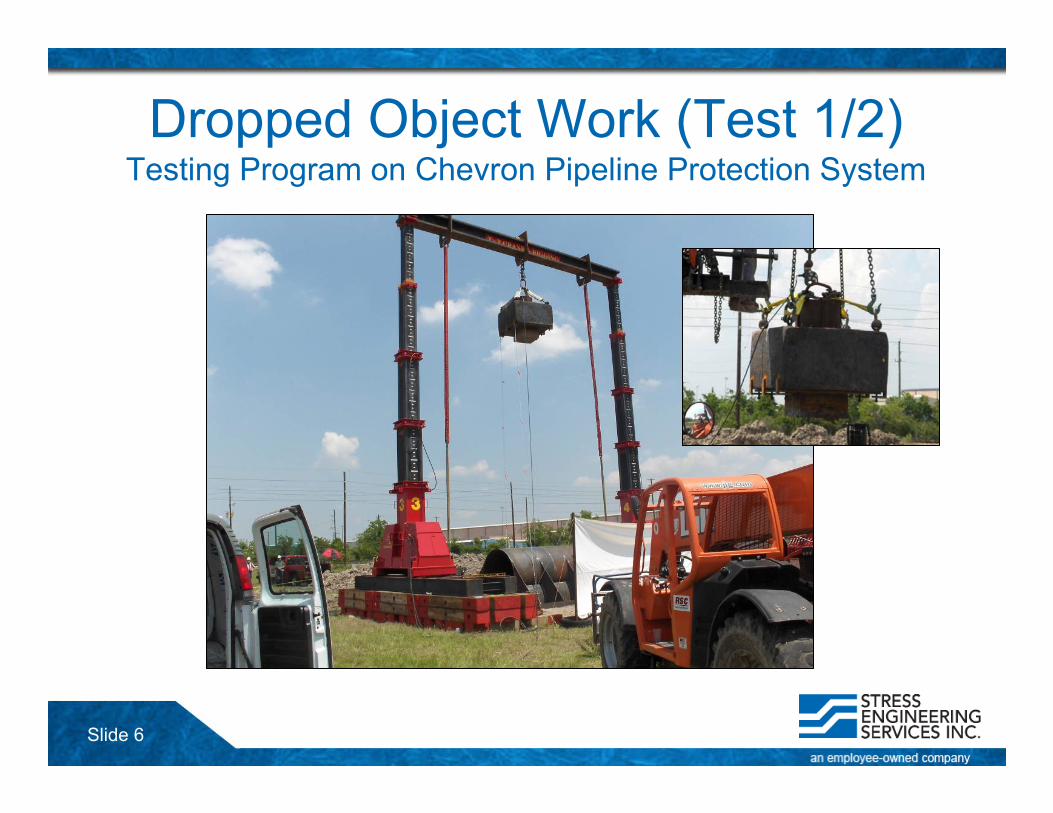
Dropped Object Work (Test 1/2)Testing Program on Chevron Pipeline Protection System
Slide 7
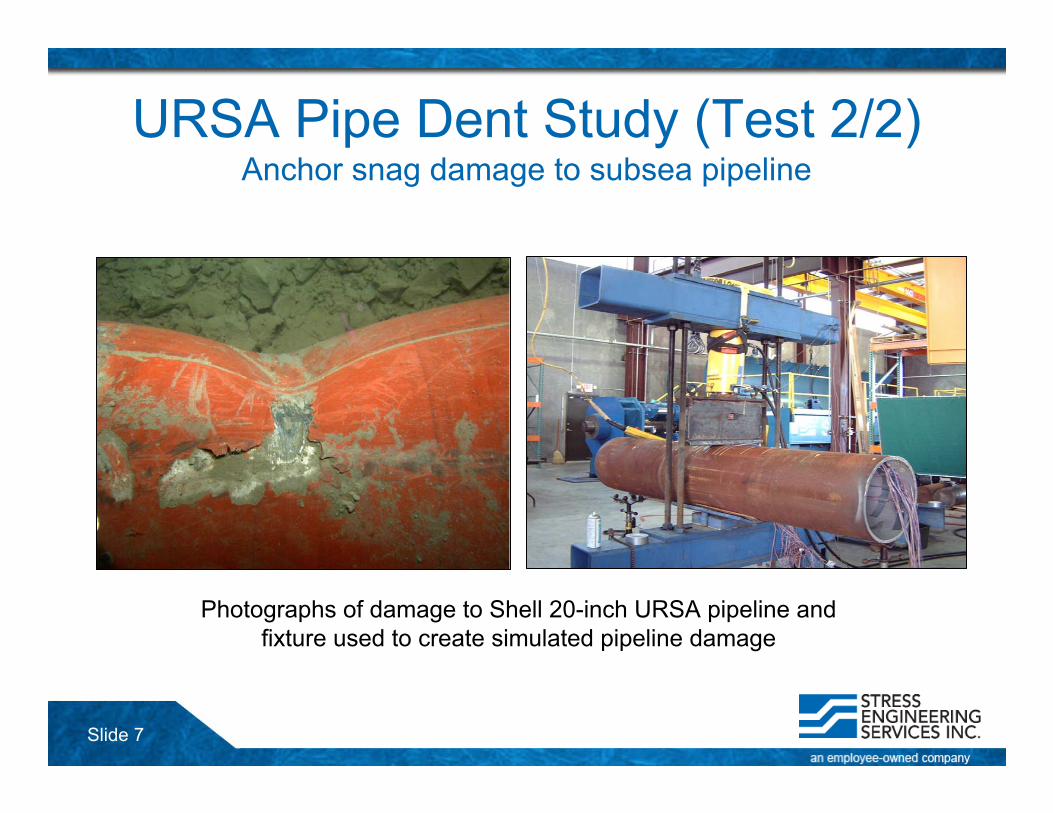
URSA Pipe Dent Study (Test 2/2)Anchor snag damage to subsea pipeline
Photographs of damage to Shell 20-inch URSA pipeline and fixture used to create simulated pipeline damage
Slide 8
URSA Pipe Dent Study (Test 2/2)Anchor snag damage to subsea pipeline
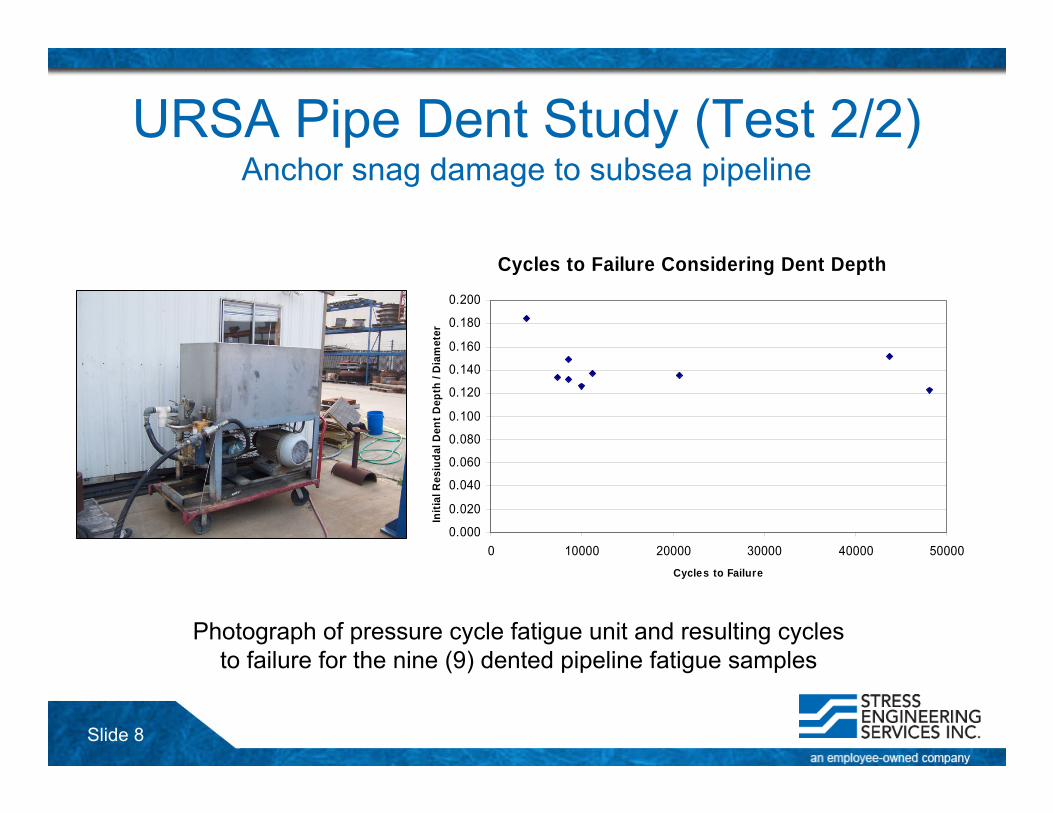
Photograph of pressure cycle fatigue unit and resulting cycles to failure for the nine (9) dented pipeline fatigue samples
Cycles to Failure Considering Dent Depth
0.000
0.020
0.040
0.060
0.080
0.100
0.120
0.140
0.160
0.180
0.200
0 10000 20000 30000 40000 50000Cycles to Failure
Initi
al R
esiu
dal D
ent D
epth
/ D
iam
eter
Slide 9
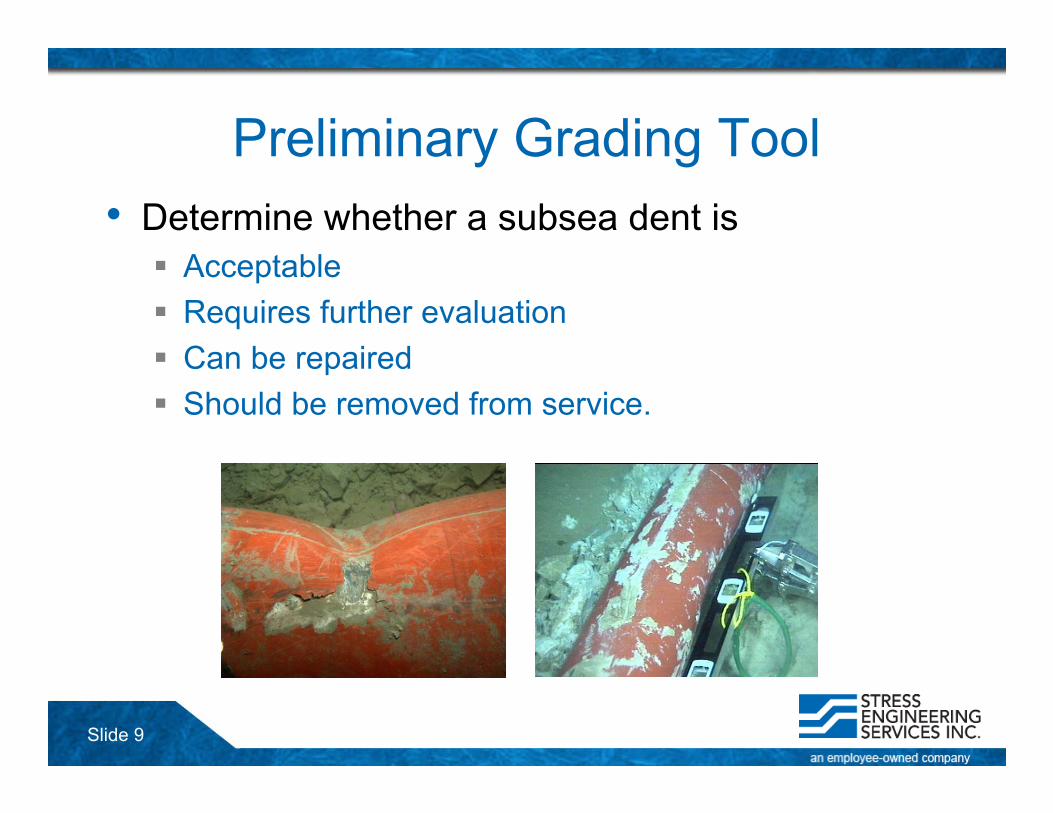
Preliminary Grading Tool• Determine whether a subsea dent is
AcceptableRequires further evaluationCan be repairedShould be removed from service.

Slide 10
Example Assessment FlowchartDefect Data Collection
Collect available information on defects including depth, length, profile, interaction with other features such as welds..
Feature IdentificationMake special note of those features that can reduce the fatigue life of dents. Common examples include corrosion, seam welds, girth welds, and double dents.
Calculate ParametersUsing available data, calculate the severity of the defects using parameters such as strain, curvature, or other related expressions.
Evaluate Defects
NOTE: The accuracy of the evaluation is based on the availability of information both in terms of Defect Data Collection and Performance Data.
Quantitative AssessmentEstimate design cycles for the defects under evaluation using the Performance Data. This effort should include FRFs that will reduce defect fatigue life.
Acquire Performance Data
Using previous and/or available performance data based on experimental or finite element efforts, develop expressions to determine the fatigue life for plain dents. It is preferable that the effects of other features such as seam and girth welds be included in this process. These are identified as Fatigue Reduction Factors (FRF).
MostAccurate
Final EvaluationEstimate the remaining life using a cumulative damage model and information from prior cyclic pressure history of the pipeline.
Approximate Assessment
If only limited measurement data are available from the Defect Data Collection phase (e.g. only have dent depth and length), an estimate of fatigue can be made but not without penalty. This approach should NOT be used to estimate remaining fatigue life. If this approach is used, disclaimers are required.
Qualitative Assessment
If limited very measurement data is available from the Data Collection phase (e.g. only have dent depth), it is best to only rank defect severity. This is useful for providing guidance in order of response (e.g. dig response).
This approach should NOT be used to estimate remaining fatigue life. If this approach is used, disclaimers are required.
LeastAccurate
(Provided only as an example from a prior Stress Engineering study)
Slide 11
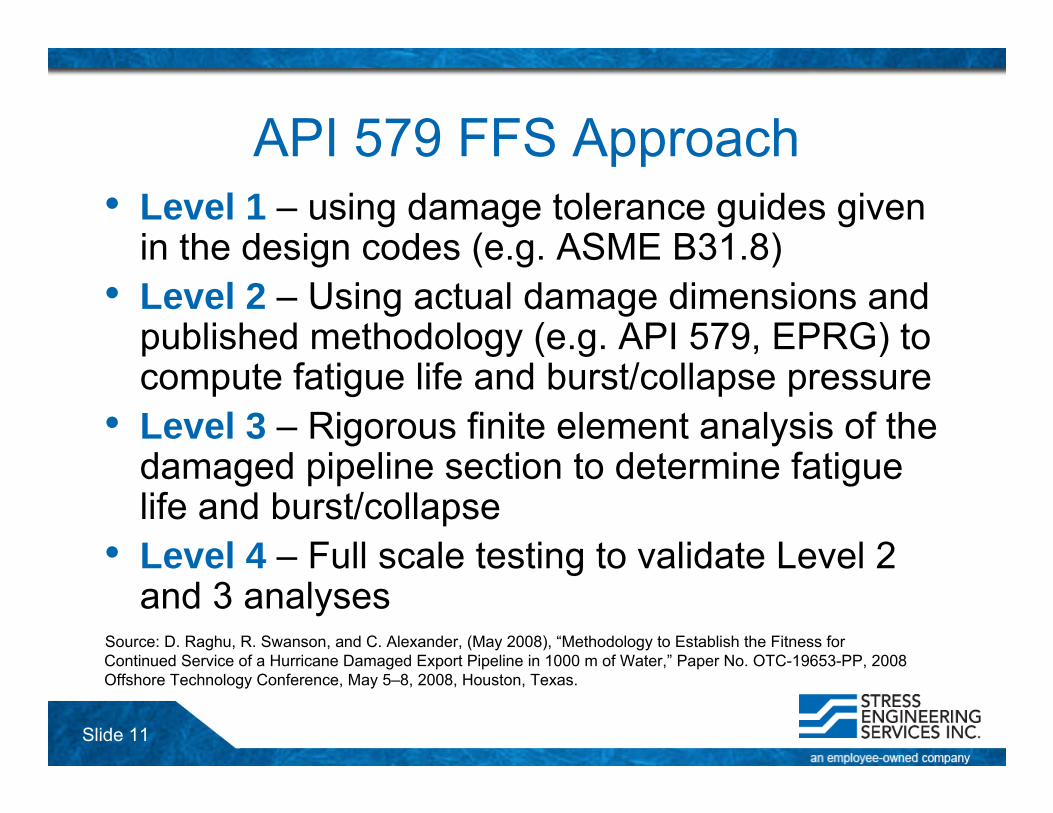
API 579 FFS Approach• Level 1 – using damage tolerance guides given
in the design codes (e.g. ASME B31.8)• Level 2 – Using actual damage dimensions and
published methodology (e.g. API 579, EPRG) to compute fatigue life and burst/collapse pressure
• Level 3 – Rigorous finite element analysis of the damaged pipeline section to determine fatigue life and burst/collapse
• Level 4 – Full scale testing to validate Level 2 and 3 analyses
Source: D. Raghu, R. Swanson, and C. Alexander, (May 2008), “Methodology to Establish the Fitness for Continued Service of a Hurricane Damaged Export Pipeline in 1000 m of Water,” Paper No. OTC-19653-PP, 2008 Offshore Technology Conference, May 5–8, 2008, Houston, Texas.
Slide 12
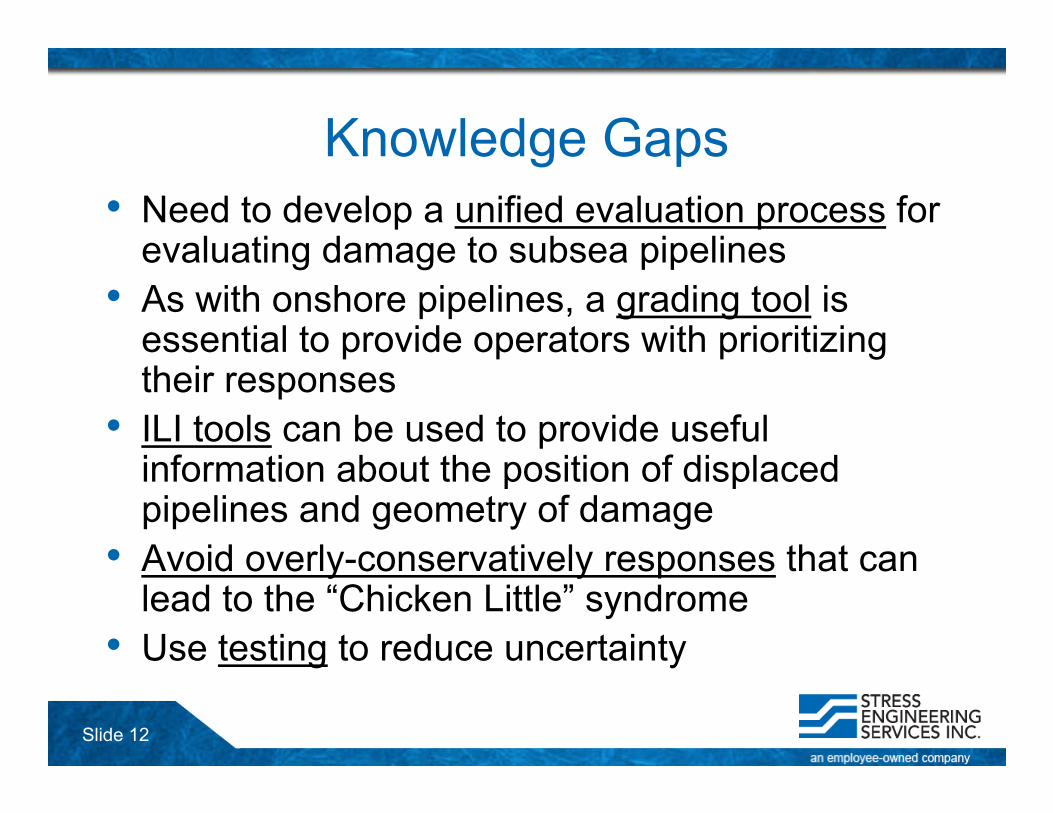
Knowledge Gaps• Need to develop a unified evaluation process for
evaluating damage to subsea pipelines• As with onshore pipelines, a grading tool is
essential to provide operators with prioritizing their responses
• ILI tools can be used to provide useful information about the position of displaced pipelines and geometry of damage
• Avoid overly-conservatively responses that can lead to the “Chicken Little” syndrome
• Use testing to reduce uncertainty