Embed Size (px)
Citation preview

Pipeline and Hazardous Materials Safety Administration Docket Number PHMSA 2008-2085 TransCanada Keystone Pipeline, L.P. Application to Design, Construct and Operate the Keystone XL Oil Pipeline at 80% Specified Minimum Yield Strength (SMYS) Response to Concerned Citizens of Eastern Montana Comment 2008-0285-009.1 April 3, 2009
Page 1 of 1 Pipelines are one of the safest forms of crude oil transportation and provide a cost effective and safe mode of transportation for oil on land. Overland transportation of oil by truck or rail produces higher risk of injury to the general public than the proposed pipeline (USDOT 2002). The Keystone XL Pipeline system will be designed, constructed and maintained in a manner that meets or exceeds industry standards. Historically, the most significant risk associated with operating a crude oil pipeline is the potential for third-party excavation damage. The pipeline will be built with deeper cover than standard requirements and within an approved right-of-way (ROW). Warning signs will be installed at all road, railway, and water crossings. Keystone will mitigate third-party excavation risk by implementing a comprehensive Integrated Public Awareness program focused on education and awareness in accordance with 49 CFR 195.440 and API RP1162. Further, Keystone will complete and document regular visual inspections of the ROW as per 49 CFR 195.412 and monitor activity in the right-of-way to mitigate unauthorized trespass or access. Keystone will have maintenance, inspection, and repair programs that maximize the integrity of its pipeline. Keystone's annual Pipeline Maintenance Program (PMP) will include routine aerial patrol of the ROW, periodic inline inspections and cathodic protection system readings to ensure facilities are reliable. Data collected in each year of the PMP will be fed back into the decision making process for the development of the following year's program. In addition, the pipeline system will be remotely monitored 24 hours a day, 365 days a year from the oil control center using leak detection systems and supervisory control and data acquisition (SCADA). Prior to operation, Keystone will have an Emergency Response Program in place to manage a variety of events in accordance with 49 CFR 194.

Pipeline and Hazardous Materials Safety Administration Docket Number PHMSA 2008-2085 TransCanada Keystone Pipeline, L.P. Application to Design, Construct and Operate the Keystone XL Oil Pipeline at 80% Specified Minimum Yield Strength (SMYS) Response to Mr. Earnest Fellows Comment 2008-0285-0013 April 3, 2009
Page 1 of 1 1. “why not have it above ground where we can see a leak sooner” Keystone Response: In accordance with 49 CFR 195.248(a), all pipe must be buried so that it is below the level of cultivation. Keystone XL pipeline will be equipped with a leak detection system as described in section 2.9 of the Application. The system will be designed in accordance with 49 CR 195.444 and API 1130. 2. “the oil in the pipe will be heated” Keystone Response: The product transported will not be heated or treated once it enters the pipeline system. 3. “108o and up will kill grass” Keystone Response: TransCanada Keystone conducted a thermal study for the Keystone pipeline currently under construction and is attached for reference. A similar study is underway for the Keystone XL pipeline. It is anticipated based on the work done in the previous studies (filed with the Department of State); the operations of this pipeline will not result in significant overall effects to the surficial soil temperatures, crops and vegetation. 4. “Keystone wants to raise the pump pressure to 1660 lbs per sq in” Keystone Response: TransCanada Keystone it is not requesting an increase to the maximum operating pressure of the pipeline. At maximum throughput the pipeline will operate with pump station discharge pressures of no higher than 1440 psig. 5. “Maybe Keystone needs a pump every 10 miles at 550 lbs instead of every 60 miles” Keystone Response: Pump station locations depend on factors such as local infrastructure (for access and power), pipeline hydraulics and the analysis of frictional losses related to oil flow.

Pipeline and Hazardous Materials Safety Administration Docket Number PHMSA 2008-2085 TransCanada Keystone Pipeline, L.P. Application to Design, Construct and Operate the Keystone XL Oil Pipeline at 80% Specified Minimum Yield Strength (SMYS) Response to Pipeline Safety Trust Comment 2008-0285-008.1 April 3, 2009
Page 1 of 2
1. “Reporting of Over-pressurization Events - all exceedances of 110% of MOP as described in 49 CFR 195.55 (a) (4) should be required to be reported to PHMSA as required in 49 CFR 195.56 without exception…” Response: TransCanada Keystone believes the requirements of 49 CFR §191.23(5) address this concern. 2. “Elimination of over-pressure failure possibility caused by SCADA operator - provide an analysis to PHMSA that shows that under their operating plans their SCADA operators will not have the ability to take actions that would cause the pipeline to exceed the allowed pressure as defined in 49 CFR 195.406…”
Response: TransCanada Keystone believes the requirements in Condition 26, 27 and 30 of the Keystone Pipeline Special Permit (the design bases for the Keystone XL pipeline) address this concern. 3. “Require 100% of the girth welds to be inspected with nondestructive methods - 100% nondestructive inspection of girth welds be required as part of this special permit, and that the inspection records be required to be kept during the life of the pipeline…” Response:
Please refer to Application page 12 Section 2.4. TransCanada Keystone will inspect 100% all girth welds. In accordance with 49 CFR § 195.266, a complete record showing the total number of girth welds and the number nondestructively tested, including the number rejected and the disposition of each rejected weld must be maintained by the operator involved for the life of the facility. 4. “Proper Surge Pressure Analysis and Protections - PHMSA is provided a comprehensive surge pressure analysis to review to ensure that surge has been properly engineered for and that protections are well designed and placed…”

Page 2 of 2 Pipeline Safety Trust Response
Response: TransCanada Keystone will conduct a surge study as part of the Keystone XL detailed design phase. The surge analysis will be consistent with those already undertaken for the Keystone pipeline.
5. “Internal Corrosion Program – To ensure added protection at these increased operating pressures we ask that PHMSA as part of this special permit require the use of cleaning pigs at regular intervals, (to be determined by PHMSA), with proper analysis of the material removed by the cleaning pigs, be added to the pipeline’s overall corrosion protection program…”
Response: TransCanada Keystone believes the requirements in Condition 35 of the Keystone Pipeline Special Permit (the design basis for the Keystone XL pipeline) address this concern. 6. “Incorporation of Additional Safeties - all of these additional safety items that go beyond current regulatory requirements, which PHMSA finds to be consistent with pipeline safety, be incorporated as requirements of this special permit…” Response: As discussed with PHMSA, TransCanada Keystone design basis for the Keystone XL pipeline is the Keystone Pipeline Special Permit conditions, which exceed current regulatory requirements.
7. “Pipelines and Informed Planning Alliance (PIPA) Recommended Practices – TransCanada to incorporate the final recommended practices from the PIPA that apply to pipeline operators into their public education program, and that measurement of the use of these practices be incorporated into the measurement requirements of their 1162 program…” Response: TransCanada Keystone is a participant of the PIPA and will review the final recommended practices for applicability to the Keystone XL project and will incorporate them if applicable into its Integrated Public Awareness Program.

Pipeline and Hazardous Materials Safety Administration Docket Number PHMSA 2008-2085 TransCanada Keystone Pipeline, L.P. Application to Design, Construct and Operate the Keystone XL Oil Pipeline at 80% Specified Minimum Yield Strength (SMYS) Response to Sierra Club and Plains Justice Comment 2008-0285-006.1 April 3, 2009
Page 1 of 3 General: TransCanada Keystone it is not requesting an increase to the maximum operating pressure of the pipeline. At maximum throughput the pipeline will operate with pump station discharge pressures of no higher than 1440 psig.
Paragraph #4 Response:
Please refer to Keystone XL Special Permit Application page 23. “Under Section 60118 of the Pipeline Safety Act, PHMSA may grant a special permit in relation to any regulatory requirement if granting the waiver is “not inconsistent with pipeline safety.” 49 U.S.C. § 60118. The special permit that Keystone seeks in this petition is not inconsistent with pipeline safety. As demonstrated in the chart included in Appendix D, the standards that Keystone will use to design, construct and operate the Keystone XL Pipeline will meet or exceed the requirements of DOT regulations and will result in a higher degree of pipeline safety than the minimum safety standards provided in the regulations.”
Bullet #1 Response:
In certain areas, the pipeline will be subject to additional risks of potential damage. For instance, above-ground facilities must be able to withstand greater variations in temperature than below-ground facilities. Pipe pulled or pushed through the ground in drilling or boring operations (below roads, railroads and navigable waterways) must be able to withstand the additional stresses caused by those activities. And, in more heavily populated areas, where other underground utilities – such as water, sewer, natural gas, electric and telecommunications facilities – are prevalent, additional mitigation beyond increased depth of cover is required to maintain pipeline safety.
Because it is difficult to demonstrate increased protection from the additional risks in these areas, TransCanada has not sought to apply the updated standard where they may occur. The result is a pipe that has safety characteristics appropriate to mitigate risk of failure in both urban and rural areas, below waterways and below fields, over valuable aquifers and in established industrial areas. Bullet # 2 Response: The Keystone XL pipeline will be outfitted with Pressure Control and Over-Pressure Protection Systems which provide two independent levels of protection for the pipeline and associated facilities. The Pressure Control System primarily keeps the pump station discharge pressures within acceptable boundaries under MOP by modulating one pump speed at each pump station, complemented with protective logic that takes

Page 2 of 3 Sierra Club and Plains Justice Comment Response
corrective action when pump station discharge pressures move outside of acceptable boundaries. The Pressure Control System is designed to be reliable and failsafe. In addition, the Over-Pressure Protection System provides a second level of protection from an over-pressure condition (up to 110% MOP) derived from sudden events such as a single station outage or system-wide shut-down. Bullet #3 Response: Please refer to Application page 12 Section 2.4. TransCanada Keystone will inspect 100% of all girth welds. In accordance with 49 CFR § 195.266, a complete record showing the total number of girth welds and the number nondestructively tested, including the number rejected and the disposition of each rejected weld must be maintained by the operator involved for the life of the facility. In addition, PHMSA conducted 20 separate site visits to the Keystone pipeline construction in 2008 where welding, inspection and other construction activities were observed. The circumference of each field weld is 100% inspected as dictated in the TransCanada specification. Bullet #4 Response: Keystone XL will transport crude oils similar to those already being transported by other major cross border oil pipeline systems into the United States. The commodity specification is outlined in the Keystone XL Special Permit Application, Appendix G Clause 1.5 Page 7 & 8. Keystone has evaluated the range of possible products which may be transported and determined it does not meet the sour service criteria defined in NACE MR0175 Part 2 Annex C. Furthermore, please also find attached response to the Department of State data request outlining typical chemical composition of crude oil streams generated from the oil sands. Bullet #5 Response: Keystone’s proposed depth of cover exceeds all federal requirements. During operations, Keystone will conduct periodic visual inspection of the right-of-way, identify potential areas of concern and remediate them accordingly. Bullet #6 Response: Please refer to Keystone XL Special Permit Application Appendix E. Bullet #7 Response: All pipe purchased for the Keystone XL pipeline must meet the requirements in API 5L 44th Edition regardless of supplier source (domestic/foreign). All manufacturing mills and steel source suppliers involved in pipe production for the project will undergo a formal prequalification and qualification

Page 3 of 3 Sierra Club and Plains Justice Comment Response
program. The TransCanada pipe mill qualification process assures that each pipe mill is certified by the API 5L governing body to fabricate steel pipe for pipeline transportation systems. All manufacturers of steel, skelp and pipe must implement a quality management system in conformance with international standards (ISO and API). In addition, Keystone implements continuous surveillance during the entire pipe manufacturing process. Bullet #8 Response: Keystone is currently updating the as-filed (with PHMSA) emergency response and oil spill clean up plan in accordance with the requirements in 49 CFR 194 for this pipeline system.

Pipeline and Hazardous Materials Safety Administration Docket Number PHMSA 2008-2085 TransCanada Keystone Pipeline, L.P. Application to Design, Construct and Operate the Keystone XL Oil Pipeline at 80% Specified Minimum Yield Strength (SMYS) Response to Western Organization of Resource Councils Comment 2008-0285-007.1 April 3, 2009
Page 1 of 1 The comments in this submission are reflective of those submitted by the Pipeline Safety Trust and by Sierra Club and Plains Justice. Please refer to the responses prepared for the Pipeline Safety Trust comment 2008-0285-008.1 and for Sierra Club and Plains Justice comment 2008-0285-006.1.

Pipeline and Hazardous Materials Safety Administration Docket Number PHMSA 2006-26617 TransCanada Keystone Pipeline, L.P. Application to Design, Construct and Operate the Keystone XL Oil Pipeline at 80% Specified Minimum Yield Strength (SMYS) Response to United Steel Workers Comment 2008-0285-0015.1 April 13, 2009
Page 1 of 2 General: TransCanada Keystone it is not requesting an increase to the maximum operating pressure of the pipeline. At maximum throughput the pipeline will operate with pump station discharge pressures of no higher than 1440 psig.
Bullet #1 Response:
The Keystone XL pipeline will be outfitted with Pressure Control and Over-Pressure Protection Systems which provide two independent levels of protection for the pipeline and associated facilities. The Pressure Control System primarily keeps the pump station discharge pressures within acceptable boundaries under MOP by modulating one pump speed at each pump station, complemented with protective logic that takes corrective action when pump station discharge pressures move outside of acceptable boundaries. The Pressure Control System is designed to be reliable and failsafe. In addition, the Over-Pressure Protection System provides a second level of protection from an over-pressure condition (up to 110% MOP) derived from sudden events such as a single station outage or system-wide shut-down. The operations control systems are detailed in Section 2.9 of the Application.
Bullet #2 Response: Puncture resistance calculations are found in Appendix E of the Keystone XL Special Permit Application. The analysis was performed using the PRCI 244-9729 study “Reliability-based Prevention of Mechanical Damage to Pipelines” and Kiefner “Impact of 80%SMYS Operations on Resistance to Third Party Mechanical Damage”. Bullet #3 Response: Keystone XL will transport crude oils similar to those already being transported by other major cross border oil pipeline systems into the United States. The commodity specification is outlined in the Keystone XL Special Permit Application, Appendix G Clause 1.5 Page 7 & 8. Keystone has evaluated the range of possible products which may be transported and determined it does not meet the sour service criteria defined in NACE MR0175 Part 2 Annex C. Keystone has filed with the Department of State data request outlining typical chemical composition of crude oil streams generated from the oil sands, attachment submitted as part of the Sierra Club/Plains Justice 2008-0285-006.1 response to public comment.

Page 2 of 2 USW Comment Response
Bullet #4 Response:
In certain areas, the pipeline will be subject to additional risks of potential damage. For instance, above-ground facilities must be able to withstand greater variations in temperature than below-ground facilities. Pipe pulled or pushed through the ground in drilling or boring operations (below roads, railroads and navigable waterways) must be able to withstand the additional stresses caused by those activities. And, in more heavily populated areas, where other underground utilities – such as water, sewer, natural gas, electric and telecommunications facilities – are prevalent, additional mitigation beyond increased depth of cover is required to maintain pipeline safety.
Because it is difficult to demonstrate increased protection from the additional risks in these areas, TransCanada has not sought to apply the updated standard where they may occur. The result is a pipe that has safety characteristics appropriate to mitigate risk of failure in both urban and rural areas, below waterways and below fields, over valuable aquifers and in established industrial areas. Bullet #5 Response: All pipe purchased for the Keystone XL pipeline must meet the requirements in API 5L 44th Edition regardless of supplier source (domestic/foreign). All manufacturing mills and steel source suppliers involved in pipe production for the project will undergo a formal prequalification and qualification program. The TransCanada pipe mill qualification process assures that each pipe mill is certified by the API 5L governing body to fabricate steel pipe for pipeline transportation systems. All manufacturers of steel, skelp and pipe must implement a quality management system in conformance with international standards (ISO and API). In addition, Keystone implements continuous surveillance during the entire pipe manufacturing process.

DFPI OFmr;SPORi/.iu. Ju„e25,2009 Dockets of Operations ' " U. S. Department of Transportation M-30 West Building Ground Floor > ' ''0 A Room W12-140 1200 New Jersey Ave., SE Washington, D. C, 20590
Please help the farmers and ranchers of eastern Montana and not approve the construction of this unsafe crude oil pipeline. If it can't be buiU right don't build it. The following article will be published in the Billings Gazette Saturday.
Sincerely
Wesley Y A Z S ^ S / / 440N. femdale Bigfork, MT 59911
Keystone Pipeline - Gold Mine or Environmental Disaster for Montana
The Governor wants the pipeline for the jobs, county commissioners want the pipeline for the property taxes and local businesses want the pipeline for the economic activity generated by the construction and operation of the pipeline.
The proposed 36-inch diameter, pipeline will operate at a pressure of 1500 psi or about twice the pressure of most crude oil pipelines and about 25 times the pressure in a city water distribution system. A fire hose connected to a city water supply can spray water a distance of 200 ft while a break in the pipeline could in theory spray oil a distance of 25 times 200 or 5000 ft. If a valve in the pipeline is closed too rapidly, a 300 psi pressure surge will be generated and the total pressure in the pipeline will be 1800 psi. Pipeline safety r^;ulations require that the wall thickness be 0.748 inch. The Keystone pipeline proposed for eastern Montana will have a wall thickness of 0.465 inch or about half that required by regulation. At a pressure of 1800 psi and a wall thickness of 0.465 inch, stress in the pipeline will be 70,000 psi which is equal to the yield stress of the steel and the pipeline will probably rupture. The highest pressure in the pipeline will occur \N ere the elevation is the lowest or at stream crossings. Having a simple operational error causing a major oil spill is unacceptable. Pressure surges in long pipelines are common and are generally caused by valve movement, check valves, pump startup, and power failure.
Pipeline safety regulations in both the U. S. and Canada require that the factor of safety (bursting stress divided by the operating stress) be not less than 2.0. So why is Keystone Pipeline proposing a safety factor of 1.2 for Montana? Apparently it is cheaper for Keystone Pipeline to pay for oil spill cleanup than to build a safe pipeline and prevent oil spills. It's like a fermer buying car tires for his truck because they are cheaper.

Operating at a pressure of 100 psi, he may be able to haul several loads on a smooth pavement but in the long run you know that there will be trouble down the road. This is equally true of the pipeline as over the 50-yr life of the project, corrosion will reduce the wall thickness of the pipeline and leaks and ruptures will become more fi'equent. If the pipe is made in China, there will also be quality control issues with the manufacturing of the pipe.
The original design using standard wall thickness pipe was economically feasible only when the price of crude oil was over $100 per barrel. Now that the price of crude oil is under $100 per barrel, the pipeline is apparently feasible only if Keystone Pipeline can use cheaper thin-walled pipe. If Keystone Pipeline's request to use thin-walled pipe is approved, they will end up with the gold mine and we will end up with an envirormiental disaster in our back yard.
This pipeline runs through our &mily homestead east of Circle for a distance of two miles and I am concerned that the pipeline will be substandard and unsafe to live near. When I get all the data on the pipeline, I plan to develop an unsteady-state computer model of the pipeline to see where the pipeline will rupture. Why? Because this is the type of work that I have been doing for the last 40 years and land owners should have this information before they sign an easement.
Wesley P. James Bigfork, MT

DFPi OF m;^::sppnwiON August 7,2009 Dockets Operations ' ' •' ^ U.S. Department of Transportation M-30 West Building Ground Floor 1 3 !U . v 21 Room W12-140 1200 New Jersey Avenue, SE Washington DC 20590
RE: TransCanada Keystone Pipeline
The Keystone pipeline runs through our femily homestead east of Circle, MT for a distance of two miles and I am concerned that the pipeline will be substandard and unsafe to live near. The pipeline crosses both Redwater Creek and Buffalo Spring Creek on our farm. Pipeline WaU Thickness is Inadequate
The proposed 36-inch diameter (D) pipeline will operate at a pressure (P) of 1500 psi or about twice the pressure of most crude oil pipelines and will have a wall thickness (t) of 0.465 inches. This gives an operating stress in the pipeline wall of
P * D / (2 * t) = 58,000 psi The yield stress of the steel is 70,000 psi and the yield pressure in the pipeline is
2 * 70,000 * 0.465 / 36 = 1800 psi The factor of safety for the pipeline is only
1?00/1500= 1,2 This maybe adequate for a gas pipeline but is not adequate for a crude oil pipeline for the follow reasons:
1. The pressure in a gas pipeline is provided by compressors while the pressure in a crude oil pipeline is provided by centrifugal pumps. The cut pressure (pressure at zero discharge) for a centrifugal pump is typically 30% greater than the operating pressure. If a valve in the discharge line is closed while the pumps are running, the pressure in the discharge line would increase to 1950 psi and the pipeline would fail.
2. Because the density of the crude oil is greater than the density of the gas, unsteady flow surges are greater in a crude oil pipeline. Some common causes of surges in a pipeline are pump startup, power failure, valve movement, column separation and air removal. Pressure surges as much as 300 psi can occur in this pipeline resulting in a total pressure of 2250 psi. The bursting pressure for this pipeline is 2070 psi.
3. A study of major Canadian pipeline ruptures (Jeglic, 2004) have found that during the first ten years of operation, stress cracking was the most conmion cause of pipeline ruptures while during the next ten years of op^ation, external corrosion was the most common cause of pipeline ruptures. Both causes of ruptures are time dependent and will be a major concern with the Keystone Pipeline because there is no extra steel in the walls of the pipe to compensate for pipeline deterioration. Research (Kiefher, 2001) has shown that a longitudinal stress crack 16 inches long and less than 1/16 inch deep will cause the pipeline to rupture at the normal operating pressure of 1500 psi.
A graphic representation of the pressure distribution in the pipeline is shown below where the vertical distance between the pipeline and the hydraulic grade line represents the pressure in the pipeline. The top figure represents the pressure in the pipeline under

normal operating conditions where the pressure varies fi-om 1500 psi at the upstream pumping plant on the right to some minimum value at a valve on the left located near the downstream pumping plant a distance of about 50 miles.
Hydraulic Grade Line t=0 s
4070 ft =1500psi
50 miles Keystone Pipeline
punq) on
4880 ft == 1800 psi
Hvdraulic Grade Line t=3 s
4070 ft =1500 psi
Valve closed
50 miles Keystone Pipeline
pump on

Hydraulic Grade Line t=93 s
4880 ft =1800 psi
5300 ft = 1950 psi
C
Valve closed
50 miles Keystone Pipeline
pump on
Hydraulic Grade Line 1=183 s
5720 ft =2100 psi
5300 ft = 1950 psi
b Valve closed
50 miles Keystone Pipeline
pun^ on
The second sketch represents the hydraulic grade line 3 seconds after a valve in the pipeline has been closed generating a 300 psi pressure surge in the pipeline. The pressure surge travels upstream at a velocity of about 3000 fps and reaches the upstream pumping plant in approximately 90 seconds. The discharge rate at the pump is zero and the pump is operating at the cut off pressure or 1950 psi. At t = 93 seconds the pressure surge is traveling downstream towards the valve. The last sketch shows the pressure distribution in the pipeline after the surge has reached the valve and is traveling upstream. The pressure in the pipeline exceeds the bursting pressure of the pipeline. To get a more

accurate description of the pressure distribution in the pipeline, a detailed imsteady state model of the pipeline will be required.
Spray Zone for a Pipeline Rupture Keystone pipeline will be operated a very high pressure and when the pipeline
ruptures, crude oil will discharge from the rupture onto the adjacent land. It is important that landowners understand the magnitude and extent that a pipeline rupture will have on their property.
Height (H) of a crude oil storage tank to give the same pressure (P) as in the pipeline (1500 psi)
H = p/y = 1500 * 144 / (62.4 * 0.85) = 4070 fl The velocity (V) that the crude oil will discharge from a rupture in the pipeline
V = C * (2g * H) 0.5 = 0.6 • (64.4 * 4070) ^ 0.5 = 300 fps = 200 mph
The discharge rate (q) of crude oil from the pipeline from a circular rupture of diameter (d)
d
in.
1*
2
3
4
Area
sqft
0.0055
0.0218
0.049
0.087
q
cu ft/sec
1.65
6.54
14.7
26.1
q
gpm
740
3940
6600
11700
q
BPD
25,000*
135,000
226,000
400,000
* This rupture is probably too small to be detected with the Keystone leak detection system.
The following sketch shows the trajectory of crude oil discharging from a pipeline rupture. Dx is the horizontal distance from the p^eline to highest point (Dy) in the crude oil trajectory. The width of crude oil spray zone (Wsz) for the pipeline is Wsz = 4 * Dx. Example computations for p = 30° follows
Vy = 300 * sin 30" = 150 fps Vx = 300 * cos 30° = 260 fps
t = time to peak =150 7 32.2 = 4.66 sec Dx = 260 •4.66= 1210 ft
Wsz = 4* 1210 = 4840 ft
Dy = Vy*t-16.1*t«= 150*4.66-16.1 * 4.66" = 350ft

Crude Oil Trajectory v
A / /
/ ^ P
/
ch. \
_ j | — - — ~ — '
1
Dx
Pipeline Rupture
•
L ~ .
Dy
^ - - .
\ . N.
\
Crude oil trajectories for p = 30, 45, 60 and 90" are summarized in the following table
p o
30
45
60
90
Vy
fps
150
210
260
300
Vx
fps
260
210
150
0
t
sec
4.66
6.56
8.07
9.32
Dx
ft
1210
1380
1210
0
Dy
ft
350
685
1050
1400
Wsz
ft
4840
5520
4840
0
The width of the crude oil spray zone is approximately one mile ('/2 mile each side of the pipeline) and the maximum height of the crude oil trajectory in 1400 ft. The pipeline will limit land use and decrease property values for Vz mile on each side of the pipeline.

Conclusion While TransCanada may save money using a thin wall pipe, they have shifted the
risk and cost of pipeline rupture to the land owners. A pipe wall thickness of 0.465 inch is not adequate to protect the environment against crude oil ruptures from Keystone Pipeline. References
Jeglic, Franci, "Analysis of Ruptures and Trends on Major Canadian Pipeline Systems", Copyright 2004 by ASME.
Kiefiier, John F., "Role of Hydrostatic Testing in Pipeline Integrity Assessment", Northeast Pipeline Integrity Workshop, Albany, New York, June 12, 2001.
I hope that you will agree with my conclusion and not permit the use of the thin wall pipe in the Keystone Pipeline.
Sincerely
Wesley P 440 N. Fem(IaleT)r. Bigfork,MT 59911 406 837-4041

Pipeline and Hazardous Materials Safety Administration Docket Number PHMSA 2008-0258 TransCanada Keystone Pipeline, L.P. Application to Design, Construct and Operate the Keystone XL Oil Pipeline at 80% Specified Minimum Yield Strength (SMYS) Response to PHMSA November 19 , 2009
Page 1 of 6 Please provide
• A static and dynamic model of the pipeline for each section from pump discharge to pump suction along the entire US portion of the system.
• A valve closure scenario at the MLV just upstream of the downstream pump station at the midpoint in the discharge to suction section and at the MLV immediately downstream of the upstream pump station.
• The valve closure and pump shut down response times to adequately gauge the most likely volume estimates
Response: 1. Pressure Plot of the Keystone XL Pipeline Static Model:
Steady state hydraulic simulations have been performed for various pipeline operating scenarios. The Keystone XL (KXL) pipeline system is hydraulically balanced between Q1 (winter) & Q3 (summer) hydraulic results with a comparable number of pump units required and equivalent total power consumption. The presented results are for the hydraulic design to satisfy the system’s nominal flow capacity (900 kbpd).
Appendix-A shows the graphical representation of pressure profiles for the above mentioned scenario The graph clearly indicates that the system pressures are well below the system’s maximum allowable operating pressure (MAOP).
2. Keystone XL Pipeline Transient Simulation:
KXL transient hydraulics analysis is performed in four stages, as defined below:
Stage I: Identify the pressure surge potentials of the pipeline system
The initial stage simulates the pressure surges with pump station local pressure controls including pump unit cascade shutdown pressure set point, pump unit shutdown pressure set point and pump station shutdown pressure set point at each station. The triggering events for initiating pipeline pressure surges include:
Mainline valve (MLV) closure, Station valve closure, Pressure control valve (PCV) failure or closure,

Page 2 of 6 Response
Pump station power failure or shutdown and; Inspection Pig sudden stoppage
Stage II: Define the pressure control logics to prevent pressure surges
In this stage, the transient hydraulic model incorporates the pressure control logics within the pump station controller and implements the links between stations with and without communication outages.
The station power failure or shutdown and pig sudden stoppage did not show any potential overpressure in Stage I analysis, therefore only those scenarios that exhibited potential overpressure were analyzed in this second stage.
In addition, pressure control valves were installed at select stations to allow for the minimum pressure control for maintaining backpressure to avoid the column separation in the pipeline system when it is shutdown. The following parameters were included in this stage of the model.
Two-stage closing characteristic curve is used for all mainline valves
Batch fluid delivery pressure profile is used as the initial condition for transient pressure surge simulation, which is the worst case due to high pressure profile
Stage III: Mitigate any potential overpressure conditions through pressure control logics
The mitigation strategies for preventing overpressure conditions in the pipeline are analyzed in the third stage and include:
Extending the valve closure time longer to allow for the station to operate in an acceptable safe pressure range before the complete closure of mainline valves (considering the two-stage valve closing characteristic)
Timely closing the pipeline sectionalizing valves when the system is shutdown
Stage IV: Refinement of the overall pressure logics
In the final stage, a number of model parameters are refined to ensure that no overpressure events are observed during the transient hydraulic simulation when the above described pressure surge events are initiated. Assigned settings are listed below:
For the mainline block valve,, the potential pipeline overpressure concern is eliminated by setting a minimum valve closure time of 4 minutes and 50 seconds
For the station valves, the potential overpressure concern is eliminated by setting the minimum valve closure time at 4 minutes and 10 seconds.
Keystone will standardize the closure time at 4 minutes and 50 seconds for all valves.
3. Mainline Block Valve and Closure Timings:

Page 3 of 6 Response
The mainline block valves will be designed as full port ball valves. The valve is 36 inch in size with a full opening flow coefficient of 271300 gpm/psi0.5. The equal percentage valve closing characteristic curve (refer Fig 3.1) is applied to these valves.
It should be noted that although the valve coefficient decreases to 3% after 50% closure (refer Fig 3.1), the flow rate through the valve may remain relatively high because the pressure difference across the valve becomes much larger as the valve closes.
0
0.1
0.2
0.3
0.4
0.5
0.6
0.7
0.8
0.9
1
0 0.1 0.2 0.3 0.4 0.5 0.6 0.7 0.8 0.9 1
Normalized Valve Closure Time
Nor
mal
ized
Clo
sure
Cv
0.0001
0.001
0.01
0.1
1
Nor
mal
ized
Clo
sure
Cv
Fig 3.1: Valve Closing Characteristics
4. IMLV Closure Scenarios & Pressure Plots:
When a mainline block valve closes, the pipeline flow is interrupted, which initiates a pressure surge. The pressure wave travels towards the upstream pump station while the downstream pump station experiences a low suction pressure causing pump unit or station shutdown.
For detailed graphical representation for different scenarios, refer attached Appendix B.
[1] - Safe Mode: If communication failure continues for more than 3 minutes, the control system would declare the communication outage & trigger the Safe Mode command. Under Safe Mode all the stations pressure settings revert to the safe mode settings, which are evaluated as the safest values and eliminates the potential of increasing system pressure over the system’s maximum allowable operating pressure (MOP) under zero flow rate & other potential upset conditions.

Page 4 of 6 Response
Protection Strategies
If transient pressure surges were to occur, both the suction pressure and discharge pressure at the upstream station will increase. If the suction pressure is above the station high suction pressure shutdown set point, it can trigger all upstream stations to shutdown.
If a communication outage were to occur, the control system will be unaware of this event but will notify the upstream station to initiate timing to revert to the Safe Mode with in 3 minutes. When this occurs, the pump station discharge pressure set point ramps down to the Safe Mode pressure set point along with pump unit cascade shutdown set point and pump unit shutdown set point also ramp down accordingly. As the mainline valve closure time is set as 4.5 minutes, the pump station will be in Safe mode [1] before the valve is completely closed.
Following are the selected scenarios for mainline valve closures & their results.
Scenario I – MLV at suction side of a pump station:
If the mainline valve is located some distance away from the upstream station, the pressure at this location is relatively low. However, it takes longer for the upstream pump station to sense the pressure wave and to response to the pressure upset and the high pressure is more likely due to the line packing from the upstream running pump station.
Comparing the mile post for the MLVs & pump stations along the pipeline, The closest MLV to the suction side of a pump station is 4.62 miles.
Refer Table 3.1 for the tabular results & Appendix-B for the complete graphical pressure profile variation in different times.

Page 5 of 6 Response
Scenario II – MLV at discharge side of a pump station:
If a mainline block valve closer to the upstream station, the normal operating pressure is generally higher at the upstream valve. When this valve closes, the pressure surge at the valve upstream will rise quickly and may exceed the pipeline MOP before the upstream pump station senses the pressure increase and responses to the pressure surge.
Comparing the mile post for the MLVs & pump stations along the pipeline, The closest MLV to the discharge side of a pump station is 2.54 miles. Results are shown in Table 3.1 & Appendix-B.
Scenario III – MLV at the mid point between two stations:
Comparing the mile post for the MLVs & pump stations along the pipeline, The a midpoint MLV is 22.59 miles from the upstream station and 22.71 miles from the downstream station. Refer Table 3.1 & Appendix-B for the results.
Table: 3.1 – Simulation results for mainline valve closures
Scenario 110% MOP (psig)
Valve Upstream Pressure after closure (psig)
I 1584 1526
II 1584 1379
III 1584 1546 5. Pressure Control Valve:
To prevent the column separation after the pipeline is shutdown, the pressure control valves (PCVs) will be installed at selected stations and a sufficient high backpressure (minimum inlet pressure control) will be set to maintain the fluid pressure along the pipeline above the liquid vapor pressure value.
Moreover, when mainline block valves at low elevation points close, the static pressure from high elevation points, can result in a potential overpressure of pipeline segments at low points. The PCVs function combined with setting a discharge pressure control to limit the static pressure at the downstream when the system is shutdown will prevent this occurrence.
Pressure surge analysis has been performed in case of unplanned closure of selected PCVs. Being on conservative side, the analysis also assumed communication outage at the pump stations having these PCVs installed.

Page 6 of 6 Response
Table 5.1 summarized the pressure surge results for the selected PCVs along with inlet & outlet pressure set points to avoid column separation & potential static overpressure at low elevation pipeline segments under pipeline shutdown condition.
Table: 5.1 – Simulation results and set points for pressure control valves.
Pressure Control Valve
No. 110% MOP
(psig) Valve Upstream
Press. after close (psig)
Inlet Press. Set Point
(psig)
Outlet Press. Set Point
(psig)
PCV 1 1584 1535 1015 1073
PCV 2 1584 1504 1015 1232
PCV 3 1584 1520 870 1073
PCV 4 1584 1506 1015 275
6. Mainline Valve and Pump Station Shutdown Response Times:
From the transient hydraulic studies, Keystone has determined the pipeline overpressure potential conditions can be eliminated by setting the mainline valve closure time to 4.5 minutes.
In case of a pump station shutdown event (initiated by the control system or Operator), pump station with five(5) units operating would require around 2 minutes to completely spin-down to full stop.

Appendix A
Steady State Pressure Profile

Wait...
DILBIT18CQ3
KXL Update: Pressure and Flow Rate Profiles (Dilbit Q3 at 1000 kbpd)
Pipeline Length (km)0.000 200.0 400.0 600.0 800.0 1000. 1200. 1400. 1600. 1800. 2000. 2200. 2400. 2600. 2800. 3000. 3200.
Pressure (kPag)
0.000
500.0
1000.
1500.
2000.
2500.
3000.
3500.
4000.
4500.
5000.
5500.
6000.
6500.
7000.
7500.
8000.
8500.
9000.
9500.
10000
10500
11000
Flow Rate (sm3/h)
0.000
400.0
800.0
1200.
1600.
2000.
2400.
2800.
3200.
3600.
4000.
4400.
4800.
5200.
5600.
6000.
6400.
6800.
7200.
7600.
8000.
8400.
8800.
EOL.NEDERLAND
PS41
PS40
PS39
PS38
PS37
PS36
PS35
PS34
PS33
PS32.CUSHING
PS31
PS30
PS29
PS28
PS27
PS26.STEELECITY
PS25
PS24
PS23
PS22
PS21
PS20
PS19
PS18
PS17
PS16
PS15
PS14
PS13
PS12
PS11
PS10
PS09
PS08
PS07
PS06
PS05
PS04
PS03
PS02
PS01.HARDISTY ELEVATION
PRESSURE
STANDARD.FLOW
MAOP
TIME = 05/07 00:52:46STEP = 00:14:54

Wait...
DILBIT18CQ3
KXL Update: Head and Flow Profiles (Dilbit Q3 at 1000 kbpd)
Pipeline Distance (km)0.000 200.0 400.0 600.0 800.0 1000. 1200. 1400. 1600. 1800. 2000. 2200. 2400. 2600. 2800. 3000. 3200.
Head (m)
0.000
100.0
200.0
300.0
400.0
500.0
600.0
700.0
800.0
900.0
1000.
1100.
1200.
1300.
1400.
1500.
1600.
1700.
1800.
1900.
2000.
2100.
2200.
2300.
2400.
2500.
Flow Rate (sm3/h)
0.000
300.0
600.0
900.0
1200.
1500.
1800.
2100.
2400.
2700.
3000.
3300.
3600.
3900.
4200.
4500.
4800.
5100.
5400.
5700.
6000.
6300.
6600.
6900.
7200.
7500.
EOL.NEDERLAND
PS41
PS40
PS39
PS38
PS37
PS36
PS35
PS34
PS33
PS32.CUSHING
PS31
PS30
PS29
PS28
PS27
PS26.STEELECITY
PS25
PS24
PS23
PS22
PS21
PS20
PS19
PS18
PS17
PS16
PS15
PS14
PS13
PS12
PS11
PS10
PS09
PS08
PS07
PS06
PS05
PS04
PS03
PS02
PS01.HARDISTY
ELEVATION
HEAD
MAOH
STANDARD.FLOW
TIME = 05/07 00:52:46STEP = 00:14:54
Appendix B
Transient Pressure Profiles
Scenario I
Mainline Valve at Suction Side of a Pump Station

Wait...
DILBIT18CQ3 SCO
KXL: Pressure Surge, ML_BV12_2 Closure
Pipeline Length (km)650.0 670.0 690.0 710.0 730.0 750.0 770.0 790.0 810.0 830.0 850.0 870.0 890.0
Pressure (kPag)
0.000
500.0
1000.
1500.
2000.
2500.
3000.
3500.
4000.
4500.
5000.
5500.
6000.
6500.
7000.
7500.
8000.
8500.
9000.
9500.
10000
10500
11000
11500
12000
12500
Flow Rate (sm3/h)
0.000
400.0
800.0
1200.
1600.
2000.
2400.
2800.
3200.
3600.
4000.
4400.
4800.
5200.
5600.
6000.
6400.
6800.
7200.
7600.
8000.
8400.
8800.
9200.
9600.
10000
PS13
PS12
PS11
ELEVATION
PRESSURE STANDARD.FLOW
MAOP
MAX.PRESSURE
MASP
TIME = 00:00:00STEP = 00:00:00

Wait...
DILBIT18CQ3 SCO
KXL: Pressure Surge, ML_BV12_2 Closure
Pipeline Length (km)650.0 670.0 690.0 710.0 730.0 750.0 770.0 790.0 810.0 830.0 850.0 870.0 890.0
Pressure (kPag)
0.000
500.0
1000.
1500.
2000.
2500.
3000.
3500.
4000.
4500.
5000.
5500.
6000.
6500.
7000.
7500.
8000.
8500.
9000.
9500.
10000
10500
11000
11500
12000
12500
Flow Rate (sm3/h)
0.000
400.0
800.0
1200.
1600.
2000.
2400.
2800.
3200.
3600.
4000.
4400.
4800.
5200.
5600.
6000.
6400.
6800.
7200.
7600.
8000.
8400.
8800.
9200.
9600.
10000
PS13
PS12
PS11
ELEVATION
PRESSURE STANDARD.FLOW
MAOP
MAX.PRESSURE
MASP
TIME = 00:02:41STEP = 00:00:01

Wait...
DILBIT18CQ3 SCO
KXL: Pressure Surge, ML_BV12_2 Closure
Pipeline Length (km)650.0 670.0 690.0 710.0 730.0 750.0 770.0 790.0 810.0 830.0 850.0 870.0 890.0
Pressure (kPag)
0.000
500.0
1000.
1500.
2000.
2500.
3000.
3500.
4000.
4500.
5000.
5500.
6000.
6500.
7000.
7500.
8000.
8500.
9000.
9500.
10000
10500
11000
11500
12000
12500
Flow Rate (sm3/h)
0.000
400.0
800.0
1200.
1600.
2000.
2400.
2800.
3200.
3600.
4000.
4400.
4800.
5200.
5600.
6000.
6400.
6800.
7200.
7600.
8000.
8400.
8800.
9200.
9600.
10000
PS13
PS12
PS11
ELEVATION
PRESSURESTANDARD.FLOW
MAOP
MAX.PRESSURE
MASP
TIME = 00:03:09STEP = 00:00:01

Wait...
DILBIT18CQ3 SCO
KXL: Pressure Surge, ML_BV12_2 Closure
Pipeline Length (km)650.0 670.0 690.0 710.0 730.0 750.0 770.0 790.0 810.0 830.0 850.0 870.0 890.0
Pressure (kPag)
0.000
500.0
1000.
1500.
2000.
2500.
3000.
3500.
4000.
4500.
5000.
5500.
6000.
6500.
7000.
7500.
8000.
8500.
9000.
9500.
10000
10500
11000
11500
12000
12500
Flow Rate (sm3/h)
0.000
400.0
800.0
1200.
1600.
2000.
2400.
2800.
3200.
3600.
4000.
4400.
4800.
5200.
5600.
6000.
6400.
6800.
7200.
7600.
8000.
8400.
8800.
9200.
9600.
10000
PS13
PS12
PS11
ELEVATION
PRESSURE
STANDARD.FLOW
MAOP
MAX.PRESSURE
MASP
TIME = 00:04:31STEP = 00:00:00

Wait...
DILBIT18CQ3 SCO
KXL: Pressure Surge, ML_BV12_2 Closure
Pipeline Length (km)650.0 670.0 690.0 710.0 730.0 750.0 770.0 790.0 810.0 830.0 850.0 870.0 890.0
Pressure (kPag)
0.000
500.0
1000.
1500.
2000.
2500.
3000.
3500.
4000.
4500.
5000.
5500.
6000.
6500.
7000.
7500.
8000.
8500.
9000.
9500.
10000
10500
11000
11500
12000
12500
Flow Rate (sm3/h)
0.000
400.0
800.0
1200.
1600.
2000.
2400.
2800.
3200.
3600.
4000.
4400.
4800.
5200.
5600.
6000.
6400.
6800.
7200.
7600.
8000.
8400.
8800.
9200.
9600.
10000
PS13
PS12
PS11
ELEVATION
PRESSURE
STANDARD.FLOW
MAOP
MAX.PRESSURE
MASP
TIME = 00:06:08STEP = 00:00:00

Wait...
DILBIT18CQ3 SCO
KXL: Pressure Surge, ML_BV12_2 Closure
Pipeline Length (km)650.0 670.0 690.0 710.0 730.0 750.0 770.0 790.0 810.0 830.0 850.0 870.0 890.0
Pressure (kPag)
0.000
500.0
1000.
1500.
2000.
2500.
3000.
3500.
4000.
4500.
5000.
5500.
6000.
6500.
7000.
7500.
8000.
8500.
9000.
9500.
10000
10500
11000
11500
12000
12500
Flow Rate (sm3/h)
0.000
400.0
800.0
1200.
1600.
2000.
2400.
2800.
3200.
3600.
4000.
4400.
4800.
5200.
5600.
6000.
6400.
6800.
7200.
7600.
8000.
8400.
8800.
9200.
9600.
10000
PS13
PS12
PS11
ELEVATION
PRESSURE
STANDARD.FLOW
MAOPMAX.PRESSURE
MASP
TIME = 00:07:26STEP = 00:00:00

Wait...
KXL: Pressure Surge, ML_BV12_2 Closure
Time(minute)0.000.50001.0001.5002.0002.5003.0003.5004.0004.5005.0005.5006.0006.5007.0007.5008.000
Pressure (kPag)
0.000
500.0
1000.
1500.
2000.
2500.
3000.
3500.
4000.
4500.
5000.
5500.
6000.
6500.
7000.
7500.
8000.
8500.
9000.
9500.
10000
10500
11000
11500
12000
12500
Flow(m3/h), RPM
0.000
300.0
600.0
900.0
1200.
1500.
1800.
2100.
2400.
2700.
3000.
3300.
3600.
3900.
4200.
4500.
4800.
5100.
5400.
5700.
6000.
6300.
6600.
6900.
7200.
10923
9930
ML_BV12_2:P-
ML_BV12_2:Q-
PS12_P01:P-
PS12_P05:P+
PS12_P05:RPM
PS11_BV_OUT:P+
TIME = 00:07:51STEP = 00:00:00

Appendix B
Transient Pressure Profiles
Scenario II
Mainline Valve at Discharge Side of a Pump Station

Wait...
DILBIT18CQ3 SCO
KXL: Pressure Surge, ML_BV15_1 Closure
Pipeline Length (km)900.0 920.0 940.0 960.0 980.0 1000. 1020. 1040. 1060. 1080. 1100. 1120. 1140.
Pressure (kPag)
0.000
500.0
1000.
1500.
2000.
2500.
3000.
3500.
4000.
4500.
5000.
5500.
6000.
6500.
7000.
7500.
8000.
8500.
9000.
9500.
10000
10500
11000
11500
12000
12500
Flow Rate (sm3/h)
0.000
400.0
800.0
1200.
1600.
2000.
2400.
2800.
3200.
3600.
4000.
4400.
4800.
5200.
5600.
6000.
6400.
6800.
7200.
7600.
8000.
8400.
8800.
9200.
9600.
10000
PS17
PS16
PS15
PS14 ELEVATION
PRESSURE
STANDARD.FLOW
MAOP
MAX.PRESSURE
MASP
TIME = 00:00:00STEP = 00:00:00

Wait...
DILBIT18CQ3 SCO
KXL: Pressure Surge, ML_BV15_1 Closure
Pipeline Length (km)900.0 920.0 940.0 960.0 980.0 1000. 1020. 1040. 1060. 1080. 1100. 1120. 1140.
Pressure (kPag)
0.000
500.0
1000.
1500.
2000.
2500.
3000.
3500.
4000.
4500.
5000.
5500.
6000.
6500.
7000.
7500.
8000.
8500.
9000.
9500.
10000
10500
11000
11500
12000
12500
Flow Rate (sm3/h)
0.000
400.0
800.0
1200.
1600.
2000.
2400.
2800.
3200.
3600.
4000.
4400.
4800.
5200.
5600.
6000.
6400.
6800.
7200.
7600.
8000.
8400.
8800.
9200.
9600.
10000
PS17
PS16
PS15
PS14 ELEVATION
PRESSURE
STANDARD.FLOW
MAOP
MAX.PRESSURE
MASP
TIME = 00:02:46STEP = 00:00:01

Wait...
DILBIT18CQ3 SCO
KXL: Pressure Surge, ML_BV15_1 Closure
Pipeline Length (km)900.0 920.0 940.0 960.0 980.0 1000. 1020. 1040. 1060. 1080. 1100. 1120. 1140.
Pressure (kPag)
0.000
500.0
1000.
1500.
2000.
2500.
3000.
3500.
4000.
4500.
5000.
5500.
6000.
6500.
7000.
7500.
8000.
8500.
9000.
9500.
10000
10500
11000
11500
12000
12500
Flow Rate (sm3/h)
0.000
400.0
800.0
1200.
1600.
2000.
2400.
2800.
3200.
3600.
4000.
4400.
4800.
5200.
5600.
6000.
6400.
6800.
7200.
7600.
8000.
8400.
8800.
9200.
9600.
10000
PS17
PS16
PS15
PS14 ELEVATION
PRESSURE
STANDARD.FLOW
MAOP
MAX.PRESSURE
MASP
TIME = 00:03:03STEP = 00:00:01

Wait...
DILBIT18CQ3 SCO
KXL: Pressure Surge, ML_BV15_1 Closure
Pipeline Length (km)900.0 920.0 940.0 960.0 980.0 1000. 1020. 1040. 1060. 1080. 1100. 1120. 1140.
Pressure (kPag)
0.000
500.0
1000.
1500.
2000.
2500.
3000.
3500.
4000.
4500.
5000.
5500.
6000.
6500.
7000.
7500.
8000.
8500.
9000.
9500.
10000
10500
11000
11500
12000
12500
Flow Rate (sm3/h)
0.000
400.0
800.0
1200.
1600.
2000.
2400.
2800.
3200.
3600.
4000.
4400.
4800.
5200.
5600.
6000.
6400.
6800.
7200.
7600.
8000.
8400.
8800.
9200.
9600.
10000
PS17
PS16
PS15
PS14 ELEVATION
PRESSURE
STANDARD.FLOW
MAOP
MAX.PRESSURE
MASP
TIME = 00:04:32STEP = 00:00:01

Wait...
DILBIT18CQ3 SCO
KXL: Pressure Surge, ML_BV15_1 Closure
Pipeline Length (km)900.0 920.0 940.0 960.0 980.0 1000. 1020. 1040. 1060. 1080. 1100. 1120. 1140.
Pressure (kPag)
0.000
500.0
1000.
1500.
2000.
2500.
3000.
3500.
4000.
4500.
5000.
5500.
6000.
6500.
7000.
7500.
8000.
8500.
9000.
9500.
10000
10500
11000
11500
12000
12500
Flow Rate (sm3/h)
0.000
400.0
800.0
1200.
1600.
2000.
2400.
2800.
3200.
3600.
4000.
4400.
4800.
5200.
5600.
6000.
6400.
6800.
7200.
7600.
8000.
8400.
8800.
9200.
9600.
10000
PS17
PS16
PS15
PS14 ELEVATION
PRESSURE
STANDARD.FLOW
MAOP
MAX.PRESSURE
MASP
TIME = 00:04:38STEP = 00:00:00

Wait...
DILBIT18CQ3 SCO
KXL: Pressure Surge, ML_BV15_1 Closure
Pipeline Length (km)900.0 920.0 940.0 960.0 980.0 1000. 1020. 1040. 1060. 1080. 1100. 1120. 1140.
Pressure (kPag)
0.000
500.0
1000.
1500.
2000.
2500.
3000.
3500.
4000.
4500.
5000.
5500.
6000.
6500.
7000.
7500.
8000.
8500.
9000.
9500.
10000
10500
11000
11500
12000
12500
Flow Rate (sm3/h)
0.000
400.0
800.0
1200.
1600.
2000.
2400.
2800.
3200.
3600.
4000.
4400.
4800.
5200.
5600.
6000.
6400.
6800.
7200.
7600.
8000.
8400.
8800.
9200.
9600.
10000
PS17
PS16
PS15
PS14 ELEVATION
PRESSURESTANDARD.FLOW
MAOP
MAX.PRESSURE
MASP
TIME = 00:05:44STEP = 00:00:00

Wait...
KXL: Pressure Surge, ML_BV15_1 Closure
Time(minute)0.000 .5000 1.000 1.500 2.000 2.500 3.000 3.500 4.000 4.500 5.000 5.500 6.000
Pressure (kPag)
0.000
500.0
1000.
1500.
2000.
2500.
3000.
3500.
4000.
4500.
5000.
5500.
6000.
6500.
7000.
7500.
8000.
8500.
9000.
9500.
10000
10500
11000
11500
12000
12500
Flow(m3/h), RPM
0.000
300.0
600.0
900.0
1200.
1500.
1800.
2100.
2400.
2700.
3000.
3300.
3600.
3900.
4200.
4500.
4800.
5100.
5400.
5700.
6000.
6300.
6600.
6900.
7200.
10923
9930
ML_BV15_1:P-
ML_BV15_1:Q-
PS15_P01:P-
PS15_P05:P+
PS15_P04:RPM
PS14_BV_OUT:P+
TIME = 00:05:53STEP = 00:00:00

Appendix B
Transient Pressure Profiles
Scenario III
Mainline Valve at the Midpoint between Two Pump Stations

Wait...
DILBIT18CQ3
KXL: Pressure Surge, ML_BV20_1 Closure
Pipeline Length (km)1250. 1270. 1290. 1310. 1330. 1350. 1370. 1390. 1410. 1430. 1450. 1470. 1490.
Pressure (kPag)
0.000
500.0
1000.
1500.
2000.
2500.
3000.
3500.
4000.
4500.
5000.
5500.
6000.
6500.
7000.
7500.
8000.
8500.
9000.
9500.
10000
10500
11000
11500
12000
12500
Flow Rate (sm3/h)
0.000
400.0
800.0
1200.
1600.
2000.
2400.
2800.
3200.
3600.
4000.
4400.
4800.
5200.
5600.
6000.
6400.
6800.
7200.
7600.
8000.
8400.
8800.
9200.
9600.
10000
PS21
PS20
PS19ELEVATION
PRESSURE
STANDARD.FLOW
MAOP
MAX.PRESSURE
MASP
TIME = 00:00:00STEP = 00:00:00

Wait...
DILBIT18CQ3
KXL: Pressure Surge, ML_BV20_1 Closure
Pipeline Length (km)1250. 1270. 1290. 1310. 1330. 1350. 1370. 1390. 1410. 1430. 1450. 1470. 1490.
Pressure (kPag)
0.000
500.0
1000.
1500.
2000.
2500.
3000.
3500.
4000.
4500.
5000.
5500.
6000.
6500.
7000.
7500.
8000.
8500.
9000.
9500.
10000
10500
11000
11500
12000
12500
Flow Rate (sm3/h)
0.000
400.0
800.0
1200.
1600.
2000.
2400.
2800.
3200.
3600.
4000.
4400.
4800.
5200.
5600.
6000.
6400.
6800.
7200.
7600.
8000.
8400.
8800.
9200.
9600.
10000
PS21
PS20
PS19ELEVATION
PRESSURE
STANDARD.FLOW
MAOP
MAX.PRESSURE
MASP
TIME = 00:02:30STEP = 00:00:00

Wait...
DILBIT18CQ3
KXL: Pressure Surge, ML_BV20_1 Closure
Pipeline Length (km)1250. 1270. 1290. 1310. 1330. 1350. 1370. 1390. 1410. 1430. 1450. 1470. 1490.
Pressure (kPag)
0.000
500.0
1000.
1500.
2000.
2500.
3000.
3500.
4000.
4500.
5000.
5500.
6000.
6500.
7000.
7500.
8000.
8500.
9000.
9500.
10000
10500
11000
11500
12000
12500
Flow Rate (sm3/h)
0.000
400.0
800.0
1200.
1600.
2000.
2400.
2800.
3200.
3600.
4000.
4400.
4800.
5200.
5600.
6000.
6400.
6800.
7200.
7600.
8000.
8400.
8800.
9200.
9600.
10000
PS21
PS20
PS19ELEVATION
PRESSURE
STANDARD.FLOW
MAOP
MAX.PRESSURE
MASP
TIME = 00:03:10STEP = 00:00:00

Wait...
DILBIT18CQ3
KXL: Pressure Surge, ML_BV20_1 Closure
Pipeline Length (km)1250. 1270. 1290. 1310. 1330. 1350. 1370. 1390. 1410. 1430. 1450. 1470. 1490.
Pressure (kPag)
0.000
500.0
1000.
1500.
2000.
2500.
3000.
3500.
4000.
4500.
5000.
5500.
6000.
6500.
7000.
7500.
8000.
8500.
9000.
9500.
10000
10500
11000
11500
12000
12500
Flow Rate (sm3/h)
0.000
400.0
800.0
1200.
1600.
2000.
2400.
2800.
3200.
3600.
4000.
4400.
4800.
5200.
5600.
6000.
6400.
6800.
7200.
7600.
8000.
8400.
8800.
9200.
9600.
10000
PS21
PS20
PS19ELEVATION
PRESSURESTANDARD.FLOW
MAOP
MAX.PRESSURE
MASP
TIME = 00:04:30STEP = 00:00:00

Wait...
DILBIT18CQ3
KXL: Pressure Surge, ML_BV20_1 Closure
Pipeline Length (km)1250. 1270. 1290. 1310. 1330. 1350. 1370. 1390. 1410. 1430. 1450. 1470. 1490.
Pressure (kPag)
0.000
500.0
1000.
1500.
2000.
2500.
3000.
3500.
4000.
4500.
5000.
5500.
6000.
6500.
7000.
7500.
8000.
8500.
9000.
9500.
10000
10500
11000
11500
12000
12500
Flow Rate (sm3/h)
0.000
400.0
800.0
1200.
1600.
2000.
2400.
2800.
3200.
3600.
4000.
4400.
4800.
5200.
5600.
6000.
6400.
6800.
7200.
7600.
8000.
8400.
8800.
9200.
9600.
10000
PS21
PS20
PS19ELEVATION
PRESSURE
STANDARD.FLOW
MAOP
MAX.PRESSURE
MASP
TIME = 00:05:33STEP = 00:00:00

Wait...
DILBIT18CQ3
KXL: Pressure Surge, ML_BV20_1 Closure
Pipeline Length (km)1250. 1270. 1290. 1310. 1330. 1350. 1370. 1390. 1410. 1430. 1450. 1470. 1490.
Pressure (kPag)
0.000
500.0
1000.
1500.
2000.
2500.
3000.
3500.
4000.
4500.
5000.
5500.
6000.
6500.
7000.
7500.
8000.
8500.
9000.
9500.
10000
10500
11000
11500
12000
12500
Flow Rate (sm3/h)
0.000
400.0
800.0
1200.
1600.
2000.
2400.
2800.
3200.
3600.
4000.
4400.
4800.
5200.
5600.
6000.
6400.
6800.
7200.
7600.
8000.
8400.
8800.
9200.
9600.
10000
PS21
PS20
PS19ELEVATION
PRESSURE
STANDARD.FLOW
MAOP
MAX.PRESSURE
MASP
TIME = 00:06:38STEP = 00:00:00

Wait...
KXL: Pressure Surge, ML_BV20_1 Closure
Time(minute)0.000 .5000 1.000 1.500 2.000 2.500 3.000 3.500 4.000 4.500 5.000 5.500 6.000 6.500 7.000
Pressure (kPag)
0.000
500.0
1000.
1500.
2000.
2500.
3000.
3500.
4000.
4500.
5000.
5500.
6000.
6500.
7000.
7500.
8000.
8500.
9000.
9500.
10000
10500
11000
11500
12000
12500
Flow(m3/h), RPM
0.000
300.0
600.0
900.0
1200.
1500.
1800.
2100.
2400.
2700.
3000.
3300.
3600.
3900.
4200.
4500.
4800.
5100.
5400.
5700.
6000.
6300.
6600.
6900.
7200.
10923
9930
ML_BV20_1:P-
ML_BV20_1:Q-
PS20_P01:P-
PS20_P05:P+
PS20_P05:RPM
PS19_BV_OUT:P+
TIME = 00:06:45STEP = 00:00:00

Pipeline and Hazardous Materials Safety Administration Docket Number PHMSA 2008-0285 TransCanada Keystone Pipeline, L.P. Application to Design, Construct and Operate the Keystone XL Oil Pipeline at 80% Specified Minimum Yield Strength (SMYS) Response to PHMSA November 19 , 2009
Page 1 of 2 Provide additional detail on “Pipeline segments operating immediately downstream and at lower elevations than a pump station.” Response: The maximum operating pressure (MOP) of the KXL Pipeline system is designated as 1440 psig throughout the pipeline except for some segments, which have an MOP of 1600 psig. The 1600 psig sections are not being requested for operation at 80%SMYS. The heavy wall segments are identified considering both the elevation profile as well as the operating pressures (gradient) under transient and normal conditions. It can be observed that low elevation points nearer to a pump station discharge would have the potential of higher gradient than 1440 psig MOP, because these locations may not have enough pressure drops to compensate the high gradient due to lower elevation. This concept is illustrated with the following example: Consider a pipeline section of fifty miles downstream of a pump station (PS-A). A pressure gradient is plotted for normal and transient pressure conditions of maximum discharge pressure at PS-A & maximum suction pressure at downstream station along with the corresponding elevation profile as shown in the attached graph. It is evident, that the transient gradient violates the MOP (of 1440 psig) at two locations (marked as Section I & II) within the lower elevations. Though the normal operation gradient is acceptable in these sections, overpressure potential within these segments is eliminated by installation of pipe designed to operate at a higher MOP (1600 psig).

Page 2 of 2 Response
IDENTIFICATION OF HEAVY WALL
0100200300400500600700800900
10001100120013001400150016001700180019002000
0.0 2.0 4.0 6.0 8.0 10.0
12.0
14.0
16.0
18.0
20.0
22.0
24.0
26.0
28.0
30.0
32.0
34.0
36.0
38.0
40.0
42.0
44.0
46.0
48.0
50.0
MP (miles)
Pres
s (p
sig)
MOP - 1600psig MOP - 1440psig Transient Gradient Normal Gradient
HW Section I
HW Section II

Pipeline and Hazardous Materials Safety Administration Docket Number PHMSA 2008-0258 TransCanada Keystone Pipeline, L.P. Application to Design, Construct and Operate the Keystone XL Oil Pipeline at 80% Specified Minimum Yield Strength (SMYS) Response to PHMSA November 19 , 2009
Page 1 of 1 Response to Spray Calculation in Comment 2008-0285-0016: The Keystone XL pipeline will be buried at a depth of 48 inches below the grounds surface, ground cover will provide damping and absorption of most of the kinetic energy in the even of a pipeline breach. In most cases, industry experience dictates that crude oil would be expected to simply pool on the surface as opposed to spray in the immediate area of the release. Please refer to the attached paper for further information.

Keystone XL – Spray Analysis
TransCanada Keystone Pipeline, LP
November 19, 2009
Prepared by:
Suite 208, 1324 – 17th Avenue S.W.
Calgary, Alberta, Canada T2T 5S8
Phone: (403) 547-8638 Fax: (403) 547-8628
Web: www.dynamicrisk.net

TABLE OF CONTENTS 1. INTRODUCTION ....................................................................................................... 3 2. SPRAY ANALYSIS ................................................................................................... 4
2.1. RATE OF RELEASE ............................................................................................................ 4
2.2. CALCULATION OF SPRAY ZONE .......................................................................................... 5
3. INDUSTRY EXAMPLE .............................................................................................. 7 3.1. TRANS-ALASKA PIPELINE – FAIRBANKS, ALASKA (OCTOBER 4, 2001).................................. 7
3.2. LAKEHEAD PIPE LINE CO. - BEMIDJI, MINNESOTA (AUGUST 20, 1979) ................................. 7
3.3. KINDER MORGAN CANADA – BURNABY, BRITISH COLUMBIA (JUL 24, 2007) ......................... 7
4. CONCLUSIONS ........................................................................................................ 8
Page 2 of 8

1. Introduction
TransCanada Keystone (Keystone) requested that Dynamic Risk Assessment Systems, Inc. (Dynamic Risk) provide discussion relating to the calculation of spray distance in the event of a pipeline puncture. The details of this review are contained in this report.
Page 3 of 8

2. Spray Analysis
In order to determine the potential distance that crude oil could theoretically be sprayed during a puncture incident, the worst case scenario of a 1-inch puncture on the 36-inch Keystone XL pipeline was modelled. No dampening effects of soil were considered.
2.1. Rate of Release The rate of release of a leak/rupture failure can be modeled as an aperture with the local pressure by the Bernoulli Equation as follows: (Ref: Methods for the Calculation of Physical Effects Page 2.121).
( )( )Lahds PPACq ρ×−××= 2
Equation 1
Where
Ah = cross-sectional area of the hole (in2)
Cd = discharge coefficient (0.62 for sharp orifice)
P = total pressure at opening (psi)
Pa = atmospheric pressure (psi)
qs = mass flow rate (lb/s)
ρL = liquid density (lb/ft3)
Using Equation 1, a mass flow rate can be calculated. With a leak or rupture, a sharp orifice is assumed giving a discharge coefficient (Cd) of 0.62. A hole area (Ah) of 0.7854 in2 was used as the basis of the analysis, corresponding to a hole diameter of one inch. The pressure differential is calculated by subtracting the atmospheric pressure (Pa) from the pipe pressure. These two values respectively are 14.7 psi and 1440 psi.
As the density of products transported in the pipeline will range from 51.1285 lb/ft3 to 58.0580 lb/ft3, both densities were modeled in this analysis.
Using these variables, the mass flow rate is calculated to be between 87.8715 lb/s and 93.6370 lb/s. This mass flow rate is then converted to a release velocity by dividing by the material density (51.1285 lb/ft3 to 58.0580 lb/ft3) and the cross-sectional area of the orifice (0.7854 in2). In this way, the release velocity was determined to be 295.7 ft/s – 315.1 ft/s.
Page 4 of 8

2.2. Calculation of Spray Zone The release velocity can be used to calculate a worst case spray radius using kinematics equations. It should be noted that industry experience dictates that buried pipelines do not often result in above-ground trajectories of liquid product streams, which instead tend to pool on the surface in the immediate area of the release. These spray distance calculations therefore carry a high degree of conservatism, as they are representative of worst-case effects for above-ground pipelines. No viscosity factor was used in the calculation of the release viscosity, this further adds to the conservatism of these calculations.
A 45º trajectory was assumed as it represents the furthest possible radius of spray in the horizontal direction.
To calculate the potential spray distance, the horizontal and vertical components of velocity are first determined using the following equations:
θsin×=VVVertical
Equation 2
θcos×=VVHorizontal
Equation 3 Where
V = calculated release velocity (ft/s)
Θ = angle of release (degrees)
For a 45-degree release angle, VVertical is equal to VHorizontal. A given cross-section will achieve its apex when its vertical velocity component is equal to zero. If the incident velocity is equal to the vertical component of the spray velocity from the orifice, the final velocity is equal to zero, and assuming a gravitational acceleration of 32.2 ft/s2
, one can determine the time it takes for a cross-section of crude to reach its apex using the following equations:
ApexTVVg 21 −=
Equation 4
Using this equation, TApex is calculated to be 6.5034 – 6.9300 seconds. Assuming the ground is level, the time it takes a given cross-section of crude to reach the apex of its trajectory will be half of the time it takes it to complete its trajectory. Since horizontal velocity is not subject to any significant forces of acceleration, the maximum spray distance is calculated using the following formula:
Page 5 of 8

)2( ApexHorizontalHorizontal TVD ××=
Equation 5
Using the variables calculated above, the maximum horizontal spray distance based on the calculations is 2719.7 – 3088.2 feet.
Page 6 of 8

3. Industry Example
The analysis contained in Section 2 represents a conservative estimate of spray distance for above-ground pipelines. In actual practice, the spray distance will be less than cited in Section 2 due to viscosity and friction effects, as well as a spray angle that is unlikely to represent a worst-case situation. The degree of conservatism might be illustrated by considering actual pipeline industry incident examples.
3.1. Trans-Alaska Pipeline – Fairbanks, Alaska (October 4, 2001) On October 4, 2001, operators of the NPS 48 Trans-Alaska pipeline detected a leak in the pipeline via helicopter patrol. The Trans-Alaska pipeline is an above ground pipeline that transports crude oil from Prudhoe Bay, Alaska to Valdez, Alaska.
Upon investigation, it was determined that the oil leak was a result of a bullet puncture on the side of the pipeline slightly above the horizontal axis of the pipeline. The puncture resulted in a spray of crude oil to the surrounding environment. The operating pressure of the pipeline at the time of the incident was 525 psi. The oil spray covered a distance of approximately 75 feet from the puncture site.
3.2. Lakehead Pipe Line Co. - Bemidji, Minnesota (August 20, 1979) On August 20, 1979, Lakehead Pipe Line Co. experienced a seam weld related rupture of their NPS 34 pipeline near Bemidji, Minnesota. The cause of the failure was determined to be a failure of the pipeline’s long seam.
The operating pressure of the pipeline at the time of the incident was approximately 500 psi. The oil spray covered a distance of approximately 394 feet from the rupture site.
3.3. Kinder Morgan Canada – Burnaby, British Columbia (Jul 24, 2007) On July 24, 2007, an NPS 24 pipeline operated by Kinder Morgan Canada was punctured by a third party excavator. The height of the spray of oil was approximately 49 – 66 feet high. It should be noted that the extent of the spray was worsened by the closure of the downstream isolating valve which caused the pressure of the pipeline to rise from 75 psi to 250 psi. The oil spray covered a distance of approximately 197 feet from the rupture site.
Page 7 of 8

Page 8 of 8
4. Conclusions
The release velocity for crude oil from an aperture of 1-inch diameter in a pipeline with a 36-inch diameter and a pressure of 1440 psi was calculated. The release velocity calculated is 295.7 ft/s – 315.1 ft/s. This release velocity was calculated using the Bernoulli equation. From this release velocity, a worst case scenario for spray distance was calculated using kinematics equations. This worst case spray distance is 2719.7 – 3088.2 feet. These spray distance calculations therefore carry a high degree of conservatism, since a worst-case assumption was used on trajectory angle, and viscosity and friction effects were ignored.
It should be noted that because the Keystone XL pipeline will be buried at a depth of 48 inches below the grounds surface, ground cover will provide a damping and absorption of most of the kinetic energy. In most cases, industry experience dictates that crude oil would be expected to simply pool on the surface in the immediate area of the release. Industry experience with pipeline failures indicates that for above-ground pipelines, and failures of excavated pipelines, spray distances of 75 – 394 feet are more typical than the values obtained by applying a simple analysis that ignores viscosity and friction effects and that employs worst-case assumptions.

Pipeline and Hazardous Materials Safety Administration Docket Number PHMSA 2008-0258 TransCanada Keystone Pipeline, L.P. Application to Design, Construct and Operate the Keystone XL Oil Pipeline at 80% Specified Minimum Yield Strength (SMYS) Response to PHMSA November 19 , 2009
Page 1 of 1 Provide additional info to expand on the following statement: “The alternative to the special permit is to continue to design, construct and operate the Project at 72% SMYS as per 49 C.F.R. § 195.106. This would result in an increased steel requirement for the project which in turn would increase the cost of transportation, stockpiling and certain construction activities, and reduction in pipeline capacity. Pursuing the alternative to the special permit would not allow Keystone to realize all the other potential benefits discussed in this document as well as those recognized by PHMSA in the Special Permit for the Keystone Pipeline and in 73 FR 62148 “Pipeline Safety: Standards for Increasing the Maximum Allowable Operating Pressure for Gas Transmission Pipelines; Final Rule”. Response: Based on static and transient hydraulic modeling as well as current physical design of the pipeline system, operating the Keystone XL pipeline at 72% SMYS would require the installation of an additional 8 pump stations to achieve a similar throughput to that which is currently being proposed for the project. An additional 8 pump stations would expand the environmental footprint of the project including the construction of additional power transmission infrastructure to supply these stations. Finally, the additional 8 pump stations would require a significant amount of incremental consumption of electricity over that of a pipeline operating at 80% SMYS and transmitting the same capacity.

Pipeline and Hazardous Materials Safety Administration Docket Number PHMSA 2008-0285 TransCanada Keystone Pipeline, L.P. Application to Design, Construct and Operate the Keystone XL Oil Pipeline at 80% Specified Minimum Yield Strength (SMYS) Response to PHMSA December 3, 2009
Page 1 of 1 Are there any elements in the crude oil content that can cause internal corrosion? If so, what are they and what are the measures to address? Response: The primary constituent in crude oil content that can cause internal corrosion is water, which can potentially corrode steel. In pipelines that do not operate at elevated pressures or turbulent flows, water droplets can fall out from the flow stream and provide an environment for anaerobic bacteria to multiply, potentially leading to microbial-induced internal corrosion. Measures to address internal corrosion are as follows:
• The commodities will be batched within the pipeline in a turbulent flow regime • Composite samples will be collected from all batches upon receipt and delivery • Chemical corrosion inhibitors, biocides, corrosion coupons or probes may be used • Pipeline cleaning tools will be used on an as required basis • In-line inspection will be performed to detect and monitor internal corrosion. • 0.5% solid and water content for commodities to be transported has been specified by
tariff • Random testing of samples for sulfur, micro carbon residue (MCR), total acid number
(TAN) will be undertaken in order to monitor and assess pipeline system performance.

Pipeline and Hazardous Materials Safety Administration Docket Number PHMSA 2008-0285 TransCanada Keystone Pipeline, L.P. Application to Design, Construct and Operate the Keystone XL Oil Pipeline at 80% Specified Minimum Yield Strength (SMYS) Response to PHMSA December 3, 2009
Page 1 of 2 There is some concern that even if the process flushes some solids and other “nasty stuff” out, there may be other content that could cause corrosion. Do you have documentation and can you provide content numbers (or at least maximum accepted limits) for the following:
- Volatile Organic Compounds (VOCs) Content - H2S Content - Sulfur Content - CO2 Content - API gravity limits
We understand you haven’t received product specific information from the shippers yet, but does Keystone/TCPL have these limits called out in a procedure or other documentation you can share? Response: The majority of the crude oil to be transported by the Project is expected to be derived from the Alberta oil sands region in Canada (i.e., the Western Canadian Sedimentary Basin [WCSB]). The oil extracted from the oil sands is called bitumen, which is highly viscous. In order for the bitumen to be transported by pipeline, it is either mixed with a diluent and transported as diluted bitumen or upgraded to synthetic crude oil. The precise composition of diluted bitumen and synthetic crude oil will determined by shippers and is considered proprietary information. However, these crude oil types are no different than those which are currently being shipped into the United States by other existing international transmission pipelines. In addition, diluted bitumen is similar to other crude oils derived from various locations throughout the world, such as portions of California, Venezuela, Nigeria, and Russia currently being imported into the United States. The attached typical crude oil properties for heavy and light crude oils can be found on www.crudemonitor.ca. These attachments are provided through the Canadian Association of Petroleum Producers (CAPP), which has sponsored the collection and development of assay data on behalf of its member companies since 2001. A representative comparison of the characteristics of the crude oils noted above can be made to any crude oil worldwide through the Government of Canada’s oil properties database: http://www.etc-cte.ec.gc.ca/databases/OilProperties/Default.aspx. These data indicate that crude oils comparable to the WCSB crude oils shipped on the Keystone XL pipeline will not provide any unusual risk to transportation via pipeline.

Page 2 of 2 Response
The tariff that will be filed with FERC for transportation on the Keystone XL pipeline will set forth the following specifications to govern the quality of the petroleum (i.e., crude oil) that shippers may tender for transportation:
• Reid Vapor Pressure shall not exceed one hundred and three kiloPascals (103kPa) • sediment and water shall not exceed one-half of one percent (0.5%) of volume, as
determined by the centrifuge method in accordance with ASTM D4007 standards (most current version) or by any other test that is generally accepted in the petroleum industry as may be implemented from time to time;
• the temperature at the Receipt Point shall not exceed thirty-eight degrees Celsius (38°C);
• the density at the Receipt Point shall not exceed nine hundred and forty kilograms per Cubic Meter (940 kg/m3);
• the kinematic viscosity shall not exceed three hundred and fifty (350) square millimetres per second (mm2/s) determined at the Carrier’s reference line temperature as posted on Carrier’s electronic bulletin board
• shall have no physical or chemical characteristics that may render such Petroleum not readily transportable by Carrier or that may materially affect the quality of other Petroleum transported by Carrier or that may otherwise cause disadvantage or harm to Carrier or the Pipeline System, or otherwise impair Carrier’s ability to provide service on the Pipeline System.

CrudeSulphur
(wt%)API
GravityNickel (mg/L)
Vanadium (mg/L)
MCR (mass%)
TotalC4's (vol%)
TotalC5's (vol%) 10% 20% 25% 50% 75% FBP
Distillation Profile (%off at oC)
Heavy Crude Quality Testing Project -- Typical Crude Properties
AverageUpperLower
3.954.173.72
22.123.820.4
70.9883.4058.55
192.70212.80172.60
10.6711.829.51
0.640.820.46
8.6111.076.15
8111151
236324148
308356260
500541459
683709656
717720715
Access Western Blend
AverageUpperLower
2.532.962.09
19.520.418.6
43.1261.5724.67
90.40129.2551.54
10.8813.018.74
1.572.220.93
2.974.181.75
15621498
264297232
306340271
447484411
584653515
713732694
Albian Heavy Synthetic
AverageUpperLower
2.713.122.30
20.021.019.0
46.5055.3537.65
117.34135.0599.63
8.159.916.38
0.471.04
-0.11
0.821.530.10
14225133
248258238
278306249
413488339
638651625
719721717
Albian Residual Blend
AverageUpperLower
2.853.202.49
21.123.318.9
35.7145.8025.62
84.16103.0065.32
8.589.667.50
0.971.680.25
3.534.922.14
161214108
254290219
287320253
427468386
590656524
723742704
Bow River North
AverageUpperLower
2.792.992.59
23.324.721.9
30.5540.1220.98
82.01103.5660.46
8.208.887.52
0.961.360.57
3.004.201.81
148187108
233267199
267300234
416458375
582659506
720743697
Bow River South
AverageUpperLower
3.603.913.30
20.722.519.0
62.3374.3850.29
160.50190.29130.70
10.6211.459.80
1.001.480.53
6.798.624.96
10916949
248310186
291347235
457515399
634722546
721753689
Cold Lake
AverageUpperLower
3.133.302.96
20.321.419.2
44.7152.9636.47
103.22122.7583.70
9.7410.788.69
0.511.11
-0.10
1.211.900.51
178207148
259284233
292316267
438468407
608666551
719736702
Fosterton
AverageUpperLower
2.042.321.76
28.931.426.5
21.9129.8613.95
47.2264.1130.32
5.847.044.63
2.283.371.19
4.957.092.82
10615953
191256125
228285171
376418333
539612466
722756687
Gibson Sour
09-Nov-09 Page 1 of 4*Upper and Lower values reflect 2 variability. The actual values will be between the noted Upper and Lower values 19 times out of 20
σ

CrudeSulphur
(wt%)API
GravityNickel (mg/L)
Vanadium (mg/L)
MCR (mass%)
TotalC4's (vol%)
TotalC5's (vol%) 10% 20% 25% 50% 75% FBP
Distillation Profile (%off at oC)
Heavy Crude Quality Testing Project -- Typical Crude Properties
AverageUpperLower
1.131.490.76
36.439.033.8
5.8810.171.59
9.8018.461.13
2.954.071.82
2.132.781.48
3.314.182.43
9410980
151198104
179232126
315383247
465549381
708723693
Light Sour Blend
AverageUpperLower
3.363.593.13
20.922.519.3
54.6866.0243.35
118.61143.4093.82
9.6910.508.88
2.132.651.60
4.806.013.59
13319869
261295227
299328270
459510408
635718553
722743702
Lloyd Blend
AverageUpperLower
3.083.342.81
20.622.219.0
43.8856.0431.72
98.05119.0777.02
9.3910.058.72
2.935.120.73
4.356.452.24
15622982
268317219
302351254
451507396
623708538
721741702
Lloyd Kerrobert
AverageUpperLower
2.863.352.37
20.823.218.5
46.6955.1938.20
126.91151.88101.94
7.008.415.60
0.711.050.38
1.772.750.80
186226147
267297237
296323268
413441385
588658519
716722710
Long Lake Heavy
AverageUpperLower
2.783.162.41
19.620.618.6
43.3255.9530.70
112.34139.5785.11
6.938.425.44
1.031.410.66
1.642.610.67
197231164
278304253
303329277
394439350
545621468
718737698
Mackay River
AverageUpperLower
2.332.671.99
29.630.928.3
15.7720.9410.60
29.7039.2420.16
5.806.674.94
1.571.961.18
2.423.091.75
11214677
182212151
214246183
361400323
525591459
713744683
Midale
AverageUpperLower
1.612.061.16
31.636.227.1
19.4629.309.62
41.8461.2522.43
5.226.513.94
3.615.411.81
4.628.191.04
10114160
178234122
218272165
378420336
550610490
714722707
Mixed Sour Blend
AverageUpperLower
4.555.513.58
20.922.619.3
51.9868.4635.49
150.62205.4995.76
8.9610.747.18
0.781.200.35
6.459.783.11
12017367
224293155
263336191
431505357
618716519
720737703
Peace River Heavy
09-Nov-09 Page 2 of 4*Upper and Lower values reflect 2 variability. The actual values will be between the noted Upper and Lower values 19 times out of 20
σ

CrudeSulphur
(wt%)API
GravityNickel (mg/L)
Vanadium (mg/L)
MCR (mass%)
TotalC4's (vol%)
TotalC5's (vol%) 10% 20% 25% 50% 75% FBP
Distillation Profile (%off at oC)
Heavy Crude Quality Testing Project -- Typical Crude Properties
AverageUpperLower
1.481.761.21
34.636.033.2
6.339.722.94
9.9015.384.41
3.674.612.73
1.972.421.51
3.003.322.67
10212776
160180140
189209168
322357287
469527411
704736672
SE Saskatchewan
AverageUpperLower
4.594.884.31
20.621.919.4
59.2171.0947.33
165.89199.99131.78
9.3710.368.39
1.742.710.77
4.445.433.46
12014992
231261201
275303247
466504429
664715613
717720714
Seal Heavy
AverageUpperLower
1.652.201.09
34.838.631.1
15.6723.437.91
42.8463.1722.51
3.774.922.63
1.762.640.88
4.176.411.93
10112775
153189117
181221141
324361286
486544427
710722698
SHE
AverageUpperLower
0.981.290.68
38.041.334.7
7.7315.280.17
18.1437.38-1.10
2.573.811.32
2.373.980.77
4.476.452.49
8810967
133153112
158182134
296329262
451495408
705721689
SLE
AverageUpperLower
2.953.122.79
19.921.318.5
34.2740.8327.71
93.44107.1979.70
9.389.988.79
1.011.510.51
3.814.712.90
155199110
260294226
295328263
448487409
620693547
722739705
Smiley-Coleville
AverageUpperLower
3.023.142.90
19.920.619.2
3.126.43
-0.19
7.9715.380.56
0.631.32
-0.07
0.651.010.29
1.492.020.97
246282211
323331316
339345332
394400387
445451438
679742617
Suncor Synthetic H
AverageUpperLower
2.883.112.66
19.821.018.6
49.0955.4142.77
133.01153.97112.05
7.097.976.20
0.821.070.57
1.331.840.83
197221173
270286255
297311284
413422404
593613572
716721711
Surmont Heavy Blend
AverageUpperLower
3.774.263.27
21.022.919.1
48.9059.8038.01
132.16156.85107.47
8.529.277.77
1.732.990.48
2.613.511.71
145184106
236280193
274314234
437486389
620698542
722741703
Wabasca Heavy
09-Nov-09 Page 3 of 4*Upper and Lower values reflect 2 variability. The actual values will be between the noted Upper and Lower values 19 times out of 20
σ

CrudeSulphur
(wt%)API
GravityNickel (mg/L)
Vanadium (mg/L)
MCR (mass%)
TotalC4's (vol%)
TotalC5's (vol%) 10% 20% 25% 50% 75% FBP
Distillation Profile (%off at oC)
Heavy Crude Quality Testing Project -- Typical Crude Properties
AverageUpperLower
3.033.242.81
20.622.219.1
44.2755.1233.41
92.00114.4469.56
8.689.417.94
0.771.030.50
3.424.832.01
167214121
263289236
296319273
445480411
625693557
721744699
Western Canadian Blend
AverageUpperLower
3.323.643.00
20.522.119.0
53.5765.8041.34
129.84156.46103.22
9.3510.108.59
2.032.751.30
3.915.042.78
16122794
268311225
303341265
451498404
632707556
717722712
Western Canadian Select
09-Nov-09 Page 4 of 4*Upper and Lower values reflect 2 variability. The actual values will be between the noted Upper and Lower values 19 times out of 20
σ

CrudeSulphur
(wt%)API
GravityNickel (mg/L)
Vanadium (mg/L)
MCR (mass%)
TotalC4's (vol%)
TotalC5's (vol%) 10% 20% 25% 50% 75% FBP
Distillation Profile (%off at oC)
Light Crude Quality Testing Project -- Typical Crude Properties
AverageUpperLower
0.570.640.50
40.542.139.0
1.653.010.28
5.099.300.87
0.981.380.59
1.752.461.04
2.432.871.99
10412979
146165126
167184150
282303260
413440386
688723653
BC Light
AverageUpperLower
0.390.530.25
42.345.139.5
2.704.580.83
6.3111.501.11
1.452.320.57
3.294.661.92
3.935.422.44
8011248
11914296
141161120
265300229
430499361
703734672
Bonnie Glen
AverageUpperLower
0.760.840.68
36.137.434.9
8.9311.096.77
27.7132.4622.96
2.663.212.11
1.441.890.99
2.442.852.03
11312699
163174151
188202174
314330298
460483437
701715688
Boundary Lake
AverageUpperLower
0.040.060.02
34.936.333.5
1.321.880.77
2.683.491.88
135142128
190194186
210213208
279283274
342349335
545574516
CNRL Light Sweet Synthetic
AverageUpperLower
0.390.470.30
40.041.738.4
3.185.321.04
6.5510.982.13
1.642.151.13
2.804.181.42
3.234.352.12
9512268
135157113
155176134
276308244
426473380
698735660
Federated
AverageUpperLower
1.162.79
37.743.531.9
18.4245.370.00
47.61125.42
0.00
4.097.970.20
4.376.722.01
5.699.252.13
717566
115130100
141154129
340418263
533691376
709724694
Gibson Light Sour
AverageUpperLower
0.420.530.31
41.343.339.3
3.745.551.94
7.3111.712.91
1.722.411.03
3.695.811.57
4.948.601.28
789760
12114893
143181106
284319250
438469407
702720685
Gibson Light Sweet
AverageUpperLower
0.100.140.07
32.634.031.2
0.370.930.00
0.931.810.04
0.060.170.00
2.943.662.22
1.562.180.94
177196159
236251221
255269241
329342315
403416389
591656527
Husky Synthetic Blend
25-Nov-09 Page 1 of 3*Upper and Lower values reflect 2 variability. The actual values will be between the noted Upper and Lower values 19 times out of 20
σ

CrudeSulphur
(wt%)API
GravityNickel (mg/L)
Vanadium (mg/L)
MCR (mass%)
TotalC4's (vol%)
TotalC5's (vol%) 10% 20% 25% 50% 75% FBP
Distillation Profile (%off at oC)
Light Crude Quality Testing Project -- Typical Crude Properties
AverageUpperLower
0.410.600.23
39.243.135.3
3.886.021.73
8.3612.943.79
2.113.011.20
2.094.360.00
7.3413.031.64
8612646
142184100
173214132
320349291
474507441
711725697
Joarcam
AverageUpperLower
0.290.390.18
36.839.034.5
4.265.862.65
5.659.971.34
2.342.701.99
2.933.612.25
2.934.920.94
10111983
155183127
183215152
318347289
467504430
708724692
Kerrobert Sweet
AverageUpperLower
1.061.240.89
34.738.530.9
10.3014.576.04
18.3827.619.15
3.564.292.82
1.703.480.00
3.446.340.54
10313868
154192116
179218140
318358278
476530422
713734693
Koch Alberta
AverageUpperLower
0.120.230.01
36.537.235.9
1.101.101.10
2.102.102.10
0.200.200.20
1.461.990.94
2.502.842.15
124124124
189189189
212212212
301301301
384384384
569569569
Long Lake Light Synthetic
AverageUpperLower
0.450.500.39
39.240.637.8
4.076.052.08
7.6810.664.69
1.972.431.51
2.613.801.42
3.754.752.76
9512168
140161119
164185144
298324272
449494404
704730679
Mixed Sweet Blend
AverageUpperLower
0.430.500.36
39.841.837.8
3.475.281.66
6.3910.142.64
1.712.141.28
1.872.411.32
3.444.382.49
9912672
139161118
161183138
287325249
440502378
697733661
Peace
AverageUpperLower
1.692.361.03
34.639.230.0
16.2425.297.20
45.1571.5518.74
3.795.212.38
1.492.090.88
3.304.741.86
10813483
161190132
188220156
329369290
502559446
712723701
Peace River Sour
AverageUpperLower
0.420.490.34
38.840.836.8
3.405.091.71
7.0510.403.69
1.932.461.39
2.023.570.46
3.394.292.49
9712272
140162118
162186139
299332267
457501414
704732676
Pembina
25-Nov-09 Page 2 of 3*Upper and Lower values reflect 2 variability. The actual values will be between the noted Upper and Lower values 19 times out of 20
σ

CrudeSulphur
(wt%)API
GravityNickel (mg/L)
Vanadium (mg/L)
MCR (mass%)
TotalC4's (vol%)
TotalC5's (vol%) 10% 20% 25% 50% 75% FBP
Distillation Profile (%off at oC)
Light Crude Quality Testing Project -- Typical Crude Properties
AverageUpperLower
0.750.840.65
40.241.139.3
2.174.020.32
5.458.712.19
1.472.010.93
3.344.642.05
2.903.432.37
9510684
135148122
155169141
273294253
423450397
700724676
Pembina Light Sour
AverageUpperLower
0.100.34
33.535.531.5
2.225.000.00
4.309.250.00
0.200.640.00
0.340.640.04
0.521.130.00
163191135
203227178
217242193
279307250
337371303
561679444
Premium Albian Synthetic
AverageUpperLower
0.470.600.33
38.740.437.1
4.847.771.91
8.6015.082.13
2.292.801.78
2.953.862.03
3.464.292.64
10113071
150173127
173195150
303337269
459519399
706731681
Rainbow
AverageUpperLower
0.450.520.38
35.137.932.2
10.2318.971.48
5.1510.120.17
3.343.962.72
1.742.491.00
2.935.080.78
10613477
166192141
195226165
338379298
500595406
712735690
Redwater
AverageUpperLower
0.100.140.05
33.735.831.7
1.301.501.10
0.140.270.02
0.460.810.11
0.941.490.38
125141110
235239231
269272266
348355341
407417397
589614563
Shell Synthetic Light
AverageUpperLower
0.190.250.14
33.135.430.9
0.572.520.00
1.494.140.00
0.020.130.00
1.812.660.97
2.973.902.03
134157111
197220174
225247202
315331300
382396367
573636511
Suncor Synthetic A
AverageUpperLower
0.130.200.06
31.533.629.4
0.361.070.00
0.791.500.07
0.050.160.00
1.902.511.29
2.423.081.76
148172125
212233191
235256214
321341301
401422380
602658545
Syncrude Synthetic
AverageUpperLower
0.420.550.30
39.941.138.8
4.907.152.65
2.003.530.47
1.742.161.33
2.923.961.88
2.472.932.01
9710590
138149127
160169151
269282257
403425381
693721664
Tundra Sweet
25-Nov-09 Page 3 of 3*Upper and Lower values reflect 2 variability. The actual values will be between the noted Upper and Lower values 19 times out of 20
σ

Pipeline and Hazardous Materials Safety Administration Docket Number PHMSA 2008-0285 TransCanada Keystone Pipeline, L.P. Application to Design, Construct and Operate the Keystone XL Oil Pipeline at 80% Specified Minimum Yield Strength (SMYS) Response to PHMSA December 3, 2009
Page 1 of 6 Are there any elements in the crude oil content that can be detrimental to the public if released? If so, what are they, what are risks/impact to the public with that particular content, and what are the company specific emergency response procedures to address? Response: The composition of crude oil varies widely, depending on the source and processing. Crude oils are complex mixtures of hundreds of organic (and a few inorganic) compounds. These compounds differ in their solubility, toxicity, persistence, and other properties that profoundly affect their impact on the environment. The effects of a specific crude oil cannot be thoroughly understood without taking its composition into account. For the purposes of this analysis, transportation of two crude oil types will be assumed: synthetic crude oil and diluted bitumen. This analysis assumes that the pipeline will contain segregated batches of these two products. The primary classes of compounds found in crude oil are alkanes (hydrocarbon chains), cycloalkanes (hydrocarbons containing saturated carbon rings), and aromatics (hydrocarbons with unsaturated carbon rings). Most crude oils are more than 95 percent carbon and hydrogen, with small amounts of sulfur, nitrogen, oxygen, and traces of other elements. Crude oils contain lightweight straight-chained alkanes (e.g., hexane, heptane); cycloalkanes (e.g., cyclyohexane); aromatics (e.g., benzene, toluene); cycloalkanes; and heavy aromatic hydrocarbons (e.g., polycyclic aromatic hydrocarbons [PAHs], asphaltines). Straight-chained alkanes are more easily degraded in the environment than branched alkanes. Cycloalkanes are extremely resistant to biodegradation. Aromatics (i.e., benzene, toluene, ethylbenzene, xylenes compounds) pose the most potential for environmental concern because of their lower molecular weight, they are more soluble in water than alkanes and cycloalkanes. Overall, the environmental fate of crude oil is controlled by many factors and persistence is difficult to predict with great accuracy. Major factors affecting the environmental fate include spill volume, type of crude oil, dispersal rate of the crude oil, terrain, receiving media, and weather. The speed and efficiency of emergency response containment and cleanup largely dictates the fate and extent of transport within the environment. The emergency response procedures (ERP) are not based on a specific component in crude oil but developed to address the entire range of crude oil content and type to be transported. The equipment, response and clean up techniques do not differ.

Pipeline and Hazardous Materials Safety Administration Docket Number PHMSA 2008-0285 TransCanada Keystone Pipeline, L.P. Application to Design, Construct and Operate the Keystone XL Oil Pipeline at 80% Specified Minimum Yield Strength (SMYS) Response to PHMSA December 3, 2009
Page 2 of 6 An evaluation of the potential impacts resulting from the accidental release of crude oil into the environment is discussed by environmental resource below.
Soils Because pipelines are buried, soil absorption of spilled crude oil could occur, thus impacting the soils. Subsurface releases to soil tend to disperse slowly and are generally located within a contiguous and discrete area, often limited to the less consolidated soils (lower soil bulk density) within the pipeline trench. Effects to soils can be quite slow to develop, allowing time for emergency response and cleanup actions to mitigate effects to potential receptors. In the event of a spill, a portion of the released materials would enter the surrounding soil and disperse both vertically and horizontally in the soil. The extent of dispersal would depend on a number of factors, including speed and success of emergency containment and cleanup, size and rate of release, topography of the release site, vegetative cover, soil moisture, bulk density, and soil porosity. High rates of release from the buried pipeline would result in a greater likelihood that released materials would escape the trench and reach the ground surface. If a release were to occur in sandy soils encountered along the Project route, it is likely that the horizontal and vertical extent of the contamination would be greater than in areas containing more organic soils. Crude oil released into sandy soils would likely become visible to aerial surveillance due to product on the soils surface or discoloration of nearby vegetation, which will facilitate emergency response and soil remediation efforts. If present, soil moisture and moisture from precipitation would increase the dispersion and migration of crude oil. The majority of the Project alignment is located in relatively flat or moderately rolling terrain. In these areas, the oil would generally begin dispersing horizontally within the pipeline trench, and with sufficient spill volume or flow, then the oil could move out of the trench onto the soils surface, generally moving toward low lying areas. If the spill were to occur on a steep slope where trench breakers had been installed during construction, then crude oil would pool primarily within the trench behind any trench breakers. If sufficient volume existed, the crude oil would breach the soil’s surface as it extended over the top of the trench breaker. In either case, once on the soil’s surface, the release would be more apparent to leak surveillance patrols, facilitating emergency response and remediation. Both on the surface and in the subsurface, rapid attenuation of light, volatile constituents (due to evaporation) would quickly reduce the total volume of crude oil, while heavier constituents would be more persistent. Except in rare cases of high rate and high total volume releases with environmental settings characterized by steep topography or karst terrain, soil impacts would be confined to a relatively small, contiguous, and easily defined area, facilitating cleanup and remediation. Within a relatively short time, lateral migration would generally stabilize. Downward vertical migration would begin at the onset of a spill, with rates governed by soil permeability. For example, in soils with moderately high permeability, water may penetrate 2.5 inches per hour,

Pipeline and Hazardous Materials Safety Administration Docket Number PHMSA 2008-0285 TransCanada Keystone Pipeline, L.P. Application to Design, Construct and Operate the Keystone XL Oil Pipeline at 80% Specified Minimum Yield Strength (SMYS) Response to PHMSA December 3, 2009
Page 3 of 6 while penetration rates for soils of low permeability may occur at 0.05 inch per hour. Crude oil is more viscous than water, therefore, permeability of crude oil would be slower. In accordance with federal and state regulations, Keystone would be responsible for cleanup of contaminated soils and would be required to meet applicable cleanup levels. Soil cleanup levels for benzene from petroleum hydrocarbon releases vary by state (Montana: 0.04 part per million [ppm]; South Dakota: 17 ppm; Nebraska: 3.63 ppm; Kansas: 9.8 ppm; Oklahoma: no value; Texas: 38 ppm). While Oklahoma has no benzene soil cleanup standard, other risk-based screening values exist for petroleum hydrocarbons and, consequently, soils would still be remediated to ensure human health and environmental quality. Once remedial cleanup levels were achieved in the soils, no adverse or long-term impacts would be expected. It is difficult to estimate the volume of soil that might be contaminated in the event of a spill. Site-specific environmental conditions (e.g., soil type, weather conditions) and release dynamics (e.g., leak rate, leak duration) would result in substantially different surface spreading and infiltration rates, which in turn, affect the final volume of affected soil to be remediated. Based on historical data (PHMSA 2008), soil remediation involved 100 cubic yards of soil or less at the majority of spill sites where soil contamination occurred, and only 3 percent of the spill sites required remediation of 10,000 cubic yards or more (PHMSA 2008).
Vegetation Crude oil released to the soil’s surface could potentially produce localized effects on plant populations. While a release of crude oil could result in the contamination of soils, resulting in potential effects to vegetation. Keystone will be responsible for cleanup of contaminated soils. Once remedial cleanup levels were achieved in the soils, no adverse or long-term impacts to vegetation would be expected.
Water Resources Crude oil could be released to water resources if the pipeline is breached or leaks occur. As part of project planning and in recognition of the environmental sensitivity of waterbodies, the Project routing process attempted to minimize the number waterbodies crossed, including groundwater aquifers. Furthermore, valves have been strategically located along the Project route to help reduce the amount of crude oil that could potentially spill into waterbodies, if such an event were to occur. The location of valves, spill containment measures, and implementing actions in the Project Emergency Response Plan would mitigate adverse effects to both surface water and groundwater.

Pipeline and Hazardous Materials Safety Administration Docket Number PHMSA 2008-0285 TransCanada Keystone Pipeline, L.P. Application to Design, Construct and Operate the Keystone XL Oil Pipeline at 80% Specified Minimum Yield Strength (SMYS) Response to PHMSA December 3, 2009
Page 4 of 6 Groundwater Multiple groundwater aquifers underlie the proposed Project. Vulnerability of these aquifers is a function of the depth to groundwater and the permeability of the overlying soils. While routine operation of the Project would not affect groundwater, there is the possibility that a release could migrate through the overlying surface materials and enter a groundwater system. In general, the potential for groundwater contamination following a spill would be more probable in locations where a release into or on the surface of soils has occurred:
• Where a relatively shallow water table is present (as opposed to locations where a deeper, confined aquifer system is present);
• Where soils with high permeability are present throughout the unsaturated zone; and • Where, in cooperation with federal and state agencies, the PHMSA (in cooperation with the
US Geological Service [USGS] and other federal and state agencies) has identified specific groundwater resources that are particularly vulnerable to contamination. These resources are designated by PHMSA as HCAs
Depending on soil properties, the depth to groundwater, and the amount of crude oil in the unsaturated zone, localized groundwater contamination can result from the presence of free crude oil and the migration of its dissolved constituents. Crude oil is less dense than water and would tend to form a floating pool after reaching the groundwater surface. Movement of crude oil is generally quite limited due to adherence with soil particles, groundwater flow rates, and natural attenuation (i.e., microbial degradation) (Freeze and Cherry 1979; Fetter 1993). Those compounds in the crude oil that are soluble in water will form a larger, dissolved “plume.” This plume would tend to migrate laterally in the direction of groundwater flow. Movement of dissolved constituents typically extends for greater distances than movement of pure crude oil in the subsurface, but is still relatively limited. Unlike chemicals with high environmental persistence (e.g., trichloroethylene, pesticides), the aerial extent of the dissolved constituents will stabilize over time due to natural attenuation processes. Natural biodegradation through metabolism by naturally occurring microorganisms is often an effective mechanism for reducing the volume of crude oil and its constituents. Natural attenuation will reduce most toxic compounds into non-toxic metabolic byproducts, typically carbon dioxide and water (Minnesota Pollution Control Agency 2005). Field investigations of more than 600 historical petroleum hydrocarbon release sites indicate the migration of dissolved constituents typically stabilize within several hundred feet of the crude oil source area (Newell and Conner 1998; USGS 1998). Over a longer period, the area of the contaminant plume may begin to reduce due to natural biodegradation. Removal of crude oil contamination will eliminate the source of dissolved constituents impacting the groundwater. Most crude oil constituents are not water soluble. For those constituents that are water soluble (e.g., benzene) the dissolved concentration is not controlled by the amount of oil in contact with the water, but by the concentration of the specific constituent in the oil (Charbeneau et al. 2000;

Pipeline and Hazardous Materials Safety Administration Docket Number PHMSA 2008-0285 TransCanada Keystone Pipeline, L.P. Application to Design, Construct and Operate the Keystone XL Oil Pipeline at 80% Specified Minimum Yield Strength (SMYS) Response to PHMSA December 3, 2009
Page 5 of 6
Charbeneau 2003; Freeze and Cherry 1979). Studies of 69 crude oils found that benzene was the only aromatic or PAH compound tested that is capable of exceeding groundwater protection values for drinking water (i.e., maximum contaminant levels [MCLs] or Water Health Based Limits) (Kerr et al. 1999 as cited in O’Reilly et al. 2001). If exposure to humans or other important resources would be possible from a release into groundwater, then regulatory standards, such as drinking water criteria (MCL) would mandate the scope of remedial actions, timeframe for remediation activities, and cleanup levels. For human health protection, the national MCL is an enforceable standard established by the USEPA and is designed to protect long-term human health. The promulgated drinking water standards for humans vary by several orders of magnitude for crude oil constituents. Of the various crude oil constituents, benzene has the lowest national MCL at 0.005 ppm1 and, therefore, it was used to evaluate impacts on drinking water supplies, whether from surface water or groundwater. However, emergency response and remediation efforts have the potential for appreciable adverse environmental effects from construction/cleanup equipment. If no active remediation activities were undertaken, natural biodegradation and attenuation would ultimately allow a return to preexisting conditions in both soil and groundwater. Depending on the amount of crude oil reaching the groundwater and natural attenuation rates, this would likely require up to tens of years. Keystone will utilize the most appropriate cleanup procedure as determined in cooperation with the applicable federal and state agencies.
Flowing Surface Waters Keystone has evaluated impacts to downstream drinking water sources by comparing projected surface water benzene concentrations with the national MCL for benzene. Like other pipelines already in existence, the Project will cross hundreds of perennial, intermittent, and ephemeral streams. The following extremely conservative assumptions were developed to over-estimate potential spill effects for planning purposes.
• The entire volume of a spill reaches the large waterbody, regardless of downstream distance;
• Benzene instantaneously reaches its maximum solubility (less than 1.2 mg/L2) within the water column.
Under the actual conditions of a crude oil release, the spill volume capable of reaching the large waterbody and benzene concentration outlined by these assumptions are not expected to occur at the very high levels described.
1 All affected states along the Project route use the national MCL value of 0.005 ppm.
2 Solubility of benzene is limited by the concentration of benzene within the crude oil. This analysis used the US Environmental Protection Agency’s (2009) solubility limit of 1.2 mg/L, a value appropriate for diesel fuel with a higher benzene content than crude oils. Thus, this analysis overestimates the amount of benzene likely to be dissolved within the water column.

Pipeline and Hazardous Materials Safety Administration Docket Number PHMSA 2008-0285 TransCanada Keystone Pipeline, L.P. Application to Design, Construct and Operate the Keystone XL Oil Pipeline at 80% Specified Minimum Yield Strength (SMYS) Response to PHMSA December 3, 2009
Page 6 of 6 Based on ultra-conservative assumptions, results suggest that most spills that enter a waterbody could result in exceedence of the national MCL for benzene. Although the assumptions used are highly conservative and, thus, overestimate potential benzene water concentrations, the analysis indicates the need for rapid notification of managers of municipal water intakes downstream of a spill so that any potentially affected drinking water intakes could be closed to bypass river water containing crude oil. Risk also must consider the likelihood of an event occurring. Conservative occurrence intervals for a spill at any representative stream ranges from about 22,000 years for a large waterbody to over 830,000 years for a small waterbody (less likely to occur in any single small waterbody than any single large waterbody). If any release did occur, it is likely that the total release volume of a spill would be 3 barrels or less, based on PHMSA data for historical spill volumes. In summary, while a release of crude oil directly into any given waterbody would likely cause an exceedence of drinking water standards under the highly conservative assumptions used in this analysis, the frequency of such an event would be very low. Nevertheless, streams and rivers with downstream drinking water intakes represent sensitive environmental resources and could be temporarily impacted by a crude oil release. Keystone’s Emergency Response Plan contains provisions for protecting and mitigating potential impacts to drinking water.

Pipeline and Hazardous Materials Safety Administration Docket Number PHMSA 2008-0285 TransCanada Keystone Pipeline, L.P. Application to Design, Construct and Operate the Keystone XL Oil Pipeline at 80% Specified Minimum Yield Strength (SMYS) Response to PHMSA December 18, 2009
Page 1 of 2 A portion of the EA and draft Special Permit Analysis and findings is related to providing some information on compliance history. Can you help clarify if the below operators are all under the TransCanada name (at least that are reportable to PHMSA)? Also, can you at least help provide a month/day when you took them over? STATUS_ CODE
OPERATOR _ID UPPER(A.OPERATOR_NAME)
UPPER (MOE.OWNER_NAME)
A 405 ANR PIPELINE CO TRANSCANADA A 6660 GREAT LAKES GAS TRANSMISSION CO TRANSCANADA A 13769 NORTHERN BORDER PIPELINE COMPANY TRANSCANADA
A 15014 GAS TRANSMISSION NORTHWEST CORPORATION (GTN) TRANSCANADA
A 30838 TUSCARORA GAS TRANSMISSION COMPANY TRANSCANADA
A 31145 PORTLAND NATURAL GAS TRANSMISSION SYSTEM TRANSCANADA
A 31891 NORTH BAJA PIPELINE LLC TRANSCANADA A 32334 TC OIL PIPELINE OPERATIONS INC TRANSCANADA Response: TransCanada is the operator of all of the aforementioned pipeline systems. The official dates these companies were incorporated into TransCanada are cited below: TC OIL PIPELINE OPERATIONS INC
• Incorporated on December 12, 2007 NORTH BAJA PIPELINE LLP
• November 2, 2004 PORTLAND NATURAL GAS TRANSMISSIONS SYSTEM
• August 3, 2004
TUSCARORA GAS TRANSMISSION COMPANY • December 19, 2006
GAS TRANSMISSION NORTHWEST CORPORATION (GTN)
• November 2, 2004

Page 2 of 2 Response
NORTHERN BORDER PIPELINE CORPORATION • April 1, 2007
GREAT LAKES GAS TRANSMISSION CO
• February 22, 2007 ANR PIPELINE CO
• February 22, 2007
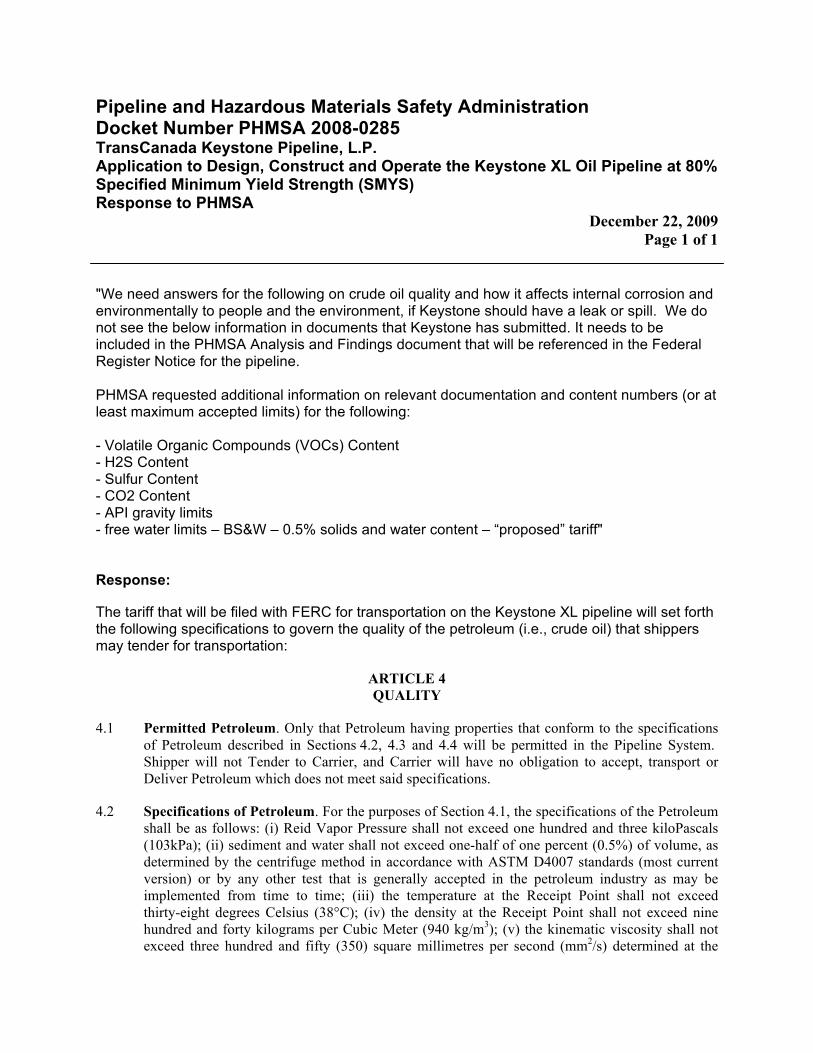
Pipeline and Hazardous Materials Safety Administration Docket Number PHMSA 2008-0285 TransCanada Keystone Pipeline, L.P. Application to Design, Construct and Operate the Keystone XL Oil Pipeline at 80% Specified Minimum Yield Strength (SMYS) Response to PHMSA December 22, 2009
Page 1 of 1 "We need answers for the following on crude oil quality and how it affects internal corrosion and environmentally to people and the environment, if Keystone should have a leak or spill. We do not see the below information in documents that Keystone has submitted. It needs to be included in the PHMSA Analysis and Findings document that will be referenced in the Federal Register Notice for the pipeline. PHMSA requested additional information on relevant documentation and content numbers (or at least maximum accepted limits) for the following: - Volatile Organic Compounds (VOCs) Content - H2S Content - Sulfur Content - CO2 Content - API gravity limits - free water limits – BS&W – 0.5% solids and water content – “proposed” tariff" Response: The tariff that will be filed with FERC for transportation on the Keystone XL pipeline will set forth the following specifications to govern the quality of the petroleum (i.e., crude oil) that shippers may tender for transportation:
ARTICLE 4 QUALITY
4.1 Permitted Petroleum. Only that Petroleum having properties that conform to the specifications of Petroleum described in Sections 4.2, 4.3 and 4.4 will be permitted in the Pipeline System. Shipper will not Tender to Carrier, and Carrier will have no obligation to accept, transport or Deliver Petroleum which does not meet said specifications.
4.2 Specifications of Petroleum. For the purposes of Section 4.1, the specifications of the Petroleum shall be as follows: (i) Reid Vapor Pressure shall not exceed one hundred and three kiloPascals (103kPa); (ii) sediment and water shall not exceed one-half of one percent (0.5%) of volume, as determined by the centrifuge method in accordance with ASTM D4007 standards (most current version) or by any other test that is generally accepted in the petroleum industry as may be implemented from time to time; (iii) the temperature at the Receipt Point shall not exceed thirty-eight degrees Celsius (38°C); (iv) the density at the Receipt Point shall not exceed nine hundred and forty kilograms per Cubic Meter (940 kg/m3); (v) the kinematic viscosity shall not exceed three hundred and fifty (350) square millimetres per second (mm2/s) determined at the

Page 2 of 2 Response
Carrier’s reference line temperature as posted on Carrier’s electronic bulletin board; and (vi) shall have no physical or chemical characteristics that may render such Petroleum not readily transportable by Carrier or that may materially affect the quality of other Petroleum transported by Carrier or that may otherwise cause disadvantage or harm to Carrier or the Pipeline System, or otherwise impair Carrier’s ability to provide service on the Pipeline System.
4.3 Modifications to Specifications. Notwithstanding Sections 4.1 and 4.2, or any other provision in these Rules and Regulations to the contrary, Carrier shall have the right to make any reasonable changes to the specifications under Section 4.2 from time to time to ensure measurement accuracy and to protect Carrier, the Pipeline System or Carrier’s personnel, provided that Carrier shall give Shipper reasonable notice of such changes prior to filing.
4.4 Freedom from Objectionable Matter. Petroleum shall not contain sand, dust, dirt, gums, impurities or other objectionable substances in quantities that may be injurious to Carrier, the Pipeline System or downstream facilities, or which may otherwise interfere with the transportation of Petroleum in the Pipeline System.
The Keystone XL pipeline is expected to transport primarily heavy crude oils. Below are the Material Safety Data Sheets (MSDS) for two of the most popular and largest heavy crude oils produced in Western Canada - Cold Lake and Western Canadian Select. These crudes are a blend of many different producers’ products and thus provide a good basis for comparison with regards to heavy crude types. Between the MSDS and the information captured from crude monitor, all of contents in question can be addressed with exception to CO2. There has been no record of a noteworthy presence of carbon dioxide in heavy crudes emanating from the WSCB. TransCanada expects that the crude transported by Keystone will contain little to no carbon dioxide and thus it’s presence in the crude stream is negligible.

EnCana Corporation Material Safety Data Sheet Heavy Crude Oil/Diluent Mix – Christina Lake/Foster Creek Page 1 of 2 SECTION 1 – MATERIAL IDENTIFICATION AND USE Material Name: HEAVY CRUDE OIL/DILUENT MIX (CHRISTINA LAKE/FOSTER CREEK) Use: Process stream, fuels and lubricants production WHMIS Classification: Class B, Div. 2, Class D, Div. 2, Sub-Div. A and B
NFPA: Fire: 2 Reactivity: 0 Health: 3 TDG: UN: 1267 Class: 3 Packing Group: I (boiling point less than 35 deg. C) II (boiling point 35 deg. C or above, and flash point less than 23 deg. C) Manufacturer/Supplier: ENCANA CORPORATION
#1800, 855 - 2nd Street S.W., P.O. BOX 2850, CALGARY, ALBERTA, T2P 2S5 Emergency Telephone: 403-645-3333 Chemical Family: Crude oil/condensate mix SECTION 2 – HAZARDOUS INGREDIENTS OF MATERIAL Hazardous Approximate C.A.S. LD50/LC50 Exposure Ingredients Concentrations (%) Nos. Specify Species Limits & Route Crude oil 50 - 70 8002-05-9 LD50,rat, skin,>2 g/kg 5 mg/m3 (OEL,TLV) Hydrocarbon Diluent 30 - 50 N.Av. N.Av. 900 mg/m3 (OEL)* Benzene 0.05 - 0.1 71-43-2 LD50,rat,oral,930 mg/kg 1 ppm (OEL), LC50,rat,4 hr,13200 ppm 0.5 ppm (TLV) Hydrogen Sulphide <20 ppm 7783-06-04 LC50, rat, 4 hrs, 444 ppm 10 ppm (OEL,TLV) OEL = 8 hr. Alberta Occupational Exposure Limit; TLV = Threshold Limit Value (8 hrs) *OEL for gasoline SECTION 3 – PHYSICAL DATA FOR MATERIAL Physical State: Liquid Vapour Pressure (mmHg): approx. 300 @ 20C Specific Gravity: 0.92 – 0.94 Odour Threshold (ppm): N.Av. Vapour Density (air=1): 2.5 -5.0 Evaporation Rate: N.Av. Percent Volatiles, by volume: 20 - 30 (estimated) Boiling Pt. (deg.C): initial B.Pt. variable (16 – 30C) pH: N.Av. Freezing Pt. (deg.C): <0 Coefficient of Water/Oil Distribution: <0.1 Odour & Appearance: Brown/black liquid, hydrocarbon odour (N.Av. = not available N.App. = not applicable) SECTION 4 – FIRE AND EXPLOSION Flammability: Yes Conditions: Material will ignite at normal temperatures. Means of Extinction: Foam, CO2, dry chemical. Explosive accumulations can build up in areas of poor ventilation. Special Procedures: Use water spray to cool fire-exposed containers, and to disperse vapors if spill has not ignited. Cut off fuel and allow flame to burn out. Flash Point (deg.C) & Method: <-35 (PMCC) Upper Explosive Limit (% by vol.): 8 (estimated) Sensitivity to Impact: No Lower Explosive Limit (% by vol.): 0.8 (estimated) Sensitivity to Static Discharge: Yes, at elevated temperatures Auto-Ignition Temp. (deg.C): 250 (estimated) TDG Flammability Classification: N.App. Hazardous Combustion Products: Carbon monoxide, carbon dioxide, sulphur oxides SECTION 5 – REACTIVITY DATA Chemical Stability: Stable Conditions: Heat Incompatibility: Yes Substances: Oxidizing agents (e.g. chlorine) Reactivity: Yes Conditions: Heat, strong sunlight Hazardous Decomposition Products: Carbon monoxide, carbon dioxide, sulphur oxides

Encana Corporation Material Safety Data Sheet Heavy Crude Oil/Diluent Mix – Christina Lake/Foster Creek Page 2 of 2 SECTION 6 – TOXICOLOGICAL PROPERTIES OF PRODUCT Routes of Entry: Skin Absorption : Yes Skin Contact: Yes Eye Contact: Yes Inhalation: Acute: Yes Chronic: Yes Ingestion: Yes Effects of Acute Exposure: Vapour may cause irritation of eyes, nose and throat, dizziness and drowsiness. Contact with skin may cause irritation and possibly dermatitis. Contact of liquid with eyes may cause severe irritation/burns. Effects of Chronic Exposure: Due to presence of benzene, long term exposure may increase the risk of anaemia and leukemia. Repeated skin contact may increase the risk of skin cancer. Sensitization to Product: No. Exposure Limits of Product: 1 ppm (Alberta 8 hr OEL for benzene) Irritancy: Yes Synergistic Materials: None reported Carcinogenicity: Yes Reproductive Effects: Possibly Teratogenicity: Possibly Mutagenicity: Possibly SECTION 7 – PREVENTIVE MEASURES Personal Protective Equipment: Use positive pressure self-contained breathing apparatus, supplied air breathing apparatus or cartridge air purifying respirator approved for organic vapours where concentrations may exceed exposure limits (note: cartridge respirator not suitable for oxygen deficiency or IDLH situations). Gloves: Viton (nitrile adequate for short exposure to liquid) Eye: Chemical splash goggles. Footwear: As per safety policy Clothing: As per fire protection policy Engineering Controls: Use only in well ventilated areas. Mechanical ventilation required in confined areas. Equipment must be explosion proof. Leaks & Spills: Stop leak if safe to do so. Use personal protective equipment. Use water spray to cool containers. Remove all ignition sources. Provide explosion-proof clearing ventilation, if possible. Prevent from entering confined spaces. Dyke and pump into containers for recycling or disposal. Notify appropriate regulatory authorities. Waste Disposal: Contact appropriate regulatory authorities for disposal requirements. Handling Procedures & Equipment: Avoid contact with liquid. Avoid inhalation. Bond and ground all transfers. Avoid sparking conditions. Storage Requirements: Store in a cool, dry, well ventilated area away from heat, strong sunlight, and ignition sources. Special Shipping Provisions: N.App. SECTION 8 – FIRST AID MEASURES Skin: Flush skin with water, removing contaminated clothing. Get medical attention if irritation persists or
large area of contact. Decontaminate clothing before re-use. Eye: Immediately flush with large amounts of luke warm water for 15 minutes, lifting upper and lower lids at
intervals. Seek medical attention if irritation persists. Inhalation: Ensure own safety. Remove victim to fresh air. Give oxygen, artificial respiration, or CPR if needed.
Seek medical attention immediately. Ingestion: Give 2-3 glasses of milk or water to drink. DO NOT INDUCE VOMITING. Keep warm and at rest.
Get immediate medical attention. SECTION 9 – PREPARATION DATE OF MSDS Prepared By: EnCana Environment, Health and Safety (EHS) Phone Number: (403) 645-2000 Preparation Date: August 19, 2009 Expiry Date: August 19, 2012

Material Safety Data Sheet
Common/Tradename
Synonyms
Chemical family
Material uses
Western Canadian Select (WCS)
Not available.
Blend of Heavy Petroleum Crude, Medium Sweet Crude andSynthetic Crude.
Chemical feedstock
3
WHMIS TDG Road/Rail
Section I. Product Identification and Uses
Supplier Husky Oil Operations LimitedPO Box 6525 Station 'D'Calgary, Alberta T2P 3G7403-298-6111
Personal Protection
CAS #
DSL
Manufacturer
8002-05-09
On the DSL list.
Husky Oil OperationsLimitedPO Box 6525 Station 'D'Calgary, Alberta T2P 3G7403-298-6111
Missing pictogram
If swallowed, do not induce vomiting or give liquids. Seek immediate medical attention.
Eye contact
Skin contact
Inhalation
Ingestion
Flush eyes for at least 15 minutes with clean water. Patch lightly, allowing drainage. Seek medicalattention.
Remove contaminated clothing. Wash skin thoroughly with soap and water. Seek medical attention ifirritation develops.
Protect rescuer. Move exposed person to fresh air. If breathing has stopped apply artificial respiration.Seek medical attention.
Section 2. First Aid Measures
Crude Oil (Hydrocarbons C5 and C6 Rich) 8002-05-09 100 n/av n/av n/av n/av n/av 100Hydrogen Sulphide 7783-06-4 10 14 15 21 n/av n/av <0.5Benzene 71-43-2 0.5 n/av 2.5 n/av 0.1-1Toluene 108-88-3 20 n/av 1-5Xylene 1330-20-7 100 n/av 150 n/av 1-30
Crude oil (Hydrocarbons C5 and C6 Rich) LD50:4,300 mg/Kg (Rat). LC50: Not available.Hydrogen Sulphide (H2S) LC50 Inhalation Mouse = 673 ppm 1 hour. LC50 Inhalation Rat =444 ppm for 4 hoursBenzene. LD50 Oral rat= 930-5600 mg/Kg. LC50 Inhalation rat = 13,700 ppm for 4 hrs.Xylene. LD50 Oral rat= 4300 mg/Kg. LC50 Inhalation rat= 6700 ppm for 4 hrs. LD50 Dermalrabbit >2000 mg/Kg.Toluene. LD50 Oral rat= 5000 mg/Kg. LC50 Inhalation rat= 8000 ppm for n4 hrs. LD50 Dermalrabbit= 14000 mg/Kg.
Toxicity values of thehazardous ingredients
Section 3. Hazardous Ingredients
CAS #Name TWA(ppm)
STEL(ppm)
CEIL(ppm)
% byWeight
Exposure Limits
TWA(Mg/M3)
STEL(Mg/M3)
CEIL(Mg/M3)
Continued on Next Page

Western Canadian Select (WCS) Page Number: 2
Physical state andappearance
Evaporation rate
pH (1% soln/water)
Odor
Freezing point
Boiling point
Vapor pressure
Odor threshold
Specific gravity
Vapor density
Water/oil dist. coeff.
Solubility
Liquid. Black/Brown.
Not available.
Not applicable.
Not available.
10°C - 1000°C
0.92 -0.94 (Water = 1)
Not available.
Not available.
Not available.
Not available.
Petroleum Odour
O.13 ppm H2S
Section 4. Physical Data
Molecular Weight Not applicable.
Volatility 100 (%vol)
Melting Point Not available.
Density Not available.
Auto-ignitiontemperature
Flash points
Extinguishing Media
Flammable limits
Flammability
Not available.
CLOSED CUP: -40°C (-40°F)
Not available.
Use DRY chemicals, CO2, or foam to extinguish fire. Water may not be an effective medium toextinguish fire. Cool containing vessels with water jet in order to prevent pressure build-up,autoignition or explosion.
Highly flammable liquid. Released vapours may form flammable/explosive mixtures at or above theflash point. Vapours may travel considerable distances to ignition sources and cause a flash fire. Allstorage containers and pumping equipment must be grounded.
No additional remark.Remark
Risks of explosion This material is sensitive to static discharge. This product is not sensitive to mechanical impact.
No additional remark.
Section 5. Fire and Explosion Data
Remark
Special fire fightingprocedures
Use supplied air or self contained breathing apparatus (SCBA) for large fires or for fires in enclosedareas.
Hazardous decomp.products
Stability
Reactivity
Remark
The product is stable.
Carbon monoxide, carbon dioxide and irritant fumes and gases including sulphur oxides, nitrogenoxides and aldehydes.
Incompatible material: Strong acids, strong oxidizers, chlorine. Hazardous polymerization: Will notoccur.
No additional remark.
Section 6. Reactivity Data
Continued on Next Page
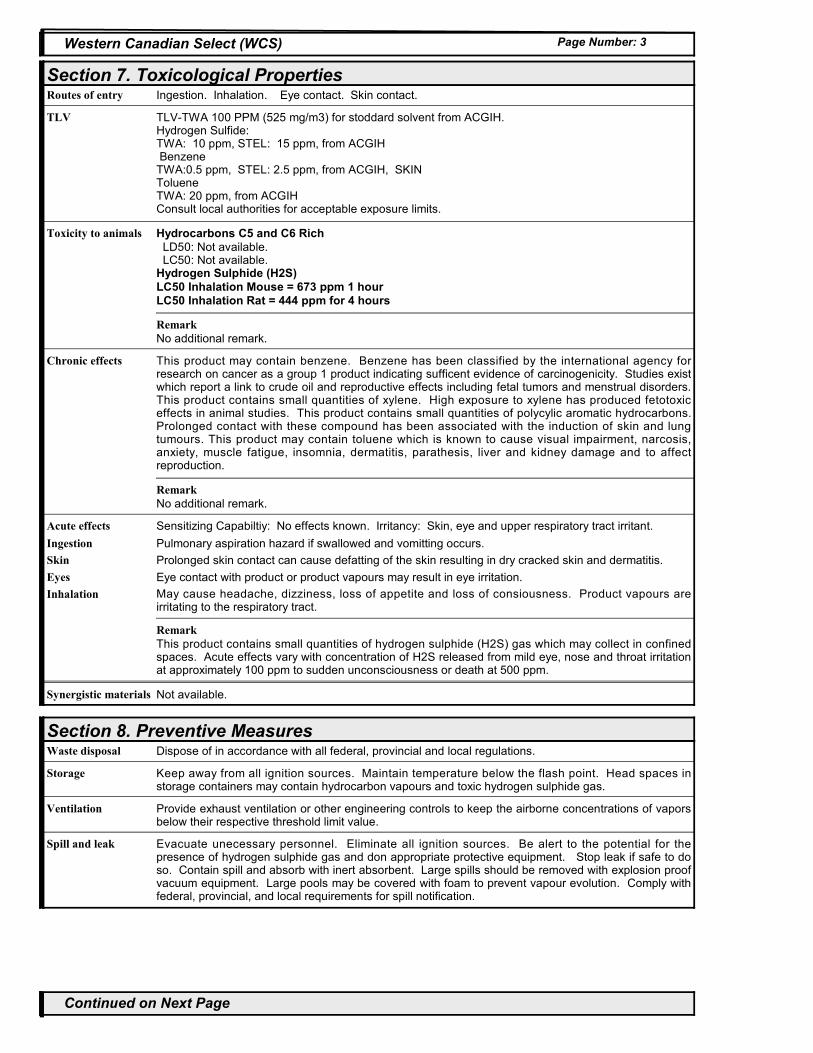
Western Canadian Select (WCS) Page Number: 3
Toxicity to animals
Acute effects
Remark
Remark
Routes of entry
Synergistic materials
Ingestion. Inhalation. Eye contact. Skin contact.
Hydrocarbons C5 and C6 RichLD50: Not available.
LC50: Not available.Hydrogen Sulphide (H2S)LC50 Inhalation Mouse = 673 ppm 1 hourLC50 Inhalation Rat = 444 ppm for 4 hours
Not available.
Sensitizing Capabiltiy: No effects known. Irritancy: Skin, eye and upper respiratory tract irritant.
No additional remark.
This product contains small quantities of hydrogen sulphide (H2S) gas which may collect in confinedspaces. Acute effects vary with concentration of H2S released from mild eye, nose and throat irritationat approximately 100 ppm to sudden unconsciousness or death at 500 ppm.
No additional remark.
TLV TLV-TWA 100 PPM (525 mg/m3) for stoddard solvent from ACGIH.Hydrogen Sulfide:TWA: 10 ppm, STEL: 15 ppm, from ACGIH BenzeneTWA:0.5 ppm, STEL: 2.5 ppm, from ACGIH, SKINTolueneTWA: 20 ppm, from ACGIHConsult local authorities for acceptable exposure limits.
Section 7. Toxicological Properties
Remark
May cause headache, dizziness, loss of appetite and loss of consiousness. Product vapours areirritating to the respiratory tract.
Prolonged skin contact can cause defatting of the skin resulting in dry cracked skin and dermatitis.
Eye contact with product or product vapours may result in eye irritation.
Pulmonary aspiration hazard if swallowed and vomitting occurs.
Inhalation
Skin
Eyes
Ingestion
Chronic effects This product may contain benzene. Benzene has been classified by the international agency forresearch on cancer as a group 1 product indicating sufficent evidence of carcinogenicity. Studies existwhich report a link to crude oil and reproductive effects including fetal tumors and menstrual disorders.This product contains small quantities of xylene. High exposure to xylene has produced fetotoxiceffects in animal studies. This product contains small quantities of polycylic aromatic hydrocarbons.Prolonged contact with these compound has been associated with the induction of skin and lungtumours. This product may contain toluene which is known to cause visual impairment, narcosis,anxiety, muscle fatigue, insomnia, dermatitis, parathesis, liver and kidney damage and to affectreproduction.
Waste disposal
Storage
Ventilation
Spill and leak
Dispose of in accordance with all federal, provincial and local regulations.
Keep away from all ignition sources. Maintain temperature below the flash point. Head spaces instorage containers may contain hydrocarbon vapours and toxic hydrogen sulphide gas.
Evacuate unecessary personnel. Eliminate all ignition sources. Be alert to the potential for thepresence of hydrogen sulphide gas and don appropriate protective equipment. Stop leak if safe to doso. Contain spill and absorb with inert absorbent. Large spills should be removed with explosion proofvacuum equipment. Large pools may be covered with foam to prevent vapour evolution. Comply withfederal, provincial, and local requirements for spill notification.
Provide exhaust ventilation or other engineering controls to keep the airborne concentrations of vaporsbelow their respective threshold limit value.
Section 8. Preventive Measures
Continued on Next Page

Western Canadian Select (WCS) Page Number: 4
TDG CLASS 3: Flammable liquid with a flash point less than or equal to 60.5 C (140.9 F). Closed cup testmethod.
3
WHMIS WHMIS CLASS B-2: Flammable liquid with a flash point lower than 37.8°C (100°F).WHMIS CLASS D-2A: Material causing other toxic effects (VERY TOXIC). WHMIS CLASS D-2B: Material causing other toxic effects (TOXIC).
PIN: 1267 - PETROLEUM CRUDE OIL
TDG road /rail
Section 9. Classification/Regulatory Information
Remark
No additional remark.
No additional remark.
Remark
This product is on the Domestic Substances List (DSL). TSCA (Toxic Substance Control Act): This product islisted on the TSCA Inventory.
Other
Refer to federal, provincial, and local legislation for further requirements.
As required by the situation according to your companies policies and procedures. Contact your supervisorfor direction.
Section 10. Protective ClothingEye
Skin
Respiratory
Other
Non-vented chemical goggles to prevent eye irritation from the solvent vapours.
Impervious gloves and clothing should be worn as appropriate to protect against skin contact. Neoprene ornitrile material is suggested.
Respiratory protection may be required in poorly ventilated areas. Properly fitted air purifying masks equippedwith organic vapour filters will provide protection at low concentrations. Air supplied respirators or positivepressure self contained breathing apparatus is required when atmospheric concentrations of hydrocarbonvapours are likely to exceed 10X the occupational exposure limit or when high concentrations of H2S may bepresent.
References -Provisional Domestic Substances List, Canadian Ennvironmental Protection Act, Volume 1-Registry NumberIndex, April 1990; Environment Canada. -SAX, N.I. Dangerous Properties of Industrial Materials. Toronto,Van Nostrand Reinold, 6e ed. 1984. CCOHS (Chem advi) CCOHS(Cheminfo) Doccumentation of the Threshold Limit Values and Biological Exposure Indices (ACGIH) Pocket Guide to Chemical Hazards (NIOSH) Transportation of Dangerous Goods Shedule II List II
Validated by Husky Corporate Hygiene on 3/19/2009. V e r i f i e d b y H u s k y C o r p o r a t eHygiene.
Section 11. Preparation Information
Printed 3/9/2009.Supersedes: 11/28/2005
Acronyms: TLV = Threshold Limit Value N/AP = Not applicable N/AV = Not Available COC = Cleveland Open Cup PMCC =Pensky Martens Closed Cup
MSDS Status
Continued on Next Page

Western Canadian Select (WCS) Page Number: 5
While the company believes the data set forth herein are accurate as of the date hereof, the company makes nowarranty with respect thereto and expressly disclaims all liability for reliance thereon. Such data are offered solelyfor your consideration, investigation and verification.
Emergency Phone # 403-262-2111
Pipeline and Hazardous Materials Safety Administration Docket Number PHMSA 2008-0285 TransCanada Keystone Pipeline, L.P. Application to Design, Construct and Operate the Keystone XL Oil Pipeline at 80% Specified Minimum Yield Strength (SMYS) Response to PHMSA February 10, 2010
Page 1 of 1 “Please ask Keystone to add English Units.” Response: Please find attached hydraulic profile charts in English Units. These are the same profiles presented in appendix A and appendix B submitted to PHMSA on November 19, 2009 in response to the query regarding hydraulic modeling and valve closure scenarios.

Appendix A
Steady State Pressure Profile

Wait...
DILBIT18CQ3
KXL Update: Pressure and Flow Rate Profiles (Dilbit Q3 at 1000 kbpd)
Pipeline Length (mile)0.00 124. 249. 373. 497. 621. 746. 870. 994. 1118.1242. 1367. 1491. 1616. 1740. 1864. 1988.
Pressure (Psig)
0.00
73.
145.
218.
290.
363.
435.
508.
580.
653.
725.
798.
870.
943.
1015.
1088.
1160.
1233.
1305.
1378.
1450.
1523.
1595.
Flow Rate (kbpd
)
0.00
60.
121.
181.
242.
302.
362.
422.
483.
543.
604.
664.
725.
785.
845.
906.
966.
1026.
1086.
1147.
1208.
1268.
1328.
EOL.NEDERLAND
PS41
PS40
PS39
PS38
PS37
PS36
PS35
PS34
PS33
PS32.CUSHING
PS31
PS30
PS29
PS28
PS27
PS26.STEELECITY
PS25
PS24
PS23
PS22
PS21
PS20
PS19
PS18
PS17
PS16
PS15
PS14
PS13
PS12
PS11
PS10
PS09
PS08
PS07
PS06
PS05
PS04
PS03
PS02
PS01.HARDISTY ELEVATION
PRESSURE
STANDARD.FLOW
MAOP
TIME = 05/07 00:52:46STEP = 00:14:54

Wait...
DILBIT18CQ3
KXL Update: Head and Flow Profiles (Dilbit Q3 at 1000 kbpd)
Pipeline Distance (mile)0.00 124. 249. 373. 497. 621. 746. 870. 994. 1118.1242.1367.1491. 1616. 1740.1864.1988.
Head (ft)
0.00
328.
656.
984.
1312.
1640.
1969.
2297.
2625.
2953.
3281.
3609.
3937.
4265.
4593.
4921.
5249.
5577.
5906.
6234.
6562.
6890.
7218.
7546.
7874.
8202.
Flow Rate (kbpd
)
0.00
45.
91.
136.
181.
226.
272.
317.
362.
408.
453.
498.
543.
589.
634.
679.
725.
770.
815.
860.
906.
951.
996.
1042.
1087.
1132.
EOL.NEDERLAND
PS41
PS40
PS39
PS38
PS37
PS36
PS35
PS34
PS33
PS32.CUSHING
PS31
PS30
PS29
PS28
PS27
PS26.STEELECITY
PS25
PS24
PS23
PS22
PS21
PS20
PS19
PS18
PS17
PS16
PS15
PS14
PS13
PS12
PS11
PS10
PS09
PS08
PS07
PS06
PS05
PS04
PS03
PS02
PS01.HARDISTY
ELEVATION
HEAD
MAOH
STANDARD.FLOW
TIME = 05/07 00:52:46STEP = 00:14:54

Appendix B
Transient Pressure Profiles
Scenario I
Mainline Valve at Suction Side of a Pump Station

Wait...
DILBIT18CQ3 SCO
KXL: Pressure Surge, ML_BV12_2 Closure
Pipeline Length (mile)403.9 416.3 428.7 411.2 453.6 466.0 478.4 490.9 503.3 515.7 528.2 540.6 553.0
Pressure (Psig)
0.000
73.
145.
218.
290.
363.
435.
508.
580.
653.
725.
798.
870.
943.
1015.
1088.
1160.
1233.
1305.
1378.
1450.
1523.
1595.
1668.
1740.
1813.
Flow Rate (kbpd
)
0.000
60.
121.
181.
242.
302.
362.
423.
483.
543.
604.
664.
725.
785.
845.
906.
966.
1026.
1087.
1147.
1208.
1268.
1328.
1389.
1449.
1510.
PS13
PS12
PS11
ELEVATION
PRESSURE STANDARD.FLOW
MAOP
MAX.PRESSURE
MASP
TIME = 00:00:00STEP = 00:00:00

Wait...
DILBIT18CQ3 SCO
KXL: Pressure Surge, ML_BV12_2 Closure
Pipeline Length (mile)403.9 416.3 428.7 411.2 453.6 466.0 478.4 490.9 503.3 515.7 528.2 540.6 553.0
Pressure (Psig)
0.000
73.
145.
218.
290.
363.
435.
508.
580.
653.
725.
798.
870.
943.
1015.
1088.
1160.
1233.
1305.
1378.
1450.
1523.
1595.
1668.
1740.
1813.
Flow Rate (kbpd
)
0.000
60.
121.
181.
242.
302.
362.
423.
483.
543.
604.
664.
725.
785.
845.
906.
966.
1026.
1087.
1147.
1208.
1268.
1328.
1389.
1449.
1510.
PS13
PS12
PS11
ELEVATION
PRESSURE STANDARD.FLOW
MAOP
MAX.PRESSURE
MASP
TIME = 00:02:41STEP = 00:00:01

Wait...
DILBIT18CQ3 SCO
KXL: Pressure Surge, ML_BV12_2 Closure
Pipeline Length (mile)403.9 416.3 428.7 411.2 453.6 466.0 478.4 490.9 503.3 515.7 528.2 540.6 553.0
Pressure (Psig)
0.000
73.
145.
218.
290.
363.
435.
508.
580.
653.
725.
798.
870.
943.
1015.
1088.
1160
1233.
1305.
1378.
1450.
1523.
1595.
1668.
1740.
1813.
Flow Rate (kbpd
)
0.000
60.
121.
181.
242.
302.
362.
423.
483.
543.
604.
664.
725.
785.
845.
906.
966.
1026.
1087.
1147.
1208.
1268.
1328.
1389.
1449.
1510.
PS13
PS12
PS11
ELEVATION
PRESSURESTANDARD.FLOW
MAOP
MAX.PRESSURE
MASP
TIME = 00:03:09STEP = 00:00:01

Wait...
DILBIT18CQ3 SCO
KXL: Pressure Surge, ML_BV12_2 Closure
Pipeline Length (mile)403.9 416.3 428.7 411.2 453.6 466.0 478.4 490.9 503.3 515.7 528.2 540.6 553.0
Pressure (Psig)
0.000
73.
145.
218.
290.
363.
435.
508.
580.
653.
725.
798.
870.
943.
1015.
1088.
1160.
1233.
1305.
1378.
1450.
1523.
1595.
1668.
1740.
1813.
Flow Rate (kbpd
)
0.000
60.
121.
181.
242.
302.
362.
423.
483.
543.
604.
664.
725.
785.
845.
906.
966.
1026.
1087.
1147.
1208.
1268.
1328.
1389.
1449.
1510.
PS13
PS12
PS11
ELEVATION
PRESSURE
STANDARD.FLOW
MAOP
MAX.PRESSURE
MASP
TIME = 00:04:31STEP = 00:00:00

Wait...
DILBIT18CQ3 SCO
KXL: Pressure Surge, ML_BV12_2 Closure
Pipeline Length (mile)403.9 416.3 428.7 411.2 453.6 466.0 478.4 490.9 503.3 515.7 528.2 540.6 553.0
Pressure (Psig)
0.000
73.
145.
218.
290.
363.
435.
508.
580.
653.
725.
798.
870.
943.
1015.
1088.
1160.
1233.
1305.
1378.
1450.
1523.
1595.
1668.
1740.
1813.
Flow Rate (kbpd
)
0.000
60.
121.
181.
242.
302.
362.
423.
483.
543.
604.
664.
725.
785.
845.
906.
966.
1026.
1087.
1147.
1208.
1268.
1328.
1389.
1449.
1510.
PS13
PS12
PS11
ELEVATION
PRESSURE
STANDARD.FLOW
MAOP
MAX.PRESSURE
MASP
TIME = 00:06:08STEP = 00:00:00

Wait...
DILBIT18CQ3 SCO
KXL: Pressure Surge, ML_BV12_2 Closure
Pipeline Length (mile)403.9 416.3 428.7 411.2 453.6 466.0 478.4 490.9 503.3 515.7 528.2 540.6 553.0
Pressure (Psig)
0.000
73.
145.
218.
290.
363.
435.
508.
580.
653.
725.
798.
870.
943.
1015.
1088.
1160.
1233.
1305.
1378.
1450.
1523.
1595.
1668.
1740.
1813.
Flow Rate (kbpd
)
0.000
60.
121.
181.
242.
302.
362.
423.
483.
543.
604.
664.
725.
785.
845.
906.
966.
1026.
1087.
1147.
1208.
1268.
1328.
1389.
1449.
1510.
PS13
PS12
PS11
ELEVATION
PRESSURE
STANDARD.FLOW
MAOPMAX.PRESSURE
MASP
TIME = 00:07:26STEP = 00:00:00

Wait...
KXL: Pressure Surge, ML_BV12_2 Closure
Time(minute)0.0 0.5 1.0 1.5 2.0 2.5 3.0 3.5 4.0 4.5 5.0 5.5 6.0 6.5 7.0 7.5 8.0
Pressure (Psig)
0.000
73.
145.
218.
290.
363.
435.
508.
580.
653.
725.
798.
870.
943.
1015.
1088.
1160.
1233.
1305.
1378.
1450.
1523.
1595.
1668.
1740.
1813.
Flow(kbpd)
0.000
45.
91.
136.
181.
226.
272.
317.
362.
408.
452.
498.
543.
589.
634.
679.
725.
770.
815.
860.
905.
951.
996.
1042.
1087.
10923
9930
ML_BV12_2:P-
ML_BV12_2:Q-
PS12_P01:P-
PS12_P05:P+
PS12_P05:RPM
PS11_BV_OUT:P+
TIME = 00:07:51STEP = 00:00:00

Appendix B
Transient Pressure Profiles
Scenario II
Mainline Valve at Discharge Side of a Pump Station

Wait...
DILBIT18CQ3 SCO
KXL: Pressure Surge, ML_BV15_1 Closure
Pipeline Length (mile)559. 572. 584. 597. 609. 621. 634. 646. 659. 671. 684. 696. 708.
Pressure (Psig)
0.00
73.
145.
218.
290.
363.
435.
508.
580.
653.
725.
798.
870.
943.
1015.
1088.
1160.
1233.
1305.
1378.
1450.
1523.
1595.
1668.
1740.
1813.
Flow Rate (kbpd
)
0.000
60.
121.
181.
242.
302.
362.
423.
483.
543.
604.
664.
725.
785.
845.
906.
966.
1026.
1087.
1147.
1208.
1268.
1328.
1389.
1449.
1510.
PS17
PS16
PS15
PS14 ELEVATION
PRESSURE
STANDARD.FLOW
MAOP
MAX.PRESSURE
MASP
TIME = 00:00:00STEP = 00:00:00

Wait...
DILBIT18CQ3 SCO
KXL: Pressure Surge, ML_BV15_1 Closure
Pipeline Length (mile)559. 572. 584. 597. 609. 621. 634. 646. 659. 671. 684. 696. 708.
Pressure (Psig)
0.000
73.
145.
218.
290.
363.
435.
508.
580.
653.
725.
798.
870.
943.
1015.
1088.
1160.
1233.
1305.
1378.
1450.
1523.
1595.
1668.
1740.
1813.
Flow Rate (kbpd
)
0.000
60.
121.
181.
242.
302.
362.
423.
483.
543.
604.
664.
725.
785.
845.
906.
966.
1026.
1087.
1147.
1208.
1268.
1328.
1389.
1449.
1510
PS17
PS16
PS15
PS14 ELEVATION
PRESSURE
STANDARD.FLOW
MAOP
MAX.PRESSURE
MASP
TIME = 00:02:46STEP = 00:00:01

Wait...
DILBIT18CQ3 SCO
KXL: Pressure Surge, ML_BV15_1 Closure
Pipeline Length (mile)559. 572. 584. 597. 609. 621. 634. 646. 659. 671. 684. 696. 708.
Pressure (Psig)
0.00
73.
145.
218.
290.
363.
435.
508.
580.
653.
725.
798.
870.
943.
1015.
1088.
1160.
1233.
1305.
1378.
1450.
1523.
1595.
1668.
1740.
1813.
Flow Rate (kbpd
)
0.00
60.
121.
181.
242.
302.
362.
423.
483.
543.
604.
664.
725.
785.
845.
906.
966.
1026.
1087.
1147.
1208.
1268.
1328.
1389.
1449.
1510.
PS17
PS16
PS15
PS14 ELEVATION
PRESSURE
STANDARD.FLOW
MAOP
MAX.PRESSURE
MASP
TIME = 00:03:03STEP = 00:00:01

Wait...
DILBIT18CQ3 SCO
KXL: Pressure Surge, ML_BV15_1 Closure
Pipeline Length (mile)559. 572. 584. 597. 609. 621. 634. 646. 659. 671. 684. 696. 708.
Pressure (Psig)
0.00
73.
145.
218.
290.
363.
435.
508.
580.
653.
725.
798.
870.
943.
1015.
1088.
1160.
1233.
1305.
1378.
1450.
1523.
1595.
1668.
1740.
1813.
Flow Rate (kbpd
)
0.00
60.
121.
181.
242.
302.
362.
423.
483.
543.
604.
664.
725.
785.
845.
906.
966.
1026.
1087.
1147.
1208.
1268.
1328.
1389.
1449.
1510.
PS17
PS16
PS15
PS14 ELEVATION
PRESSURE
STANDARD.FLOW
MAOP
MAX.PRESSURE
MASP
TIME = 00:04:32STEP = 00:00:01

Wait...
DILBIT18CQ3 SCO
KXL: Pressure Surge, ML_BV15_1 Closure
Pipeline Length (mile)559. 572. 584. 597. 609. 621. 634. 646. 659. 671. 684. 696. 708.
Pressure (Psig)
0.00
73.
145.
218.
290.
363.
435.
508.
580.
653.
725.
798.
870.
943.
1015.
1088.
1160.
1233.
1305.
1378.
1450.
1523.
1595.
1668.
1740.
1813.
Flow Rate (kbpd
)
0.00
60.
121.
181.
242.
302.
362.
423.
483.
543.
604.
664.
725.
785.
845.
906.
966.
1026.
1087.
1147.
1208.
1268.
1328.
1389.
1449.
1510.
PS17
PS16
PS15
PS14 ELEVATION
PRESSURE
STANDARD.FLOW
MAOP
MAX.PRESSURE
MASP
TIME = 00:04:38STEP = 00:00:00

Wait...
DILBIT18CQ3 SCO
KXL: Pressure Surge, ML_BV15_1 Closure
Pipeline Length (mile)559. 572. 584. 597. 609. 621. 634. 646. 659. 671. 684. 696. 708.
Pressure (Psig)
0.00
73.
145.
218.
290.
363.
435.
508.
580.
653.
725.
798.
870.
943.
1015.
1088.
1160.
1233.
1305.
1378.
1450.
1523.
1595.
1668.
1740.
1813.
Flow Rate (kbpd
)
0.00
60.
121.
181.
242.
302.
362.
423.
483.
543.
604.
664.
725.
785.
845.
906.
966.
1026.
1087.
1147.
1208.
1268.
1328.
1389.
1449.
1510.
PS17
PS16
PS15
PS14 ELEVATION
PRESSURESTANDARD.FLOW
MAOP
MAX.PRESSURE
MASP
TIME = 00:05:44STEP = 00:00:00

Wait...
KXL: Pressure Surge, ML_BV15_1 Closure
Time(minute)0.0 0.5 1.0 1.5 2.0 2.5 3.0 3.5 4.0 4.5 5.0 5.5 6.0
Pressure (Psig)
0.00
73.
145.
218.
290.
363.
435.
508.
580.
653.
725.
798.
870.
943.
1015.
1088.
1160.
1233.
1305.
1378.
1450.
1523.
1595.
1668.
1740.
1813.
Flow(kbpd)
0.00
45.
91.
136.
181.
226.
272.
317.
362.
408.
452.
498.
543.
589.
634.
679.
725.
770.
815.
860.
905.
951.
996.
1042.
1087.
10923
9930
ML_BV15_1:P-
ML_BV15_1:Q-
PS15_P01:P-
PS15_P05:P+
PS15_P04:RPM
PS14_BV_OUT:P+
TIME = 00:05:53STEP = 00:00:00

Appendix B
Transient Pressure Profiles
Scenario III
Mainline Valve at the Midpoint between Two Pump Stations

Wait...
DILBIT18CQ3
KXL: Pressure Surge, ML_BV20_1 Closure
Pipeline Length (mile) 777. 789. 802. 814. 826. 839. 851. 864. 876. 889. 901. 913. 926.
Pressure (Psig)
0.00
73.
145.
218.
290.
363.
435.
508.
580.
653.
725.
798.
870.
943.
1015.
1088.
1160.
1233.
1305.
1378..
1450.
1523.
1595.
1668.
1740.
1813.
Flow Rate (kbpd
)
0.00
60.
121.
181.
242.
302.
362.
423.
483.
543.
604.
664.
725.
785.
845.
906.
966.
1026.
1087.
1147.
1208.
1268.
1328.
1389.
1449.
1510.
PS21
PS20
PS19ELEVATION
PRESSURE
STANDARD.FLOW
MAOP
MAX.PRESSURE
MASP
TIME = 00:00:00STEP = 00:00:00

Wait...
DILBIT18CQ3
KXL: Pressure Surge, ML_BV20_1 Closure
Pipeline Length (mile) 777. 789. 802. 814. 826. 839. 851. 864. 876. 889. 901. 913. 926.
Pressure (Psig)
0.00
73.
145.
218.
290.
363.
435.
508.
580.
653.
725.
798.
870.
943.
1015.
1088.
1160.
1233..
1305.
1378.
1450.
1523.
1595.
1668.
1740.
1813.
Flow Rate (kbpd
)
0.00
60.
121.
181.
242.
302.
362.
423.
483.
543.
604.
664.
725.
785.
845.
906.
966.
1026.
1087.
1147.
1208.
1268.
1328.
1389.
1449.
1510.
PS21
PS20
PS19ELEVATION
PRESSURE
STANDARD.FLOW
MAOP
MAX.PRESSURE
MASP
TIME = 00:02:30STEP = 00:00:00

Wait...
DILBIT18CQ3
KXL: Pressure Surge, ML_BV20_1 Closure
Pipeline Length (mile) 777. 789. 802. 814. 826. 839. 851. 864. 876. 889. 901. 913. 926.
Pressure (Psig)
0.00
73.
145.
218.
290.
363.
435.
508.
580.
653.
725.
798.
870.
943.
1015.
1088.
1160.
1233.
1305.
1378.
1450.
1523.
1595.
1668.
1740.
1813.
Flow Rate (kbpd
)
0.00
60.
212.
181.
242.
302.
362.
423.
483.
543.
604.
664.
725.
785.
845.
906.
966.
1026.
1087.
1147.
1208.
1268.
1328.
1389.
1449.
1510.
PS21
PS20
PS19ELEVATION
PRESSURE
STANDARD.FLOW
MAOP
MAX.PRESSURE
MASP
TIME = 00:03:10STEP = 00:00:00

Wait...
DILBIT18CQ3
KXL: Pressure Surge, ML_BV20_1 Closure
Pipeline Length (mile) 777. 789. 802. 814. 826. 839. 851. 864. 876. 889. 901. 913. 926.
Pressure (Psig)
0.00
73.
145.
218.
290.
363.
435.
508.
580.
653.
725.
798.
870.
943.
1015.
1088.
1160.
1233.
1305
1378.
1450.
1523.
1595.
1668.
1740.
1813.
Flow Rate (kbpd
)
0.00
60.
121.
181.
242.
302.
362.
423.
483.
543.
604.
664.
725.
785.
845.
906.
966.
1026.
1087.
1147.
1208.
1268.
1328.
1389.
1449.
1510.
PS21
PS20
PS19ELEVATION
PRESSURESTANDARD.FLOW
MAOP
MAX.PRESSURE
MASP
TIME = 00:04:30STEP = 00:00:00

Wait...
DILBIT18CQ3
KXL: Pressure Surge, ML_BV20_1 Closure
Pipeline Length (mile) 777. 789. 802. 814. 826. 839. 851. 864. 876. 889. 901. 913. 926.
Pressure (Psig)
0.00
73.
145.
218.
290.
363.
435.
508.
580.
653.
725.
798.
870.
943.
1015.
1088.
1160.
1233.
1305.
1378.
1450.
1523.
1595.
1668.
1740.
1813.
Flow Rate (kbpd
)
0.00
60.
121.
181.
242.
302.
362.
423.
483.
543.
604.
664.
725.
785.
845.
906.
966.
1026.
1087.
1147.
1208.
1268.
1328.
1389.
1449.
1510.
PS21
PS20
PS19ELEVATION
PRESSURE
STANDARD.FLOW
MAOP
MAX.PRESSURE
MASP
TIME = 00:05:33STEP = 00:00:00

Wait...
DILBIT18CQ3
KXL: Pressure Surge, ML_BV20_1 Closure
Pipeline Length (mile) 777. 789. 802. 814. 826. 839. 851. 864. 876. 889. 901. 913. 926.
Pressure (Psig)
0.00
73.
145.
218.
290.
363.
435.
508.
580.
653.
725.
798.
870.
943.
1015.
1088.
1160.
1233.
1305.
1378.
1450.
1523.
1595.
1668.
1740.
1813.
Flow Rate (kbpd
)
0.00
60.
121.
181.
242.
302.
362.
423.
483.
543.
604.
664.
725.
785.
845.
906.
966.
1026.
1087.
1147.
1208.
1268.
1328.
1389.
1449.
1510.
PS21
PS20
PS19ELEVATION
PRESSURE
STANDARD.FLOW
MAOP
MAX.PRESSURE
MASP
TIME = 00:06:38STEP = 00:00:00

Wait...
KXL: Pressure Surge, ML_BV20_1 Closure
Time(minute)0.0 0.5 1.0 1.5 2.0 2.5 3.0 3.5 4.0 4.5 5.0 5.5 6.0 6.5 7.0
Pressure (Psig)
0.00
73.
145.
218.
290.
363.
435.
508.
580.
653.
725.
798.
870.
943.
1015.
1088.
1160.
1233.
1305.
1378.
1450.
1523.
1595
1668.
1740.
1813.
Flow(kbpd)
0.00
45.
91.
136.
181.
226.
272.
317.
362.
408.
452.
498.
543.
589.
634.
679.
725.
770.
815.
860.
905.
951.
996.
1042.
1087.
10923
9930
ML_BV20_1:P-
ML_BV20_1:Q-
PS20_P01:P-
PS20_P05:P+
PS20_P05:RPM
PS19_BV_OUT:P+
TIME = 00:06:45STEP = 00:00:00

Pipeline and Hazardous Materials Safety Administration Docket Number PHMSA 2008-0285 TransCanada Keystone Pipeline, L.P. Application to Design, Construct and Operate the Keystone XL Oil Pipeline at 80% Specified Minimum Yield Strength (SMYS) Response to PHMSA February 10, 2010
Page 1 of 1 “Will any areas go over 1440psi, if so where. If they have some intermediate pipe areas with design/operating pressures over 1440 psi, how will they monitor pressure/pressure control at the pipe spec change point? Response: As explained in “pipe segments downstream of pump stations” response dated November 19, 2009, Keystone is designing heavier wall pipe into the pipeline system, which will be rated to an MOP of 1600 psig. This pipe will be located at certain low elevation points in close proximity to the discharge of a pump station. As explained in the November 19th response, under normal operating circumstances no pipeline segment, including the segments referenced above, will exceed 1440 psig. It is important to note that Keystone is not requesting that the special permit apply to these areas. The intent of these intermediate heavy wall pipe segments is to ensure that an overpressure due to a surge event is properly mitigated from a pipeline design perspective. This is yet another redundant form of protection that serves to supplement the pressure control and over pressure protection system that will be implemented on the pipeline.
There is no monitoring directly at the points where the 1440 psig pipeline meets the intermediate segments that utilize pipe rated to a higher MOP. Control and monitoring of these segments will be achieved through the use of the SCADA system and proven design. As with other liquid service pipelines, design profiles are monitored and simulated to ensure that no segment of the pipeline ever exceeds MOP. In cases where the elevation profile of the pipeline could cause increased hydraulic gradients, the discharge of upstream pump stations is controlled to a below set maximum pressure calculated by the hydraulic simulation. This ensures there is no risk of overpressure.
That same control and monitoring is used on liquid pipeline systems that use a heavier wall pipe as additional mitigation against overpressure. The simulation calculates the set point of any upstream station at risk of higher hydraulic gradients. This maximum pressure is used to control the pump station discharge pressure. In the case of the Keystone XL pipeline system, these pressure set points will be based on the entire pipeline being 1440 psig MOP. Installing pipe rated to a higher MOP in those segments identified as having the greatest risk to surge due to hydraulic gradients, allows for a redundancy to the level of protection and thus further reducing the risk that surge events pose to the pipeline system.

Pipeline and Hazardous Materials Safety Administration Docket Number PHMSA 2008-0285 TransCanada Keystone Pipeline, L.P. Application to Design, Construct and Operate the Keystone XL Oil Pipeline at 80% Specified Minimum Yield Strength (SMYS) Response to PHMSA February 10, 2010
Page 1 of 1 “We would like to know if the “hydraulic modeling scenarios” – have the worst case examples?” Response: The hydraulic modeling scenarios presented in previous responses are based on a conservative approach to modeling. They indicate the worse case scenarios for all pipeline segments.

Pipeline and Hazardous Materials Safety Administration Docket Number PHMSA 2008-0285 TransCanada Keystone Pipeline, L.P. Application to Design, Construct and Operate the Keystone XL Oil Pipeline at 80% Specified Minimum Yield Strength (SMYS) Response to PHMSA February 10, 2010
Page 1 of 1 “What is the max. surge pressure that they expect, under what conditions, where is it located?” Response: The following transient simulation case captures the worst-case scenario where simultaneous failures modes and maximum operating conditions are present. In the unlikely event of multiple failure events occurring coincidentally such as maximum design flow rate is present, the station communication system experiences a failure, and an un-commanded valve closure occurs, the resulting pressure surge would not exceed the maximum allowed surge pressure limit. Under the current Keystone XL over pressure and pressure protection philosophy, in case of communication failure at a pump station, the pressure discharge setting will be reduced therefore enforcing a safer condition by decreasing both flow rate and pressure.

KXL Transient Pressure Profiles
Maximum Surge Pressure Case
The worst case surge pressure is experienced downstream of Haakon pump station in South Dakota. It occurs when the discharge valve of the station is triggered to close during communication outage
while the system is operating at maximum design flow.

Wait...
DILBIT18CQ3
KXL: Pressure Surge, PS18_BV_OUT Closure
Pipeline Length (mile)659. 671. 684. 696. 708. 721. 733. 746. 758. 771. 783. 795. 808. 820.
Pressure (Psig)
0.00
73.
145.
218.
290.
363.
435.
508.
580.
653.
725.
798.
870.
943.
1015.
1088.
1160.
1233.
1305.
1378.
1450.
1523.
1595.
1668.
1740.
1813.
Flow Rate (kbpd
)
0.00
60.
121.
181.
242.
302.
362.
423.
483.
543.
604.
664.
725.
785.
845.
906.
966.
1026.
1087.
1147.
1208.
1268.
1328.
1389.
1449.
1510.
PS19
PS18
PS17
PS16 ELEVATION
PRESSURE
STANDARD.FLOW
MAOP
MAX.PRESSURE
MASP
TIME = 00:00:00STEP = 00:00:00

Wait...
DILBIT18CQ3
KXL: Pressure Surge, PS18_BV_OUT Closure
Pipeline Length (mile)659. 671. 684. 696. 708. 721. 733. 746. 758. 771. 783. 795. 808. 820.
Pressure (Psig)
0.00
73.
145.
218.
290.
363.
435.
508.
580.
653.
725.
798.
870.
943.
1015.
1088.
1160.
1233.
1305.
1378.
1450
1523.
1595.
1668.
1740.
1813.
Flow Rate (kbpd
)
0.00
60.
121.
181.
242.
302.
362.
423.
483.
543.
604.
664.
725.
785.
845.
906.
966.
1026.
1087.
1147.
1208.
1268.
1328.
1389.
1449.
1510.
PS19
PS18
PS17
PS16 ELEVATION
PRESSURE
STANDARD.FLOW
MAOP
MAX.PRESSURE
MASP
TIME = 00:02:27STEP = 00:00:01

Wait...
DILBIT18CQ3
KXL: Pressure Surge, PS18_BV_OUT Closure
Pipeline Length (mile)659. 671. 684. 696. 708. 721. 733. 746. 758. 771. 783. 795. 808. 820.
Pressure (Psig)
0.00
73.
145.
218.
290.
363.
435.
508.
580.
653.
725.
798.
870.
943.
1015.
1088.
1160.
1233.
1305.
1378.
1450.
1523.
1595.
1668.
1740.
1813.
Flow Rate (kbpd
)
0.00
60.
121.
181.
242.
302.
362.
423.
483.
543.
604.
664.
725.
785.
845.
906.
966.
1026.
1087.
1147.
1208.
1268.
1328.
1389.
1449.
1510.
PS19
PS18
PS17
PS16 ELEVATION
PRESSURE
STANDARD.FLOW
MAOP
MAX.PRESSURE
MASP
TIME = 00:03:24STEP = 00:00:00

Wait...
DILBIT18CQ3
KXL: Pressure Surge, PS18_BV_OUT Closure
Pipeline Length (mile)659. 671. 684. 696. 708. 721. 733. 746. 758. 771. 783. 795. 808. 820.
Pressure (Psig)
0.00
73.
145.
218.
290.
363.
435.
508.
580.
653.
725.
798.
870.
943.
1015.
1088.
1160.
1233.
1305.
1378.
1450.
1523.
1595.
1668.
1740.
1813.
Flow Rate (kbpd
)
0.00
60.
121.
181.
242.
302.
362.
423.
483.
543.
604.
664.
725.
785.
845.
906.
966.
1026.
1087.
1147.
1208.
1268.
1328.
1389.
1449.
1510.
PS19
PS18
PS17
PS16 ELEVATION
PRESSURE
STANDARD.FLOW
MAOP
MAX.PRESSURE
MASP
TIME = 00:04:14STEP = 00:00:00

Wait...
DILBIT18CQ3
KXL: Pressure Surge, PS18_BV_OUT Closure
Pipeline Length (mile)659. 671. 684. 696. 708. 721. 733. 746. 758. 771. 783. 795. 808. 820.
Pressure (Psig)
0.00
73.
145.
218.
290.
363.
435.
508.
580.
653.
725.
798.
870.
943.
1015.
1088.
1160.
1233.
1305.
1378.
1450.
1523.
1595.
1668.
1740.
1813
Flow Rate (kbpd
)
0.00
60.
121.
181.
242.
302.
362.
423.
483.
543.
604.
664.
725.
785.
845.
906.
966.
1026.
1087.
1147.
1208.
1268.
1328.
1389.
1449.
1510.
PS19
PS18
PS17
PS16 ELEVATION
PRESSURE
STANDARD.FLOW
MAOP
MAX.PRESSURE
MASP
TIME = 00:05:47STEP = 00:00:00

Wait...
DILBIT18CQ3
KXL: Pressure Surge, PS18_BV_OUT Closure
Pipeline Length (mile)659. 671. 684. 696. 708. 721. 733. 746. 758. 771. 783. 795. 808. 820.
Pressure (Psig)
0.00
73.
145.
218.
290.
363.
435.
508.
580.
653.
725.
798.
870.
943.
1015.
1088.
1160.
1233.
1305.
1378.
1450.
1523.
1595.
1668.
1740.
1813.
Flow Rate (kbpd
)
0.00
60.
121.
181.
242.
302.
362.
423.
483.
543.
604.
664.
725.
785.
845.
906.
966.
1026.
1087.
1147.
1208.
1268.
1328.
1389.
1449.
1510.
PS19
PS18
PS17
PS16 ELEVATION
PRESSURE
STANDARD.FLOW
MAOP
MAX.PRESSURE
MASP
TIME = 00:09:06STEP = 00:00:00

Wait...
KXL: Pressure Surge, PS18_BV_OUT Closure
Time(minute)0.0 1.0 2.0 3.0 4.0 5.0 6.0 7.0 8.0 9.0
Pressure (Psig)
0.00
73.
145.
218.
290.
363.
435.
508.
580.
653.
725.
798.
870.
943.
1015.
1088.
1160.
1233.
1305.
1378.
1450.
1523.
1595.
1668.
1740.
1813.
Flow(kbpd)
0.000
45.
91.
136.
181.
226.
272.
317.
362.
408.
452.
498.
543.
589.
634.
679.
725.
770.
815.
860.
905.
951.
996.
1042.
1087.
10923
9930
PS18_BV_OUT:P-
PS18_BV_OUT:Q-
PS18_P01:P-
PS18_P05:P+
PS18_P04:RPM
PS17_BV_OUT:P+
TIME = 00:09:01STEP = 00:00:00

Pipeline and Hazardous Materials Safety Administration Docket Number PHMSA 2008-0285 TransCanada Keystone Pipeline, L.P. Application to Design, Construct and Operate the Keystone XL Oil Pipeline at 80% Specified Minimum Yield Strength (SMYS) Response to PHMSA February 10, 2010
Page 1 of 4 “Please review and provide a response to Mr. Wesley James’ comment PHMSA-2008-0285-0017, and where possible provide a side-by-side comparison with data and calculations provided in Mr. James’ comment with the discussion paper Keystone provided. PHMSA is specifically looking for review/comment on any areas in data, calculations, and conclusions that may be in conflict between the two, as well as the areas where the two agree with one another.” Response: Comment on Item 1 in PHMSA-2008-0285-0017 “The pressure in a gas pipeline is provided by compressors while the pressure in a crude oil pipeline is provided by centrifugal pumps. The cut pressure (pressure at zero discharge) for a centrifugal pump is typically 30% greater than the operating pressure. If a valve in the discharge line is closed while the pumps are running, the pressure in the discharge line would increase to 1950 psi and the pipeline would fail.”
All operating centrifugal pumps will increase in pressure when a discharge valve is closed. No centrifugal pump generates the same amount of head at zero flow. For the pumps that will be utilized on the Keystone XL pipeline, zero flow or shut off head is only 17% above the normal operating pressure as opposed to 30% as indicated by Mr. James.
Any pipeline system that does not implement Pressure Control (PC) & Over-Pressure
(OP) Protection Control systems would be at risk of over pressuring the pipeline. The Keystone XL pipeline will utilize both PC and OP protection systems. The station control system maintains the station discharge pressure within the acceptable boundaries by implementing a number of discharge pressure set points to ensure normal operating pressures are not exceeded and redundantly implements OP protection during any upset condition.
Examples of PC and OP protection systems are:
o A dramatic increase in pump discharge pressure will be dependant on the increase or shut down of one pump or the shutdown of the entire pump station.
o Loss of communications between the operational control center and any Intermediate mainline valve will trigger a safe mode at the corresponding upstream pump station thereby slowing down the flow to a predetermined acceptable level.

Page 2 of 4 Response
Comment on Item 2 in PHMSA-2008-0285-0017 “Because the density of the crude oil is greater than the density of the gas, unsteady flow surges are greater in a crude oil pipeline. Some common causes of surges in a pipeline are pump startup, power failure, valve movement, column separation and air removal. Pressure surges as much as 300 psi can occur in this pipeline resulting in a total pressure of 2250 psi. The bursting pressure for this pipeline is 2070 psi.”
Crude oil pipelines are more prone to surge situations than gas pipelines. Many operating conditions can trigger a surge such as power outages, valve movement, etc. Un-mitigated surges could pose a risk to overpressure. Implementation of specific OP and PC pipeline protection control system as designed into the Keystone XL system solves and adverts these problems.
Keystone has conducted several transient hydraulic studies considering all the possible
events and potential upset scenarios which could be considered potential sources of pressure surges within the system. These studies include intermediate mainline valve closure, intermediate mainline valve closure with two consecutive station shutdowns, pump station valve closure, PCV failure or closure, VFD failure, pump station shutdown or power failure, in-line tool stoppage and communication link failure. With specific OP and PC pipeline protection control systems in place there is no event and/or condition found where the total system pressure including the surges go beyond the allowable of 110% of the system’s MOP (1.1 x 1440 = 1584 psig).
Please refer to the data response entitled “Maximum Surge Scenario”. Keystone
examined a worst-case scenario transient simulation at the most vulnerable area along the pipeline to illustrate that the surge would not exceed 110% MOP (1584 psig).
Keystone will be utilizing pipe that meets or exceeds the requirements of API 5L PSL 2.
The required minimum tensile strength associated with this pipe is 82.7 ksi. From this we are able to determine that plastic deformation of the pipeline would not occur until the pressure was increased to 2136 psig. Given the fact that the worst case surge scenario would not allow the pressure to exceed 110% MOP (1584 psig, based on the extensive SCADA and operation control related features and procedures explained above), and that the pipeline will be successfully hydrostatically tested to 125% MOP (1800 psig), it is Keystone’s opinion that its system design offers a level of safety equal to or greater than existing regulations in the unlikely event of a pressure surge along the pipeline.

Page 3 of 4 Response
Comment on Item 3 in PHMSA-2008-0285-0017 “A study of major Canadian pipeline ruptures (Jeglic, 2004) have found that during the first ten years of operation, stress cracking was the most common cause of pipeline ruptures while during the next ten years of operation, external corrosion was the most common cause of pipeline ruptures. Both causes of ruptures are time dependent and will be a major concern with the Keystone Pipeline because there is no extra steel in the walls of the pipe to compensate for pipeline deterioration. Research (Kiefher, 2001) has shown that a longitudinal stress crack 16 inches long and less than 1/16 inch deep will cause the pipeline to rupture at the normal operating pressure of 1500 psi.”
The mechanism for the onset of external and internal corrosion does not change with an increase in operating stress level. Corrosion growth is also not affected by an increase in stress level. Safeguards are in place to minimize the potential of external corrosion on the pipeline. These safeguards include using high performance external coating (FBE), installing cathodic protection systems, conducting interference current surveys, and conducting close interval surveys
Stress corrosion cracking (SCC) refers to localized pipe damage (cracks) caused by the
combined influence of a susceptible pipeline coating, conducive environment (e.g., corrosive soils), operational stresses, and to a limited extent, temperature of the pipe. The coating system to be used on the Project is a high performance FBE. This coating system provides excellent protection against SCC due to the performance of the primer and the durability of the applied epoxy coating. According to Canadian Energy Pipeline Association Recommended Practices 2nd Edition Section 5.1.1.1, Coating Type and Coating Condition, “No SCC has been documented in association with FBE, field applied epoxy or epoxy urethanes, or extruded polyethylene” and according to PHMSA Fact Sheet on Stress Corrosion Cracking 120604 http://primis.phmsa.dot.gov, “applying special coatings (fusion bonded epoxy) will protect the pipeline from the occurrence of SCC.” Additionally, the cathodic protection system will be monitored to prevent cathodic protection overcharging, which could promote SCC growth. Consequently, SCC is not considered to be a viable threat for the Project.
It is not common practice to employ corrosion allowance in the design of North American
onshore transmission pipelines. Comment on Spray Calculation in PHMSA-2008-0285-0017:
The spray calculation conducted by Mr. James is not applicable to below ground pipelines. In no case would a rupture from a buried pipeline result in a spray consistent with the calculated spray zone in PHMSA-2008-0285-0017. The pipeline will be buried 48 inches below the grounds surface, which in a release situation, would provide damping and absorption of all or most of the kinetic energy. Industry experience

Page 4 of 4 Response
demonstrates that oil flowing through a pipeline buried at this depth would simply pool on the surface in the immediate area of the release. The Keystone XL pipeline will be buried to a depth of 4 feet. The anticipated worst case spray zone for an exposed or above ground pipeline is anticipated to be consistent with industry experience, i.e. in the 75 to 394 foot range. The following are examples of similar pipeline ruptures that support this theory. It should be noted that, while the pipelines in the first two examples operated at a lower pressure than the pressure for the Keystone XL pipeline, those pipelines were buried at a depth less than the 48-inches of cover that will apply to the Keystone XL pipeline.
Lakehead Pipe Line Co. - Bemidji, Minnesota (August 20, 1979) On August 20, 1979, Lakehead Pipe Line Co. experienced a seam weld related rupture of their NPS 34 pipeline near Bemidji, Minnesota. The cause of the failure was determined to be a failure of the pipeline’s long seam. The operating pressure of the pipeline at the time of the incident was approximately 500 psi. The oil spray covered a distance of approximately 394 feet from the rupture site. Kinder Morgan Canada – Burnaby, British Columbia (Jul 24, 2007) On July 24, 2007, a NPS 24 pipeline operated by Kinder Morgan Canada was punctured by a third party excavator. This caused oil to be released in the form of a geyser from the excavation site. The height of the spray of oil was approximately 49 – 66 feet high. It should be noted that the extent of the spray was worsened by the closure of the downstream isolating valve which caused the pressure of the pipeline to rise from 75 psi to 250 psi. The oil spray covered a distance of approximately 197 feet from the rupture site. Trans-Alaska Pipeline – Fairbanks, Alaska (October 4, 2001) On October 4, 2001, operators of the Trans-Alaska Pipeline detected a leak in the pipeline via helicopter patrol. The Trans-Alaska pipeline is an above ground pipeline that transports crude oil from Prudhoe Bay, Alaska to Valdez, Alaska. Upon investigation, it was determined that the oil leak was a result of a bullet puncture on the side of the pipeline slightly above the horizontal axis of the pipeline. The puncture resulted in a spray of crude oil to the surrounding environment. The operating pressure of the pipeline at the time of the incident was 525 psi. The oil spray covered a distance of approximately 75 feet from the puncture site.