Embed Size (px)
Citation preview

United StatesDepartment ofAgriculture
NaturalResourcesConservationService
Grazing LandsTechnologyInstitute
Fort Worth, Texas
Inventorying,Classifying, andCorrelatingJuniper and PinyonCommunitiesTo Soils in Western United States

The United States Department of Agriculture (USDA) prohibits discrimination in its programs on the basis of race,color, national origin, sex, religion, age, disability, political beliefs, and marital or familial status. (Not all prohibitedbases apply to all programs.) Persons with disabilities who require alternate means for communication of programinformation (Braille, large print, audiotape, etc.) should contact the USDA’s TARGET Center at (202) 720-2600 (voiceand TDD).
To file a complaint, write the Secretary of Agriculture, U.S. Department of Agriculture, Washington, DC, 20250, or call1-800-245-6340 or (202) 720-1127 (TDD). USDA is an equal opportunity employer.
Juniper and pinyon communities...........................................................1
Inventory and classification....................................................................6
Vegetation and analysis and mapping................................................... 6
References..................................................................................................... 9
Appendix 1: Key for separating ecological sites .....................................13
Appendix 2: Instructions for pinyon-juniper site inventory..................................................................................................... worksheet15
Appendix 3: Instructions for fixed-plot summary worksheet ...............26
Appendix 4: Instructions for zig-zag summary worksheet .....................29
Appendix 5: Area and yield tables for juniper and pinyon trees ...........32
Appendixes
Contents
September 1997

ii

Inventorying, Classifying, and CorrelatingJuniper and Pinyon CommunitiesTo Soils in Western United States
This publication provides general guidance for theinventorying, classifying, and correlation of juniperand pinyon (or piñon) into ecological sites. Theseguidelines are based on the ecological site descrip-tions for rangelands and forest lands. These guide-lines are to be used during soil survey operationsand any time ecological site development andrevision is taking place.
Soil surveys on western rangelands and forest landsare normally completed with each major soil com-ponent correlated to a rangeland or forest landecological site. As part of the National CooperativeSoil Survey, soil surveys include the characteriza-tion and classification of plant communities grow-ing on each soil.
The National Cooperative Soil Survey is a jointeffort of the U.S. Department of Agriculture andother Federal agencies, state agencies including theAgricultural Experiment Stations and local agen-cies. USDA’s Natural Resources ConservationService (NRCS) coordinates the Federal part.
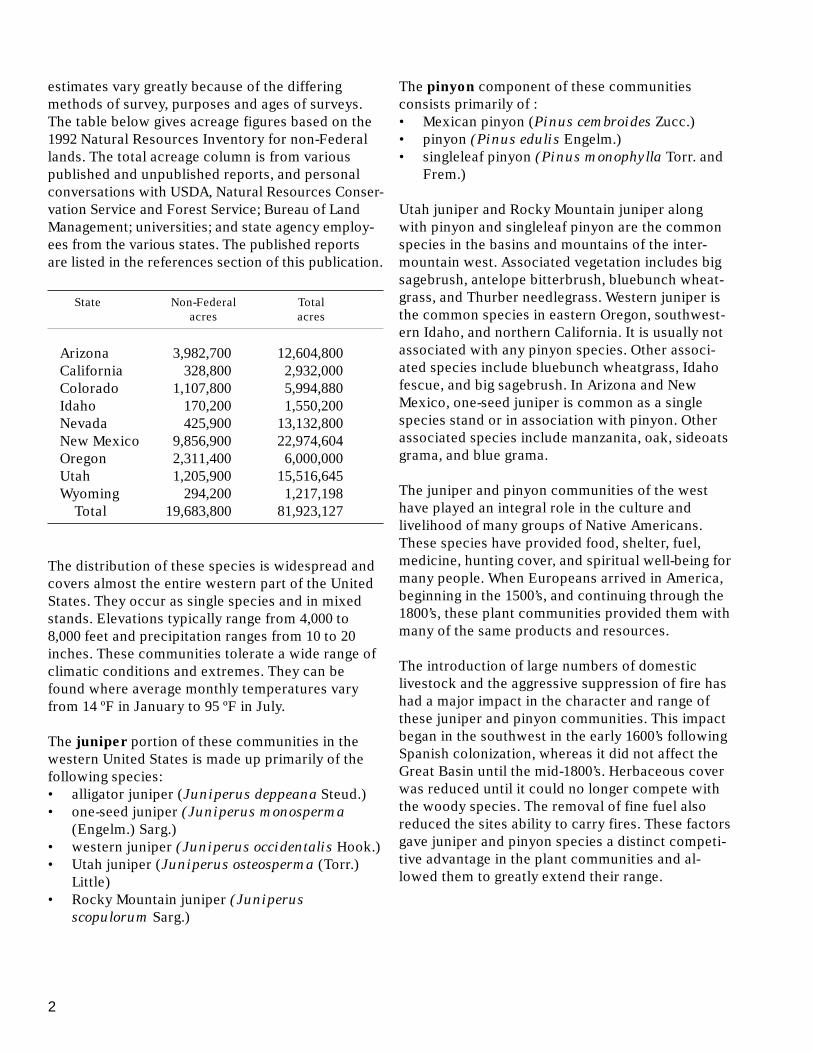
Figure 1. Coverage of juniper and pinyon communities in western United States (R.A. Evans, 1988.Management of Pinyon-Juniper Woodlands, USDA, Forest Service, Report INT-249)
In the juniper or pinyon plant transitions betweenclimax forest land and rangeland often exhibitvegetation that is of recent derivation and may nothave been typical of the site when natural ecologicalprocesses were functioning on the site. The changesin the past 150 to 300 years often mask the potentialplant communities of the sites and can createinconsistencies in inventory processes.
Knowing where pinyon or juniper communities, orboth, have increased on rangeland, or invaded intoadjacent rangeland is essential for understandingtheir ecology. The land also must be managed withinits capabilities and limitations.
Juniper and pinyon communities
Estimates of the acreage of juniper and pinyoncommunities vary from 47 million to over 134million acres in the western states of Arizona,California, Colorado, Idaho, Nevada, New Mexico,Oregon, Utah, and Wyoming (fig. 1). These
Arizona
California
Nevada
Oregon Idaho
Wyoming
Utah
Colorado
NewMexico
2
estimates vary greatly because of the differingmethods of survey, purposes and ages of surveys.The table below gives acreage figures based on the1992 Natural Resources Inventory for non-Federallands. The total acreage column is from variouspublished and unpublished reports, and personalconversations with USDA, Natural Resources Conser-vation Service and Forest Service; Bureau of LandManagement; universities; and state agency employ-ees from the various states. The published reportsare listed in the references section of this publication.
State Non-Federal Totalacres acres
Arizona 3,982,700 12,604,800California 328,800 2,932,000Colorado 1,107,800 5,994,880Idaho 170,200 1,550,200Nevada 425,900 13,132,800New Mexico 9,856,900 22,974,604Oregon 2,311,400 6,000,000Utah 1,205,900 15,516,645Wyoming 294,200 1,217,198 Total 19,683,800 81,923,127
The distribution of these species is widespread andcovers almost the entire western part of the UnitedStates. They occur as single species and in mixedstands. Elevations typically range from 4,000 to8,000 feet and precipitation ranges from 10 to 20inches. These communities tolerate a wide range ofclimatic conditions and extremes. They can befound where average monthly temperatures varyfrom 14 ºF in January to 95 ºF in July.
The juniper portion of these communities in thewestern United States is made up primarily of thefollowing species:• alligator juniper (Juniperus deppeana Steud.)• one-seed juniper (Juniperus monosperma
(Engelm.) Sarg.)• western juniper (Juniperus occidentalis Hook.)• Utah juniper (Juniperus osteosperma (Torr.)
Little)• Rocky Mountain juniper (Juniperus
scopulorum Sarg.)
The pinyon component of these communitiesconsists primarily of :• Mexican pinyon (Pinus cembroides Zucc.)• pinyon (Pinus edulis Engelm.)• singleleaf pinyon (Pinus monophylla Torr. and
Frem.)
Utah juniper and Rocky Mountain juniper alongwith pinyon and singleleaf pinyon are the commonspecies in the basins and mountains of the inter-mountain west. Associated vegetation includes bigsagebrush, antelope bitterbrush, bluebunch wheat-grass, and Thurber needlegrass. Western juniper isthe common species in eastern Oregon, southwest-ern Idaho, and northern California. It is usually notassociated with any pinyon species. Other associ-ated species include bluebunch wheatgrass, Idahofescue, and big sagebrush. In Arizona and NewMexico, one-seed juniper is common as a singlespecies stand or in association with pinyon. Otherassociated species include manzanita, oak, sideoatsgrama, and blue grama.
The juniper and pinyon communities of the westhave played an integral role in the culture andlivelihood of many groups of Native Americans.These species have provided food, shelter, fuel,medicine, hunting cover, and spiritual well-being formany people. When Europeans arrived in America,beginning in the 1500’s, and continuing through the1800’s, these plant communities provided them withmany of the same products and resources.
The introduction of large numbers of domesticlivestock and the aggressive suppression of fire hashad a major impact in the character and range ofthese juniper and pinyon communities. This impactbegan in the southwest in the early 1600’s followingSpanish colonization, whereas it did not affect theGreat Basin until the mid-1800’s. Herbaceous coverwas reduced until it could no longer compete withthe woody species. The removal of fine fuel alsoreduced the sites ability to carry fires. These factorsgave juniper and pinyon species a distinct competi-tive advantage in the plant communities and al-lowed them to greatly extend their range.

3
Juniper species
• alligator juniper (Juniperus deppeana)Mainly at higher elevations in Arizona and New Mexico, also found in western Texas. Nativeperennial tree that may reach 60 feet tall. Leaves are blue-green, toothed, and heavily glandular.Bark has deeply furrowed, square plates.
• one-seed juniper (Juniperus monosperma)Common species in Arizona and New Mexico. Also occurs in western Texas and Oklahoma, insouthern Colorado, and in south central Wyoming. Native perennial tree. Leaves are gray-greenand glandular. Seeds are one per cone.
• western juniper (Juniperus occidentalis)Common in eastern Oregon and the Sierra Nevada Mountains of California. Rarely in northwest-ern Nevada and southeastern Idaho. A native, perennial tree that is normally short and bushy butmay reach heights of 60 feet in some locations. Leaves in whorls of three with distinct resin doton each bundle.
• Utah juniper (Juniperus osteosperma)Widespread in Nevada, Utah, northern Arizona, western Colorado, and southern Idaho. Rarelyfound in California, New Mexico, and Wyoming. Native perennial tree that is round and low to theground. Leaves are in whorls of three but without resin dot.
• Rocky Mountain juniper (Juniperus scopulorum)Widespread throughout the higher elevations of several western states including, Montana, Idaho,Washington, Wyoming, Utah, Colorado, Arizona, and New Mexico. Also occurs in the western partof North and South Dakota, western Nebraska, western Oklahoma, northeastern Oregon, andwestern Nevada. Native perennial tree that may reach 55 feet in height. Leaves in whorls of two,foliage appears fine and lacy.
Pinyon species
• pinyon (Pinus edulis)Widespread throughout Utah, Colorado, Arizona, and New Mexico. Rarely in California, Okla-homa, and Texas. Native perennial tree, can reach 40 feet in height, leaves typically in bundles oftwo, persistent, and entire.
• Mexican pinyon (Pinus cembroides)Range restricted to southeastern Arizona and southwestern New Mexico. Rarely in Texas. Nativeperennial tree, can reach a height of 40 feet. Leaves typically in bundles of three, persistent, andentire.
• Singleleaf pinyon (Pinus monophylla)Mainly in Nevada, western Utah, and the southern half of California. Rarely in Arizona and Idaho.Native perennial tree, can reach a height of 40 feet. Leaves are typically single, persistent, andentire.

4
Inventory and classification
A systematic approach for inventorying and classify-ing juniper and pinyon communities, and identifyingwhere they have invaded adjacent rangeland orincreased on rangeland, is essential for understand-ing their ecology. It is also essential to ensure thatthe land is managed within its capabilities andlimitations.
NRCS has established guidelines that provide forconsistent inventories in the juniper–pinyon vegeta-tion areas. These guidelines are based on the estab-lishment of ecological site descriptions for range-lands and forest lands. This describes the historicclimax plant community for each ecological site.Rangeland and forest land ecological site descrip-tions are in section III of the Field Office TechnicalGuide. These site descriptions also include a de-scription of the other steady state plant communi-ties that may be on the site, and give a discussion ofthe pathways followed to each state. These sitedescriptions will also provide interpretations for theuse and management of the site, including thepresent vegetation and the other steady states onthe site.
On Rangeland Ecological Sites where juniper,pinyon, or both, are part of the historic climax plantcommunity, they are recognized as such, both in theplant community description and the interpreta-tions. Ecological dynamics discussions in the sitedescriptions will outline the processes that oc-curred to allow the juniper or pinyon, or both, toincrease on this site and become dominate. Range-
land Ecological Sites where juniper or pinyon, orboth, were not part of the historic climax plantcommunity, but now exist on the site, will be ex-plained in the ecological dynamics and interpreta-tions sections of the site descriptions. Interpreta-tions for the use and management of juniper, pin-yon, or both, will be included in all Rangeland
Ecological Sites descriptions where these speciesare part of the historic climax plant community andon sites where these species have invaded intoother rangelands. Forest Land Ecological Sites
where juniper, pinyon, or both, are the climaxspecies for the site, will be explained and interpreta-tions will include the use and management of thesespecies.
This historical reference approach provides thenecessary consistency to allow for uniform classifi-cation and soil and ecological site mapping. It alsosupplies the necessary interpretation for use andmanagement of these areas.
Vegetation analysis and mapping
The following guidelines are designed to provide forthe consistent analysis and mapping of Rangeland
and Forest Land Ecological Sites in those areaswhere juniper, pinyon, or both, are in transitionbetween forest land and rangeland.
• Rangeland is defined as: A kind of land on whichthe historic climax vegetation was predomi-nantly grasses, grass-like plants, forbs, orshrubs.
• Forest land is defined as: A kind of land onwhich the historic climax vegetation was domi-nated by trees.
Soil taxonomic units identified in soil surveyscompleted by the NRCS are correlated to Range-
land or Forest Land Ecological Sites as appro-priate. These sites are ecological subdivisions ofrangeland and forest land that are separated interms of the historic climax plant community theyare capable of producing and supporting. Forest
Land Ecological Sites are assigned to soil taxo-nomic units where the historic climax plant commu-nity was dominated by tree overstory. Rangeland
Ecological Sites are assigned to soil taxonomicunit where the historic climax planet communitywas predominantly grasses, grass-likes, forbs, andshrubs.
Natural disturbances such as drought, fire, grazingor lack of grazing, and insects were inherent in thedevelopment and maintenance of the historicclimax plant community. Where these naturalenvironmental factors have been altered (overgraz-ing, suppression of fire) or the site is protected fromthese natural influences for extended periods (long-term exclosures, lack of fire), the present plantcommunities rarely typify the historic climax plantcommunity and can be quite different. In the past150 to 300 years, expansion of juniper and pinyonfrom its original distribution and densities has

5
presented problems in classifying present vegeta-tion in relation to the historic climax plant commu-nity, and in correlating this plant community tospecific environmental factors. Figure 2 indicatesthe influence of increase and encroachment of junipertrees from 1915 to 1978 at two different locations.
Expansion of juniper and pinyon has occurred inseveral ways.• Density of these species has increased in the
natural Forest Land Ecological Sites wherejuniper, pinyon, or both, are the climax domi-nate species for the site.
• Species have increased in density on Range-
land Ecological Sites where they were a partof the historic climax plant community.
• Juniper, pinyon, or both, have also invaded on toRangeland Ecological Sites where they werenot present in the historic climax plant community.
All of these methods of expansion and increase mayhave occurred within a few miles of each other. Thiscan make the determination of Forest Land/Range-
land Ecological Sites, and the determination ofthe historic climax plant community a complex task.
These successional changes have been attributed tovarious factors including overgrazing by livestock,climatic changes, and the suppression of fire. Thereis considerable debate as to which of these factors,or combination of factors, is most significant inexplaining the obvious increase in juniper andpinyon through the western United States. While thisdebate continues, there is general agreement thatthe juniper and pinyon have certainly increased indensity and range throughout the western UnitedStates.
For many areas of juniper-pinyon occurrence, thedistinction between forest land and rangelandpotential plant communities is quite subtle. Soil-vegetation correlations made in these transitionareas have often been more an assessment of themanagement implications presented by these treesoccupying a given landscape than an evaluation ofthe natural environmental factors. Classification ofan ecological site as either rangeland or forest landdoes not dictate use or management of the site. Thehistoric climax plant community for a site related to
the present plant community merely represents onekind of inventory information to be considered byland managers in developing management strategiesfor the site.
In April of 1989, an ad hoc group of NRCS (SCS)range conservationists and foresters met in Flag-staff, Arizona. This group included Keith Wadman,Larry Ellicott, Joel Brown, Jerry Reioux, LeonardJurgens, Ed Olmsted, Bob Baum, Gary Brackley,Lendon Parker, Hall Brockman, Hugh Barrett, RussHaltz, Mark Petersen, Greg Hendricks, LynTownsend, and Dee Gault. This group put manyhours into the discussion and revisions of thismethod of inventorying, classifying, and correlatingthese vegetation types. The work of these individu-als was routed for comment throughout the agency.As comments were received, another meeting wasconvened in Albuquerque, NM in October 1989. Thisgroup included: Gary Brackley, Lendon Parker, PatShaver, Dalton Merz, Kevin Hood, Barry Shupe,Berman Hudsen, Arnold Mendenhall, RhettJohnson, Greg Hendricks, Keith Wadman, TerryJohnson, Lyn Townsend, and Harlan DeGarmo. Thisgroup further refined this procedure and it has beenin use around the western states since that time.This current revision has been reviewed by the WestRegion Grazing Lands Consortium in September of1996, and has received additional review by otherNRCS, FS, and BLM employees and by severaluniversity and research professionals.
In the absence of definitive research that relatesjuniper and pinyon to specific environmental fac-tors, the NRCS has developed criteria to be used inidentifying where juniper and pinyon have invadedand increased onto rangelands. These criteria arebased on information presented in research publica-tions of the academic community and USDA andUSDI technical papers.• Forest occurs when trees in the mature or near
mature plant community occupy 15 percent orgreater canopy and are 12 to 16 feet or greater inheight.
• Forest occurs when trees in the mature or nearmature plant community occupy 25 percent orgreater canopy.
• Woody plants less than 10 feet in height aregenerally considered to be shrubs.

6
Figure 2. Increases and encroachment of juniper trees from 1915 to 1978
Ashwood, Oregon in 1915
Ashwood, Oregon in 1968
Ashwood, Oregon in 1978

7
Figure 2. Increases and encroachment of juniper trees from 1915 to 1978—Continued
Plant community in western region in 1915
Plant community in western region in 1978

8
• Historic evidence indicates that the aboveconditions existed before the influence ofsettlement.
• Generally, forest does not occur on soils that arein the aridic or ustic aridic moisture regime,even when other soil factors of depth, texture,slope, etc., favor the correlation to Forest Land
Ecological Sites.
• Allowing trees in the historic climax plantcommunity on Rangeland Ecological Sites isprocedurally, technically, and professionallycorrect.
These criteria are to be used as a general guide andshould be considered and evaluated for specificlocations. The criteria on age of the “mature poten-tial” trees should be adjusted based on the length oftime and impacts of settlement. The canopy coverof 15 percent may need to be adjusted somewhatbased on species and site. For example: 15 percentcanopy cover of mature potential trees for Utahjuniper in Nevada may work well, although 20percent canopy cover of mature potential trees ofone-seed juniper in New Mexico is what is neces-sary. The pounds of fine fuel production may also be
adjusted for different MLRA’s or region of thejuniper range. If adjustments are necessary incanopy cover, age, or fine fuel, they will be madewith the most current scientific information avail-able and in consultation with the necessary disci-pline specialists and researchers.
In the appendix are keys to separate Rangeland
and Forest Land Ecological Sites that incorpo-rate the main ideas in the criteria. They representguidance to be used by NRCS personnel in complet-ing soil/site correlations in the area of juniper-pinyon forest land/rangeland transition.
Also in the appendix are some suggested inventorytechniques and data sheets for the use in soil/sitecorrelation. Production tables are included thatshow the annual production per tree for Utahjuniper. Unpublished clipping studies in NewMexico indicate that these tables will work well forone-seed juniper as well. The New Mexico studiesalso indicates that a pinyon tree, comparable incanopy diameter and foliage density produces moreannual production than the one-seed juniper. Thestudies indicate that the pinyon produced about 6pounds per tree and the juniper produced just over4 pounds per tree.

9
References
Benson, Robert E. and Alan W. Green. 1987. Colorado’s Timber Resources. U.S. Department of Agriculture, ForestService, Intermountain Research Station. Resource Bulletin INT-48. Ogden, UT.
Brackley, Gary K. 1986. Inventory and classification procedures. In Everett, Richard L. Compiler. Proceedings-Pinyon-juniper conference. Gen. Tech. Rep. INT-215. Ogden, UT: U.S. Department of Agriculture, Forest Ser-vice, Intermountain Research Station. 231–325.
Chojnacky, D.C. 1986. Pinyon-Juniper Site Quality and Volume Growth Equations for Nevada. U.S. Department ofAgriculture, Forest Service, Intermountain Research Station. Research Paper INT-372. Ogden, UT.
Evans, R. A. 1988. Management of Pinyon-Juniper Woodlands. U.S. Department of Agriculture, Forest Service,Intermountain Research Station. General Technical Report INT-249. Ogden, UT.
Howell, J., Jr. 1940. Pinyon and Juniper—A Preliminary Study of Volume, Growth, and Yield. U.S. Department ofAgriculture, Soil Conservation Service. Reg. Bull. No.71. Albuquerque, NM.
Husch, B., C. Miller, and T. Beers, 1982. Forest Mensuration. Third Edition. John Wiley and Sons, New York.
New Mexico Brush Inventory. 1982. New Mexico State University and New Mexico State Department of Agriculture.
Pinyon-Juniper Woodland Type in New Mexico: asset or liability. New Mexico State University. AgriculturalExperiment Station. Bulletin 718.
Preston, Richard J. Jr., North American Trees, Third Edition, 1976. The Mint Press, Cambridge, MA.
Ronco, Frank, Jr., 1986. Stand structure and function of pinyon-juniper woodlands. In Everett, Richard L. Com-piler. Proceedings-pinyon-juniper conference. Gen. Tech. Rep. INT-215. Ogden, UT: U.S. Department of Agricul-ture, Forest Service, Intermountain Research Station. 14–19.
Sharp, Lee A. and K. Sanders. 1978. Rangeland Resources of Idaho—A basis for development and improvement.Idaho Rangeland Committee and College of Forestry, Wildlife and Range Sciences. University of Idaho. Miscel-laneous Publication No. 6.
U.S. Department of Agriculture, Natural Resources Conservation Service, 1997. National Range and PastureHandbook.
U.S. Department of Agriculture, Natural Resources Conservation Service, 1992. National Resources Inventory.
U.S. Department of Agriculture, Natural Resources Conservation Service, 1992. National Forestry Manual.
West, Neil E. 1984. Successional patterns and productivity potentials of pinyon-juniper ecosystems. In DevelopingStrategies for Rangeland Management. National Research Council/National Academy of Sciences. WestviewPress. Boulder, CO. 1301–1332.

10

11
Appendixes
Appendix 1: Keys for separating ecological sites
Key to separating rangeland potential sites from juniper or pinyonforest land potential sites in areas of rangeland and forest landtransition ................................................................................................... 13
Appendix 2: Instructions for pinyon-juniper site inventory
worksheet ............................................................................................. 15Pinyon-juniper inventory site worksheet .............................................. 17Heading data lines.................................................................................... 19Plot data .................................................................................................... 21Fixed-plot transect: tree data lines ........................................................ 22Zig-zag transet: tree data lines ................................................................ 24
Appendix 3: Instructions for fixed-plot summary worksheet ..... 26Fixed-plot summary worksheet ............................................................. 27
Appendix 4: Instructions for zig-zag summary worksheet ........... 29Zig-zag transec summary worksheet ..................................................... 30
Appendix 5: Area and yield tables for juniper and
pinyon trees ............................................................................................ 32Foilage denseness classes ...................................................................... 32Table 5A-1. Basal area table ................................................................... 35Table 5A-2. Guide for determining current yield of Utah juniper in Utah Upland Stony Loam (juniper) site ........................................ 37Table 5A-3. General soil features associated with sites names in “Guides for determining current yield of pimo and juos in Utah” ........................................................................................ 38Table 5A-4. Foliage and fruit production for juniper trees on different sites .................................................................................. 39

12

13
Key to separating rangeland potential sites from juniper or pinyon forest landpotential sites in areas of rangeland–forest land transition
1. Stand of juniper and/or trees present on the site.2. Presence of “mature potential” (more than 150 years old) juniper or pinyon, or both, withinthe stand.
3. Present canopy cover of more than 150 year old trees within the stand is >25%...Forest
Land Ecological Site
3. Present canopy cover of more than 150 year old trees within the stand is <25%4. Physical evidence of “mature potential” (more than 150 years old) tree removal byharvest, fire, or other factors that reasonably suggests the site once supported a stand ofmature potential trees with an overstory canopy >25%...Forest Land Ecological Site
4. Physical evidence of “mature potential” (more than 150 years old) tree removal byharvest, fire, or other factors does not exist that reasonably suggests the site once sup-ported a stand of mature potential trees with an overstory canopy >25%
5. Physical evidence of “mature potential” (more than 150 years old) tree removal byharvest, fire, or other factors that reasonably suggests the site once supported a standof mature potential trees with an average stand height less than 12 feet...Rangeland
Ecological Site
5. Physical evidence of “mature potential” (more than 150 years old) tree removal byharvest, fire, or other factors that reasonably suggests the site once supported a standof mature potential trees with an average stand height of 12 feet or greater.
6. Physical evidence of “mature potential” (more than 150 years old) tree removal byharvest, fire, or other factors that reasonably suggests the site once supported astand of mature potential trees with an overstory canopy >15%...Forest Land Eco-
logical Site
6. Physical evidence of “mature potential” (more than 150 years old) tree removal byharvest, fire, or other factors that reasonably suggests the site once supported astand of mature potential trees with an overstory canopy <15%...Rangeland Eco-
logical Site
2. Individual trees within the stand are all less than 150 years old.7. Topographic and/or soil features of the site limit the frequency and intensity of natural fire.Soils are very shallow, rocky, droughty, and typically associated with areas of exposed bed-rock. Soils are shallow, residual or colluvial over soft bedrock or soils with eroded surfacelayers. Potential for production of continuous fine fuels (including litter) is less than 600pounds per acre.
8. Present stand of trees (in absence of disturbance) is expected to progress to a stand ofmore than 150 year old trees with an overstory canopy >25%...Forest Land Ecological
Site
Appendix 1: Key for Separating Ecological Sites

14
8. Present stand of trees (in the absence of disturbance) is expected to progress to asparse stand of more than 150 year old trees with an overstory canopy <25%.
9. Present stand of trees (in absence of disturbance) is not expected to achieve anaverage stand height of 12 feet...Rangeland Ecological Site
9. Present stand of trees (in absence of disturbance) is expected to achieve an aver-age stand height of 12 feet or greater.
10. Present stand of trees (in absence of disturbance) is expected to progress to astand of more than 150 year old trees with an overstory canopy >15%...Forest
Land Ecological Site
10. Present stand of trees (in absence of disturbance) is expected to progress to astand of more than 150 year old trees with an overstory canopy <15%...Rangeland
Ecological Site
7. Topographic and/or soil features of site do not restrict natural fire. Surface relatively freeof large rock fragments or high amounts of gravel. Residual or colluvial soils typically morethan 14 inches deep. Includes most non-eroded alluvial soils. Potential for the productionof continuous fine fuel (including litter) on the site greater than 600 pounds per acre....Rangeland Ecological Site
1. Juniper or pinyon trees, or both, not present on the site.11. Physical evidence of mature potential tree (more than 150 years old) removal by harvest,fire or other factors that reasonably suggest the site once supported a stand of mature potentialtrees with an overstory canopy greater than 25%. Topographic and/or soil features appear tolimit the frequency and intensity of natural fire on the site...Forest Land Ecological Site
11. Physical evidence of mature potential tree (more than 150 years old) removal by harvest,fire or other factors that reasonably suggest the site did not supported a stand of maturepotential trees with an overstory canopy greater than 25%. Topographic or soil features, orboth, do not limit the frequency and intensity of natural fire on the site.
12. Physical evidence of “mature potential” (more than 150 years old) tree removal byharvest, fire, or other factors that reasonably suggests the site once supported a stand ofmature potential trees with an average stand height less than 12 feet...Rangeland Ecologi-
cal Site
12. Physical evidence of “mature potential” (more than 150 years old) tree removal byharvest, fire, or other factors that reasonably suggests the site once supported a stand ofmature potential trees with an average stand height of 12 feet or greater.
13. Physical evidence of “mature potential” (more than 150 years old) tree removal byharvest, fire, or other factors that reasonably suggests the site once supported a stand ofmature potential trees with an overstory canopy >15%...Forest Land Ecological Site
13. Physical evidence of “mature potential” (more than 150 years old) tree removal byharvest, fire, or other factors that reasonably suggests the site once supported a stand ofmature potential trees with an overstory canopy <15%...Rangeland Ecological Site

15
Appendix 2: Instructions for pinyon–juniper site inventory worksheet
The Pinyon-Juniper Site Inventory Worksheet isused for the inventory of singleleaf pinyon (Pinus
monophylla) and Utah juniper (Juniperus
osteosperma) stands in Nevada. This worksheet isalso used for recording pinyon (Pinus edulis) andRocky Mountain juniper (Juniperus scopulorum)inventory data. This worksheet is not used forwestern juniper (Juniperus occidentalis) datacollection.
Stand selection
Plots are generally selected on the basis of how wellthe soil supporting a stand of trees represents theparticular soil series (and phase) being investigated.Landscape features, aspect and microtopography ofthe plot must be as defined for the soil series (andphase) being considered. Locate plots in stands freeof insect or disease damage. Pinyon or mixedpinyon-juniper stands may have a light infection ofdwarf mistletoe. The mature successional stage isthe preferred condition for soil-woodland sitecorrelation plots in pinyon-juniper. Plots may belocated in the young, immature, or climax stages,however, the variability in site indexes is usuallymuch greater within these successional stages.
Successional stages for pinyon–juniperwoodland communities
Four successional stages for pinyon–juniper areused in soil-woodland site correlation (fig. 3).
Young: This stage follows major disturbance to thewoodland community or as pinyon, and especiallyjuniper, trees move out of original woodland sitesand begin to colonize adjacent, non-woodland, plantcommunities. The visual and vegetal structure of thesite are dominated by pinyon and juniper saplings
(to 4.5 feet in height) in association with herba-ceous vegetation and woody shrubs. Stem diameterat the 1-foot stump height of pinyon and junipertrees averages 3 inches or less. Plant speciesdiversity is usually at a maximum for a woodlandsite. Pinyon and juniper seedlings are common inthe community.
Immature: The visual and vegetal structure of thesite are dominated by juniper or pinyon trees, orboth, greater than 4.5 feet in height. Average stemdiameter of pinyon and juniper trees is less than 5inches at the 1-foot stump height. Individual treestypically have full, dense crowns. The upper crownsof dominant and codominant trees are cone, orpyramidal-shaped. Understory vegetation consistsof grasses, forbs, and shrubs, in association withseedlings and saplings of overstory trees.
Mature: The visual and vegetal structure aredominated by juniper or pinyon trees, or both, thathave reached or are near maximal heights for thesite. Dominant trees typically average greater than 5inches in diameter at the 1-foot stump height.Dominant and codominant trees have full crowns.The upper crowns are normally irregularly orsmoothly flat-topped or rounded. Understoryvegetation is strongly influenced by overstory treeshading, or duff accumulation.
Climax: This stage is dominated by juniper orpinyon trees, or both, that have reached maximalheights for the site. Dominant and codominant treesaverage greater than 5 inches at the 1-foot stumpheight. Dominant pinyon and juniper trees typicallyhave open, fragmented crowns. The upper crownsof dominant and codominant trees are normally flat-topped or rounded. Understory vegetation is sparsebecause of overstory tree competition.

16
Figure 3. Singleleaf pinyon age classes successional stages
Young Immature
ClimaxMature

17
Pinyon–Juniper Site Inventory Worksheet
Date: _______ Data by: ________ Location: Long. ________ Lat.. ______ Sec._____ T._____ R._____
Plot number: __________________________________________________________________
Site number: _______________________ Field Office/ photo number: ___________________
Landowner name and soil survey area: _____________________________________________
Soil classification: ______________________________________________________________
Soil Series and Phase: _________________________ NRCS (SCS) SOI-5 No. __________________________
NRCS (SCS) SOI-232 No. _______________________ NRCS (SCS) RANGE-417 No. _____________________
Elevation: __________ ft Precipitation zone: ________ Slope: _________ % Azimuth: _____________ degrees
Landform: __________________________________________________________________________________
Slope component: Crest ❏ Summit ❏ Shoulder ❏ Backslope ❏ Footslope ❏
Kind of slope: Straight ❏ Concave ❏ Convex ❏
Surface rock cover: Boulders ______ % Stones ______ % Cobbles ______ % Gravel ______ %
Grazing history: _______________ Kind of animal: _______________ Season of use: ______________
Wildlife species: _______________ Burning history: ______________ Harvest history: ______________
Plot Data
Sampling method: Zig-zag ❏ Fixed plot ❏
Plot size: ____ Plot configuration: Circle ❏ Rectangular ❏ Square ❏
Successional stage: Immature ❏ Mature ❏ Overmature ❏
Ocular estimate of overstory canopy cover: ___ % (Total): ___ % Pinyon: ___% Juniper: ___% Other
Estimated average DRC: _______ Estimated average spacing: ______
Estimated D+X: ______ Estimated site index: ______
Understory plants:
Plant symbol/ Percent cover Weight Plant symbol/ Percent cover Weightcommon name (basal or canopy) (lb/ac) common name (basal or canopy) (lb/ac)
Grasses:
_____________ ______________ ________ ______________ ______________ _____
______________ ______________ ________ ______________ ______________ _____
______________ ______________ ________ ______________ ______________ _____
Forbs:
______________ ______________ ________ ______________ ______________ _____
______________ ______________ ________ ______________ ______________ _____
______________ ______________ ________ ______________ ______________ _____
Shrubs:
______________ ______________ ________ ______________ ______________ _____
______________ ______________ ________ ______________ ______________ _____
______________ ______________ ________ ______________ ______________ _____
U.S. Department of AgricultureNatural Resources Conservation Service

18
Plot number ________________________________________________________
Tree data lines Notes Seeding and sapling count
Tree Species Distance DRC Basal Crown Height Juniper Ring Number ringsNo. ft area diam ft ft posts count 1/ pith to 2.32 in
Ocular estimate
Pinyon Seedlings _________ No./ac Saplings __________ No./ac
Juniper
Seedlings _________ No./ac
Saplings __________ No./ac
Zig-zag transect
Species Distance Height
Fixed plot count
Pinyon Seedlings = _____ Saplings = _____
Juniper Seedlings = _____ Saplings = _____
1/ Add the following to correct 1 foot height age to total age:Add 9 years for pinyon and singleleaf pinyon; 12 years for Utah juniper; and 8 years for Rocky Mountain uuniperThese values are also added to ring count of pith to 2.3 inches to obtain total age at 5 inches diameter.
Pinyon–Juniper Site Inventory Worksheet — Continued

19
Data entry labels listed in italic print denote data elements not included in the Nevada NRCS Pinyon-Juniper Inventory data base program.
Date: Enter date of inventory.
Data by: Enter names of all specialists collecting plot data.
Location: Enter coordinates of Longitude and Latitude or Section, Township, and Range. (Locateplot in section map provided.) Space is provided for a brief description of how to get to plot withany identifying features, landmarks, roads, etc.
Plot number: Enter identification number for inventory plot.
Site number: Enter the NRCS woodland suitability group description number for the woodland sitebeing sampled or the range site number for which a pinyon/juniper overstory is being inventoried.
Field office/photo no.: Enter NRCS Field Office responsible for conservation planning activities atinventory location or soil survey photograph number (field sheet) that covers inventory site.
Landowner name or soil survey area: Enter landowner and/or ranch name(s) or soil survey nameand/or number.
Soil classification: Enter taxonomic classification of soil at inventory location.
Soil Series and Phase: Enter name and phase of Soil Series at the inventory location.
NRCS (SCS)-SOI-5 No.: Enter soil interpretation record number for soil series and phase atinventory location.
NRCS (SCS)-SOI-232 No.: Enter when a form NRCS(SCS)-SOI-232 is completed for soil at inven-tory location.
NRCS (SCS)-RANGE-417 No.: Enter when a form NRCS(SCS)-RANGE-417 is completed forunderstory vegetation.
Elevation: Enter elevation at plot location.
Precipitation zone: Enter estimate of average annual precipitation at inventory location.
Slope: Enter the percent of slope.
Azimuth: Enter in degrees.
Landform: Briefly describe major or component landform and check appropriate boxes for slopecomponent and shape (F. Peterson, 1981. Landforms of the Basin and Range Province, TechnicalBulletin No. 28 University of Nevada, Reno).
Heading data lines

20
Surface rock cover: Estimate percentages of surface rock by size:Boulders - >40 inches in diameterStones - >10 inches and <40 inches in diameterCobbles - >3 inches and <10 inches in diameterGravels - >10 mm and <3 inches in diameter
Grazing history: Show past grazing history of the area:1 - None2 - Slight3 - Moderate4 - Heavy
Kind of animal: Enter kind and class of livestock grazing in the area.
Season of use: Show season(s) of use where area is grazed:U - UnknownSP - SpringSU - SummerF - FallW - Winter
Wildlife species: Enter wildlife species found in the area.
Burning history:
U - Unknown1 - Rarely burned2 - Occasionally burned3 - Systematically burned4 - Burned ___|___ years ago (Enter code and years)
Harvest history:
U - Unknown1 - Not harvested2 - Harvested ___|___ years ago (Enter code and years)
21
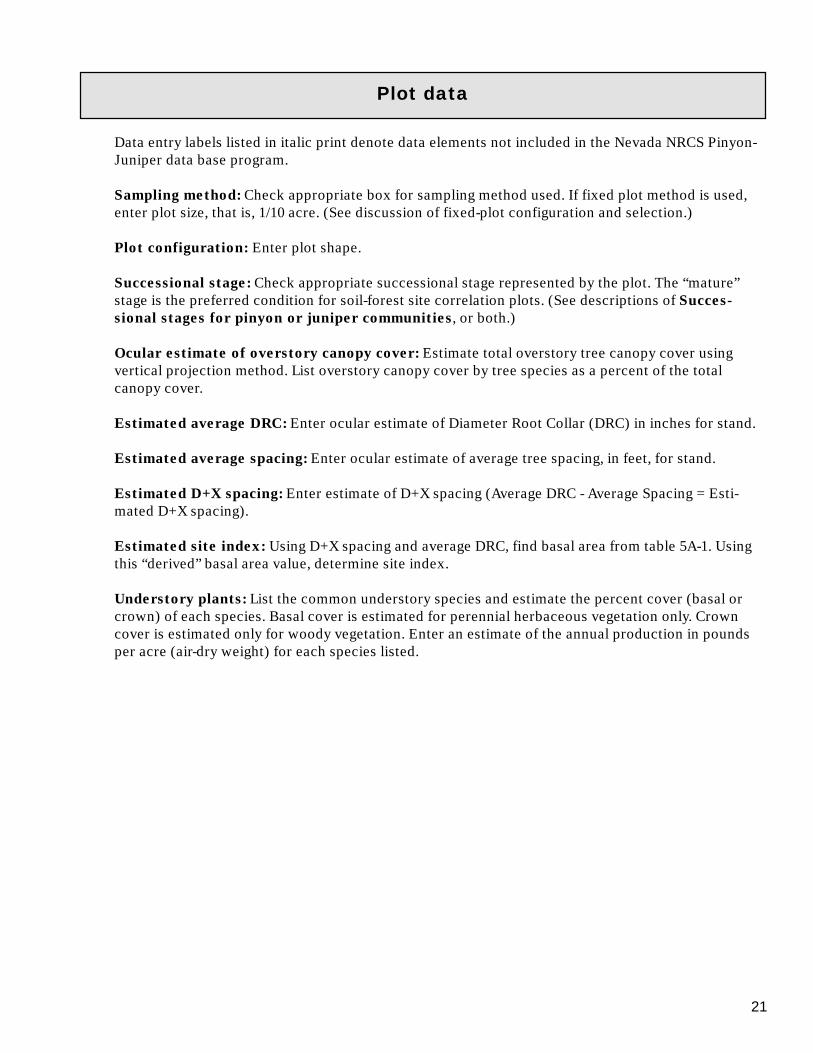
Plot data
Data entry labels listed in italic print denote data elements not included in the Nevada NRCS Pinyon-Juniper data base program.
Sampling method: Check appropriate box for sampling method used. If fixed plot method is used,enter plot size, that is, 1/10 acre. (See discussion of fixed-plot configuration and selection.)
Plot configuration: Enter plot shape.
Successional stage: Check appropriate successional stage represented by the plot. The “mature”stage is the preferred condition for soil-forest site correlation plots. (See descriptions of Succes-
sional stages for pinyon or juniper communities, or both.)
Ocular estimate of overstory canopy cover: Estimate total overstory tree canopy cover usingvertical projection method. List overstory canopy cover by tree species as a percent of the totalcanopy cover.
Estimated average DRC: Enter ocular estimate of Diameter Root Collar (DRC) in inches for stand.
Estimated average spacing: Enter ocular estimate of average tree spacing, in feet, for stand.
Estimated D+X spacing: Enter estimate of D+X spacing (Average DRC - Average Spacing = Esti-mated D+X spacing).
Estimated site index: Using D+X spacing and average DRC, find basal area from table 5A-1. Usingthis “derived” basal area value, determine site index.
Understory plants: List the common understory species and estimate the percent cover (basal orcrown) of each species. Basal cover is estimated for perennial herbaceous vegetation only. Crowncover is estimated only for woody vegetation. Enter an estimate of the annual production in poundsper acre (air-dry weight) for each species listed.

22
Fixed-plot transect: tree data lines
the first stem encountered and run an arrow downthe “Tree No.” column until all the stems of that treeare accounted for. Only those stems greater than 3inches in diameter are recorded. For practicalpurposes (and for compliance with the “Howell” siteindex procedure), only trees greater than 4.5 feet inheight will be assigned a number and entered in thetree data line section. Trees less than 4.5 feet inheight are accounted for as “seedlings” or “saplings”and in measures of understory vegetation.
Species: Enter the appropriate scientific plantsymbol for each tree measured:
singleleaf pinyon = PIMOUtah juniper = JUOS
Rocky Mountain juniper = JUSC2pinyon = PIED
Distance: Distance is not recorded in a fixed-plottransect.
DRC: Enter the “Diameter Root Collar” (DRC) ofthe tree to the nearest 1/10 inch. Measure DRC atjust above the root collar or average ground line(mineral soil, after duff layer removed). DRC ismeasured at the ground line for single-stemmedtrees with uniform stem taper. For multiple-stemmed trees that fork near (within 6 inches) orbelow the average ground line, a DRC of each stemis measured and an equivalent DRC (EDRC) in themcomputed and recorded in place of DRC.
S S S1 2 32 2 2+ + +( )...
S= Individual stem
For multiple-stemmed trees that fork above 6 inchesfrom the average ground line, measure DRC at thetree base. This is done for all stems greater than 3inches in diameter. Start with the the largest stemand be careful not to measure the same stem twice.
Basal area: Complete this column after returningto the office. Enter the appropriate basal area (insquare feet to the nearest tenth) using the measureDRC or computed EDRC and table 5A-1, Basal area.An entry must be made for each single-stemmed tree(DRC) and for each multiple-stemmed tree (EDRC).
Fixed-area sampling units are called plots or stripsdepending on their dimensions. The term plot isloosely applied to sampling units of small areas thatare square, rectangular, circular, or triangular inshape. A strip is a rectangular plot whose length ismany times its width. Any fixed-area plot configura-tion may be used within a selected tree stand. Theguiding principle in the choice of plot size should beto have a plot large enough to include a representa-tive number of trees, but small enough that the timerequired for measurement is not excessive. Formore sparse tree stands, use a 1/10-acre plot; formore dense stands, use a 1/20-acre plot size. Once aplot size is chosen for a soil series (and phase), theselected plot size should be used consistently foradditional woodland inventories conducted on thesoil. If plot data collection is to include the comple-tion of a form NRCS(SCS)-ECS-417, choose a plotconfiguration compatible with this sampling of theunderstory plant community.
Commonly used circular and square plot dimen-
sions—
Radius of Side of DiagonalArea circular plot square plot square plot
Acres Feet2 Feet Feet Feet
1.00 43,560 117.75 208.71 295.160.50 21,780 83.26 147.58 208.710.25 10,890 58.88 104.36 147.580.20 8,712 52.66 93.34 132.000.10 4,356 37.24 66.00 93.340.05 2,178 26.33 46.67 66.000.01 435.6 11.78 20.87 29.520.001 43.56 3.72 6.60 9.33
General: The worksheet has lines for entering datafrom single-stemmed trees or single and multiple-stemmed trees. Flag each tree when measurementsare completed so it is not inadvertently measuredagain. Use additional pages as needed, to completestand inventory.
Tree data linesTree number: Starting in the upper left corner ofthe tree data lines section, enter “1” for the first treemeasured, “2” for the second and so on. A multiple-stemmed tree is considered a single tree; number

23
Crown diameter: Measure the live crown diameterof each tree within the plot along the long axis intwo directions. Add the first crown diameter mea-surement to the second crown diameter measure-ment and divide by 2 to obtain an average crowndiameter for each tree. Crown diameter, in feet, isrounded to the nearest whole number.
Height: Enter the height of each tree from theaverage ground line to the tip of the tallest livestem. Tree height, in feet, is rounded to the nearestwhole number.
Juniper posts: Record the number of posts in eachjuniper tree. A post is a solid, reasonably straight,stem at least 7 feet long with a minimum small enddiameter of 4 inches and a large end diameter of 7to 9 inches. Record posts only for juniper species.Pinyon species are seldom used for fenceposts, asthis wood has a short useful life span (4 to 6 years).
NotesUse this column to record any pertinent informa-tion, or to identify trees selected for aging. Whentree age is desired, select 3 to 5 dominant orcodominant trees within the plot. Selected treesmust be in the best health or condition relative toother trees within the plot. An increment core willbe taken from each selected tree at 12 inches abovethe average ground line (1-foot stump height).Increment cores are marked for easy identificationand stored so that tree rings can be counted afterreturning to office. Record total tree ring count andthe ring count from pith to 2.3 inches from incre-
ment core is this column. Make the followingadjusts to correct tree ring count to total tree age:add 9 years for pinyon and singleleaf pinyon; add 12years for Utah juniper; add 8 years for Rocky Moun-tain juniper. Ring counts from the pith outward to2.3 inches are also adjusted using these factors toobtain total tree age when at a 5-inch outside-bark(O.B.) diameter (4.6-inch inside-bark diameter).Ring counts made from pith to 2.3 inches will beused to validate site productivity.
Tree seedling and sapling countEstimates of tree seedlings and saplings are notmade for fixed plot sampling. If desirable, a zig-zagtransect may also be completed adjacent to thefixed plot location to record seedlings or saplings,or both, at site. A tree seedling is less than 20 inchesin height; a tree sapling is 20 inches to 4.5 feet inheight. Enter the species, height, and distancebetween plants, for 20 seedlings or saplings, orboth, in the space provided in right-hand margin ofthe worksheet. Distances can be summed afterreturning to office and the number of juniper orpinyon, or both, seedlings/saplings per acre calcu-lated. (Refer to NRCS National Forestry Manual,Part 536, Section 536.10 through 536.27 for proce-dures to complete a zig-zag transect.)
Fixed plot countCount tree seedlings and saplings found withinfixed plot area and record, by species, in the spaceprovided in lower-right corner of the worksheet. Aseedling tree is less than 20 inches in height, a treesampling is 20 inches to 4.5 inches in height.

24
Zig-Zag Transect: Tree Data Lines
Refer to NRCS National Forestry Manual, Part 536,Section 536.10 through 536.27 for procedures tocomplete a zig-zag transect.
General: Worksheet on page 19 contains lines forentering data of single-stemmed trees or a lessernumber of single and multiple-stemmed trees. Useadditional pages as needed to complete transect.
Tree Data LinesTree number: Starting in the upper left corner ofthe tree data lines section, enter “1” for the first treemeasured, “2” for the send on and so on. A multiple-stemmed tree is considered a single tree; numberthe first stem encountered and run an arrow downthe “Tree No.” Column until all the stems of thattree are accounted for. Only those stems greaterthan 3 inches in diameter are recorded. For practi-cal purposes (and for compliance with the “Howell”site index procedure), only trees greater than 4.5feet in height will be assigned a number and enteredin the tree data line section. Trees less than 4.5 feetin height are accounted for as “Seedlings” or “Sap-lings” and in measures of understory vegetation.
Species: Enter distance (measured in feet) betweeneach tree included in transect.
DRC: Enter the “Diameter Root Collar” (DRC) ofthe tree to the nearest 1/10th inch. Measure DRC atjust above the root collar or average ground line(mineral soil, after duff layer removed). DRC ismeasured at the ground line for single-stemmedtrees with uniform stem taper. For multiple-stemmed trees that fork near (within 6 inches) orbelow the average ground line, a DRC of each stemis measured and an equivalent DRC (EDRC) iscomputed and recorded in place of DRC.
S S S1 2 32 2 2+ + +( )...
S = Individual stem
For multiple-stemmed trees that fork above 6 inchesfrom the average ground line, measure DRC at thetree base. This is done for all stems greater than 3inches in diameter. Start with the largest stem andbe careful not to measure the same stem twice.
Basal area: Complete this column after returningto the office. Enter the appropriate basal area (insquare feet to the nearest tenth) using the measuredDRC or the computed EDRC and table 5A-1, Basalarea. An entry must be made for each single-stem-med tree (DRC) and for each multiple-stemmed tree(EDRC).
Crown diameter: Measure the live crown diameterof each tree within plot along the long axis in twodirections. Add the first crown diameter measure-ment to the second crown diameter measurementand divide by 2 to obtain an average crown diameterfor each tree. Crown diameter, in feet, is rounded tothe nearest whole number.
Height: Enter the height of each tree from theaverage ground line to the type of the tallest livestem. Tree height, in feet, is rounded to the nearestwhole number.
Juniper posts: Record the number of posts in eachjuniper tree. A post is a solid, reasonable straight,stem, at least 7 feet long, with a minimum small enddiameter of 4 inches and a large end diameter of 7to 9 inches. Record posts only for juniper species.Pinyon species are seldom used for fenceposts asthis wood has a short useful lifespan (4 to 6 years).
NotesUse this column to record any pertinent informa-tion, or to identify trees selected for aging . Whentree age is desired, select three to five dominant orcodominant trees within the plot. Selected treesmust be in the best health or condition relative toother trees within the plot. An increment core willbe taken from each selected tree at 12 inches abovethe average ground line (1-foot stump height).Increment cores are marked for easy identificationand stored so that tree rings can be counted afterreturning to office. Record total tree ring count andthe ring count from pith to 2.3 inches from incre-ment core in this column. Make the followingadjustments to correct tree ring count to total treeage: add 9 years for pinyon and singleleaf pinyon;add 12 years for Utah juniper; add 8 years for RockyMountain juniper. Ring counts from the pith out-ward to 2.3 inches are also adjusted using these

25
factors in order to obtain total tree age when at a5- inch outside-bark (O.B) diameter (4.6-inch inside-bark diameter). Ring counts made from pith to 2.3inches will be used to validate site productivity.
Tree seedling or sapling count Space is provided to enter estimates of pinyon and/or juniper seedlings and saplings for the stand beinginventoried. A tree seedling is less than 20 inches inheight, a tree sapling is 20 inches to 4.5 feet inheight. If desirable, a zig-zag transect species,height, and distance between plants, for 20 seed-lings or saplings, or both. Distances can be summedafter returning to office and the number of juniperor pinyon, or both, seedlings/saplings per acrecalculated.

26
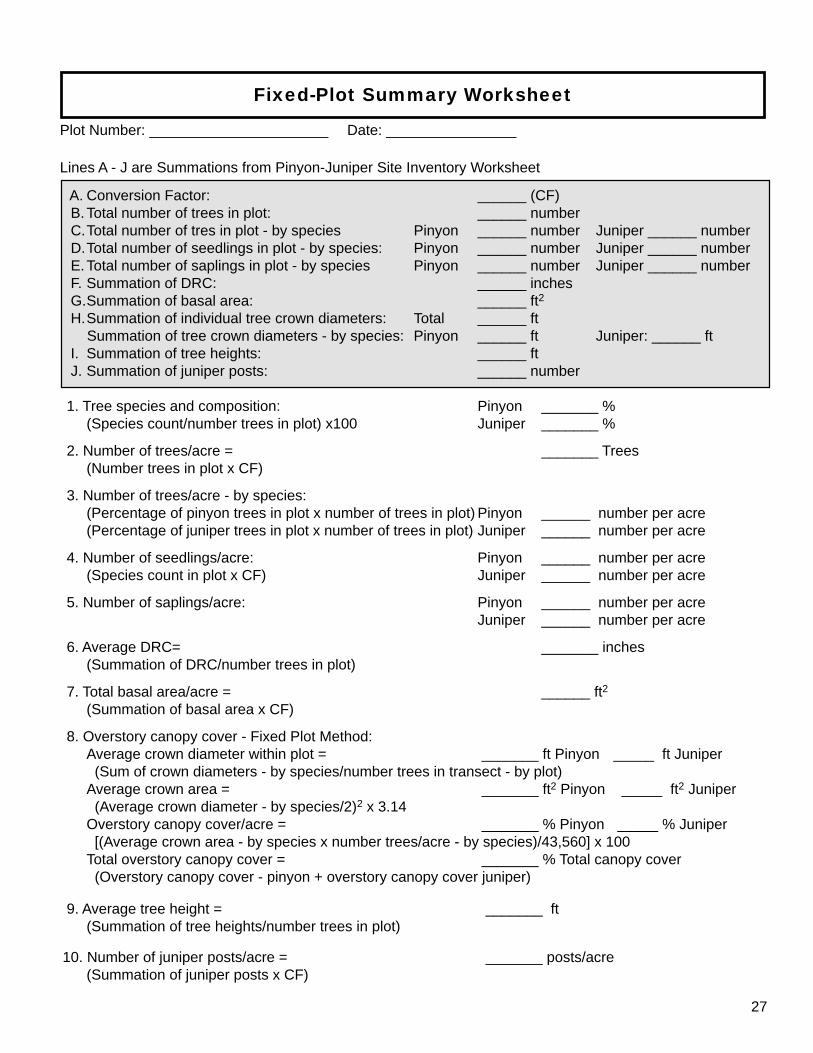
Appendix 3: Instructions for fixed-plot summary worksheet
A. CF refers to the conversion factor for the plot.Enter 10 for a 1/10-acre plot, 20 for a 1/20-acre plot.(see “Sampling method” ).
Lines B through J are summations of tree data lineentries recorded on Pinyon-Juniper Site InventoryWorksheet.
B. Total number of trees in plot equals the totalnumber of trees, greater than 4.5 feet in height,recorded within plot.
C. Total number of trees in plot - by species
equals the total number of each tree species re-corded within the plot.
D., E. Total number of seedlings or saplings in
plot - by species equals the total number encoun-tered within the plot and entered in Fixed plot
count.
F. Summation of DRC refers to the total sum ofDRC’s and EDRC’s of all trees in the plot. The DRCof a single-stemmed tree (and a multiple-stemmedtree that forks at or above 6 inches) equals themeasured DRC. The equivalent DRC, or EDRC, of amultiple-stemmed tree that forks below 6 inchesequals the square root of the summation of thesquares of each individual stem
S S S1 2 32 2 2+ + +( )...
S = Individual stem
For example, tree number 1 is multiple-stemmedand has 3 stems measuring 5, 6 and 7 inches. Eachstem is squared (5x5, 6x6, 7x7), the products added(25 + 36 + 49 = 110), and the square root taken(10.5). continuing, the EDRC of tree number 1 isadded to the DRC or EDRC of tree number 2, and soon for all trees in the plot. The resulting sum (to thenearest 1/10 inch) is entered on line F.
G. Summation of basal area equals the total of allentries in the Basal area column.
H. Summation of individual tree crown diam-
eters equals the total of all entries in the Crown
diameter column. Also enter sum of tree crowndiameters for each tree species in plot.
I. Summation of tree heights equals the total ofall entries in the Height column.
J. Summation of juniper posts equals the total ofentries in the Juniper posts column.
Complete Lines 1 through 10 as instructed using theSummations entered in Lines A through J.
Complete line 11 as instructed using the Summa-
tions entered in Lines K through N.
Line 12. Overstory canopy cover - line intercept
method: Where line intercept transacts are used tosupplement canopy cover measurements fromwithin the fixed plot, enter results in space pro-vided.
Line 13. Tree age summary - Enter number oftrees, by species, for which age measurements havebeen made. Enter average DRC or EDRC for thesetrees, the average total age, and the average treeheight.
Line 14. Tree age to 2.3-inch radial growth -enter tree age at 2.3-inch radial growth (pith to 2.3inches) by tree species. Enter 1-foot height agecorrection factor for juniper species.
Complete entry of Site Index as directed on Fixed-Plot Summary Worksheet.
27
A. Conversion Factor: ______ (CF) B.Total number of trees in plot: ______ number C.Total number of tres in plot - by species Pinyon ______ number Juniper ______ number D.Total number of seedlings in plot - by species: Pinyon ______ number Juniper ______ number E.Total number of saplings in plot - by species Pinyon ______ number Juniper ______ number F. Summation of DRC: ______ inches G.Summation of basal area: ______ ft2
H.Summation of individual tree crown diameters: Total ______ ft Summation of tree crown diameters - by species: Pinyon ______ ft Juniper: ______ ft I. Summation of tree heights: ______ ft J. Summation of juniper posts: ______ number
1. Tree species and composition: Pinyon _______ %(Species count/number trees in plot) x100 Juniper _______ %
2. Number of trees/acre = _______ Trees(Number trees in plot x CF)
3. Number of trees/acre - by species:(Percentage of pinyon trees in plot x number of trees in plot) Pinyon ______ number per acre(Percentage of juniper trees in plot x number of trees in plot) Juniper ______ number per acre
4. Number of seedlings/acre: Pinyon ______ number per acre(Species count in plot x CF) Juniper ______ number per acre
5. Number of saplings/acre: Pinyon ______ number per acreJuniper ______ number per acre
6. Average DRC= _______ inches(Summation of DRC/number trees in plot)
7. Total basal area/acre = ______ ft2
(Summation of basal area x CF)
8. Overstory canopy cover - Fixed Plot Method:Average crown diameter within plot = _______ ft Pinyon _____ ft Juniper (Sum of crown diameters - by species/number trees in transect - by plot)Average crown area = _______ ft2 Pinyon _____ ft2 Juniper (Average crown diameter - by species/2)2 x 3.14Overstory canopy cover/acre = _______ % Pinyon _____ % Juniper [(Average crown area - by species x number trees/acre - by species)/43,560] x 100Total overstory canopy cover = _______ % Total canopy cover (Overstory canopy cover - pinyon + overstory canopy cover juniper)
9. Average tree height = _______ ft(Summation of tree heights/number trees in plot)
10. Number of juniper posts/acre = _______ posts/acre(Summation of juniper posts x CF)
Fixed-Plot Summary Worksheet
Plot Number: ______________________ Date: ________________
Lines A - J are Summations from Pinyon-Juniper Site Inventory Worksheet

28
Lines K-N are Summations from Pinyon-Juniper Site Inventory Worksheet/Seeding and Sapling Zig-ZagTransect
K. Summation of distances: _____ ft L. Total number of stems in transect: _____ number M. Total number of seedlings in transect - by species: Pinyon _____ number Juniper _____ number N.Total number of saplings in transect - by species: Pinyon _____ number Juniper _____ number
11. Number of seedlings and saplings per acreAverage spacing of stems less than 4.5 feet in height = _______ ft average spacing
(Summation of distances/total number of stems in transect)Total number of stems less than 4.5 feet in height per acre _______ number stems/acre
[43,560 / (Average spacing)2]Percentage of juniper seedlings and saplings in transect:
(Number juniper seedlings / total number of stems in transect) x 100 _______ % juniper seedlings(Number juniper saplings / total number of stems in transect) x 100 _______ % juniper saplings
Percentage of pinyon seedlings and saplings in transect:(Number pinyon seedlings/total number of stems in transect) x 100 _______ % pinyon seedlings(Number pinyon saplings/total number of stems in transect) x 100 _______ % pinyon saplings
Number of seedlings and saplings per acre by species:(Percent juniper seedlings) (number of stems per acre) Juniper _______ seedlings / acre(Percent juniper saplings) (number of stems per acre) Juniper _______ saplings / acre(Percent pinyon seedlings) (number of stems per acre) Pinyon _______ seedlings / acre(Percent juniper saplings) (number of stems per acre) Pinyon _______ saplings / acre
12. Overstory canopy cover—line intercept method:Line intercept transect length: _____ ft _____% Pinyon _____% JuniperPinyon _____ ft Juniper _____ ft Other _____ ft ______% Total
13. Age summary of trees sampled on plot:Pinyon: Number trees sampled ____ Average DRC/EDRC ____ Average age____ Average height _____Juniper: Number trees sampled ____ Average DRC/EDRC ____ Average age____ Average height _____
14. Age summary of pith to 2.3-inch radial growth for trees sampled on plot:Pinyon - _____ average of ring counts, pith to 2.3 inch + 9 = ___ average age at 4.6-inch inside-bark
diameter (5 inch o.b. diameter).Juniper - _____ average of ring counts, pith to 2.3 inch +__= ___ average age at 4.6-inch inside-bark
diameter (5 inch o.b. diameter).
Site Index
Howell, 1940 (W882) Pinyon - Juniper Site Index _______SI= (5 inches/average DRC) (Total basal area / acre) Or determine Site Index using figure 4, p 33.
Chojnacky, 1986 (INT - 372) Pinyon Site Index _______ Juniper Site Index _____SI = [0.9474HT] [exp (3.6778Dp + 2.5244Dj - 0.3137SP)] Or determine Site Index using figure 5, p 34.
Where: SI = site index (ft) referenced to 10-inch DRC pinyon DRC = tree diameter at 6-inch stump height (inches)
HT = total tree height (ft) Dj = 1/DRC for juniper, 0 for pinyon Dp = 1/DRC for pinyon,0 for juniper exp = exponential function SP = 1 for pinyon, 0 for puniper

29
Appendix 4: Instructions for zig-zag summary worksheet
Lines A through G are summations of tree data linesrecorded on Pinyon-Juniper Site Inventory Work-sheet.
A. Total number of trees in transect - by spe-
cies equals the total number of each tree species,greater than 4.5 feet in height, recorded in thetransect.
B. Summation of DRC , Diameter Root C ollar,refers to the total sum of DRC’s and EDRC’s of alltrees within the transect. The DRC of a single-stemmed tree (and a multiple-stemmed tree thatforks at or above 6 inches) equals the measuredDRC. The equivalent DRC, or EDRC, or a multiple-stemmed tree that forks below 6 inches equals thesquare root of the summation of the squares of eachindividual stem.
S S S1 2 32 2 2+ + +( )...
S + Individual stem
For example, tree number 1 is multiple-stemmedand has 3 stems measuring 5, 6, and 7 inches. Eachstem is squared (5x5, 6x6, 7x7), the products added(25 + 36 + 49 = 110), and the square root taken(10.5). Continuing, the equilvalent DRC (EDRC) oftree number 1 is added to the DRC or EDRC of treenumber 2, and so on for all trees in the plot. Theresulting sum (to the nearest 1/10 inch is entered online B.
C. Summation of basal area equals the total of allentries in the Basal area column.
D. Summation of distances equals the total of allentries in the Distance column.
E. Summation of individual tree crown diam-
eters equals the total of all entries in the Crown
diameter column. Also enter sum of tree crowndiameters for each tree species in transect.
F. Summation of juniper posts equals the total ofall entries in the Juniper posts column.
Complete Lines 1 through 9 as instructed at eachline number using the Summations entered inLines A through G.
Line 10 - Enter ocular estimates of seedlings andsaplings per acre if recorded on Pinyon-Juniper SiteInventory Worksheet.
Complete Line 11 as instructed using the summa-
tions entered in Lines H through K.
Line 12 - Overstory canopy cover—line inter-
cept method: Where line intercept transects areused to supplement canopy cover measurementsfrom within the fixed plot, enter results in spaceprovided.
Line 13 - Tree age summary: Enter number oftrees, by species, for which are measurements havebeen made. Enter average DRC or EDRC for thesetrees, the average total age, and the average treeheight.
Line 14 - Tree age to 2.3-inch radial growth:enter tree age at 2.3-inch radial growth (pith to 2.3inches) by tree species. Enter 1-foot height agecorrection factor for juniper species.
Complete entry of Site Index as directed on Zig-Zagsummary Worksheet.

30
Zig-Zag Transect Summary Worksheet
Plot number: ______________________ Date: ________________
Lines A - G are Summations from Pinyon-Juniper Site Inventory Worksheet
A. Total number of trees in transect - by species: Pinyon: ______ number Juniper: ______ number B. Summation of DRC: ______ inches C.Summation of basal area: ______ ft2
D.Summation of distances: ______ ft E. Summation of individual tree crown diameters: Total: ______ ft Summation of tree crown diameter - by species: Pinyon: ______ ft Juniper: _______ ft F. Summation of tree heights: ______ ft G.Summation of juniper posts: ______ number
1. Tree species and composition: Pinyon _______ %(Species count / 20) x100 Juniper _______ %
2. Average DRC = _______ inches.(Summation of DRC / 20)
3. Average spacing = _______ ft(Summation of distances / 20)
D + X Spacing = _______ D + X(Average spacing - average DRC)
4. Total number of trees/acre = _______ Trees[43,560 / (Average spacing)2]
5. Number of trees/acre - by species:(Percentage of pinyon trees in transect x number of trees/acre) _______ number pinyon/acres(Percentage of juniper trees in transect x number of trees/acre) _______ number juniper/acre.
6. Total basal area/acre “measured” = _______ ft2
(Summation of basal area / 20) x number trees/acre
7. Overstory canopy cover - zig-zag method:Average crown diameter = _______ ft pinyon ______ ft juniper (Summation crown diameters - by species/number trees in transect - by species)Average crown area = _______ ft2 pinyon ______ ft2 juniper (Average crown diameter - by species /2)2 x 3.14Overstory canopy cover/acre = _______ % Pinyon ______ % Juniper [(Average crown area - by species x number trees/ac - by species) / 43,560] x 100Total overstory canopy cover = _______ % Total canopy cover (Overstory canopy cover - pinyon + overstory canopy cover juniper)
8. Average tree height = _______ ft(Summation of heights/20)
9. Number of juniper posts/acre = _______ posts/acre[(Summation of juniper posts/number of juniper trees in transect) x number juniper trees/ac.]

31
10. Estimated number of seedlings/saplings per acre: Pinyon _______ Seedlings/acre ______ Saplingsacre Juniper _______ Seedlings/acre ______ Saplings/acre
Lines H -K are Summations from Pinyon-Juniper Site Inventory Worksheet/Seeding and Sapling Zig-ZagTransect
H. Summation of distances: _______ ft I. Total number of stems in transect: _______ number J. Total number of seedlings in transect - by species: Pinyon _______ number Juniper _______ number K. Total number of saplings in transect - by species: Pinyon _______ number Juniper _______ number
11. Number of seedlings and saplings per acreAverage spacing of stems less than 4.5 feet in height = _______ ft average spacing (Summation of distances/total number of stems in transect)Total number of stems less than 4.5 feet in height per acre _______ number stems/acre
[43,560 / (Average spacing)2]Percentage of juniper seedlings and saplings in transect: (number juniper seedlings / total number of stems in transect) x 100 _______ % juniper seedlings (number juniper saplings / total number of stems in transect) x 100 _______ % juniper saplingsPercentage of pinyon seedlings and saplings in transect: (Number pinyon seedlings/total number of stems in transect) x 100 _______ % pinyon seedlings (Number pinyon saplings/total number of stems in transect) x 100 _______ % pinyon saplingsNumber of seedlings and saplings per acre by species: (Percent juniper seedlings) (number of stems per acre) Juniper _______ seedlings / acre (Percent juniper seedlings) (number of stems per acre) Juniper _______ saplings / acre (Percent pinyon seedlings) (number of stems per acre) Pinyon _______ seedlings / acre (Percent pinyon seedlings) (number of stems per acre) Pinyon _______ saplings / acre
12. Overstory canopy cover - line intercept method:Line intercept transect length: _____ ft _____ % total _____% pinyon _____% juniperPinyon _____ ft Juniper _____ ft Other _____ ft
13. Age summary of trees sampled on plot:Pinyon:Number trees sampled _____ average DRC/EDRC ___ average age _____ average height _____Juniper:Number trees sampled _____ average DRC/EDRC ___ average age _____ average height _____
14. Age summary of pith to 2.3-inch radial growth for trees sampled on plot: Pinyon - _____ Average of ring counts, pith to 2.3 inches + 9 = ____ Average age at 4.6 inches inside-bark
diameter (5 inches O.B. diameter). Juniper - _____ Average of ring counts, pith to 2.3 inches +__= ____ Average age at 4.6 inches inside-bark
diameter (5 inches O.B. diameter).
Site Index
Howell, 1940 (W882) Juniper-Pinyon Site Index _______SI= (5 inches/average DRC) (Total basal area /acre) Or determine Site Index using figure 4, p. 33.
Chojnacky, 1986 (INT - 372) Juniper Site Index _______ Pinyon Site Index _____SI = [0.9474HT] [exp (3.6778Dp + 2.5244Dj - 0.3137SP)] Or determine Site Index using figure 5, p. 34.
Where: SI = site index (ft) referenced to 10-inch DRC pinyon DRC = tree diameter at 6-inch stump height (inches) HT = total tree height (ft) Dj = 1/DRC for juniper, 0 for pinyon Dp = 1/DRC for pinyon, 0 for juniper
exp = exponential function SP = 1 for pinyon, 0 for juniper

32
Instructions for use of yield tables: foliage denseness classes
Two methods can be used:
1. On 1/10- or 1/100-acre plots selected by random,tally crown diameter per tree and foliage
denseness (sparse, medium, and dense) on eachtree.
From the tables, find yield per tree for eachtree by crown diameter and foliage densenessfrom the proper table (range site), and record thisopposite each tree.
Add this column of weights.
Multiply by 10 on 1/10-acre plots and by 100 on1/100-acre plots.
This figure is pounds per acre annual yield.
2. On 1/10- or 1/100-acre plots selected by random,tally crown diameter and foliage denseness
for each tree.
Average the crown diameter for the densefoliage trees; likewise, for the medium and sparseseparately.
Find the weight per tree in the proper tablesopposite for average crown diameter and multi-
ply this figure by the number of trees in thefoliage class. Do this for each foliage class.
Add the three figures.
Multiply by 10 on 1/10-acre plots and by 100 onthe 1/100-acre plots to get yield per acre.
Appendix 5: Area and yield tables for juniper and pinyon trees
Dense Medium Sparse

33
Figure 4. Basal area curves for tentative site classifications
[Basis, basal area attained when the diameter at 1 foot average 5 inches outsidebark for the stand above 4.5 feet in height. Pinyon and Juniper: A PreliminaryStudy of Volume, Growth and Yield. Howell, J. Jr., SCS Reg. Bull. No 71, NM, 1940]
220
200
180
160
140
120
100
80
60
40
20
00 1 2 3 4 5 6 7 8 9 10 11 12 13 14
Diameter at 1-foot (inches)
Tota
l bas
al a
rea
at 1
-fo
ot
(sq
uar
e fe
et)
Site I
Site II
Site III

34
Figure 5. Height to diameter site index curves (reference tree is a 10-inch DRC pinyon)
[Pinyon-Juniper Site Quality and Volume Growth Equations for Nevada. 1986.Chojnacky, D.C. USDA Forest Service. Research Paper INT-372. IntermountainResearch Station, Ogden, Utah]
45
40
35
30
20
25
15
10
5
0
0 5 10 15 20 25 30Diameter at 6-inch stump height (inches)
Tota
l hei
gh
t (f
eet)
Pinyon
Juniper
30
25
30
2025
2015
15
10
10
Site index(feet)

35
Diameter Area of Diameter Area of Diameter Area of Diameter Area ofinches circle inches circle inches circle inches circle
ft2 ft2 ft2 ft2
0.1 .0001 7.9 .3404 15.7 1.3444 23.5 3.01210.2 .0002 8.0 .3491 15.8 1.3616 23.6 3.05770.3 .0006- 8.1 .3578 15.9 1.3790 23.7 3.0635+0.4 .0009 8.2 .667 16.0 1.3963 23.8 3.0895-0.5 .0014 8.3 .3757 16.1 4.4138 23.9 3.1155-0.6 .0020 8.4 .3646 16.2 1.4314 24.0 3.14160.7 .0027 8.5 .3941 16.3 1.4491 24.1 3.16780.8 .0035- 8.6 .4034 16.4 1.4669 24.2 3.19420.9 .0044 8.7 .4126 16.5 1.4849 24.3 3.22061.0 .0055- 8.8 .4224 16.6 1.5029 24.4 3.24721.1 .0066 8.9 .4220 16.7 1.5211 24.5 3.27391.2 .0079 9.0 .4418 16.8 1.5394 24.6 3.60061.3 .0092 9.1 .4517 16.9 1.5578 24.7 3.3275+1.4 .0107 9.2 .4616 17.0 1.3576 24.8 3.3545+1.5 .0123 9.3 .4717 17.1 1.5948 24.9 3.38161.6 .0140 9.4 .4819 17.2 1.6126 25.0 3.40881.7 .0158 9.5 .4922 17.3 1.6334 25.1 3.43621.8 .0177 9.6 .5027 17.4 1.6513 25.2 3.46361.9 .0197 9.7 .5132 17.5 1.6703 25.3 3.49112.0 .0218 9.8 .5228/ 17.6 1.3895- 25.4 3.51882.1 .0241 9.9 .5346 17.7 1.7087 25.5 3.54662.2 .0264 10.0 .5454 17.8 1.7281 25.6 3.57442.3 .0289 10.1 .5564 17.9 1.7476 25.7 3.60242.4 .0314 10.2 .5675- 18.0 1.7671 25.8 3.6205+2.5 .0341 10.3 .5786 18.1 1.7868 25.9 3.65872.6 .0369 10.4 .5899 18.2 1.8066 26.0 3.68702.7 .0398 10.5 .6013 18.3 1.8565+ 26.1 3.72542.8 .0428 10.6 .6128 18.4 1.8466 26.2 3.74392.9 .0459 10.7 .6244 18.5 1.8667 26.3 3.77263.0 .0491 10.8 .6362 18.6 1.8869 26.4 3.80133.1 .0524 10.9 .6480 18.7 1.9078 26.5 3.83023.2 .0559 11.0 .6600 18.8 1.9277 26.6 3.85913.3 .0594 11.1 .6720 18.9 1.9483 26.7 3.88823.4 .0631 11.2 .6842 19.0 1.9689 26.8 3.91743.5 .0668 11.3 .6964 19.1 1.9897 26.9 3.94673.6 .0707 11.4 .7088 19.2 2.0106 27.0 3.97613.7 .0747 11.5 .7213 19.3 2.0316 27.1 4.00563.8 .0788 11.6 .7339 19.4 2.0527 27.2 4.0352
Table 5A–1. Basal area
[Basal area is square feet from given diameters of 0.1 to 60 inches.1 From table 18, USDA Misc. Pub. 225]

36
Diameter Area of Diameter Area of Diameter Area of Diameter Area ofinches circle inches circle inches circle inches circle
ft2 ft2 ft2 ft2
3.9 .0830 11.7 .7466 19.5 2.0739 27.3 4.06494.0 .0873 11.8 .7594 19.6 2.0953 27.4 4.09484.1 .0917 11.9 .7724 19.7 2.1167 27.5 4.12474.2 .0962 12.0 .7854 19.8 2.1382 27.6 4.15484.3 .1008 12.1 .7985+ 19.9 2.1599 27.7 4.18494.4 .1056 12.2 .8118 20.0 2.1817 27.8 4.21524.5 .1104 12.3 .8252 20.1 2.2035+ 27.9 4.24564.6 .1154 12.4 .8386 20.2 2.2255+ 28.0 4.27614.7 .1205- 12.5 .8522 20.3 2.2476 28.1 4.30674.8 .1257 12.6 .8659 20.4 2.2698 28.2 4.33744.9 .1310 12.7 .8797 20.5 2.2921 28.3 4.36825.0 .1364 12.8 .8936 20.6 2.3145+ 28.4 4.39915.1 .1419 12.9 .9076 20.7 2.3371 28.5 4.43015.2 .1475 13.0 .9218 20.8 2.3597 28.6 4.46135.3 .1532 13.1 .9360 20.9 2.3824 28.7 4.4925+5.4 .1590 13.2 .9503 21.0 2.4053 28.8 4.52395.5 .1650 13.3 .9648 21.1 2.4283 28.9 4.55545.6 .1710 13.4 .9793 21.2 2.4513 29.0 4.58695.7 .1772 13.5 .9940 21.3 2.4745- 29.1 4.61865.8 .1835- 13.6 1.0088 21.4 2.4978 29.2 4.65045.9 .1899 13.7 1.0237 21.5 2.5212 29.3 4.68236.0 .1963 13.8 1.0387 21.6 2.5447 29.4 4.71446.1 .2029 13.9 1.0538 21.7 2.5683 29.5 4.7465-6.2 .2097 14.0 1.0690 21.8 2.5920 29.6 4.77876.3 .2165- 14.1 1.0843 21.9 2.6159 29.7 4.81116.4 .2234 14.2 1.0998 22.0 2.6398 29.8 4.8435+6.5 .2304 14.3 1.1153 22.1 2.6639 29.9 4.87616.6 .2376 14.4 1.1310 22.2 2.6880 30.0 4.90676.7 .2448 14.5 1.1467 22.3 2.7123 30.1 4.9415+6.8 .2522 14.6 1.1626 22.4 2.7367 30.2 4.97446.9 .2597 14.7 1.1789 22.5 2.7612 30.3 5.00747.0 .2673 14.8 1.1947 22.6 2.7858 30.4 5.0405+7.1 .2749 14.9 1.2109 22.7 2.8105- 30.5 5.07377.2 .2827 15.0 1.2272 22.8 2.8353 30.6 5.10717.3 .2907 15.1 1.2436 22.9 2.8602 30.7 5.1405-7.4 .2987 15.2 1.2601 23.0 2.8852 30.8 5.17407.5 .3068 15.3 1.2768 23.1 2.9104 30.9 5.20777.6 .3150 15.4 1.2935+ 23.2 2.9358 31.0 5.24147.7 .3234 15.5 1.3104 23.3 2.9610 31.1 5.27537.8 .3318 15.6 1.3273 23.4 2.9865 31.2 5.3093
1 3.1415926536; basal area in square feet. 0.00545415391; (0.005454154) times the square of the diameter in inches.

37
Table 5A-2. Guide for determining current yield of Utah Juniper In Utah[Upland Stony Loam (Juniper) Site current yield air dry pounds]
Crown Weightdiameter per 10 50 100 200 300 400 500
feet tree Trees Trees Trees Trees Trees Trees Trees
Sparse foliage
1 0.1 1 5 10 20 30 40 502 0.3 3 15 30 60 90 120 1503 0.6 6 30 60 120 180 240 3004 1.0 10 50 100 200 300 400 5005 1.3 13 65 130 260 390 520 6506 1.6 16 80 160 320 480 640 8007 1.9 19 95 190 380 570 760 9508 2.3 23 115 230 460 690 920 11509 2.6 26 130 260 520 780 1040 1300
10 2.9 29 145 290 580 870 1160 145011 3.3 33 165 330 660 990 1320 165012 3.6 36 180 360 720 1080 1440 180013 4.0 40 200 400 800 1200 1600 200014 4.4 44 220 440 880 1320 1760 220015 4.7 47 235 470 940 1410 1880 235016 5.1 51 255 510 1020 1530 2040 255017 5.5 55 275 550 1100 1650 220018 5.8 58 290 580 1160 1740 232019 6.2 62 310 620 1240 1860 248020 6.6 66 330 660 1320 1980 2640
Medium foliage
1 0.1 1 5 10 20 30 40 502 0.3 3 15 30 60 90 120 1503 0.6 6 30 60 120 180 240 3004 1.0 10 50 100 200 300 400 5005 1.4 14 70 140 280 420 560 7006 1.9 19 95 190 380 570 760 9507 2.5 25 125 250 500 750 1000 12508 3.1 31 155 310 620 930 1240 15509 3.8 38 190 380 760 1140 1520 1900
10 4.6 46 230 460 920 1380 1840 230011 5.4 54 270 540 1080 1620 2160 270012 6.2 62 310 620 1240 1860 248013 7.2 72 360 720 1440 216014 8.1 81 405 810 1620 243015 9.1 91 455 910 1820 273016 10.2 102 510 1020 204017 11.3 113 565 1130 226018 12.4 124 620 1240 248019 13.6 136 680 136020 14.8 148 740 1480

38
Table 5A-2. Guide for Guide for determining current yield of Utah Juniper In Utah—Continued
Crown Weightdiameter per 10 50 100 200 300 400 500
feet tree Trees Trees Trees Trees Trees Trees Trees
Dense foliage
1 0.1 1 5 10 20 30 40 502 0.3 3 15 30 60 90 120 1503 0.7 7 35 70 140 210 280 3504 1.2 12 60 120 240 360 480 6005 1.9 19 95 190 380 570 760 9506 2.7 27 135 270 540 810 1080 13507 3.6 36 180 360 720 1080 1440 18008 4.7 47 235 470 940 1410 1880 23509 5.9 59 295 590 1180 1770 2360
10 7.2 72 360 720 1440 216011 8.6 86 430 860 1720 258012 10.2 102 510 1020 204013 11.9 119 595 1190 238014 13.7 137 685 1370 274015 15.6 156 780 156016 17.7 177 885 177017 19.9 199 995 199018 22.2 222 1110 222019 24.6 246 1230 246020 27.2 272 1360 2720
Table 5A-3. General soil features associated with sites named in Guides for determining current yield ofpimo and juos in Utah
CoarsePrecipitation Range in fragments Range
Site name zone slope Soil depth in profile in AWCInches Percent Inches Percent Inches
Upland stony loam 12-16 5-30 Deep to very 50 (45-60 2-4 (6) deep over bedrock. at soil surface)
Semidesert stony loam 8-12 5-30 50 over bedrock. 50 (45-60 2-4 at soil surface)
Upland gravely loam 12-16 4-15 35-40 35-65 2-3
Upland loam 12-16 3-20 40 to bedrock. 35-60 3-6 (in upper profile)
Upland shallow hardpan 12-16 5-20 6-20 15-60 ) 1.5-3 over hardpan. (often nonskeletal)
Upland shallow loam 12-16 8-60 14-20 (15) 75 0.5-1.5 to bedrock.
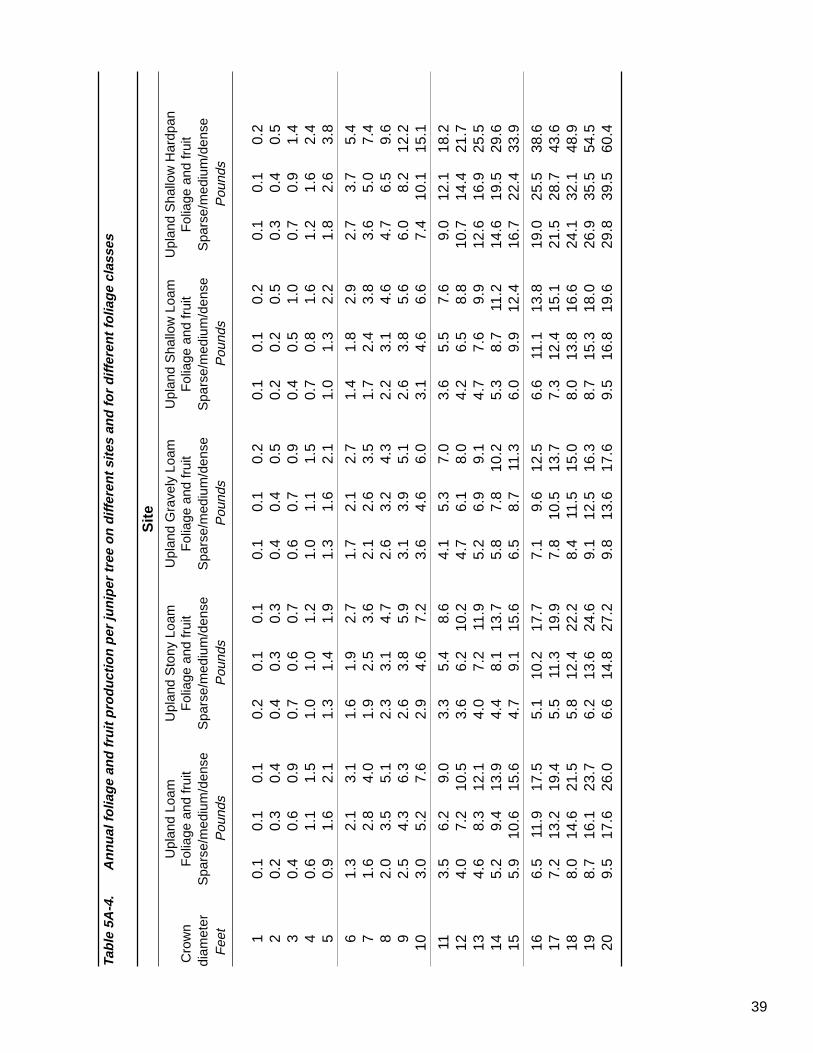
39
Tab
le 5
A-4
.A
nn
ual
fo
liag
e an
d f
ruit
pro
du
ctio
n p
er ju
nip
er t
ree
on
diff
eren
t si
tes
and
fo
r d
iffer
ent
folia
ge
clas
ses
Sit
e
Upl
and
Loam
Upl
and
Sto
ny L
oam
Upl
and
Gra
vely
Loa
mU
plan
d S
hallo
w L
oam
Upl
and
Sha
llow
Har
dpan
Cro
wn
Fol
iage
and
frui
tF
olia
ge a
nd fr
uit
Fol
iage
and
frui
tF
olia
ge a
nd fr
uit
Fol
iage
and
frui
tdi
amet
erS
pars
e/m
ediu
m/d
ense
Spa
rse/
med
ium
/den
seS
pars
e/m
ediu
m/d
ense
Spa
rse/
med
ium
/den
seS
pars
e/m
ediu
m/d
ense
Fee
tP
ound
sP
ound
sP
ound
sP
ound
sP
ound
s
10.
10.
10.
10.
20.
10.
10.
10.
10.
20.
10.
10.
20.
10.
10.
22
0.2
0.3
0.4
0.4
0.3
0.3
0.4
0.4
0.5
0.2
0.2
0.5
0.3
0.4
0.5
30.
40.
60.
90.
70.
60.
70.
60.
70.
90.
40.
51.
00.
70.
91.
44
0.6
1.1
1.5
1.0
1.0
1.2
1.0
1.1
1.5
0.7
0.8
1.6
1.2
1.6
2.4
50.
91.
62.
11.
31.
41.
91.
31.
62.
11.
01.
32.
21.
82.
63.
8
61.
32.
13.
11.
61.
92.
71.
72.
12.
71.
41.
82.
92.
73.
75.
47
1.6
2.8
4.0
1.9
2.5
3.6
2.1
2.6
3.5
1.7
2.4
3.8
3.6
5.0
7.4
82.
03.
55.
12.
33.
14.
72.
63.
24.
32.
23.
14.
64.
76.
59.
69
2.5
4.3
6.3
2.6
3.8
5.9
3.1
3.9
5.1
2.6
3.8
5.6
6.0
8.2
12.2
103.
05.
27.
62.
94.
67.
23.
64.
66.
03.
14.
66.
67.
410
.115
.1
113.
56.
29.
03.
35.
48.
64.
15.
37.
03.
65.
57.
69.
012
.118
.212
4.0
7.2
10.5
3.6
6.2
10.2
4.7
6.1
8.0
4.2
6.5
8.8
10.7
14.4
21.7
134.
68.
312
.14.
07.
211
.95.
26.
99.
14.
77.
69.
912
.616
.925
.514
5.2
9.4
13.9
4.4
8.1
13.7
5.8
7.8
10.2
5.3
8.7
11.2
14.6
19.5
29.6
155.
910
.615
.64.
79.
115
.66.
58.
711
.36.
09.
912
.416
.722
.433
.9
166.
511
.917
.55.
110
.217
.77.
19.
612
.56.
611
.113
.819
.025
.538
.617
7.2
13.2
19.4
5.5
11.3
19.9
7.8
10.5
13.7
7.3
12.4
15.1
21.5
28.7
43.6
188.
014
.621
.55.
812
.422
.28.
411
.515
.08.
013
.816
.624
.132
.148
.919
8.7
16.1
23.7
6.2
13.6
24.6
9.1
12.5
16.3
8.7
15.3
18.0
26.9
35.5
54.5
209.
517
.626
.06.
614
.827
.29.
813
.617
.69.
516
.819
.629
.839
.560
.4