Embed Size (px)
Citation preview

Pineapple Vinegar to Enhance Shelf Life of Carrot and Mango in Tanzania
Aldegunda Sylvester Matunda
Thesis submitted to the faculty of the Virginia Polytechnic Institute and State University in partial fulfillment of the requirements for the degree of
Master of Science in Life Science In Food Science and Technology
Sean F. O'Keefe Co-Chair Kumar Mallikarjunan Co-Chair
Susan Duncan Amanda Stewart Richard Mongi
6/04/2015 Blacksburg, VA
Keywords: Pineapple, mango, carrot, vinegar, sensory evaluation, consumer
acceptability, Vitamin A, Vitamin C:
Pineapple Vinegar to Enhance Shelf Life of Carrot and Mango in Tanzania
Aldegunda Sylvester Matunda
ABSTRACT
Fruits and vegetables are highly perishable, produced seasonally, and large
quantities (about 50-60% of production) are wasted during high season due to poor
handling and lack of cold storage in Tanzania. Processing excess pineapple into vinegar
which can be used for preservation of other fruits and vegetables may be a helpful
strategy for reducing losses. Vinegar was produced from pineapple juice supplemented
with sugar to produce different degrees of Brix (13, 20 and 30) and was fermented with
Saccharomyces cereviciae, Acetobacter pasteurianus, and Gluconobacter oxydans.
Levels of acetic acid were measured in the vinegar produced. High production (5.8%) of
acetic acid was observed with pineapple juice concentrated to 130 Brix with the
combination of Saccharomyces cerevisiae, A. pasteurianus and G. oxydans.
The pineapple vinegar produced was used for preservation of carrot and mango.
The pH of carrot pickle and mango chutney was monitored for three months. The pH of
preserved carrot and mango was below 4 and no significant changes in pH were observed
during three months storage at 29-320C. Chemical analysis of vitamin A and vitamin C
showed high losses of Vitamin A in carrot and increased vitamin A in mango, but losses
of about 74% and 85% of vitamin C were observed in carrot and mango after processing.
Consumer sensory testing of pineapple vinegar, carrot pickle and mango chutney
showed no significance different on overall consumer acceptability of products during
storage. Pineapple vinegar can be used to rescue mango and carrots that would otherwise
be lost, producing highly acceptable food products in Tanzania.

iii
Acknowledgement
I sincerely appreciate USAID for sponsoring my study, iAGRI stuff in Tanzania
for their assistance, and Sokoine University for allowing me to use their lab facilities.
Stewart Mwanyika, lab technician in the food science lab at Sokoine University,
supported me greatly during lab work in Tanzania.
My committee members, Dr. Richard Mongi, Dr Suzan Duncan, Dr. Amanda
Stewart, Dr. Kumar Malkarjunan, are thanked for their advice and contributions to my
study; it was great to have each of them on my committee.
My thanks to Ken and Kim for their assistance in lab work at Virginia Tech; it
was very helpful and grateful to work under your assistance.
Special appreciation to my advisor Dr. Sean O’Keefe for being my advisor; I am
very grateful to work with him when I was in US and even when I was outside US he
continued to provide the same assistance and support.
My special gratitude goes out to my husband, my son and my family for their
encouragement and love during my study, especial when I was away from my country; it
was nice to have them on my side.
My friends and everyone who helped me during my study, it was nice to have all
of you on my side.

iv
Dedication
I dedicate this work to my beloved son, Carrington Victor, for his patience and
tolerance of my absence, which made it hard to concentrate on my studies. His love was
my strength in whatever I did. My husband, with his love and support during my studies,
made me feel strong in my work. My mother (Mary Matunda) for her prayers during my
studies, my sisters (Avelina Matunda and Marytreza) for their love and encouragement
during my studies, my mother (Agnes Muhabuki) for taking care of my son during my
studies, keeping my son healthy and safe was encouraging me and strengthened me
during my studies.
v
Abbreviations
FAO - Food Association Organization
MAFC - Ministry of Agriculture, Food Cooperatives.
Ho - Null hypothesis
Ha - Alternative hypothesis
pH- negative log of hydrogen ion concentration
WHO – World Health Organization
ATCC – American Type Culture Collection
USA – United State of America
SUA – Sokoine University of Agriculture
GAP – Good Agricultural Practices
GMP – Good Management Practices
GHP – Good Hygiene Practices
TSS – Total Soluble Solid
IRB – Institutional Review Board
NIMR – National Institute for Medical Research
THSD – Tukey’s Honest Significant Difference
AAB – Acetic Acid Bacteria
s.d – standard deviation
CV – Commercial Vinegar
A.p - Acetobacter pasteurianus bacteria
O – Gluconobacter oxydans bacteria
P13 – Pineapple juice concentrated to 13 degree Brix

vi
P20 – Pineapple juice concentrated to 20 degree Brix
P30 – Pineapple juice concentrated to 30 degree Brix
vii
Table of Contents
Acknowledgement ............................................................. Error! Bookmark not defined.
Dedication .......................................................................................................................... iv
Abbreviations ...................................................................................................................... v
List of figures ..................................................................................................................... xi
List of tables ...................................................................................................................... xii
Chapter 1 ............................................................................................................................. 1
1.0 Introduction ................................................................................................................... 1
1.1 Background information ............................................................................................... 1
1.2 Problem statement ......................................................................................................... 2
1.3 Objective of the study ................................................................................................... 3
1.3.1. Specific objectives and hypotheses: .......................................................................... 3
Chapter 2 ............................................................................................................................. 5
2.0 Literature Review.......................................................................................................... 5
2.1. Introduction .................................................................................................................. 5
2.2 Fruits ............................................................................................................................. 6
2.2.1 Pineapple .................................................................................................................... 6
2.2.2 Mango ........................................................................................................................ 6
2.2.3 Carrot ......................................................................................................................... 6
2.3 Post-harvest losses of fruits and vegetables in Tanzania .............................................. 7
2.4 Vinegar .......................................................................................................................... 8
Chapter 3 ........................................................................................................................... 10
viii
3.0 Material and Methods ................................................................................................. 10
3.1. Study area................................................................................................................... 10
3.2 Raw materials. ............................................................................................................. 10
3.3 Vinegar Processing ..................................................................................................... 10
3.4 Preserving carrot and mango with vinegar ................................................................. 13
3.5 Chemical analysis ....................................................................................................... 17
3.5.1 Measurement of total soluble solids ........................................................................ 17
3.5.2 Measurement of pH .................................................................................................. 17
3.5.5 Consumer sensory evaluation of pineapple vinegar ................................................ 18
3.5.6 Statistical data analysis ............................................................................................ 20
Chapter 4 ........................................................................................................................... 21
4.0 Results ......................................................................................................................... 21
4.1 Chemical analyses ....................................................................................................... 21
4.1.1 Effect of total soluble solids on level of acetic acid in vinegar produced from
pineapple ........................................................................................................................... 21
4.1.2. Impact of vinegar on vitamin A and C contents of preserved mango and carrot ... 28
4.1.2.1. Vitamin A............................................................................................................. 28
4.1.2.2. Vitamin C ............................................................................................................. 30
4.2 Consumer acceptability of pineapple vinegar, mango and carrot preserved with
pineapple vinegar .............................................................................................................. 31
Chapter 5 ........................................................................................................................... 36
5.0 Discussion ................................................................................................................... 36
Chapter 6 ........................................................................................................................... 44
ix
Conclusions and Recommendations ................................................................................. 44
References ......................................................................................................................... 45
APPENDICES .................................................................................................................. 49
Appendix A: Demographic questionnaire ..................................................................... 49
Appendix B: Score sheet (a) ............................................................................................. 52
Appendix C: Score sheet (b) ............................................................................................. 53
Appendix D: Work sheet (a) ............................................................................................. 54
Appendix E: Work sheet (b) ............................................................................................. 55
Appendix F. Score sheet for consumer sensory test on pineapple vinegar. ..................... 56
Appendix G. Working Sheet on Consumer sensory test on pineapple vinegar. .............. 57
Appendix H. Distribution % of consumer acceptability on pineapple vinegar ............... 58
Appendix I. Distribution % of consumer acceptability on commercial vinegar ............... 59
Appendix J. Distribution % of consumer acceptability of pineapple carrot pickle .......... 60
Appendix K. Distribution % of consumer acceptability on commercial carrot pickle ..... 61
Appendix L. Distribution % of consumer acceptability on pineapple mango chutney .... 62
Appendix M. Distribution % of consumer acceptability on commercial mango chutney 63
Appendix N. Fresh pineapple .......................................................................................... 64
Appendix O. Fresh carrot .................................................................................................. 65
Appendix P. Fresh mango ................................................................................................. 66
Appendix Q. Processing of pineapple to extract juice. ................................................... 67
Appendix R. Alcohol fermentation ................................................................................ 68
Appendix S. Acetic fermentation ..................................................................................... 69
Appendix T. Sample collection ........................................................................................ 70
x
Appendix U. Control vinegar ............................................................................................ 71
Appendix V. Consumer sensory test on pineapple vinegar. .......................................... 72
Appendex W. Preserved carrot ( carrot pickle) ............................................................... 73
Appendix X. Preserved mango (mango chutney). ........................................................... 74
Appendix Y. Consumer sensory test on carrot pickle and mango chutney ..................... 75
xi
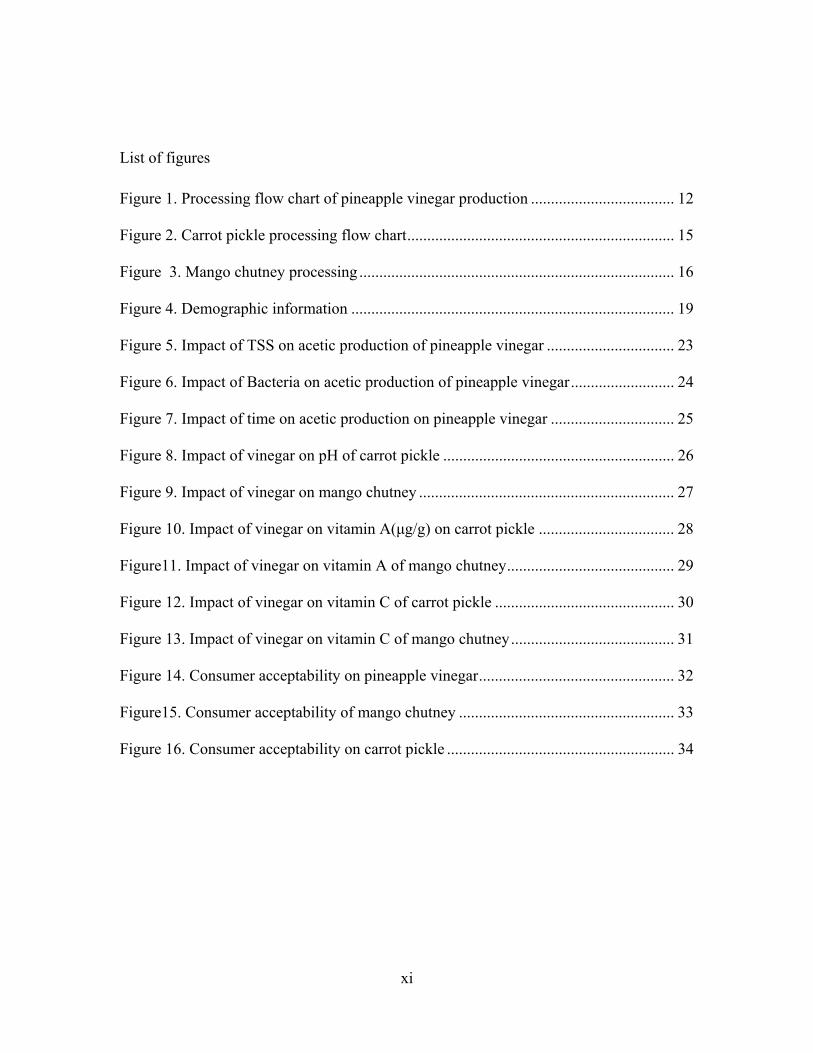
List of figures
Figure 1. Processing flow chart of pineapple vinegar production .................................... 12
Figure 2. Carrot pickle processing flow chart ................................................................... 15
Figure 3. Mango chutney processing ............................................................................... 16
Figure 4. Demographic information ................................................................................. 19
Figure 5. Impact of TSS on acetic production of pineapple vinegar ................................ 23
Figure 6. Impact of Bacteria on acetic production of pineapple vinegar .......................... 24
Figure 7. Impact of time on acetic production on pineapple vinegar ............................... 25
Figure 8. Impact of vinegar on pH of carrot pickle .......................................................... 26
Figure 9. Impact of vinegar on mango chutney ................................................................ 27
Figure 10. Impact of vinegar on vitamin A(μg/g) on carrot pickle .................................. 28
Figure11. Impact of vinegar on vitamin A of mango chutney .......................................... 29
Figure 12. Impact of vinegar on vitamin C of carrot pickle ............................................. 30
Figure 13. Impact of vinegar on vitamin C of mango chutney ......................................... 31
Figure 14. Consumer acceptability on pineapple vinegar ................................................. 32
Figure15. Consumer acceptability of mango chutney ...................................................... 33
Figure 16. Consumer acceptability on carrot pickle ......................................................... 34
xii
List of tables
Table 1 Level of acetic acid produced in four weeks of acetic fermentation. .................. 22
Table 2. Overall mean score of consumer acceptability on pineapple vinegar, mango
chutney and carrot pickle .................................................................................................. 34

1
Chapter 1
1.0 Introduction
1.1 Background information
Agriculture is the backbone of the Tanzanian economy. Around half of the
national income comes from agriculture. Agriculture is mostly used as a source of food
and provides employment opportunities to most Tanzanians. Small-scale farming
dominates in Tanzania, with farmers cultivating an average of 0.5 ha to 3.0 ha. Fruits and
vegetables are among the crops produced in Tanzania for nutritional and economic
purposes to fulfill family needs, such as paying school fees, buying clothes, and food
ingredients. Tanzania is among the countries with favorable conditions for fruits and
vegetables cultivation. For instance, it is the second largest mango producer in east Africa
and is ranked the seventeenth largest producer of mangoes globally, with an annual
production of 300,000 tons (Match Maker Associates 2011)
Fruit and vegetables play a key role in improving both nutrition and economic
well-being of Tanzanians as they provide a wealth of essential nutrients, such as
vitamins, minerals, antioxidants, fiber, and carbohydrates that improve diet quality
(Kader and others 2001). Daily consumption of fruits and vegetables has been strongly
associated with reduced risk of some major chronic, non-communicable diseases such as
cardiovascular, diabetes, hypertension, and certain types of cancer. It has been reported
that up to 2.7 million lives could potentially be saved each year with sufficient intake of
fruits and vegetables (FAO 2003).
2
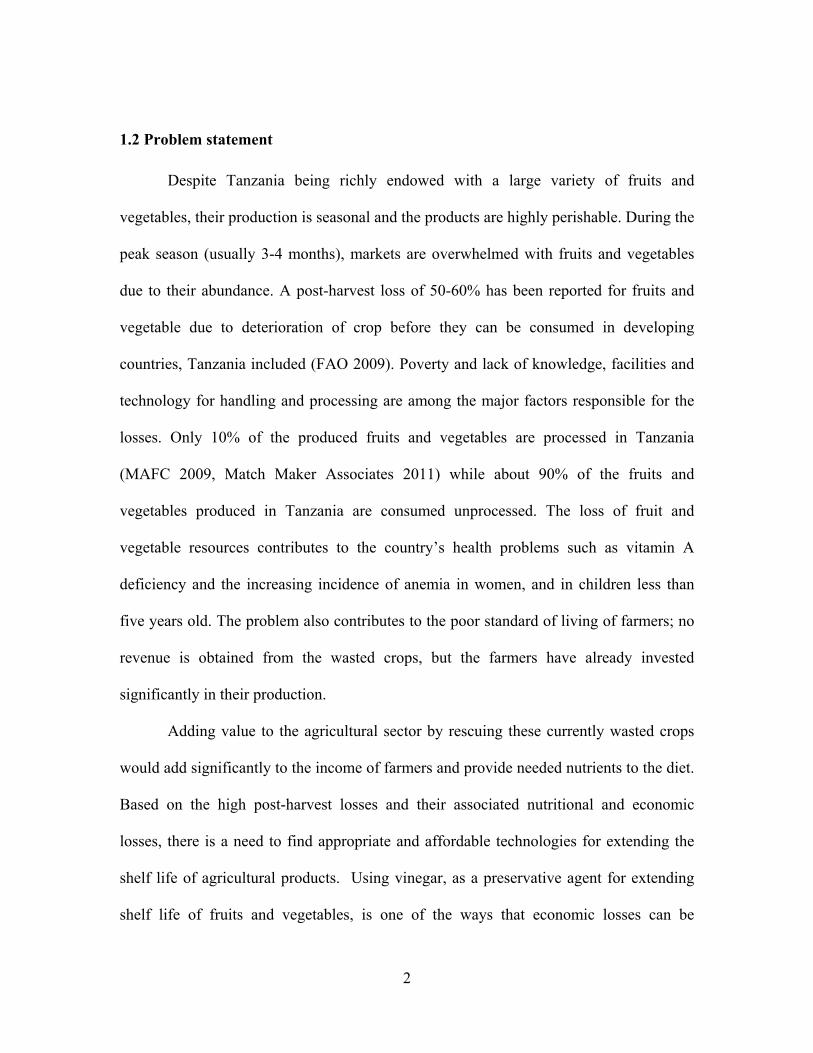
1.2 Problem statement
Despite Tanzania being richly endowed with a large variety of fruits and
vegetables, their production is seasonal and the products are highly perishable. During the
peak season (usually 3-4 months), markets are overwhelmed with fruits and vegetables
due to their abundance. A post-harvest loss of 50-60% has been reported for fruits and
vegetable due to deterioration of crop before they can be consumed in developing
countries, Tanzania included (FAO 2009). Poverty and lack of knowledge, facilities and
technology for handling and processing are among the major factors responsible for the
losses. Only 10% of the produced fruits and vegetables are processed in Tanzania
(MAFC 2009, Match Maker Associates 2011) while about 90% of the fruits and
vegetables produced in Tanzania are consumed unprocessed. The loss of fruit and
vegetable resources contributes to the country’s health problems such as vitamin A
deficiency and the increasing incidence of anemia in women, and in children less than
five years old. The problem also contributes to the poor standard of living of farmers; no
revenue is obtained from the wasted crops, but the farmers have already invested
significantly in their production.
Adding value to the agricultural sector by rescuing these currently wasted crops
would add significantly to the income of farmers and provide needed nutrients to the diet.
Based on the high post-harvest losses and their associated nutritional and economic
losses, there is a need to find appropriate and affordable technologies for extending the
shelf life of agricultural products. Using vinegar, as a preservative agent for extending
shelf life of fruits and vegetables, is one of the ways that economic losses can be
3
decreased. However, most of the vinegar, beverages, and spirits available in Tanzania
are imported, which adds costs and reduces feasibility as preservative agent for resource-
poor farmers. For instance, in 2004, beverages, spirits and vinegar represent the second
largest export from South Africa to Tanzania. Over the period 2003-2004, the imports of
beverages, spirits and vinegar grew by an estimated 54% with wine from fresh grapes and
ethyl alcohol being the most imported products (Ramonyai and Konstant 2006).
Information on the use of fruit vinegar for preservation of fruits and vegetables is limited.
Therefore, this work was conducted to develop and determine the nutritional
value and potential of pineapple vinegar in preservation of carrots and mango in
Tanzania.
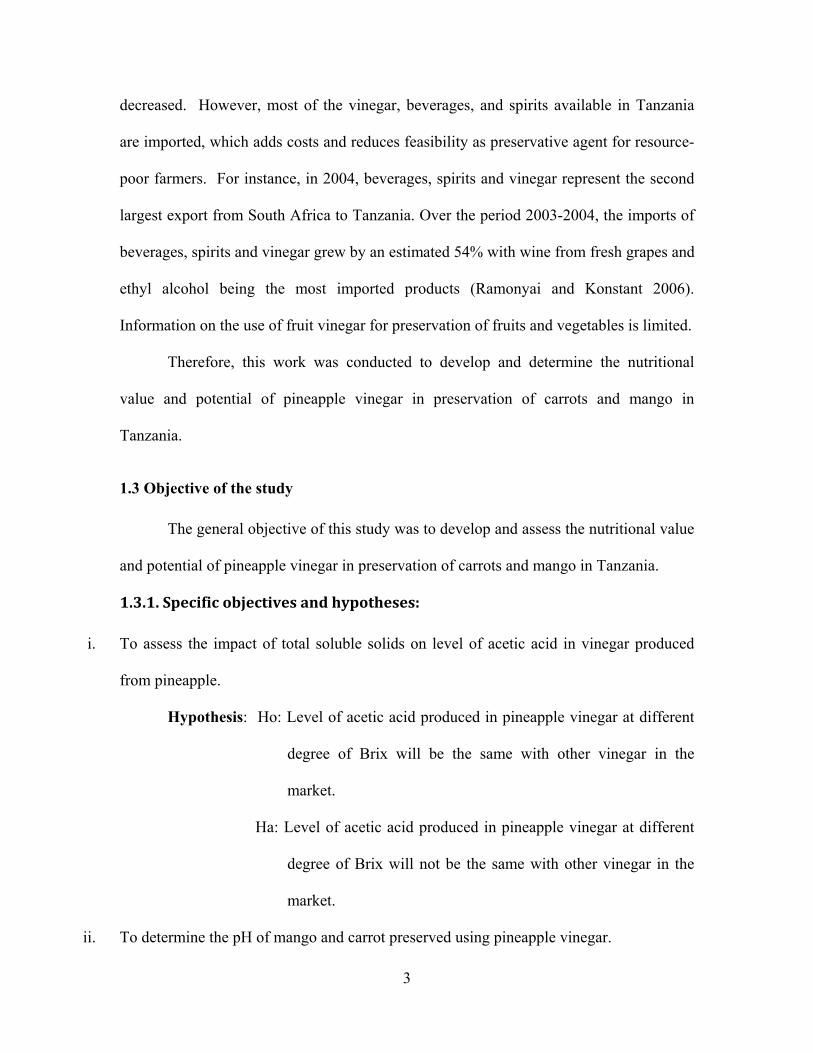
1.3 Objective of the study
The general objective of this study was to develop and assess the nutritional value
and potential of pineapple vinegar in preservation of carrots and mango in Tanzania.
1.3.1.Specificobjectivesandhypotheses:
i. To assess the impact of total soluble solids on level of acetic acid in vinegar produced
from pineapple.
Hypothesis: Ho: Level of acetic acid produced in pineapple vinegar at different
degree of Brix will be the same with other vinegar in the
market.
Ha: Level of acetic acid produced in pineapple vinegar at different
degree of Brix will not be the same with other vinegar in the
market.
ii. To determine the pH of mango and carrot preserved using pineapple vinegar.

4
Hypothesis: Ho: A pH of mango and carrot preserved using pineapple vinegar
will be the same.
Ha: A pH of mango and carrot preserved using pineapple vinegar
will not be the same.
iii. To assess consumer acceptability of mango and carrot preserved with pineapple vinegar
Hypothesis: Ho: Preserved mango and carrot will be accepted by consumer.
Ha: Preserved mango and carrot will not be accepted by consumer.
iv. To determine contents of vitamins (A and C) in preserved mango and carrot.
Hypothesis: Ho: Pineapple vinegar will not affect the vitamin A and C of
preserved mango and carrot.
Ha: Pineapple vinegar will affect the vitamin A and C of preserved
mango and carrot.

5
Chapter2
2.0LiteratureReview
2.1. Introduction
In earlier times, people preserved their foods through fermentation to extend shelf
life of food to make them available even during drought periods (FAO 2012). This
implies that the fermentation is the one of the oldest methods used for food preservation
even at village levels, where the technology is poor. Studies have shown that
fermentation has been used for preserving fruits (including pineapple) and vegetables
worldwide. Reddy and Reddy 2009 examined production of wine from mango and they
found the mango wine had good acceptability, with novel aroma and taste characteristics
compared to grape wine. Akubor 1995, Arumugam and Manikanda 2011 evaluated the
chemical composition of fruit waste, pulp and peel and found that the fruits contains
proteins, lipids, starch, fiber, polyphenols, and they reported that different fruits have
different values of the components. Adesina and others 1992 analyzed the fermentation
of mango juices and found that yeast isolated from the bottom of palm juice is most
efficient for alcohol production. Ameyapoh and others (2010) studied the physiochemical
characteristics of vinegar produced from local mangoes using Sacharomyces cerevesiae.
In a model system of 20 ml of mango juice, 20 °Brix sugar and 106 yeast cells, they
found that 22.4g L-1 of ethanol could be produced in 3 days, and 93% of this ethanol was
then transformed into acetic acid in 12 days.
6
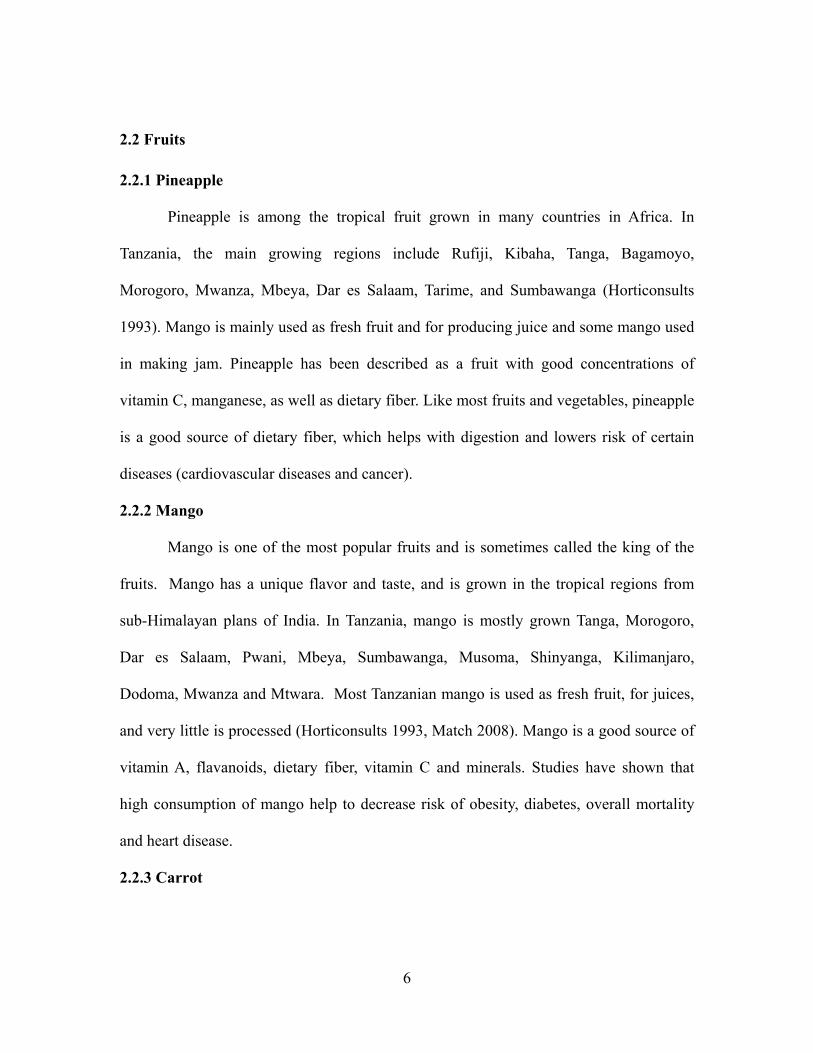
2.2 Fruits
2.2.1 Pineapple
Pineapple is among the tropical fruit grown in many countries in Africa. In
Tanzania, the main growing regions include Rufiji, Kibaha, Tanga, Bagamoyo,
Morogoro, Mwanza, Mbeya, Dar es Salaam, Tarime, and Sumbawanga (Horticonsults
1993). Mango is mainly used as fresh fruit and for producing juice and some mango used
in making jam. Pineapple has been described as a fruit with good concentrations of
vitamin C, manganese, as well as dietary fiber. Like most fruits and vegetables, pineapple
is a good source of dietary fiber, which helps with digestion and lowers risk of certain
diseases (cardiovascular diseases and cancer).
2.2.2 Mango
Mango is one of the most popular fruits and is sometimes called the king of the
fruits. Mango has a unique flavor and taste, and is grown in the tropical regions from
sub-Himalayan plans of India. In Tanzania, mango is mostly grown Tanga, Morogoro,
Dar es Salaam, Pwani, Mbeya, Sumbawanga, Musoma, Shinyanga, Kilimanjaro,
Dodoma, Mwanza and Mtwara. Most Tanzanian mango is used as fresh fruit, for juices,
and very little is processed (Horticonsults 1993, Match 2008). Mango is a good source of
vitamin A, flavanoids, dietary fiber, vitamin C and minerals. Studies have shown that
high consumption of mango help to decrease risk of obesity, diabetes, overall mortality
and heart disease.
2.2.3 Carrot
7
Carrot is among the vegetables where the taproot is the edible part of the plant.
Carrot originated in Afghanistan, and was known by Greeks and Romans. Early uses
were mainly medicinal, to cure stomach problems. Carrot was produced as a food crop in
India, China and Japan by the 13th century. Now carrot is one of the most popular
vegetables grown around the world. In Tanzania, main regions producing carrot include
Oldonyo Sambu in the Arumeru District, Moshi Rural, West Kilimanjaro, Lushoto,
Morogoro, Iringa and Mbeya (Horticonsults 1993). Carrot is mainly used as ingredient in
cooking, although a little is used for juice. Carrot is highly regarded for beta-carotene and
fiber contents, and is also a good source of antioxidants. Much research has discussed
the health benefits of carrot, including reducing cholesterol, prevention of heart attacks,
improving vision, health skin, improved digestion and boosted immune system.
2.3Post‐harvestlossesoffruitsandvegetablesinTanzania
A post-harvest loss of 50-60% has been reported for fruits and vegetable due to
deterioration of crop before they can be consumed in developing countries, Tanzania
included (FAO 2009). Poverty and lack of knowledge, facilities and technology for
handling, storage and processing are among the major factors responsible for the losses.
Only 10% of the produced fruits and vegetables are being processed in Tanzania (MAFC
2009, Match Maker Associates 2011) while about 90% of the fruits and vegetables
produced in Tanzania are consumed unprocessed. Education on post harvest handling,
value addition on fruits and vegetables could be the solution to minimize these losses.
8
2.4Vinegar
Vinegar is produced in two successive biochemical processes, the first step is the
primary fermentation of sugar into ethanol and the second step is the fermentation of
ethanol to acetic acid. Vinegar has unique properties of being an aqueous clear liquid,
which can either be with or without color depending on the raw materials used. Prescott
and Dunn 1949 report that vinegar has a pH range 2-3.5 and acetic acid range of 4-6%.
Fermentation to produce vinegar is an oxidative process in which acetobacter or other
bacteria oxidize a diluted solution of ethanol to acetic acid in the presence of oxygen.
CH3CH2OH → CH3CHO + 2H → CH3COOH + 2H
Kocher and others (2012), Webb (2007), Sugiyam and others (2003) and Kond
and others (2001) reported that vinegar is a good food supplement because it improves
digestion, adds flavor, and it reduces total plasma cholesterol and risk of cardiovascular
disease. In developing countries where food processing technology and preservation are
limited, vinegar can be used as an important ingredient for preserving fresh vegetables
and fruits, enhancing shelf life. Vinegar preserves fruits and vegetable by lowering the pH
of food, in other words, the food conditions becomes undesirable for harmful
microorganisms to grow, hence the shelf life of food is increased (Marshall and Mejia
2011). In some countries such as Japan, USA and Canada, vinegar has been used mixed
with fruit juice in treating a long list of disease (Lisa 2009). The Tanzania Ministry of
Agriculture emphasized food preservation with vinegar as a value-added process for food

9
crops. As an immediate action for implementation, short-term training of farmers and
extension workers was necessary (WHO/FAO, 2003).
10
Chapter 3
3.0 Material and Methods
3.1. Study area
This study was conducted at the Department of Food Science and Technology laboratory
in Morogoro, Tanzania.
3.2 Raw materials.
Pineapples were purchased from a local market in Mwanza Municipality,
Tanzania. Yeast (Saccharomyces cerevisiae ), and bacteria (Gluconobacter oxydans and
Acetobacter pasteurianus) were purchased from ATCC (Manassas, VA). Sugar and
other ingredients were purchased in local markets in Morogoro Tanzania. Chemicals and
reagents for chemical and microbiological analyses were obtained from the Department
of Food Science Laboratory, SUA. Carrot and mango used in the tests of the produced
vinegar were bought from local markets in Morogoro, Tanzania.
3.3 Vinegar Processing
Basic safe food operating principles, such as good agricultural practices (GAP),
good manufacturing practices (GMP) and good hygiene practices (GHP) were followed
for the processing of pineapple to vinegar. Fermentation of pineapples to wine was
conducted following the same steps of wine making as described by Ameyapoh 2010. In
addition, the pineapple was further fermented by Gluconobacter oxydans and
Acetobacter pasteurianus to produce acetic acid from the ethanol. Processing of vinegar
was conducted at Food Science laboratory, Sokoine University of Agriculture (SUA).
11
Three samples of vinegars were processed from pineapple juice of 130, 200 and 300 Brix
replicated three times at the environmental temperature of 220C.
The pineapples were drained followed by hand peeling using a knife, then
chopping into small pieces and blended to extract juice. Total soluble solid of juice was
measured using refractometer followed by dilution of 1:1 ratio of water and juice. Juice
at 130, 200 and 300 Brix were made by adding brown sugar. Fermentation of pineapples to
wine was conducted following the same steps of wine making as described by Ameyapoh
2010.
In addition, the pineapple was further fermented by Gluconobacter oxydans and
Acetobacter pasteurianus to produce acetic acid from the ethanol. Three samples of
vinegars was processed from pineapple juice of 130, 200 and 300 Brix replicated three
times at the environmental temperature of 220C. Alcohol fermentation was conducted for
four weeks until the fermentation was done then followed by acetic acid fermentation at
room temperature of 290C for four weeks (Figure 1).
12
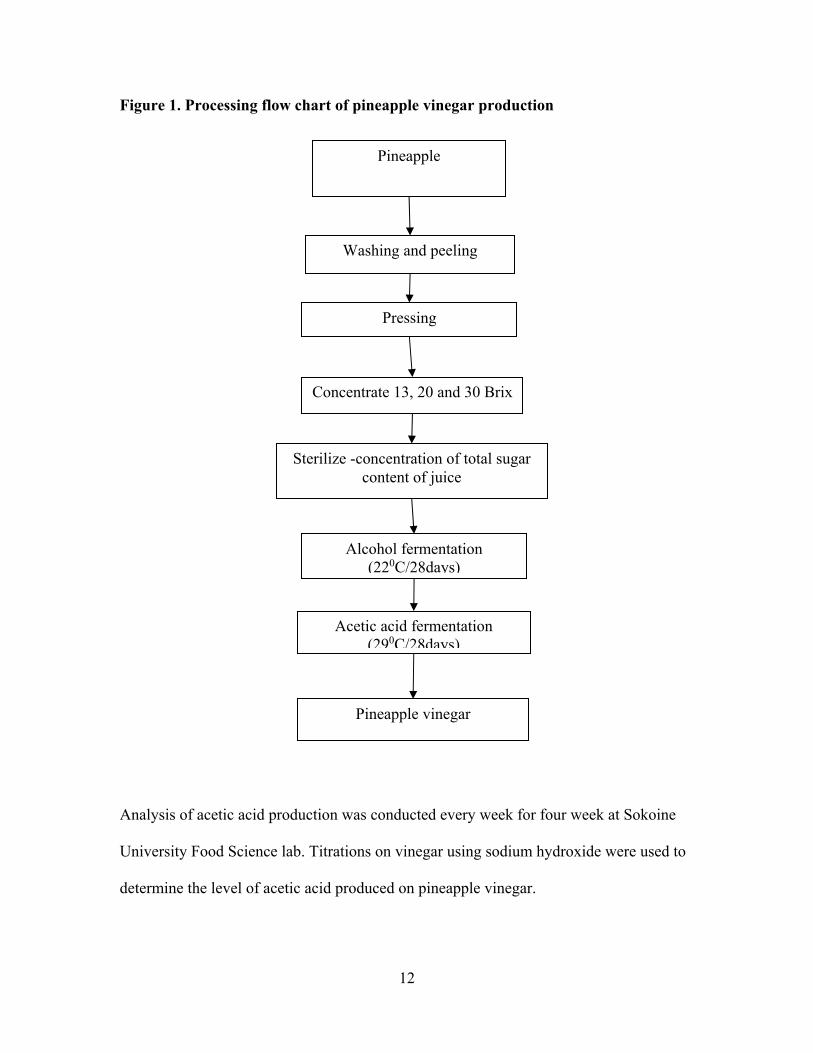
Figure 1. Processing flow chart of pineapple vinegar production
Analysis of acetic acid production was conducted every week for four week at Sokoine
University Food Science lab. Titrations on vinegar using sodium hydroxide were used to
determine the level of acetic acid produced on pineapple vinegar.
Pineapple
Washing and peeling
Pressing
Concentrate 13, 20 and 30 Brix
Sterilize -concentration of total sugar content of juice
Alcohol fermentation (220C/28days)
Acetic acid fermentation (290C/28days)
Pineapple vinegar
13
3.4 Preserving carrot and mango with vinegar
Both pineapple vinegar and commercial vinegar were used for increasing shelf
life of processed carrot and mango. Carrot pickle was made using 2.75lb fresh carrot, 2
lb vinegar, 0.36 lb water, 0.72 lb sugar, 8 tsp mustard seed and 4 tsp celery seeds as
ingredients. Carrot selection was done followed by washing using treated water, peeling
and chopping into rounds that were approximately 0.5inch thick. Combination of water,
vinegar, sugar and canning salt was done in a stock pot. The ingredients were brought to
boil, and boiled for three minutes followed by addition of carrots to boiling solution,
which was then simmered on reduced heat for about 10 minutes until half cooked.
Mustard seed and celery was added into clean jars followed with hot carrots. Air bubbles
were removed and jars pasteurized for 20 minutes. Carrot pickle was stored for three
months. Basic food operating principles such good manufacturing practices (GMP) and
good hygiene practices (GHP) were followed in each step, where pineapple vinegar of
5% level of acetic acid was used. Both carrot pickle and mango chutney were processed
using commercial vinegar and pineapple vinegar. The processing flowcharts are shown in
Figure 2 modified from Hearthmark 2010.
Mango chutney was made from fresh mango including 0.9 lb onions, 2.5 tbsp
ginger, 1.5 tbsp fresh garlic, 1.62 lb sugar, 0.9 lb golden raisins, 1 tsp canning salt, 4 tsp
chili powder and 1.08 lb vinegar. Unripe mango was selected, washed using treated
water, peeling and chopped into 0.75inch cubes and cubes chopped into small pieces,
onions were peeled, diced, garlic was chopped, ginger was grated. Sugar and vinegar
were mixed in a stock pot brought to boil for 5 minutes, followed with addition of other
ingredients then brought back to boil. It was simmered on reduced heat for 25 minutes.

14
Hot chutney was filled in jars then pasteurized in a water bath for 15 minutes stored for
three months. Basic food principles such good manufacturing practices (GMP) and good
hygiene practices (GHP) were followed in each step (Figure 3). Mango chutney was
processed using pineapple vinegar and commercial vinegar as it was modified from
Hearthmark 2010.
15
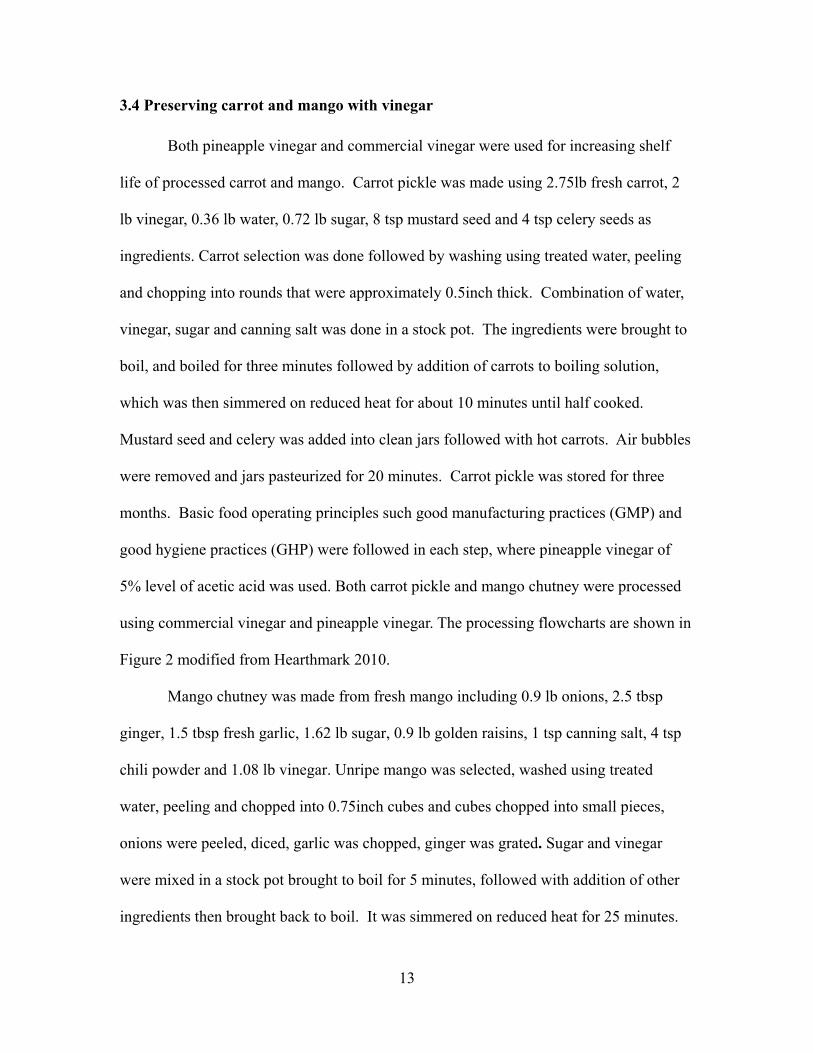
Figure 2. Carrot pickle processing
Carrot selection
Washing and peeling
Cut into 1/2” thick & weigh
Vinegar H2O Salt Sugar
Combined in a stockpot boil and boil 3 minute
Add carrot and bring back to boil for 10 minute
Fill the jar with hot carrot
Remove air and pressure canning for 10 to 25 minute depend on elevation
Figure 2. Carrot pickle processing flow chart
16
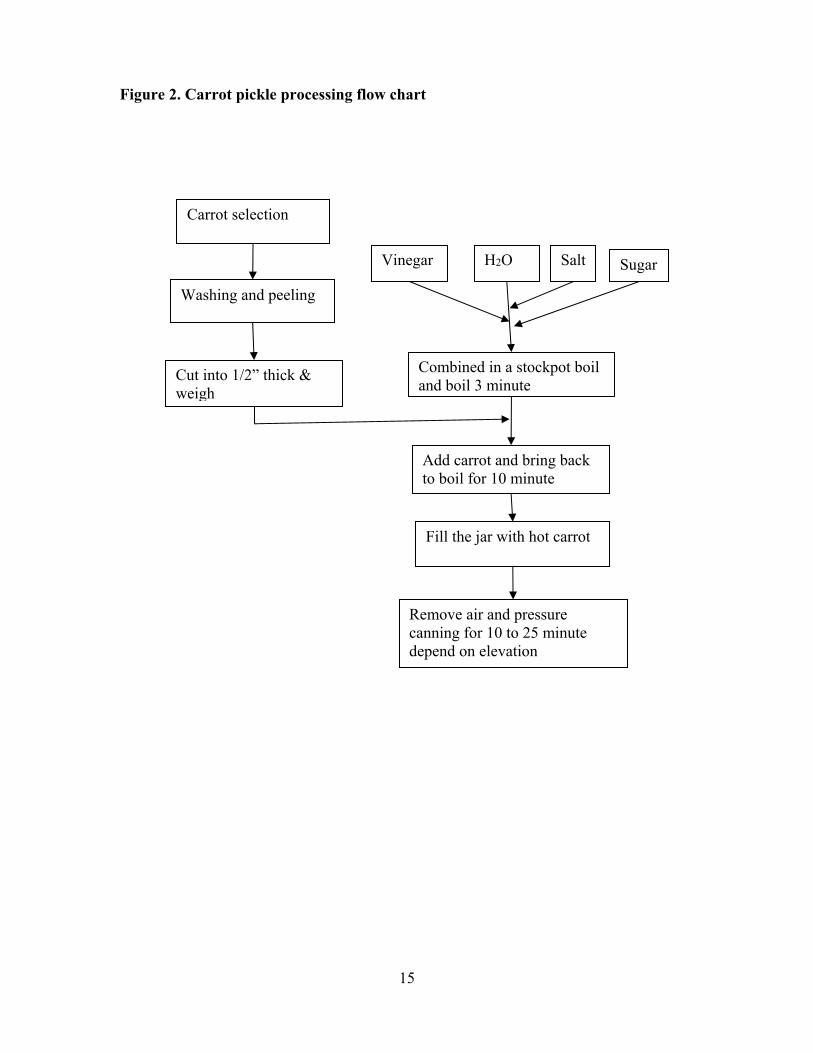
Figure 3. Mango chutney processing
After processing, both carrot pickle and mango chutney were stored at room
temperature of 29-32 0C for three months.
Mango selection
Washing and peeling
Chopping of mango
Weigh of all ingredients
Mix of all ingredients
Boil for 30 minutes
Filling of Jar
Pasteurization
17
3.5 Chemical analysis
3.5.1 Measurement of total soluble solids
Small samples of pineapple juice before fermentation was evaluated for total
soluble solids content (TSS). Determination of total soluble solids (TSS) was done using
refractometer ( Ontago, China), measuring TSS as degree Brix in 0.1% graduations.
Three samples of pineapple juice were collected, drops of distilled water were used to
clean the prism surface, and a drop of juice was placed on the prism surface, lid closed to
get proper reading. The prism plate was wiped dry with a soft tissue and distilled water
after every sample.
This was followed by measurement of pH, beta-carotene and vitamin C of preserved
fruits and vegetables.
3.5.2 Measurement of pH
pH of carrot pickle and mango chutney was measured using a pH meter. The pH
meter was calibrated using buffer solutions, samples were collected, and electrode was
placed into food samples and cleaned after each sample, pH was taken for the period of
three month.
3.5.3 Determination of beta carotene
Carrot pickle and mango chutney were collected and separately extracted using
acetone. After extraction, samples were filtered, stored at low temperature, and
absorbance measured using a spectrophotometer immediately after cooling.
3.5.4 Determination of vitamin C

18
Vitamin C of carrot pickle and mango chutney was evaluated using the
chloroindolphenol titration method. Carrot pickle and mango chutney samples were
separately blended (replicated three times). Each sample was placed into 10ml graduated
cylinders followed by titration with shaking until reaching the end point. Reading was
recorded for calculation of vitamin C contents; the titration was repeated thrice for each
sample.
3.5.5 Consumer sensory evaluation of pineapple vinegar
A consumer study to determine the overall acceptability of pineapple vinegar,
carrot pickle and mango chutney was conducted at the Department of Food Science lab
using 69 panelists selected from population of student aged 18 years old and above who
were willing to participate consumers. Prior to that, a letter of approval was obtained
from (IRB no 14-894) Virginia Tech and National Institute for Medical Research
(NIMR). Each panelist was provided with a consent form to read thoroughly and sign
before sample presentation. Consumer sensory evaluation was conducted to determine
overall consumer acceptability of pineapple vinegar, carrot pickle and mango chutney,
Samples of vinegar were prepared 12 hrs before the sensory test; 5mls of vinegar was
diluted in 1 litre of safe water stored at 40C and served cold. Twenty ml of each sample
was served in small containers coded by three random digits. Each panelist was provided
with four samples (pineapple vinegar, commercial vinegar, combination of pineapple and
commercial vinegar and water) in one set, was asked to taste the sample of pineapple
vinegar to evaluate overall acceptability using hedonic scale (1 dislike most and 9 most
liked, Meilgaard 2007). Between samples, each panelist was asked to rinse their palate
19
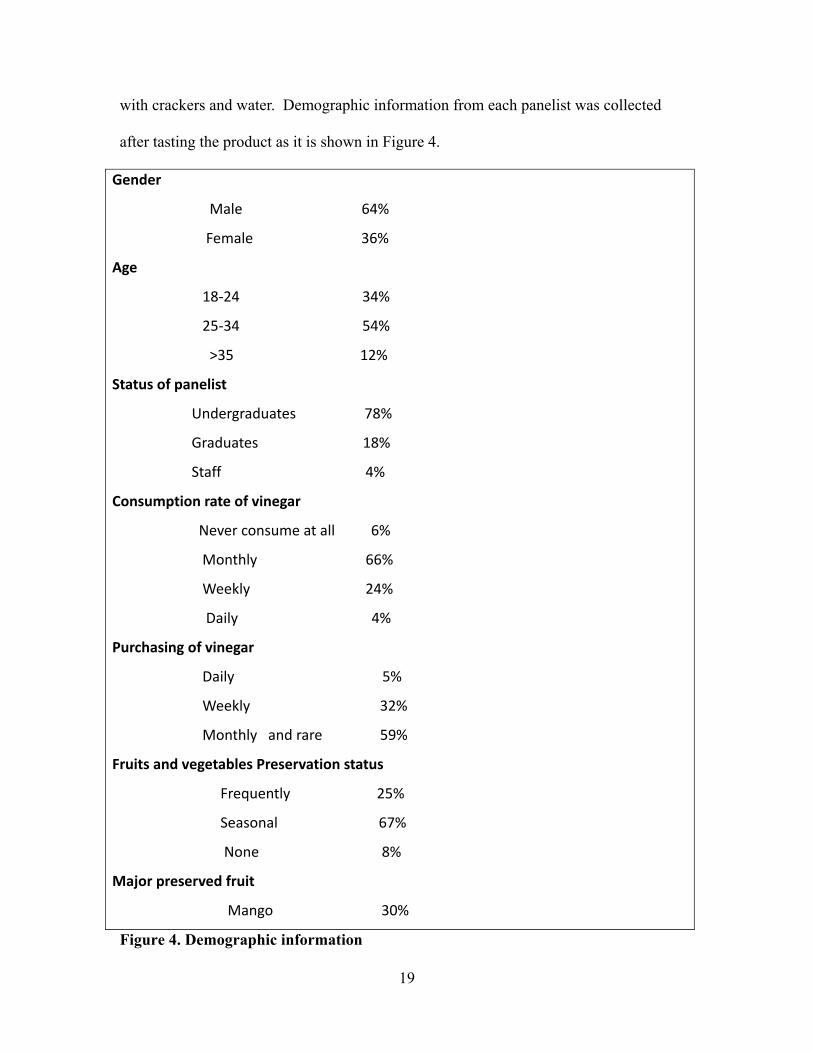
with crackers and water. Demographic information from each panelist was collected
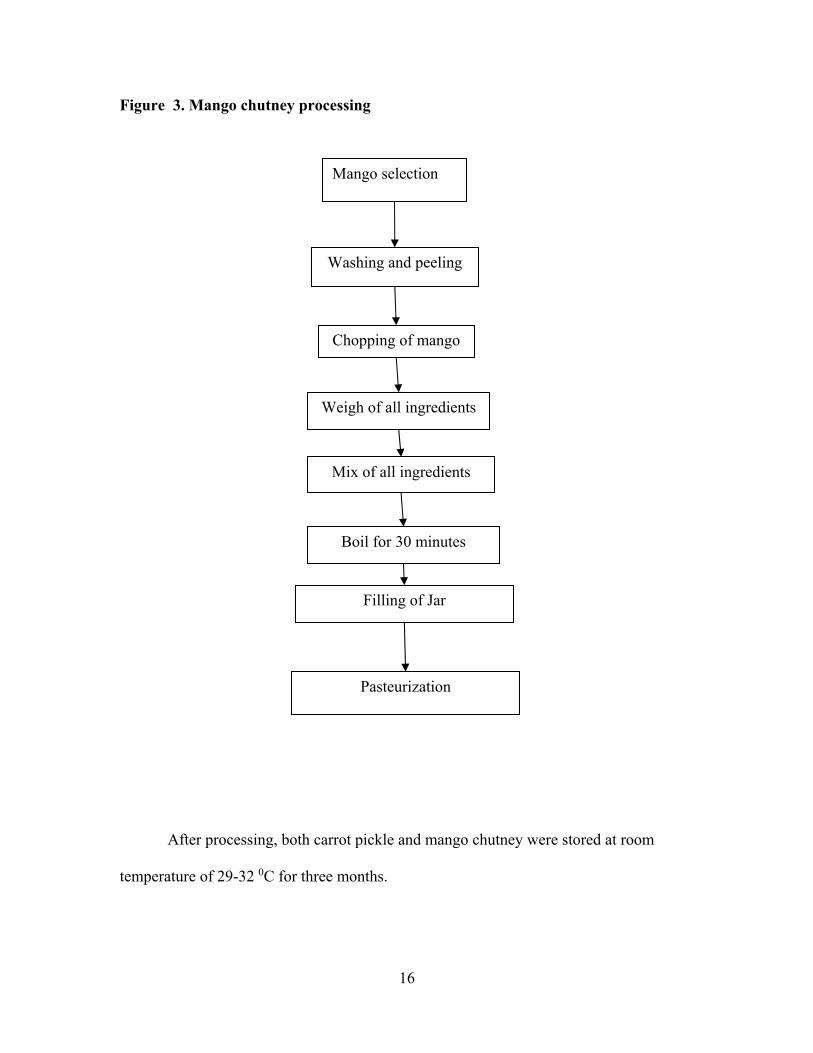
after tasting the product as it is shown in Figure 4.
Gender
Male 64%
Female 36%
Age
18‐24 34%
25‐34 54%
>35 12%
Status of panelist
Undergraduates 78%
Graduates 18%
Staff 4%
Consumption rate of vinegar
Never consume at all 6%
Monthly 66%
Weekly 24%
Daily 4%
Purchasing of vinegar
Daily 5%
Weekly 32%
Monthly and rare 59%
Fruits and vegetables Preservation status
Frequently 25%
Seasonal 67%
None 8%
Major preserved fruit
Mango 30%
Figure 4. Demographic information

20
Mango chutney and carrot pickle were processed from fresh mango and carrots 12
hrs before the sensory test. Samples were packed and stored at 4 0C and were served cold.
Sample of 20 g was presented to panelists in small containers coded with three random
digit numbers and each panelist was asked to test the sample and rate the degree of liking
using nine point hedonic scale (1 dislike most and 9 most liked as described by Meilgaard
2007). Crackers and water were provided to rinse their mouth between the tests to avoid
carry over taste.
3.5.6Statisticaldataanalysis
Data were analyzed using JMP Software to determine significant differences
between the main parameters. Means were separated by Tukey’s Honest Significant
difference (THSD) at p<0.05. Values were presented as mean ± SD and presented in
tabular and graphical forms.
21
Chapter 4
4.0 Results
4.1 Chemical analyses
4.1.1 Effect of total soluble solids on level of acetic acid in vinegar produced from
pineapple
Production of acetic acid in pineapple vinegar was influenced by degree of Brix
of the pineapple juice and combination of bacteria used during the oxidation reaction
(Table 1). The lower brix of 13 resulted in greater production of acetic acid in the
presence of Acetobacter pasterianus and the combination of Gluconobacter oxydans and
Acetobacter pasteurianus. Acetic acid production increased from day 1 to day 28 of
acetic fermentation for samples fermented with Acetobacter pasterianus and the
combination of Gluconobacter oxydans and Acetobacter pasteurianus. Only a small
amount of acetic acid was observed in the rest of the samples. Production of acetic acid
after one week of acetic acid fermentation showed significant differences between
pineapple vinegar and commercial vinegar (p = 0.0001). Significant increased production
of acetic acid was observed from two to four weeks of acetic acid fermentation (Tables
1), the highest level of acetic acid was mostly observed on the vinegar from 130 Brix
juice fermented with Acetobacter pasterianus or the combination of Gluconobacter
oxydans and Acetobacter pasteurianus (Tables 1). Significant differences in production of
acetic acid between pineapple vinegars fermented with different Brix juice were
observed. Production of acetic acid after one week of acetic acid fermentation was low,
and there was little variation between samples of pineapple vinegar (Table 1). Increasing

22
acetic acid production was observed in pineapple vinegar samples with total soluble solid
of 13 0 Brix compared to other total soluble solids which did not have big impacts on
acetic acid production (Tables 1). In assessing the impact of bacteria, TSS, time and
interaction of these three factors on production of acetic acid in pineapple vinegar, results
show that interaction of TSS*time and the interaction of TSS*bacteria significantly
influence production of acetic acid in pineapple vinegar (p<0.0001).
Table 1 Level of acetic acid produced in four weeks of acetic fermentation.
Sample 1st Week 2nd Week 3rd Week 4th Week
CV2 4.92 + 0.08 a 4.92 + 0.08a 4.92 + 0.08ab 4.92 + 0.08bc
CV3 4.76 + 0.09 a 4.76 + 0.09a 4.76 + 0.09ab 4.76 + 0.09c
CV1 4.58 + 0.21 a 4.58 + 0.21a 4.58 + 0.21ab 4.58 + 0.21c
P13+A.p 0.42 + 0.05 b 1.40 + 0.37c 3.02 + 1.05bc 5.273 + 0.34b
P13 + O 0.33 + 0.01bc 0.32 + 0.02d 0.68 + 0.25d 1.12 + 0.16d
P13 + O + A.p 0.37 + 0.00 bc 2.39 + 0.66b 5.51 + 1.33a 5.89 + 0.16a
P20 + A.p 0.31 + 0.02bc 0.74 + 0.25cd 1.21 + 1.48cd 0.27 + 0.07e
P20 + O 0.29 + 0.01c 0.63 + 0.014d 0.30 + 0.00d 0.28 +0.007e
P20 + O + A.p 0.34 + 0.04bc 0.26 + 0.014d 0.30 + 0.014d 0.31 + 0.02e
P30 + A.p 0.41 + 0.06 bc 0.92 + 0.012cd 0.41+0.12d 0.35 +0.03e
P30 + O 0.38 + 0.00bc 0.40 + 0.014d 0.38 + 0.012d 0.40 + 0.03e
P30 + O + A.p 0.38 + 0.00 bc 0.36 + 0.018d 0.39 + 0.007d 0.33+0.08e
Mean values with different superscript values along the column are significantly different
at p<0.05 (CV= Commercial vinegar, P13= pineapple juice concentrated 13 Brix, P20=
pineapple juice concentrated 20 Brix, P30 = pineapple juice concentrated 30 Brix, A.p =
Acetobacter pasteurianus bacteria, O = Gluconobacter oxydan bacteria)
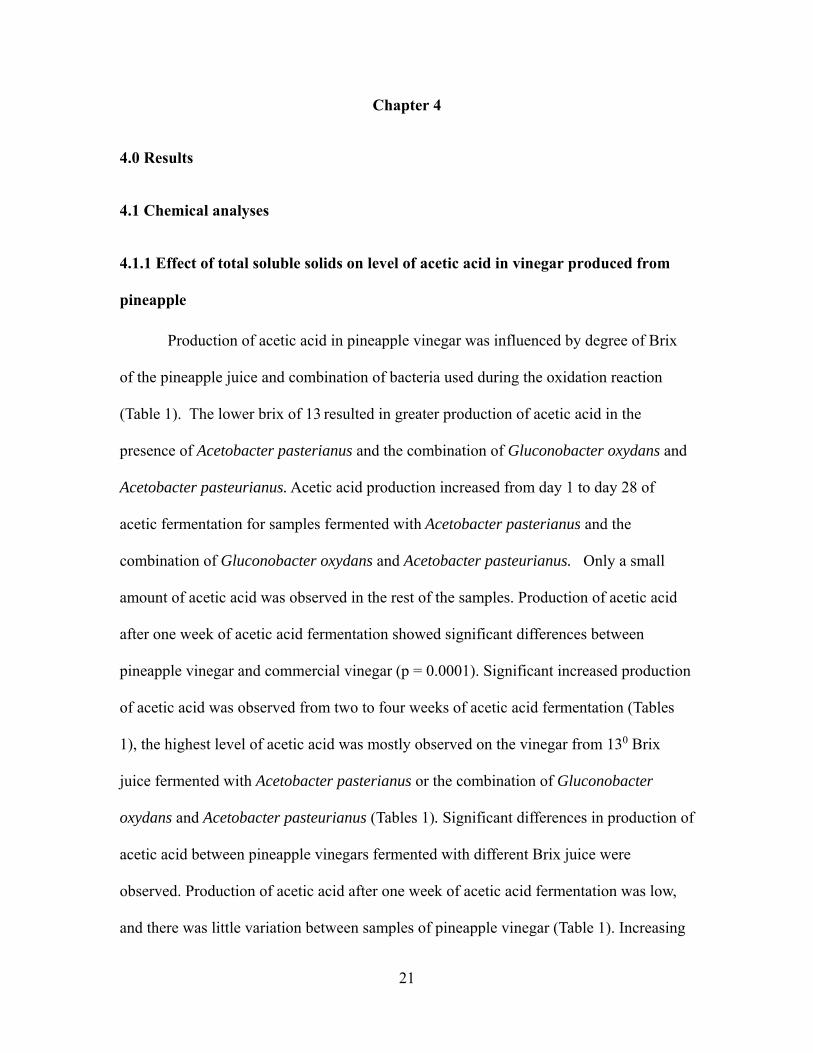
23
Figure 5. Impact of TSS on acetic production of pineapple vinegar Figure 5 shows overall impact of total soluble solid (TSS) on the acetic acid production
of pineapple vinegar, where by high production of acetic acid observed on pineapple
juice concentrated to 13 degree Brix, lowest production of acetic acid observed on
pineapple juice concentrated to 20 and 30 degree Brix. This result shows that there is
significant different on production of acetic acid between different TSS.

24
Figure 6. Impact of Bacteria on acetic production of pineapple vinegar
(Where by A.p= Acetobacter pasteurianus, O= Gluconobacter oxydans)
Figure 6 shows the impact of acetobacter bacteria on production of acetic acid on
pineapple vinegar, result shows that there is significant different on production of acetic
acid of pineapple vinegar between Acetobacter pasteurianus and Gluconobacter oxydans
bacteria. High acetic production observed on combination of Acetobacter pasteurianus
and Gluconobacter oxydans followed with Acetobacter pasteurianus, lowest acetic
production observed on Gluconobacter oxydans.
Mean(Acetic acid(g/l))
BacteriaA.p A.p+O O
Ace
tic a
cid(
g/l)
0.0
0.5
1.0
1.5
2.0

25
Figure 7. Impact of time on acetic production on pineapple vinegar
Figure 6 shows impact of time on acetic acid production of pineapple vinegar, result
shows that there is significant different on acetic production with time of four weeks of
pineapple vinegar production. Maximum acetic production observed at week 4 where by
low production of acetic acid observed on first week of acetic fermentation.
Mean(Acetic acid(g/l))
Time(Week)1 2 3 4
Ace
tic a
cid(
g/l)
0.0
0.5
1.0
1.5
2.0

26
Figure 8. Impact of vinegar on pH of carrot pickle
(PC= pineapple carrot pickle, SC= Commercial carrot pickle, 0= day one, 1= first month
of storage, 2= second month of storage, 3= third month of storage)
Figure 8 shows impact of vinegar on pH of carrot pickle for period of three month
of storage. Result shows that there was a significant different in pH between preserved
carrot and fresh carrot (p<0.0001), but the pH of carrot pickle with pineapple vinegar was
3.57 while pH of carrot pickle with commercial vinegar was 3.78 (p>.05). There was no
significant difference between pH of pineapple carrot pickle and that of commercial
carrot pickle. The effect of time of storage (for three month) with change in pH of carrot
pickle was not statistical significantly (p= 0.30).
Mean(pH 2)
Sample
Fresh
carro
tPC0
PC1PC2
PC3SC0
SC1SC2
SC3
pH
0
1
2
3
4
5
6
7

27
Figure 9. Impact of vinegar on mango chutney
(PMc= pineapple mango chutney, SMc= Commercial mango chutney, 0= day one, 1=
first month of storage, 2= second month of storage, 3= third month of storage)
Figure 9 shows impact of vinegar on mango chutney for three month of storage.
Result shows that there was statistically significantly a difference in pH of fresh mango
and preserved mango chutney (p < 0.0001). Highest pH value observed on fresh carrot
which was lowered to 3.24 & 3.15 pH of pineapple mango chutney and commercial
mango chutney. Between pineapple mango chutney and commercial mango chutney, the
observed p-value was 0.01. There was no significant change on pH of mango chutney
processed using pineapple vinegar and that processed using commercial vinegar over
three months of storage (p=0.07).

28
4.1.2.ImpactofvinegaronvitaminAandCcontentsofpreservedmangoandcarrot
4.1.2.1.VitaminA
In comparing vitamin A on carrot pickle and mango chutney processed using
pineapple vinegar compared to the commercial vinegar. Figure 10 shows the impact of
vinegar on vitamin C content on carrot pickle, results shows that there was decreased
vitamin A content of preserved carrot pickle from that of fresh for both carrot pickle
processed using pineapple and commercial vinegar, and there was no significant
difference in the vitamin A content of carrot pickle processed using pineapple and that
processed using commercial vinegars (p=0.9800).
Figure 10. Impact of vinegar on vitamin A(μg/g) on carrot pickle
(PC= pineapple carrot pickle, SC= Commercial carrot pickle)
Mean(Beta-carotine)
SampleFresh carrot PC SC
Be
ta-c
aro
tine
0
10
20
30
40
50
60
70
29
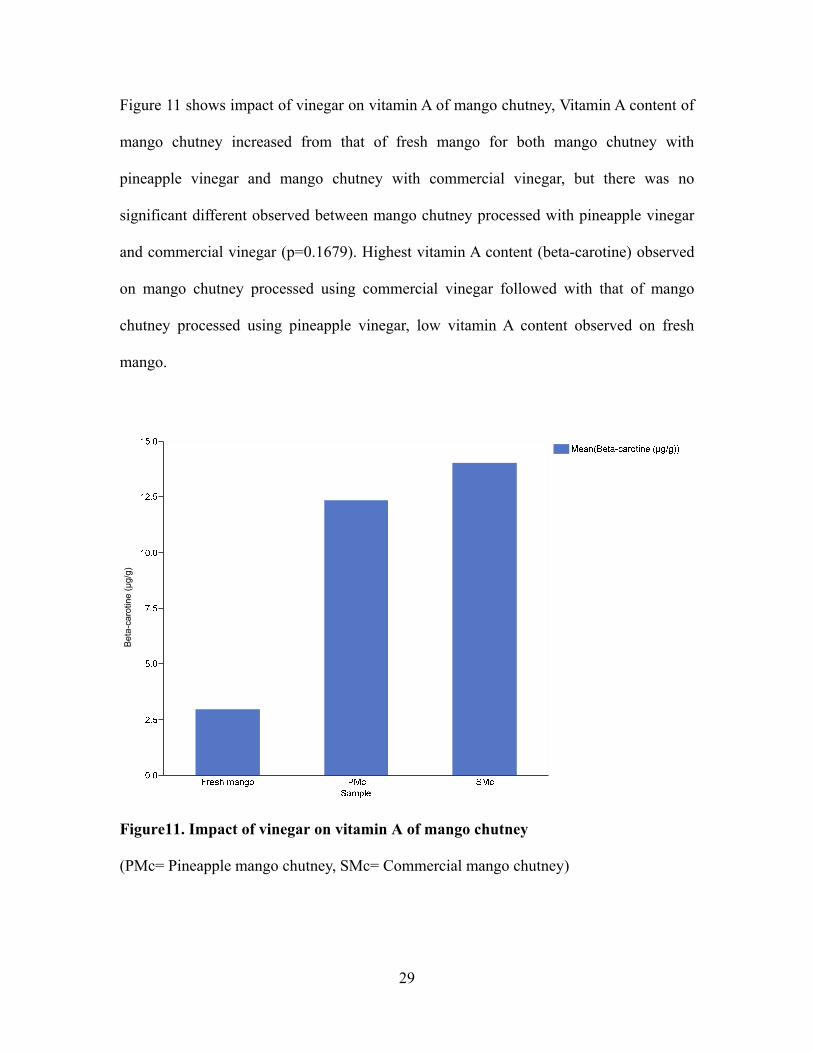
Figure 11 shows impact of vinegar on vitamin A of mango chutney, Vitamin A content of
mango chutney increased from that of fresh mango for both mango chutney with
pineapple vinegar and mango chutney with commercial vinegar, but there was no
significant different observed between mango chutney processed with pineapple vinegar
and commercial vinegar (p=0.1679). Highest vitamin A content (beta-carotine) observed
on mango chutney processed using commercial vinegar followed with that of mango
chutney processed using pineapple vinegar, low vitamin A content observed on fresh
mango.
Figure11. Impact of vinegar on vitamin A of mango chutney
(PMc= Pineapple mango chutney, SMc= Commercial mango chutney)
Bet
a-ca
rotin
e (μ
g/g)
30
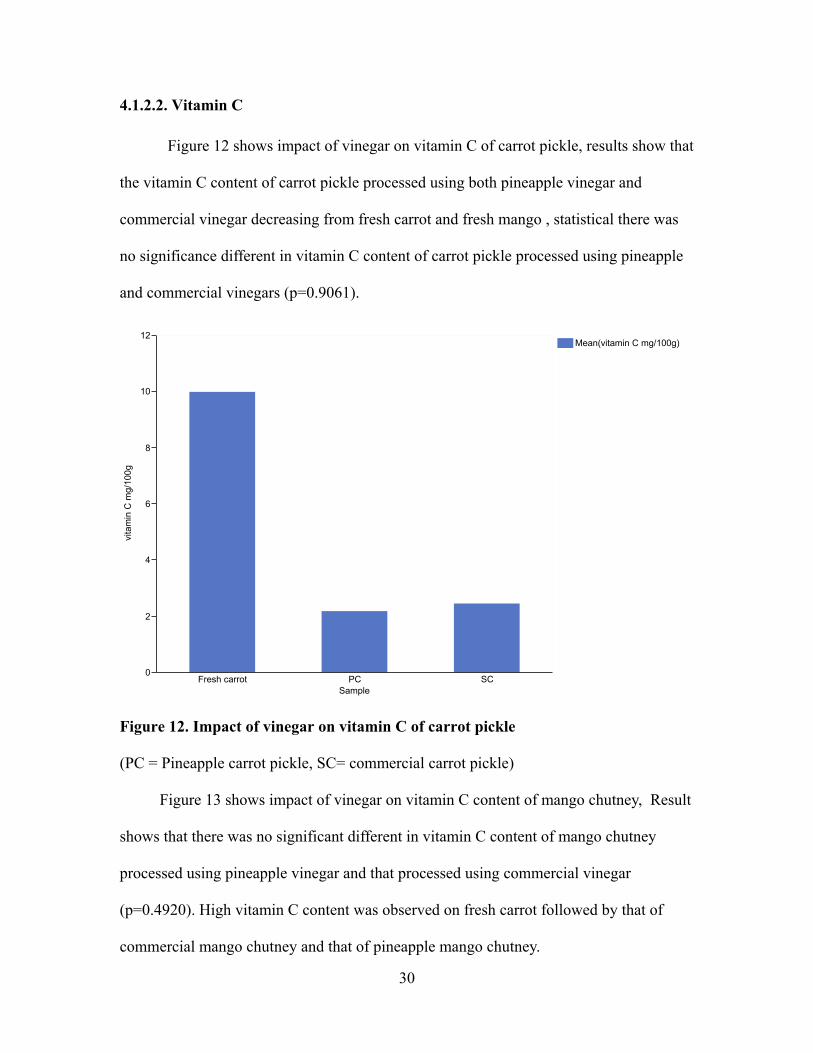
4.1.2.2. Vitamin C
Figure 12 shows impact of vinegar on vitamin C of carrot pickle, results show that
the vitamin C content of carrot pickle processed using both pineapple vinegar and
commercial vinegar decreasing from fresh carrot and fresh mango , statistical there was
no significance different in vitamin C content of carrot pickle processed using pineapple
and commercial vinegars (p=0.9061).
Figure 12. Impact of vinegar on vitamin C of carrot pickle
(PC = Pineapple carrot pickle, SC= commercial carrot pickle)
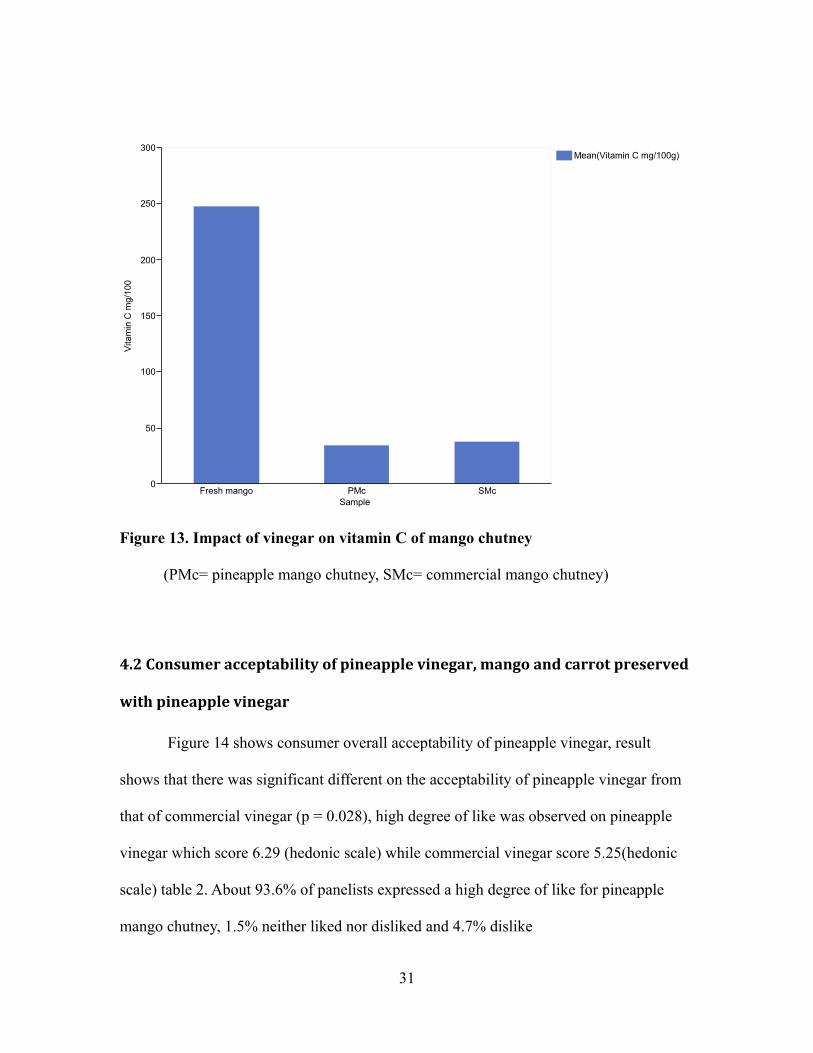
Figure 13 shows impact of vinegar on vitamin C content of mango chutney, Result
shows that there was no significant different in vitamin C content of mango chutney
processed using pineapple vinegar and that processed using commercial vinegar
(p=0.4920). High vitamin C content was observed on fresh carrot followed by that of
commercial mango chutney and that of pineapple mango chutney.
Mean(vitamin C mg/100g)
SampleFresh carrot PC SC
vita
min
C m
g/10
0g
0
2
4
6
8
10
12
31
Figure 13. Impact of vinegar on vitamin C of mango chutney
(PMc= pineapple mango chutney, SMc= commercial mango chutney)
4.2Consumeracceptabilityofpineapplevinegar,mangoandcarrotpreserved
withpineapplevinegar
Figure 14 shows consumer overall acceptability of pineapple vinegar, result
shows that there was significant different on the acceptability of pineapple vinegar from
that of commercial vinegar (p = 0.028), high degree of like was observed on pineapple
vinegar which score 6.29 (hedonic scale) while commercial vinegar score 5.25(hedonic
scale) table 2. About 93.6% of panelists expressed a high degree of like for pineapple
mango chutney, 1.5% neither liked nor disliked and 4.7% dislike
Mean(Vitamin C mg/100g)
Sample Fresh mango PMc SMc
Vita
min
C m
g/10
0
0
50
100
150
200
250
300

32
Figure 14. Consumer acceptability on pineapple vinegar
(189= pineapple vinegar, 502= commercial vinegar, 640= combination of pineapple and
commercial vinegar, 659= plain water)
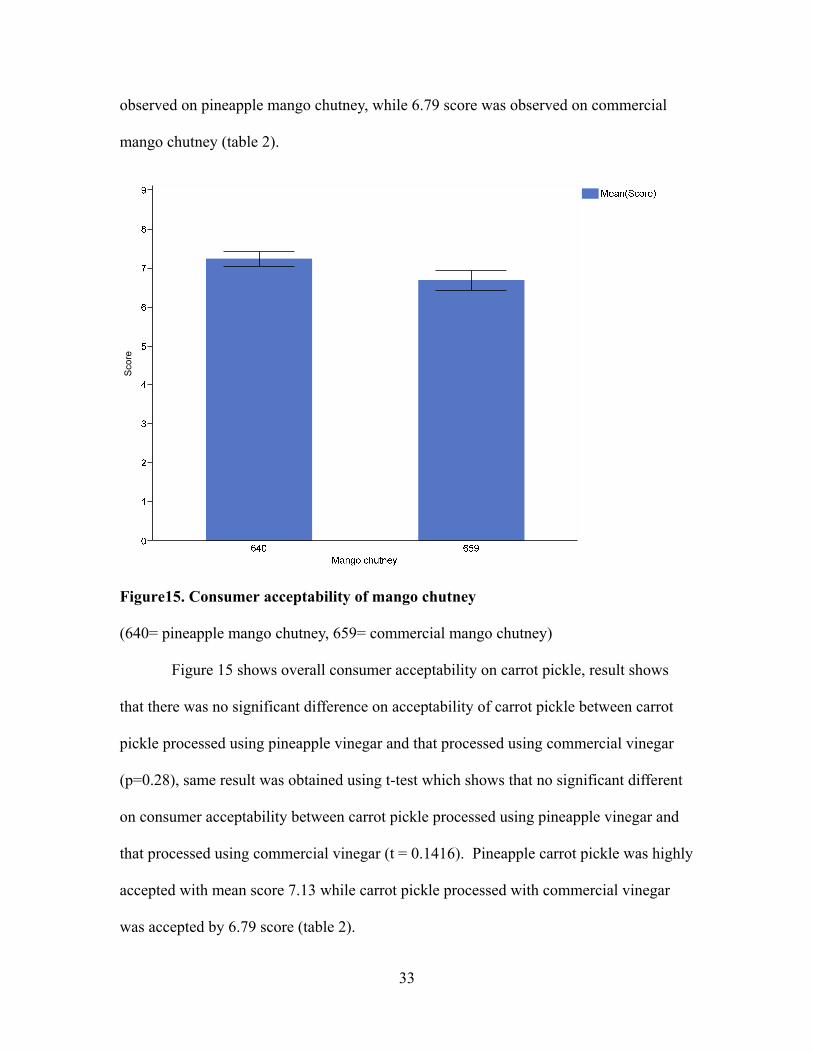
Table 14 shows consumer overall acceptability of mango chutney processed using
pineapple vinegar, result shows that there was no significant difference in acceptability of
mango chutney made between pineapple vinegar and commercial vinegar (p = 0.63). Also
using t-test result shows that there was significant different on consumer acceptability
between mango chutney processed using pineapple vinegar and that processed using
commercial vinegar (t = 0.0443*). Highest mean score of 7.24 (hedonic scale) was
Mean(Scores)
Samples189 502 640 659
Sco
res
0
1
2
3
4
5
6
7
33
observed on pineapple mango chutney, while 6.79 score was observed on commercial
mango chutney (table 2).
Figure15. Consumer acceptability of mango chutney
(640= pineapple mango chutney, 659= commercial mango chutney)
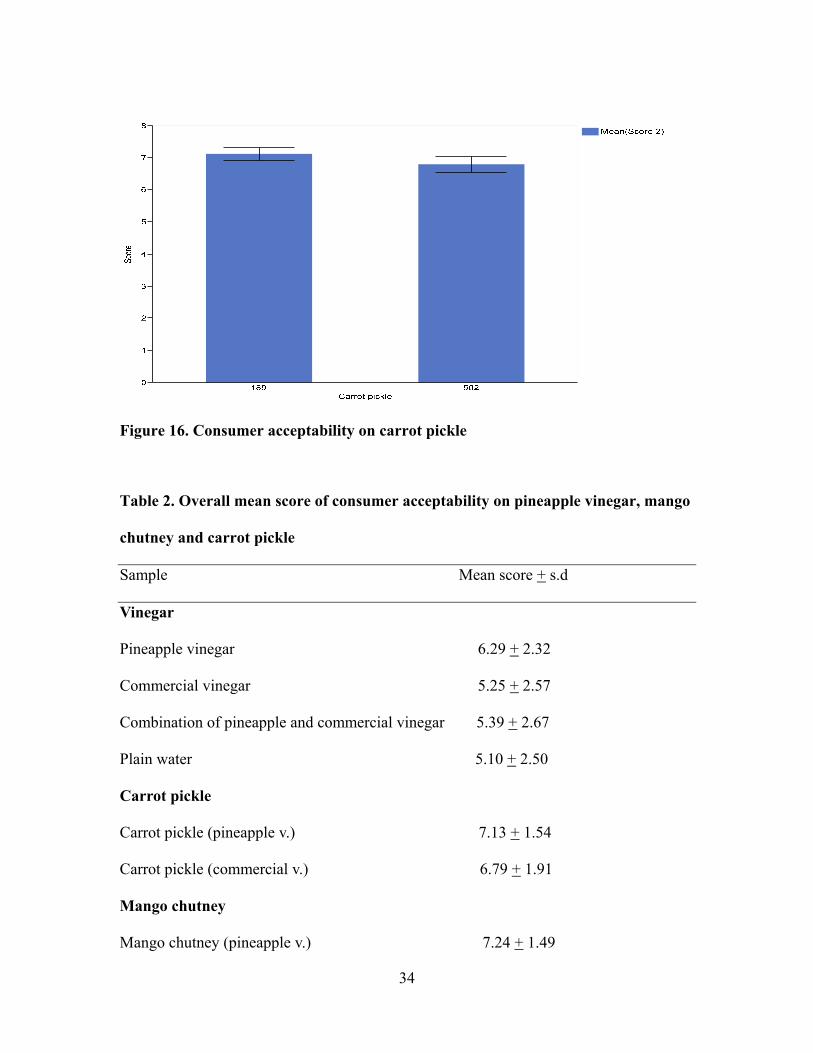
Figure 15 shows overall consumer acceptability on carrot pickle, result shows
that there was no significant difference on acceptability of carrot pickle between carrot
pickle processed using pineapple vinegar and that processed using commercial vinegar
(p=0.28), same result was obtained using t-test which shows that no significant different
on consumer acceptability between carrot pickle processed using pineapple vinegar and
that processed using commercial vinegar (t = 0.1416). Pineapple carrot pickle was highly
accepted with mean score 7.13 while carrot pickle processed with commercial vinegar
was accepted by 6.79 score (table 2).
Sco
re
34
Figure 16. Consumer acceptability on carrot pickle
Table 2. Overall mean score of consumer acceptability on pineapple vinegar, mango
chutney and carrot pickle
Sample Mean score + s.d
Vinegar
Pineapple vinegar 6.29 + 2.32
Commercial vinegar 5.25 + 2.57
Combination of pineapple and commercial vinegar 5.39 + 2.67
Plain water 5.10 + 2.50
Carrot pickle
Carrot pickle (pineapple v.) 7.13 + 1.54
Carrot pickle (commercial v.) 6.79 + 1.91
Mango chutney
Mango chutney (pineapple v.) 7.24 + 1.49

35
Mango chutney (commercial v.) 6.68 + 2.09
(Hedonic scale ranging from dislike extremely = 1, like extremely = 9 was used on
assessing consumer overall acceptability).
36
Chapter 5
5.0 Discussion
It was very important to determine which Brix level is likely to be more effective in
pineapple vinegar production to be used by farmers at the village level in Tanzania.
Saccharomyces cerevisiae yeast and Acetobacter pasteurianus, Gluconobacter oxydans
(bacteria) were used for production of pineapple vinegar. Saccharomyces cerevisiae is
commonly used yeast and recommended for production of fruit vinegar (Solieri and
others 2009). Pineapple juice at 13, 20 or 30 °Brix was used with different bacteria. It
was found that overall acetic acid production increased from 0.29-5.50 percent from day
1 to day 28 of acetic acid fermentation. The same result was observed on the study
conducted by Sossou 2009 reported an increase in production of acetic acid from 1.1-4.5
percent between days 1-20 of acetic fermentation.
High production of acid was observed for pineapple juice at 13 Brix treated with
A. pasteurianus and a combination of A. pasteurianus and Gluconobacter oxydans,
ranging from 3.02 to 5.50 percent. Pineapple juice with high Brix contents (20 and 30)
showed little production of acetic acid (ranged from 0.26 to 0.40). These values were not
significantly different from one another but were significantly lower than vinegar content
produced from pineapple juice of 13 Brix content. This result was supported by Sossou
2009 who has reported that the number of strains of acetic bacteria that are able to grow
decreases with increased glucose, and at a concentration of 24% sugar, only small
number of strains were able to grow. Since sugar is a dehydrating agent often used for
preservation, it might have inhibited the growth of acetic bacteria, resulting in low

37
production of acetic acid in samples with high concentrations of sugar. In samples of 13
Brix pineapple juice, a high production of acetic acid was observed with combinations of
the two bacteria P. pasteurianus + G. oxydans, followed by A. pasteurianus, and a low
production of acetic acid was observed in pineapple juice fermented with G. oxydans.
Solieri and others 2009 recommended microorganisms involved in vinegar production:
Acetobacter pasteurianus was recommended for fruit vinegar while Gluconobacter ssp
was recommended for honey vinegar. Raspor and others 2008 reported Gluconobacter
oxydans numbers decreased after alcoholic fermentation, and large numbers of acetic
bacteria grow in the wine of 7 to 9% v/v alcohol, but if wine is too high in alcohol, above
9%, it needs to be appropriately diluted with water to lower the concentration of alcohol
which inhibits the growth of AAB.
Ndoye and others 2006 reported acetic bacteria are gram negative, mostly aerobic,
and commonly found in nature on different plants. Seventeen strains of Acetobacter
bacteria were isolated from tropical fruits in sub-Saharan Africa and were used for
industrial production of vinegar; more than half of the species identified belong to the
genus Acetobacter, while remaining species were identified as Gluconobacter.
Impact of bacteria, TSS, time and interaction of these three factors on production
of acetic acid in pineapple vinegar, results show that interaction of TSS*time and the
interaction of TSS*bacteria significantly influence production of acetic acid in pineapple
vinegar (p<0.0001). Interaction effect of total soluble solid (TSS) and time on acetic acid
production of pineapple shows that efficiency of acetic bacteria depend on total soluble
solid and time, where by acetic acid production on pineapple vinegar increases with
decrease in total soluble solid with time of bacteria adaption. Also interaction effect on

38
total soluble solid and bacteria on acetic acid production of pineapple vinegar shows that
high acetic acid production was influenced with tolerance and efficiency of acetic
bacteria on total soluble solid. Tesfaye and others 2000 describe that high concentration
of alcohol which result from high total soluble solid had a negative influence on bacterial
growth, hence result into poor production of vinegar. Vegas 2010 shows that acetic acid
bacteria had successful shows maximum concentration of acetic acid production with
time increase. Maal and Shafiee 2009 on interaction effect of ethanol concentration and
temperature on strain and acetic acid production suggested that concentration of ethanol
influences the temperature tolerance of strain and the sensitivity of strain to high
temperature is increased and bacterium need more time to adapt to new stress condition.
Vinegar lowered the pH of preserved carrot (carrot pickle) and mango (mango
chutney) to a pH of less than 4, which can help enhance the shelf life of the preserved
foods by inhibiting the growth of harmful microorganisms. Vinegar lowers pH of foods
where it is used as an ingredient because of its acetic acid content. There was no
significant difference in pH of carrot pickle and mango chutney produced using pineapple
and commercial vinegars, showing that the pineapple vinegar produced using low
technology procedures would be as effective in preserving fruit as imported commercial
vinegar. Sultan and others 2014 processed carrot pickle by lowering the pH to 4.47.
Samples were stored for three months at 200C to 320C to monitor physical changes; they
reported that physical properties such as color flavor and texture were well-retained.
Khan and others 2005 reported that spoilage of oil pickle only occurred at pH 5.0 and
above. The pH of the preserved carrot and mango was < 4.0 and would be expected to
remain safe during storage. The quality of processed food is influenced by the quality of
39
ingredients used, so during the processing of carrot pickle and mango chutney, the quality
of all ingredients was taken into consideration by following the principles of good
agricultural practices (GAP), good manufacturing practices (GMP) and good hygiene
practices (GHP). Acetic acid, sugar, salt and heat were applied in the processing of carrot
and mango, and the pH was less than 4. Lee 2004 in a study of microbial safety of
pickled fruits and vegetables reported that utilization of acetic acid, heat and salt
contributed to the microbial safety of the preserved fruits and vegetables.
The mean score for the taste and overall acceptability of pineapple vinegar, carrot
pickle and mango chutney are shown in Table 5. The mean score for overall acceptability
in pineapple vinegar was 6.29 (like slightly), which was higher than the control vinegar,
which was 5.25 (neither like nor dislike according to the hedonic scale), this was
followed with 5.39 of combined pineapple and commercial vinegar and 5.10 for plain
water which was lowest. High acceptability of pineapple vinegar was high influenced
with 31% of panelist who like mostly, 22% panelist who like very much, 20% panelist
who like slight, 19% panelist like extremely , 4% panelist neither like nor dislike and 1%
panelist dislike the product very much (appendix H). Overall consumer acceptability on
commercial vinegar was influenced with 27% panelist like most, 21% panelist like
slightly, 20% panelist like very much, 10% panelist like extremely, 8% neither like nor
dislike and 1% panelist dislike the product extremely(appendix I). Also multiple linear
regression which was used to assess the impact of gender, rate of consumption, and age
on the overall acceptability shows that vinegar rate of consumption had a significant
influence on acceptability (p<0.0001). From demographic information collected only
4.4% of panelists consume vinegar frequently, 26.5% consume vinegar once per month
40
and 64.7% rarely or never consumer vinegar which has influence result of overall
consumer acceptability of vinegar, same reason was explained by Biachi and Duncan
2014 who reported that people who never consumed soymilk were less able to tell the
difference between improved and control soymilk compared to regular soymilk users.
Consumer acceptability of carrot pickle and mango chutney processed using
pineapple vinegar had mean scores of 7.13 for pineapple carrot pickle and 6.75 for
commercial carrot pickle, this result was influenced with 35% panelist who like mostly,
30% panelist who like very much, 20% panelist who like extremely, 3% panelist who
neither like nor dislike and 2% panelist who dislike much carrot pickle processed with
pineapple vinegar (appendices J). On consumer acceptability of commercial carrot pickle
the overall mean score of 6.75 which was low compare to that of pineapple carrot pickle
was influenced by 35% panelist who like much, 31% panelist who like very much, 16%
panelist at 9 score, 2% panelist neither like nor dislike the product and <4% panelist
dislike the product (appendix K).
Overall consumer acceptability of mango chutney shows that mango chutney
processed using pineapple vinegar was more accepted by consumer at 7.24 compared to
that of mango chutney processed using commercial vinegar which scores 6.68. Overall
mean score of mango chutney processed using pineapple vinegar was influenced by 33%
panelists who like very much, 23% panelist who like extremely, 23% panelist who like
mostly, 17% panelist who like slightly and 1% panelist who dislike the product mostly
(appendix L). Also mean overall acceptability of mango chutney processed using
commercial vinegar was influenced by 40% panelist who like very much, 28% panelist
like mostly, 12% panelist extremely like and 2% panelist dislike mostly (appendix M).

41
There was no significant different in the preference of carrot and mango preserved using
pineapple vinegar compared to the control vinegar. As it has been mentioned above,
although most of the panelists were not consumers of the vinegar, the panelist liked the
products made from both pineapple and control vinegar.
The vitamin C contents of preserved carrot pickle decrease from 9.98 mg/100g in
fresh carrot to 2.3 mg/100g, while that of fresh mango decrease from 247 to 36 mg/100g
in preserved mango (mango chutney). Vitamin C is among the most important vitamins
found in fruits and vegetables. The decreased level of vitamin C of preserved carrot and
mango was most likely due to the heat treatment applied during processing of carrot
pickle and mango chutney. The total loss of vitamin C in carrot pickle was 76% while
loss of vitamin C of mango chutney was 85%. Amounts of vitamin C in preserved
mango flours were 109.7 mg/g for green peel flour, 94.1 mg/g for green pulp, 52.5 mg/g
for ripe peel flour and 71.4 mg/g for ripe pulp flour Aziz and others 2011. Sultana and
others 2014 reported high loss of vitamin C in fermented carrot (carrot pickle); about
99%, his analysis vitamin C of fresh carrot was 8.56mg/100g while that of carrot pickle
was 0.0001 mg/100g. Tressler and others 1936 showed effects of cooking on vitamin C
content on peas, snap beans and cabbage, where around 1/3 of the vitamin C was
dissolved in the cooking water after twenty minutes. This shows that cooking time and
cooking temperature have influences on the loss of vitamin C content. Carrot and mango
were processed for thirty minutes at low cooking temperatures which increase the losses
of vitamin C. Maturity of fruits and vegetable also impacts the level of vitamin C. The
high content of vitamin C in mangos in our study was likely affected by the maturity of
42
the mango used, because they were was still unripe. Aziz 2012 showed green mango
flours found to have higher vitamin C content compared to ripe mongo flours.
In this study, vitamin A contents of the fresh and preserved fruit and vegetables
were different; carrot Vitamin A decreased from 59.2 μg/g – 24.5 μg/g while mango was
increased from 2.9 μg/g – 13.0 μg/g. Heat treatment impacts the color of fruit and
vegetables; color intensity of some fruits and vegetable increases while other fruits and
vegetable decrease in color intensity on heat treatment Fellows 2009. Time of heating
also impacts the color intensity of foods. This impact has been observed in this study
where carrot pickle show depletion of its vitamin A compared to fresh carrot. The
vitamin A content of mango was low compared to carrot because of the maturity of the
mango which was unripe with just little yellow color, which was enhanced with
combination with other ingredients like grape, onion, chilies, garlic and ginger on the
recipe used. Aziz 2012 reported that the carotenoid level of mango increases with
increase intensity of color during growth of mango, where by high carotenoid level was
found on ripe pulp flours than in green mango flours.
According to FAO and WHO 2004 recommended dietary intake of vitamin A was
distributed in age group as follow; 375RE for children of one year, 400RE for 1-3years
children, 500RE for 4-6years, 800RE for female and pregnant women and 1300RE for
lactating women. So from this study carrot pickle and mango chutney can be used to
reduce vitamin A deficiency in children less than five years, pregnant women and
lactating women by daily consumption of 97.9g carrot pickle for children of 1-3years,
122.4g carrot pickle for 4-6years children, 195.9g carrot pickle for pregnant women and
318.3g carrot pickle for lactating women. To get a recommended amount of vitamin A

43
from consumption of mango chutney, it will require 184.6g for 1-3years children, 230.7g
for 4-6years children, 323g for pregnant women and 600g for lactating women.
Vitamin C recommended dietary intake was described with FAO and WHO 2004 as
follow 30mg for 1-6years children, 55mg pregnant women and 70mg for lactating
women daily. In order to reduce vitamin C deficiency in Tanzania mango chutney can be
consumed as part of diet in every meal of Tanzanian, where by 83g of mango chutney for
1-6years children, 152.7g of mango chutney for pregnant women and 194.4 of mango
chutney for lactating woman can be consumed to meet recommended intake of vitamin C.
Also same amount of recommended vitamin C can be obtain by daily consumption of
carrot pickle where by 1304.3g for 1-6years, 2319g for pregnant women and 3043g for
lactating women.

44
Chapter 6
Conclusions and Recommendations
Concentration of sugar and type of bacteria impacted the production of acetic acid
in pineapple vinegar production. This should be further studied for introducing vinegar
production in Tanzania to enhance food security by lowering fruit and vegetable losses
during high production season. From this study, results show that production of pineapple
vinegar can be used to reduce fruit and vegetable loses.
45
References
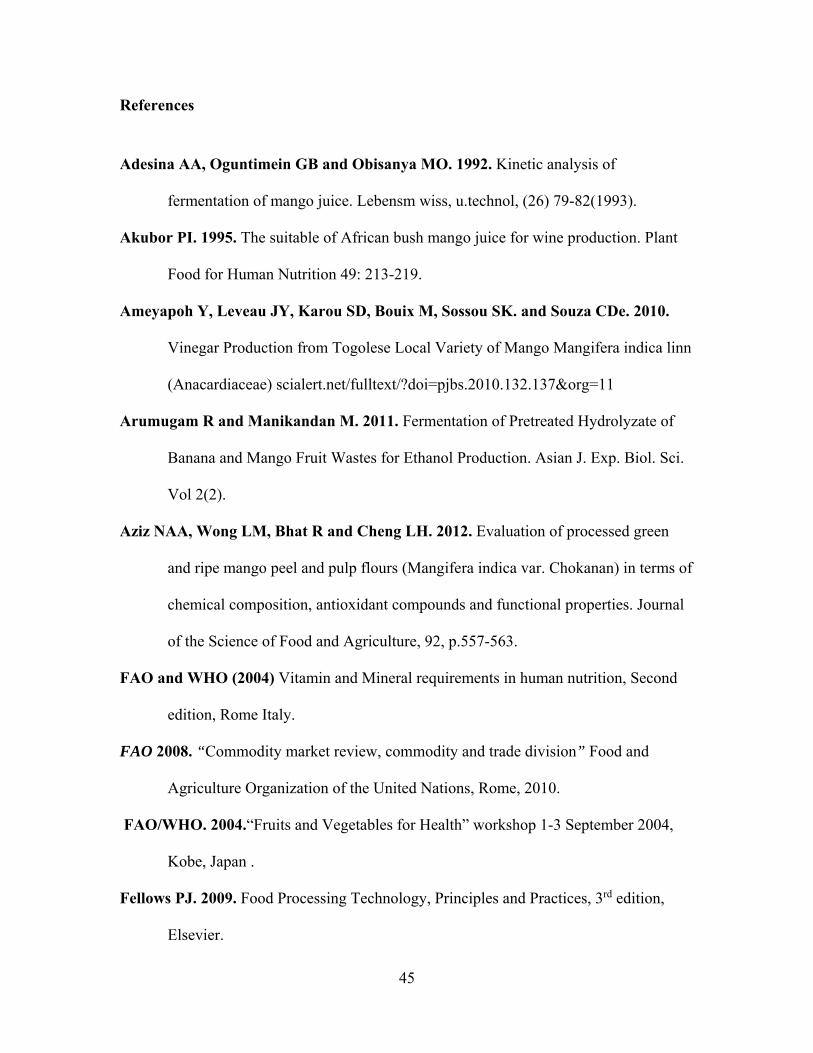
Adesina AA, Oguntimein GB and Obisanya MO. 1992. Kinetic analysis of
fermentation of mango juice. Lebensm wiss, u.technol, (26) 79-82(1993).
Akubor PI. 1995. The suitable of African bush mango juice for wine production. Plant
Food for Human Nutrition 49: 213-219.
Ameyapoh Y, Leveau JY, Karou SD, Bouix M, Sossou SK. and Souza CDe. 2010.
Vinegar Production from Togolese Local Variety of Mango Mangifera indica linn
(Anacardiaceae) scialert.net/fulltext/?doi=pjbs.2010.132.137&org=11
Arumugam R and Manikandan M. 2011. Fermentation of Pretreated Hydrolyzate of
Banana and Mango Fruit Wastes for Ethanol Production. Asian J. Exp. Biol. Sci.
Vol 2(2).
Aziz NAA, Wong LM, Bhat R and Cheng LH. 2012. Evaluation of processed green
and ripe mango peel and pulp flours (Mangifera indica var. Chokanan) in terms of
chemical composition, antioxidant compounds and functional properties. Journal
of the Science of Food and Agriculture, 92, p.557-563.
FAO and WHO (2004) Vitamin and Mineral requirements in human nutrition, Second
edition, Rome Italy.
FAO 2008. “Commodity market review, commodity and trade division” Food and
Agriculture Organization of the United Nations, Rome, 2010.
FAO/WHO. 2004.“Fruits and Vegetables for Health” workshop 1-3 September 2004,
Kobe, Japan .
Fellows PJ. 2009. Food Processing Technology, Principles and Practices, 3rd edition,
Elsevier.
46
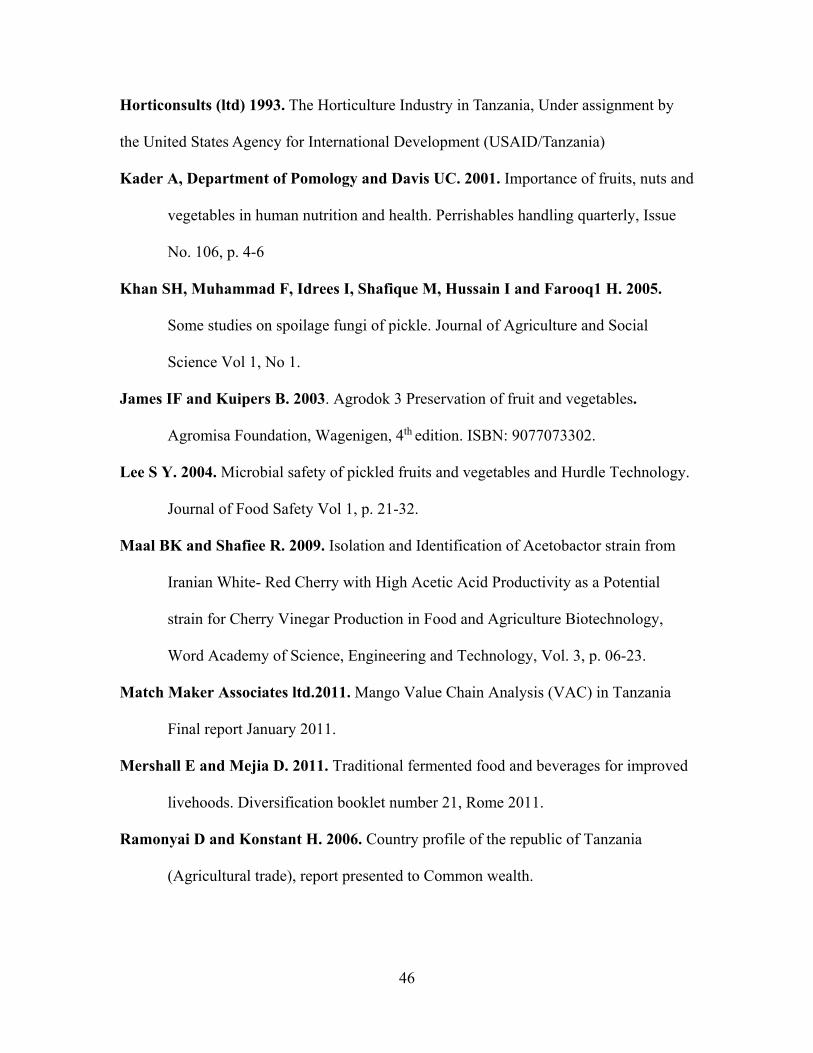
Horticonsults (ltd) 1993. The Horticulture Industry in Tanzania, Under assignment by
the United States Agency for International Development (USAID/Tanzania)
Kader A, Department of Pomology and Davis UC. 2001. Importance of fruits, nuts and
vegetables in human nutrition and health. Perrishables handling quarterly, Issue
No. 106, p. 4-6
Khan SH, Muhammad F, Idrees I, Shafique M, Hussain I and Farooq1 H. 2005.
Some studies on spoilage fungi of pickle. Journal of Agriculture and Social
Science Vol 1, No 1.
James IF and Kuipers B. 2003. Agrodok 3 Preservation of fruit and vegetables.
Agromisa Foundation, Wagenigen, 4th edition. ISBN: 9077073302.
Lee S Y. 2004. Microbial safety of pickled fruits and vegetables and Hurdle Technology.
Journal of Food Safety Vol 1, p. 21-32.
Maal BK and Shafiee R. 2009. Isolation and Identification of Acetobactor strain from
Iranian White- Red Cherry with High Acetic Acid Productivity as a Potential
strain for Cherry Vinegar Production in Food and Agriculture Biotechnology,
Word Academy of Science, Engineering and Technology, Vol. 3, p. 06-23.
Match Maker Associates ltd.2011. Mango Value Chain Analysis (VAC) in Tanzania
Final report January 2011.
Mershall E and Mejia D. 2011. Traditional fermented food and beverages for improved
livehoods. Diversification booklet number 21, Rome 2011.
Ramonyai D and Konstant H. 2006. Country profile of the republic of Tanzania
(Agricultural trade), report presented to Common wealth.
47
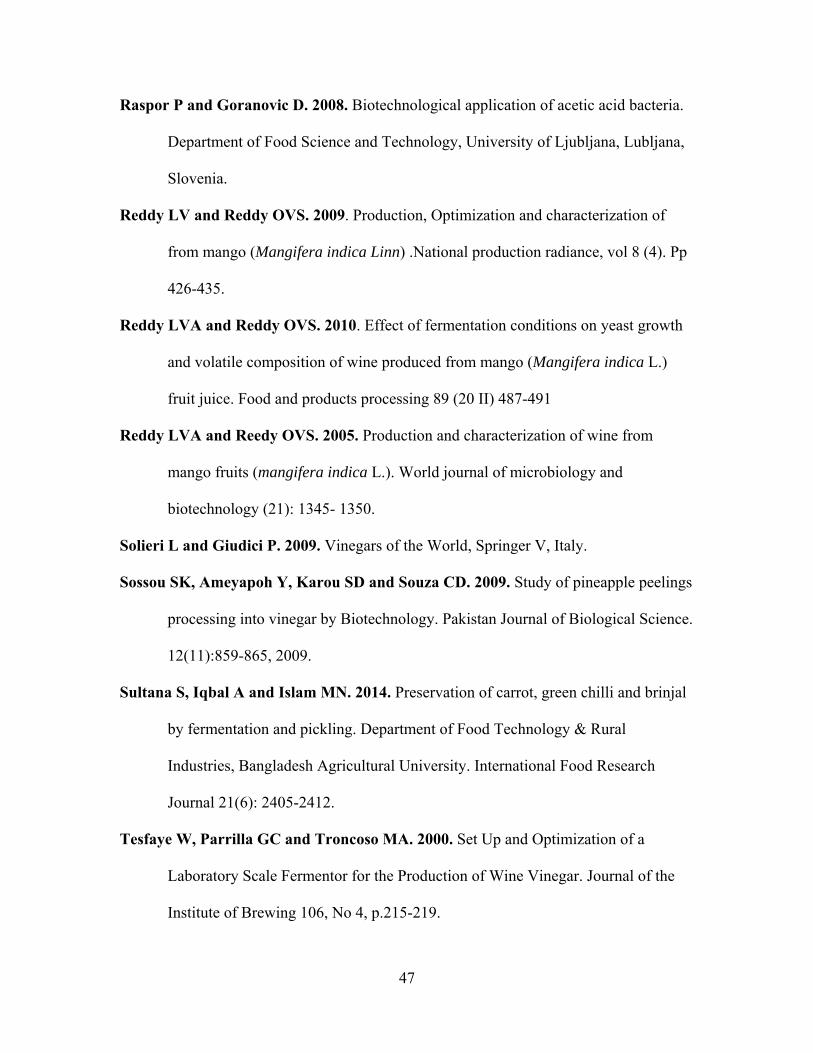
Raspor P and Goranovic D. 2008. Biotechnological application of acetic acid bacteria.
Department of Food Science and Technology, University of Ljubljana, Lubljana,
Slovenia.
Reddy LV and Reddy OVS. 2009. Production, Optimization and characterization of
from mango (Mangifera indica Linn) .National production radiance, vol 8 (4). Pp
426-435.
Reddy LVA and Reddy OVS. 2010. Effect of fermentation conditions on yeast growth
and volatile composition of wine produced from mango (Mangifera indica L.)
fruit juice. Food and products processing 89 (20 II) 487-491
Reddy LVA and Reedy OVS. 2005. Production and characterization of wine from
mango fruits (mangifera indica L.). World journal of microbiology and
biotechnology (21): 1345- 1350.
Solieri L and Giudici P. 2009. Vinegars of the World, Springer V, Italy.
Sossou SK, Ameyapoh Y, Karou SD and Souza CD. 2009. Study of pineapple peelings
processing into vinegar by Biotechnology. Pakistan Journal of Biological Science.
12(11):859-865, 2009.
Sultana S, Iqbal A and Islam MN. 2014. Preservation of carrot, green chilli and brinjal
by fermentation and pickling. Department of Food Technology & Rural
Industries, Bangladesh Agricultural University. International Food Research
Journal 21(6): 2405-2412.
Tesfaye W, Parrilla GC and Troncoso MA. 2000. Set Up and Optimization of a
Laboratory Scale Fermentor for the Production of Wine Vinegar. Journal of the
Institute of Brewing 106, No 4, p.215-219.

48
Tressler DK, Mack GL and King CG. 1936. Factors influencing the vitamin C Content
of vegetables. Chemistry Department, University of Pittsburgh, Pittsburgh, Pa.
Vegas C, Mateo E, Gonzales A, Jara C, Guillamon MJ, Poblet M, Torija J M and
Mas A. 2010. Population Dynamic of Acetic Acid Bacteria during Traditional
Wine Vinegar Production. International Journal of Food Microbiology, 138, p.
130-136, 2010.
Webb AD and Updated by stuff. 2007. Vinegar , Kirk-othmer Encyclopedia of
chemical Technology.
WHO/FAO .2003. Dietary recommendations and report of joint WHO and FAO expert
consultation on diet, nutrition and prevention of chronic disease. WHO technical
report series 960.

49
APPENDICES
Appendix A: Demographic questionnaire
(Cycle which is appropriate)
1. Gender
Female
Male
2. Age group
18‐24yrs
25‐34yrs
>35yrs
3. Which group do you fit
Undergraduate
Graduate
Staff
4. How many time do you use vinegar
Daily
Once in week
50
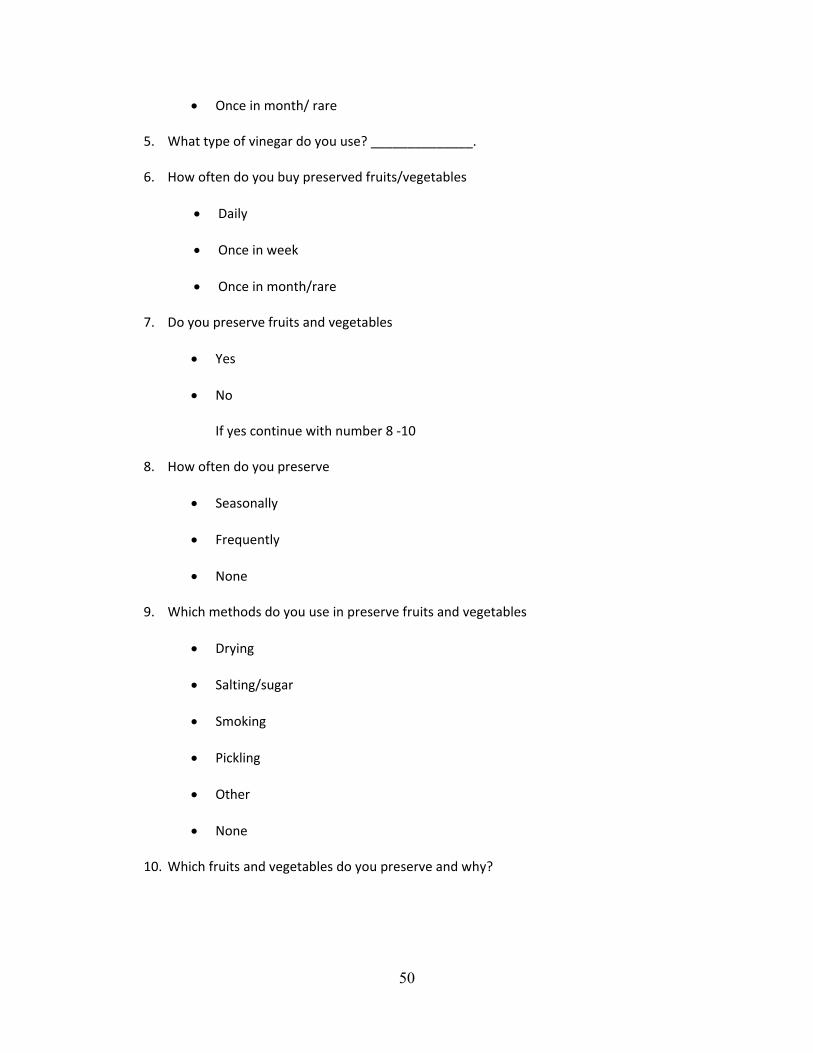
Once in month/ rare
5. What type of vinegar do you use? ______________.
6. How often do you buy preserved fruits/vegetables
Daily
Once in week
Once in month/rare
7. Do you preserve fruits and vegetables
Yes
No
If yes continue with number 8 ‐10
8. How often do you preserve
Seasonally
Frequently
None
9. Which methods do you use in preserve fruits and vegetables
Drying
Salting/sugar
Smoking
Pickling
Other
None
10. Which fruits and vegetables do you preserve and why?

51
Pass the tray to investigator wait for another sample.
52
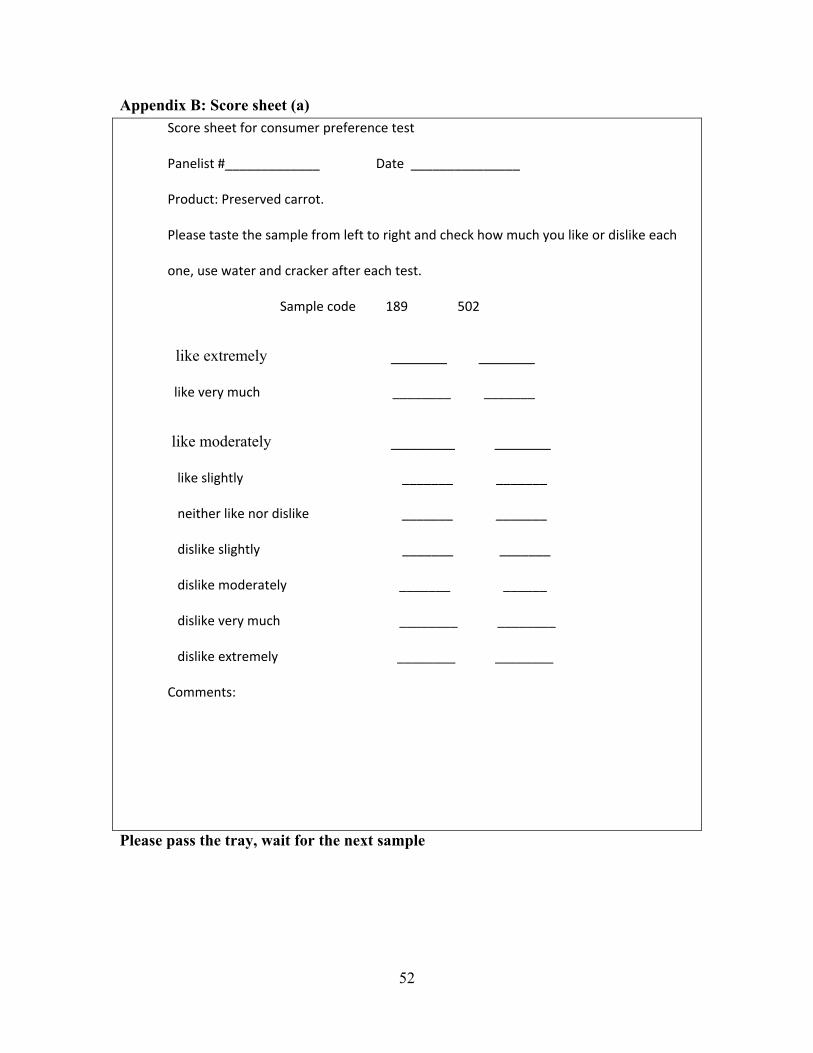
Appendix B: Score sheet (a) Score sheet for consumer preference test
Panelist #_____________ Date _______________
Product: Preserved carrot.
Please taste the sample from left to right and check how much you like or dislike each
one, use water and cracker after each test.
Sample code 189 502
like extremely _______ _______
like very much ________ _______
like moderately ________ _______
like slightly _______ _______
neither like nor dislike _______ _______
dislike slightly _______ _______
dislike moderately _______ ______
dislike very much ________ ________
dislike extremely ________ ________
Comments:
Please pass the tray, wait for the next sample

53
Appendix C: Score sheet (b) Score sheet for consumer preference test
Panelist #_____________ Date _______________
Product: Preserved mango
Please taste the sample from left to right and check how much you like or dislike each
one, use water and cracker after each test.
Sample code 640 659
like extremely ________ _______
like very much ________ ________
like moderately ________ _______
like slightly _______ ________
neither like nor dislike _______ ________
dislike slightly _______ ________
dislike moderately ________ ________
dislike very much ________ ________
dislike extremely ________ ________
Comments:
You are now done with the sensory testing, pass the questionnaire to the investigator and exit through the back down.
54
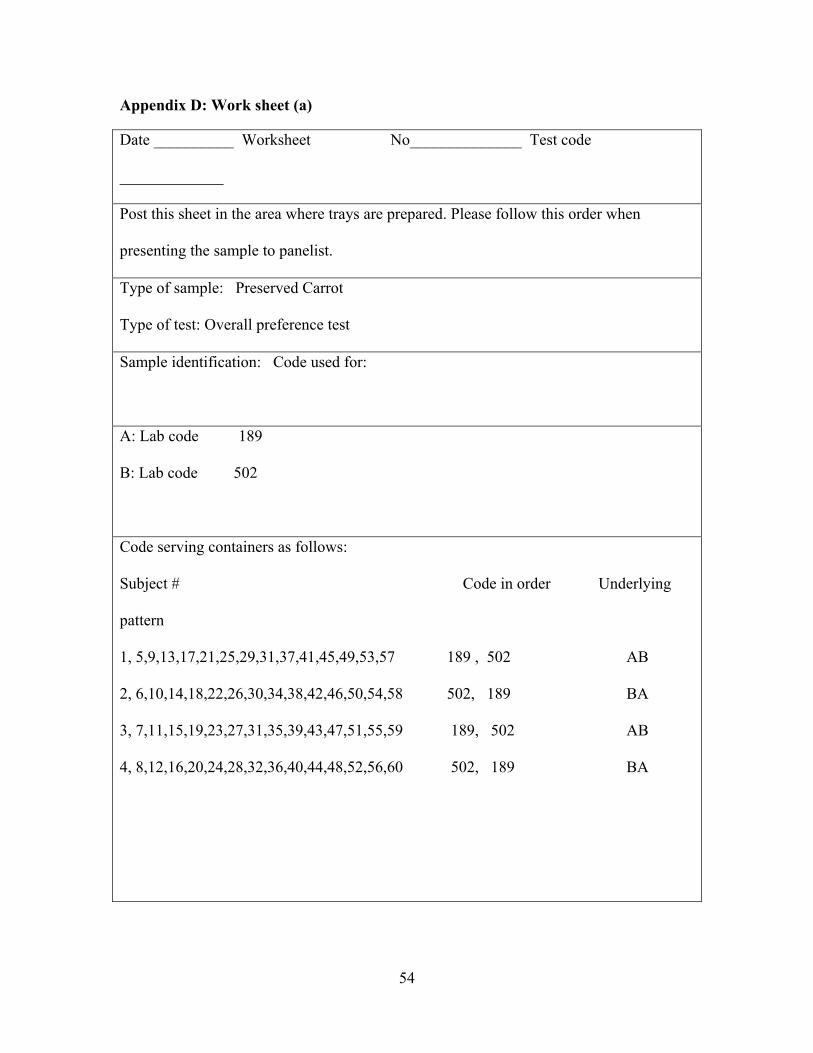
Appendix D: Work sheet (a)
Date __________ Worksheet No______________ Test code
_____________
Post this sheet in the area where trays are prepared. Please follow this order when
presenting the sample to panelist.
Type of sample: Preserved Carrot
Type of test: Overall preference test
Sample identification: Code used for:
A: Lab code 189
B: Lab code 502
Code serving containers as follows:
Subject # Code in order Underlying
pattern
1, 5,9,13,17,21,25,29,31,37,41,45,49,53,57 189 , 502 AB
2, 6,10,14,18,22,26,30,34,38,42,46,50,54,58 502, 189 BA
3, 7,11,15,19,23,27,31,35,39,43,47,51,55,59 189, 502 AB
4, 8,12,16,20,24,28,32,36,40,44,48,52,56,60 502, 189 BA
55
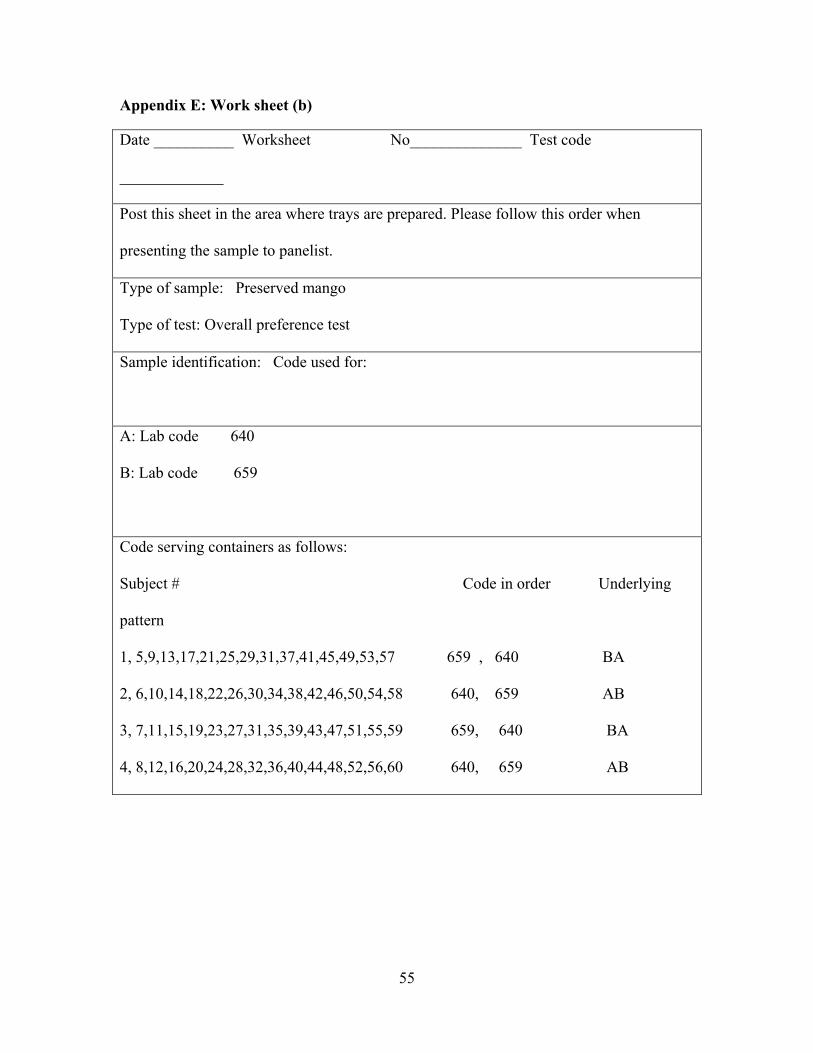
Appendix E: Work sheet (b)
Date __________ Worksheet No______________ Test code
_____________
Post this sheet in the area where trays are prepared. Please follow this order when
presenting the sample to panelist.
Type of sample: Preserved mango
Type of test: Overall preference test
Sample identification: Code used for:
A: Lab code 640
B: Lab code 659
Code serving containers as follows:
Subject # Code in order Underlying
pattern
1, 5,9,13,17,21,25,29,31,37,41,45,49,53,57 659 , 640 BA
2, 6,10,14,18,22,26,30,34,38,42,46,50,54,58 640, 659 AB
3, 7,11,15,19,23,27,31,35,39,43,47,51,55,59 659, 640 BA
4, 8,12,16,20,24,28,32,36,40,44,48,52,56,60 640, 659 AB
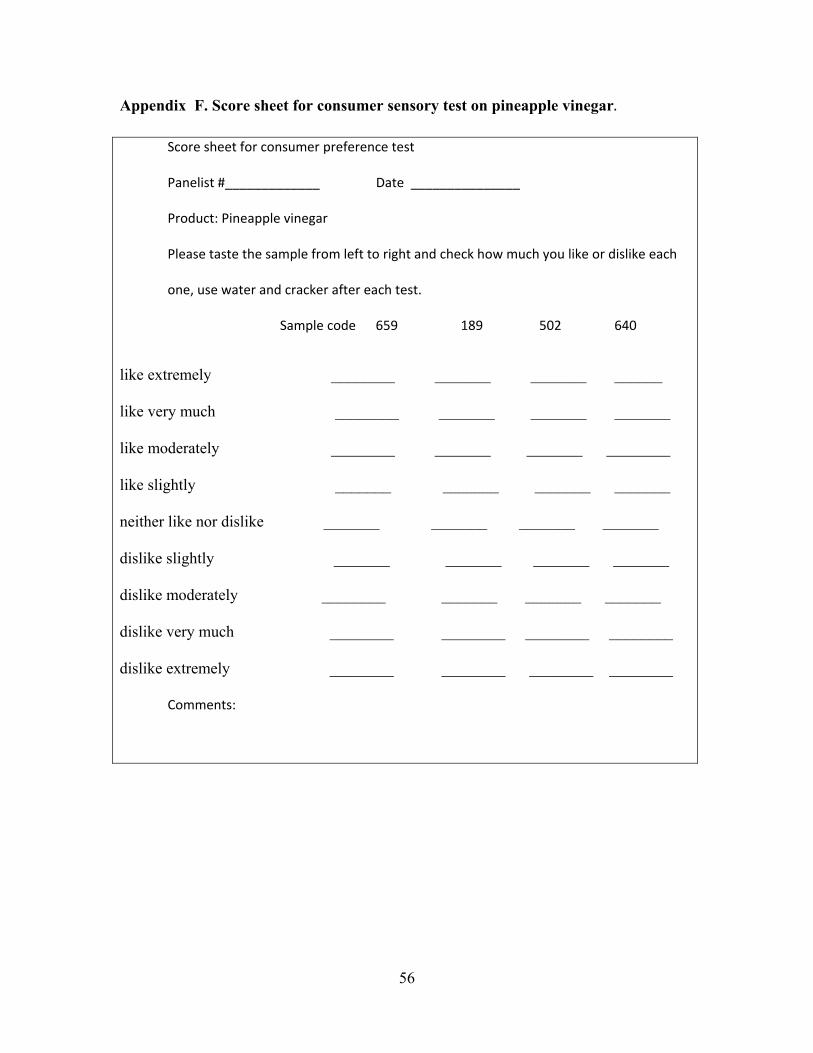
56
Appendix F. Score sheet for consumer sensory test on pineapple vinegar.
Score sheet for consumer preference test
Panelist #_____________ Date _______________
Product: Pineapple vinegar
Please taste the sample from left to right and check how much you like or dislike each
one, use water and cracker after each test.
Sample code 659 189 502 640
like extremely ________ _______ _______ ______
like very much ________ _______ _______ _______
like moderately ________ _______ _______ ________
like slightly _______ _______ _______ _______
neither like nor dislike _______ _______ _______ _______
dislike slightly _______ _______ _______ _______
dislike moderately ________ _______ _______ _______
dislike very much ________ ________ ________ ________
dislike extremely ________ ________ ________ ________
Comments:
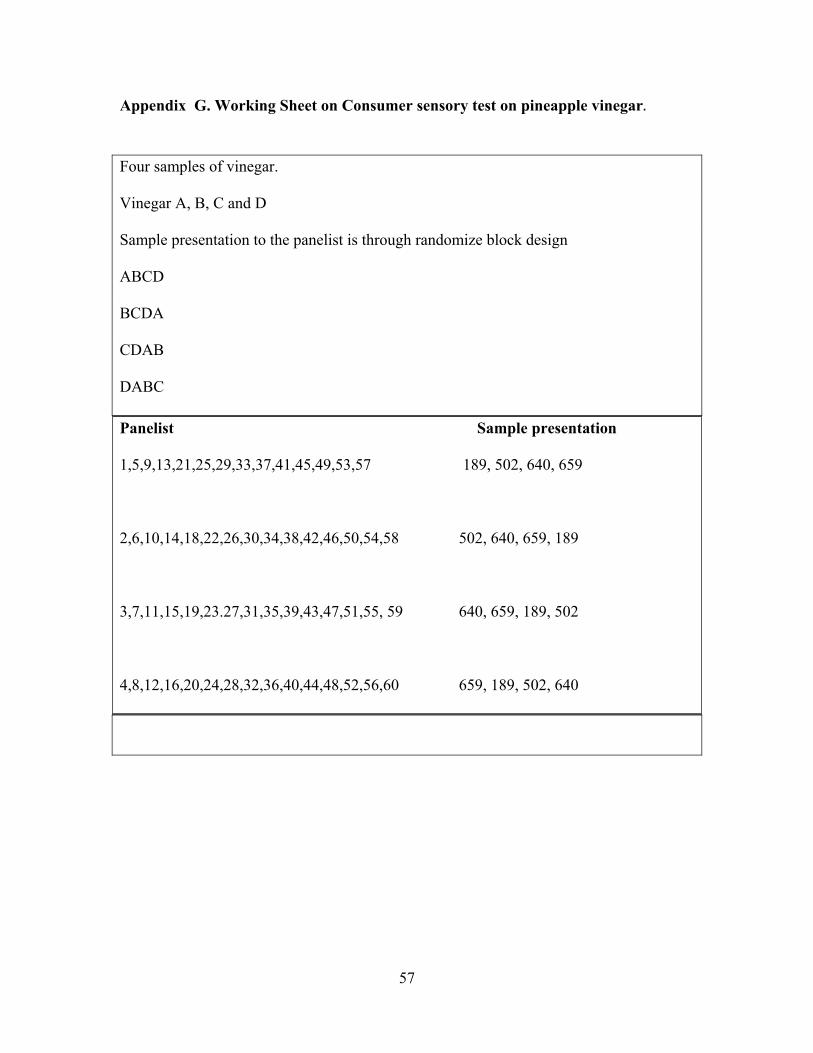
57
Appendix G. Working Sheet on Consumer sensory test on pineapple vinegar. Four samples of vinegar.
Vinegar A, B, C and D
Sample presentation to the panelist is through randomize block design
ABCD
BCDA
CDAB
DABC
Panelist Sample presentation
1,5,9,13,21,25,29,33,37,41,45,49,53,57 189, 502, 640, 659
2,6,10,14,18,22,26,30,34,38,42,46,50,54,58 502, 640, 659, 189
3,7,11,15,19,23.27,31,35,39,43,47,51,55, 59 640, 659, 189, 502
4,8,12,16,20,24,28,32,36,40,44,48,52,56,60 659, 189, 502, 640

58
Appendix H. Distribution % of consumer acceptability on pineapple vinegar

59
Appendix I. Distribution % of consumer acceptability on commercial vinegar

60
Appendix J. Distribution % of consumer acceptability of pineapple carrot pickle
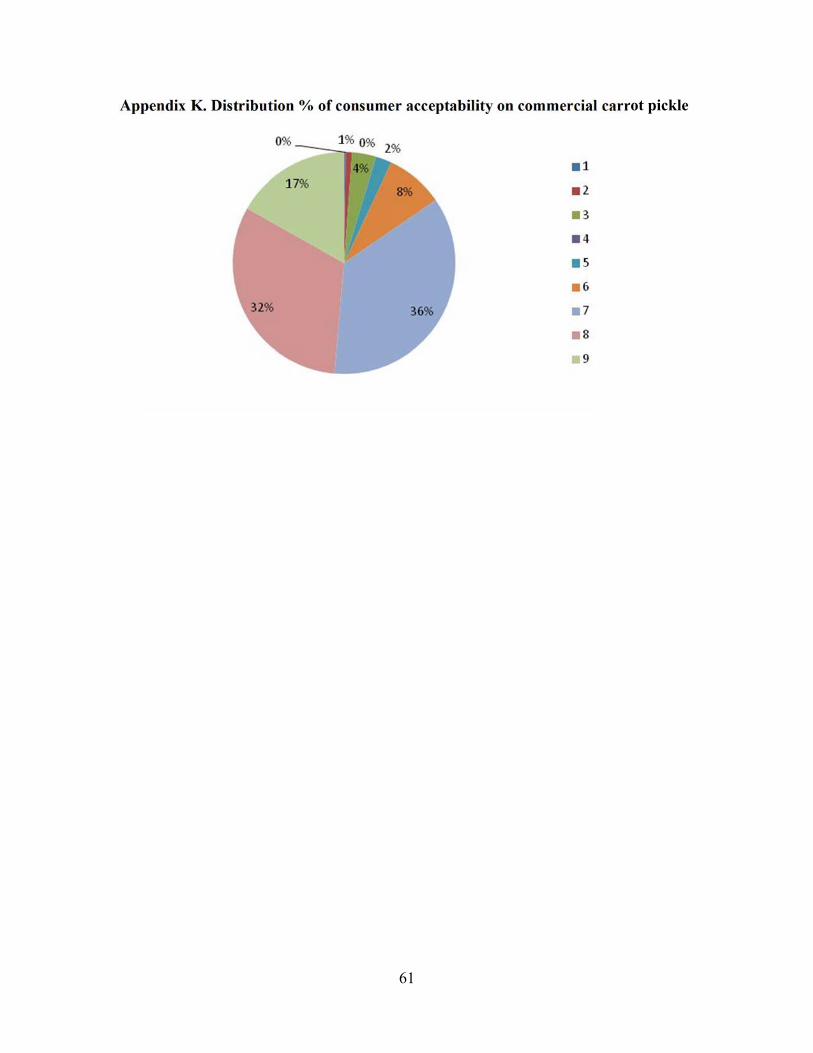
61
Appendix K. Distribution % of consumer acceptability on commercial carrot pickle

62
Appendix L. Distribution % of consumer acceptability on pineapple mango chutney

63
Appendix M. Distribution % of consumer acceptability on commercial mango chutney
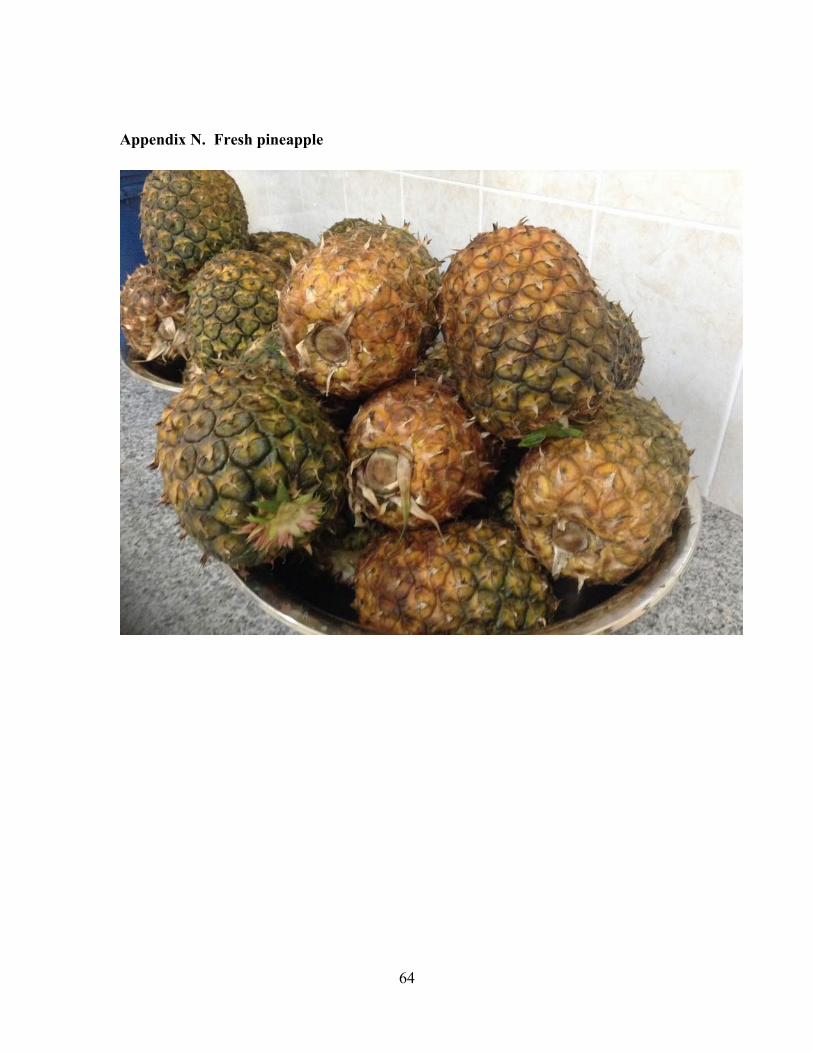
64
Appendix N. Fresh pineapple
65
Appendix O. Fresh carrot
66
Appendix P. Fresh mango

67
Appendix Q. Processing of pineapple to extract juice.
68
Appendix R. Alcohol fermentation

69
Appendix S. Acetic fermentation

70
Appendix T. Sample collection
71
Appendix U. Control vinegar
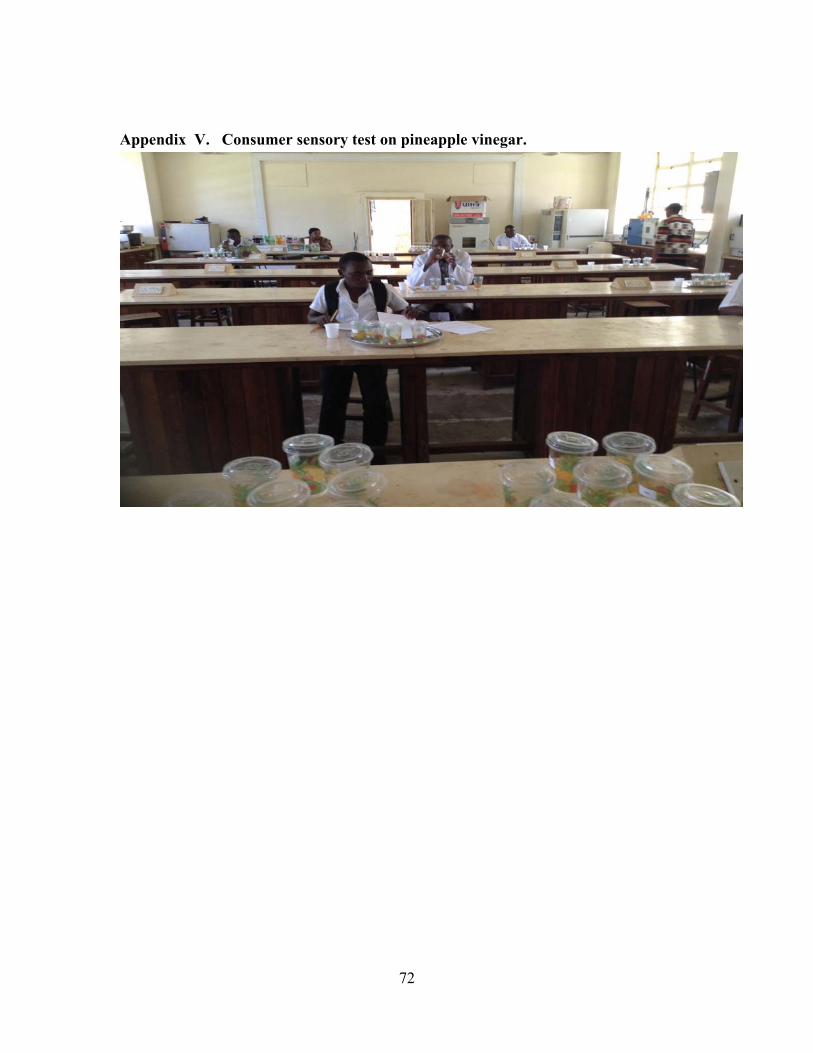
72
Appendix V. Consumer sensory test on pineapple vinegar.
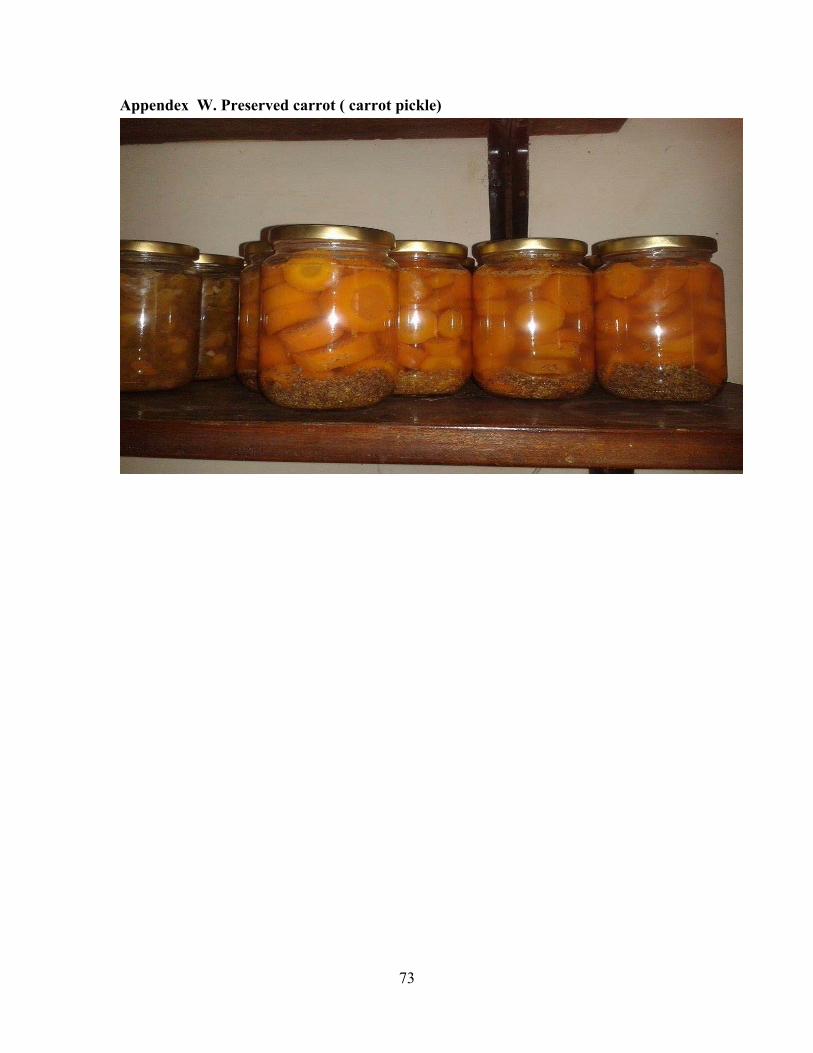
73
Appendex W. Preserved carrot ( carrot pickle)

74
Appendix X. Preserved mango (mango chutney).

75
Appendix Y. Consumer sensory test on carrot pickle and mango chutney