Embed Size (px)
Citation preview

Pilot and Air Traffic Controller useof Interval Management duringTerminal Metering Operations
Randall S. BoneAndrew S. Mendolia
January 2018
M T R 1 7 0 5 7 0
M I T R E T E C H N I C A L R E P O R T
Sponsor: The Federal Aviation AdministrationDept. No.: P123Project No.: 0217RQ02-IMOutcome No.: 2PBWP Reference: 2-3.D.1-1, “Human FactorsHuman-in-the-loop (HITL) Simulation of theIM-S Integrated Operation Simulation Results(Final Report)”
©2018, The MITRE Corporation.All rights reserved.Approved for public release.Distribution unlimited.Case No.: 17-4761
McLean, VA

© The MITRE Corporation. All rights reserved
Approved By
Robert C. Strain, P123 DateDepartment Head
Elida C. Smith, H530 DatePortfolio Manager

© The MITRE Corporation. All rights reserved
iii
AbstractThis HITL simulation activity was designed to examine the integration of a relative spacingconcept (Interval Management [IM]) into a future absolute spacing terminal meteringenvironment provided by Terminal Sequencing and Spacing (TSAS). Air traffic controllers andflight crews utilized current day automation capabilities with enhancements for terminalmetering and IM to test the integration for acceptability and necessary spacing awarenessinformation. Both groups had different sets of spacing information that were examined acrossseveral traffic scenarios. The results indicate IM is compatible with terminal metering, but theappropriate controller and flight crew tools to support trust of IM should continue to beexamined. Concept and operational recommendations are made, including enhancements toIM-related displays.

© The MITRE Corporation. All rights reserved
iv
Executive SummaryA human-in-the-loop simulation involving air traffic controller and flight crews was conductedto examine the integration of Interval Management (IM) into a time-based, terminal meteringenvironment with Performance Based Navigation procedures. Time-based metering duringarrival operations is currently scheduled to the runway, but is only conducted in the en routeenvironment. However, the Federal Aviation Administration (FAA) plans to deploy capabilitiesand procedures to extend time-based metering into the terminal environment by 2019 viaTerminal Sequencing and Spacing (TSAS). IM introduces a new way for the controller to haveaircraft meet the terminal schedule, and the goal of the simulation was to test the integrationof the concepts for acceptability and the necessary spacing awareness information.
IM is a set of equipment capabilities and procedures for controllers and flight crews. Flight deckcapabilities are used to support a range of IM operations with a goal of managed inter-aircraftspacing. Ground tools can be used to support the set-up and monitoring of the IM operation. Toinitiate IM, the controller issues an IM clearance with the appropriate information such as theAssigned Spacing Goal (ASG) and the lead aircraft identification. The flight crew enters thatinformation into the flight deck IM equipment, which then provides speeds to fly to achieveand, if desired, maintain that ASG. Situation awareness information is also provided to assistthe flight crew in monitoring the progression of IM. The controller monitors the operation forspacing or separation issues and intervenes if any unusual spacing issues arise. Under normalconditions, the flight crew continues following the IM speeds and the controller continuesmonitoring the operation until the aircraft reaches the planned termination point, where thespacing goal is met. At this point, the flight deck IM equipment removes the IM speed from thedisplays and IM is nominally terminated.
IM improves spacing consistency and predictability by enabling flight crews to make morefrequent and efficient speed adjustments than are possible for a controller to provide usingonly a ground-based metering capability and voice communications. Achieving a consistent,low-variance spacing interval reduces the time interval between aircraft in a traffic flow, whichallows each aircraft to be spaced closer to a given separation standard. This enables increasedarrival throughput and sector or facility capacity.
During IM / relative spacing, the IM aircraft performs spacing adjustment relative to a leadaircraft. In absolute spacing with TSAS, spacing adjustments are made with respect to crossing aspecific location at a designated time, independent of the lead aircraft (once the schedule isfrozen). When using the TSAS tools during terminal metering, the controller actively issuesspeed instructions to aircraft to get them on schedule. During IM operations, flight crews flyspeeds generated by the flight deck equipment to achieve the ASG. While the IM aircraft isworking toward the ASG, it may not be clear to the controller how well the operation isprogressing or whether an aircraft will ultimately achieve the ASG and the underlying schedule.The controller may also find the absolute spacing information provided by TSAS to be confusingfor IM operations. This could cause the controller to be concerned about the IM aircraft andpotentially not trust or utilize IM, thereby reducing the expected benefits.

© The MITRE Corporation. All rights reserved
v
For flight crews, IM during terminal metering looks very similar to IM in other environmentsthat has been examined in past simulations. However, additional study of spacing awarenesstools for IM in this new environment was deemed necessary to help validate the minimumdisplay requirements being defined by avionics standards organizations such as RTCA. Pastwork has shown that certain features can support spacing awareness and others can causeconfusion. Additional work is necessary to finalize minimum requirements.
Some past work has examined IM and TSAS integration. This HITL builds on it by: increasing thepercentage of aircraft conducting IM, examining IM initiation in the terminal environment,integrating the IM algorithm defined in RTCA’s technical standards, and continued examinationof flight deck and ground human information requirements.
Nine air traffic controllers and 18 pilots conducted IM during terminal metering under differentconditions: the independent variables of display information for the controller (a basicimplementation with IM clearance information and IM status information, the basicimplementation plus an IM status visual cue, or the basic implementation plus an IM statusvisual cue and a spacing prediction) and pilot (a minimum implementation as specified instandards or a minimum plus enhancements), and role of the controller (feeder or final) andpilot. Controllers also experienced aircraft overtake conditions during IM that required anintervention, as well as conditions where aircraft were conducting IM prior to entering theterminal airspace.
IM operations during terminal metering was found acceptable by controllers and flight crews. Avast majority of IM operations were initiated and only a few were suspended or terminated bycontrollers. The IM / relative spacing operation was very similar to the behavior of controllerswho transition from an absolute spacing operation to a relative spacing operation in the laterstages of approach and landing during terminal metering operations.
All aircraft spent a majority of their flying time on the Area Navigation (RNAV) arrivals.However, IM aircraft spent more time on the RNAV arrivals (which indicated less time beingvectored) and had reduced spacing variance at the final approach fix when compared to non-IMaircraft. IM and non-IM aircraft met the expected performance baselines and goals.
Controller terminal metering tools did not appear to conflict with IM operations and severalappeared to provide useful information for IM aircraft. The basic controller IM tool set wasfound to be useful and helpful. The additional tools that were evaluated also appeared useful,though no clear trends for benefits were found. For the flight crew displays, the basic IM toolset (based on published minimum requirements) was found acceptable on several measures.However, trends for the enhanced tool set indicate that additional features may be useful andovercome issues if refined and implemented properly. Few to no comments were receivedabout a need for additional display features beyond the min or min+ tool sets.
While IM appeared to work well in this environment, some level of discomfort in IM wasobserved. Based on controller comments, this seemed to be related to not actively issuingspeeds to IM aircraft and thus not knowing what speeds would be flown and when. For flightcrews, the distrust seemed to be related uncertainty around the feasibility of the IM operation.Recommendations for addressing topics such as these are included in this report. Suggestions

© The MITRE Corporation. All rights reserved
vi
are also made for further work to understand and resolve additional issues. The results andrecommendations are intended to be used by the FAA and RTCA in developing IM operational,safety, performance, and interface requirements. The results will also inform the FAA’sdevelopment of ground requirements to enable IM operations in metering environments.

© The MITRE Corporation. All rights reserved
vii
AcknowledgmentsThis research was completed with funding from the Federal Aviation Administration (FAA) NextGeneration Air Transportation System (NextGen) Human Factors Division (ANG-C1) in supportof the Aircraft Certification (AIR) and the Flight Standards Service (AFS).
The authors thank the following people working for or supporting the FAA and NationalAeronautics and Space Administration (NASA):
FAA ANG-C1 office (Regina Bolinger) and the FAA Technical Sponsors (Doug Arbuckle,Usmaan Javed, Cathy Swider, Paul VonHoene, and Don Walker) for their technical reviewand comment on the simulation design and final report, as well as the support to run thissimulation.
Jeff Sparrow for his critical role in testing and reviewing scenarios, as well as controllertraining, which enabled smooth and successful data collection.
Tim Funari for FAA AJV-7 support of the preparation and data collection activities.
Wes Stoops for all his time spent testing and reviewing scenarios.
All participants in the concept evaluation activities prior to the simulation, including keyindividuals from National Air Traffic Controllers Association (NATCA) and the FAA.
Kurt Swieringa of NASA for on-going discussions about flight deck IM displays.
Bryan Barmore of NASA for on-going discussions about IM.
The authors would like to thank the following individuals from The MITRE Corporation:
The Aviation Integration Demonstration and Experimentation for Aeronautics (IDEA)Laboratory staff for their development, integration, testing, and data collection / reductionefforts.
o Key leads include Stuart Bowman, Dylan Drake, Alain Oswald, and Mitch Wynnyk.
Bill Penhallegon for on-going discussions and his detailed review of the simulationdesign and final report.
The pseudo-pilot volunteers for their time.
Lesley Weitz for on-going discussions and her help in integrating and explaining the IMsample algorithm.
Ian Levitt and the IMPAT Team for their inputs on ground system functionality.
Suzette Porter for all her help with recruiting pilots and entering questionnaire data.
Janet Harvey for her support in the final stages of the development of this document.
Finally, we thank all the pilot and controller participants for their time and valuable feedback aswell as the airlines and unions that supported the participants.

© The MITRE Corporation. All rights reserved
viii
Table of Contents1 Introduction ................................................................................................................ 1-12 Background ................................................................................................................. 2-1
2.1 Metering and TSAS........................................................................................................ 2-12.2 IM .................................................................................................................................. 2-4
2.2.1 IM Operational Overview........................................................................................ 2-42.2.2 IM Benefits.............................................................................................................. 2-5
2.2.2.1 Throughput Benefits ...................................................................................... 2-62.2.2.2 Other IM Benefits......................................................................................... 2-11
2.3 PBN and RNP RF Turns ................................................................................................2-122.4 IM and Metering ......................................................................................................... 2-13
2.4.1 Past Research on IM and En Route Metering ....................................................... 2-132.4.2 Past Research on IM and Terminal Metering with TSAS ...................................... 2-14
2.4.2.1 NASA ATD-1 Concept of Operations ............................................................ 2-142.4.2.2 NASA ATD-1 Controller HITLs....................................................................... 2-142.4.2.3 MITRE Concept Evaluation Activities ........................................................... 2-17
2.5 Study Purpose and Design .......................................................................................... 2-182.5.1 ATC Topics............................................................................................................. 2-18
2.5.1.1 IM Operations Relative to TSAS Slot Markers ............................................. 2-182.5.1.2 IM Status Information on ATC Surveillance Displays................................... 2-192.5.1.3 IM Clearance Information on ATC Surveillance Displays............................. 2-242.5.1.4 ATC Research Needs .................................................................................... 2-27
2.5.2 Flight Deck Topics ................................................................................................. 2-282.5.2.1 Flight Deck Display Spacing Information ..................................................... 2-28
2.5.2.1.1 EUROCONTROL Research......................................................................... 2-282.5.2.1.2 NASA Research......................................................................................... 2-312.5.2.1.3 MITRE Research ....................................................................................... 2-45
2.5.2.2 Flight Deck Display Spacing Information Research Needs........................... 2-503 Method ....................................................................................................................... 3-1
3.1 Simulation Environment ............................................................................................... 3-13.1.1 Flight Deck Workstation.......................................................................................... 3-1
3.1.1.1 CDTI ................................................................................................................ 3-3

© The MITRE Corporation. All rights reserved
ix
3.1.1.2 CDTI Traffic Display and AGD During CDTI States / Alerts ............................. 3-83.1.2 IM Sample Algorithm ............................................................................................ 3-143.1.3 ATC Workstation ................................................................................................... 3-17
3.1.3.1 STARS ........................................................................................................... 3-173.1.3.2 TSAS Interface .............................................................................................. 3-193.1.3.3 IM Interface.................................................................................................. 3-22
3.1.3.3.1 IM Clearance Window.............................................................................. 3-243.1.3.3.2 Other IM Information on the STARS Display ........................................... 3-273.1.3.3.3 Slot Marker Color Change ........................................................................ 3-343.1.3.3.4 Controller Tool Sets for Evaluation .......................................................... 3-35
3.1.4 Pseudo-Pilot Workstation ..................................................................................... 3-353.1.5 Airspace................................................................................................................. 3-373.1.6 Traffic .................................................................................................................... 3-41
3.2 Participants ................................................................................................................. 3-433.3 IM Operations ............................................................................................................. 3-44
3.3.1 Procedures ............................................................................................................ 3-443.3.2 Communications ................................................................................................... 3-45
3.4 Simulation Procedures................................................................................................3-463.4.1 Controller Training ................................................................................................3-473.4.2 Pilot Training and Data collection......................................................................... 3-48
3.5 Experimental Design ................................................................................................... 3-493.6 Data Collection............................................................................................................ 3-52
4 Results ........................................................................................................................ 4-14.1 Analysis Method ........................................................................................................... 4-1
4.1.1 Subjective Data ....................................................................................................... 4-14.1.2 Objective Data......................................................................................................... 4-54.1.3 Statistical Method and Results ............................................................................... 4-6
4.1.3.1 Hypothesis 1: Flight Crews will Achieve and Maintain Spacing Better with theMin+ Tool Set as Compared to the Min Tool Set............................................................. 4-84.1.3.2 Hypothesis 2: Flight Crews will Comply with More IM Speeds with the Min+Tool Set as Compared to the Min Tool Set ...................................................................... 4-84.1.3.3 Hypothesis 3: Flight Crews will Find the Min+ Tool Set More Acceptable thanthe Min Tool Set............................................................................................................... 4-9

© The MITRE Corporation. All rights reserved
x
4.1.3.4 Hypothesis 4: Controllers Will Find the New Display Elements for IM Useful asCompared to Only the Basic ............................................................................................ 4-9
4.1.4 Summary Data....................................................................................................... 4-104.2 Terminal Metering Only Operations (Baseline) .......................................................... 4-124.3 Integrated Ground Operations ................................................................................... 4-134.4 IM Operations Conduct...............................................................................................4-15
4.4.1 IM Initiation........................................................................................................... 4-154.4.2 IM Suspensions ..................................................................................................... 4-184.4.3 Controller IM Terminations .................................................................................. 4-194.4.4 Flight Crew Reports of Unable .............................................................................. 4-234.4.5 IM Speeds and Flight Crew Actions ...................................................................... 4-23
4.4.5.1 Frequency of IM Speed Changes ................................................................. 4-244.4.5.2 Magnitude of IM speeds .............................................................................. 4-274.4.5.3 IM Speed Reversals ...................................................................................... 4-284.4.5.4 IM Speed Increases ...................................................................................... 4-294.4.5.5 Time Between IM Speed Changes and DTG ................................................ 4-304.4.5.6 Compliance with IM Speeds......................................................................... 4-324.4.5.7 IM Speed Conformance Monitoring Advisory ............................................. 4-33
4.5 Aircraft Spacing and Separation ................................................................................. 4-354.5.1 Schedule Conformance......................................................................................... 4-364.5.2 Aircraft Position as Related to Slot Markers......................................................... 4-37
4.5.2.1 Absolute Slot Marker Deviation................................................................... 4-374.5.2.2 Aircraft Time in Slot Markers ....................................................................... 4-404.5.2.3 Relative Slot Marker Deviation .................................................................... 4-41
4.5.3 Spacing Error ......................................................................................................... 4-454.5.4 Maintenance of the ASG....................................................................................... 4-484.5.5 Events Below Separation Standard....................................................................... 4-49
4.6 IM During Terminal Metering Acceptability ...............................................................4-504.6.1 Traffic Spacing Awareness and Acceptability ....................................................... 4-534.6.2 Workload............................................................................................................... 4-624.6.3 Controller Acceptability Rating Scale.................................................................... 4-65
4.7 Displays ....................................................................................................................... 4-664.7.1 Air Traffic Controllers............................................................................................ 4-66

© The MITRE Corporation. All rights reserved
xi
4.7.2 Flight Crew ............................................................................................................ 4-734.8 Roles and Responsibilities........................................................................................... 4-804.9 Time on RNAV Arrival.................................................................................................. 4-804.10 Communications ......................................................................................................... 4-814.11 En Route Initiation ...................................................................................................... 4-834.12 Simulation Assessment ...............................................................................................4-86
5 Discussion ................................................................................................................... 5-15.1 IM During Terminal Metering ....................................................................................... 5-15.2 IM Conduct.................................................................................................................... 5-2
5.2.1 Controllers............................................................................................................... 5-25.2.2 Flight Crew .............................................................................................................. 5-3
5.3 Aircraft Spacing and Separation ................................................................................... 5-35.4 Displays ......................................................................................................................... 5-5
5.4.1 Controllers............................................................................................................... 5-55.4.2 Pilots........................................................................................................................ 5-6
5.5 Communications ........................................................................................................... 5-85.6 IM Benefits.................................................................................................................... 5-9
6 Recommendations ...................................................................................................... 6-16.1 IM During Terminal Metering General Acceptability ................................................... 6-16.2 Aircraft Spacing and Separation ................................................................................... 6-26.3 Displays ......................................................................................................................... 6-3
6.3.1 Controllers............................................................................................................... 6-36.3.2 Pilots........................................................................................................................ 6-4
6.4 Communications ........................................................................................................... 6-66.5 Benefits ......................................................................................................................... 6-6
7 References .................................................................................................................. 7-1Appendix A IM Validity and Feasibility Checks.................................................................A-1
A.1 Validity Checks ..............................................................................................................A-1A.2 Feasibility Checks ..........................................................................................................A-2
A.2.1 Dependent Feasibility Checks .................................................................................A-2A.2.2 Independent Feasibility Checks ..............................................................................A-4
Appendix B Post-Scenario Questionnaires....................................................................... B-1B.1 Controller Baseline Post-Scenario Questionnaire ........................................................B-1

© The MITRE Corporation. All rights reserved
xii
B.3 Controller IM Post-Scenario Questionnaire..................................................................B-7B.5 Pilot Baseline Post-Scenario Questionnaire ...............................................................B-14B.7 Pilot IM Post-Scenario Questionnaire.........................................................................B-17
Appendix C Post-Simulation Questionnaires ................................................................... C-1C.1 Controller Post-Simulation Questionnaire ...................................................................C-1C.3 Pilot Post-Simulation Questionnaire...........................................................................C-14
Appendix D Descriptions of Objective Measures..............................................................D-1D.1 IM Operations Conduct.................................................................................................D-1D.2 IM Speeds and Flight Crew Actions ..............................................................................D-1D.3 Aircraft Spacing and Separation ...................................................................................D-3
Appendix E Relative Slot Marker Analysis Detail ............................................................. E-1Appendix F Acronyms and Abbreviations........................................................................ F-1

© The MITRE Corporation. All rights reserved
xiii
List of FiguresFigure 2-1. Sample Graphical Depiction of Terminal Metering Operations ................................ 2-3Figure 2-2. Sample TSAS Prototype Tools.................................................................................... 2-3Figure 2-3. Absolute (Top) and Relative (Bottom) Spacing Operations Utilization of
Aircraft Spacing Error Distributions......................................................................... 2-6Figure 2-4. Various IAT SD Distributions Relative to the Separation Standard ........................... 2-8Figure 2-5. Spacing Distribution of Aircraft at the FAF with an En Route Metering
Capability Alone (Blue Line) and an En Route Metering Capability with IM(Green Line) [Reprinted from Rognin et al., 2005].................................................. 2-9
Figure 2-6. Spacing Error at the Runway without IM (Blue Line) and with IM (Red Line)[Reprinted from Prevot et al., 2007] ....................................................................... 2-9
Figure 2-7. Throughput Increase Relative to the IM Equipage / IM Operation Rate ................ 2-10Figure 2-8. EUROCONTROL IM Controller Information [Reprinted from Aligne et al.,
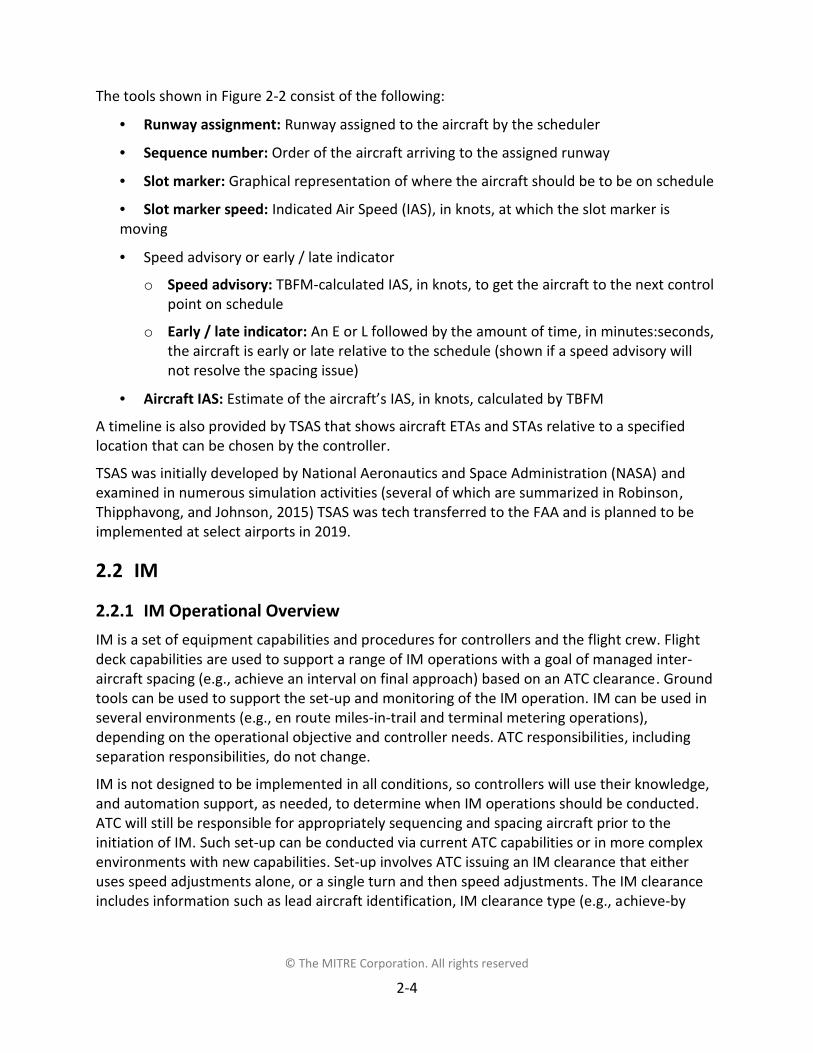
2003]...................................................................................................................... 2-20Figure 2-9. MITRE IM Controller Data Block Information [Reprinted from Benson et al.,
2011]...................................................................................................................... 2-21Figure 2-10. MITRE IM Controller Data Block Information [Reprinted from Peterson et
al., 2012] ................................................................................................................ 2-22Figure 2-11. Center Controller Data Block Information from Callantine et al. (2013)
[Reprinted from Callantine et al., 2013]................................................................2-23Figure 2-12. TRACON Controller Data Block Information from Callantine et al. (2013)
[Reprinted from Callantine et al., 2013]................................................................2-24Figure 2-13. MITRE IM Window Controller Information [Reprinted from Benson et al.,
2011]...................................................................................................................... 2-26Figure 2-14. Navigation Display with IM Information from Hebraud, Hoffman, Papin et
al. (2004) First Evaluation [Reprinted from Hebraud, Hoffman, Papin et al.,2004]...................................................................................................................... 2-29
Figure 2-15. Navigation Display with IM Information from Hebraud, Hoffman, Papin etal. (2004) Second Evaluation [Reprinted from Hebraud, Hoffman, Papin etal., 2004] ................................................................................................................ 2-30
Figure 2-16. Spacing Scale from Hebraud, Hoffman, Papin et al. (2004) SecondEvaluation and Hebraud, Hoffman, Pene et al. (2004) [Reprinted fromHebraud, Hoffman, Pene et al., 2004]................................................................... 2-30
Figure 2-17. Primary Flight Display (PFD) and Navigation Display with IM Features fromOseguera-Lohr et al. (2002) [Reprinted from Baxley et al., 2014] ........................ 2-32
Figure 2-18. IM Features on the CDTI from NASA (2004). [Reprinted from NASA, 2004] ........ 2-33Figure 2-19. PFD and Navigation Display with IM Features from Barmore et al. (2005)
[Reprinted from Baxley et al., 2014 (Highlights Added)] ...................................... 2-34Figure 2-20. PFD and Navigation Display with IM Features Implementation 1 from
Murdoch et al. (2009) [Reprinted from Baxley et al., 2014] ................................. 2-35Figure 2-21. PFD and Navigation Display with IM Features Implementation 2 from
Murdoch et al. (2009) [Reprinted from Baxley et al., 2014] ................................. 2-35

© The MITRE Corporation. All rights reserved
xiv
Figure 2-22. PFDs with IM Features from Baxley et al. (2013) [Reprinted from Baxley etal., 2013] ................................................................................................................ 2-36
Figure 2-23. Navigation Display with IM Features from Baxley et al. (2013) [Reprintedfrom Baxley et al., 2013]........................................................................................ 2-36
Figure 2-24. AGD with IM Features from Kibler et al. (2015) [Reprinted from Kibler et al.,2015]...................................................................................................................... 2-38
Figure 2-25. CDTI Traffic Display with IM Features from Kibler et al. (2015) [Reprintedfrom Kibler et al., 2015]......................................................................................... 2-38
Figure 2-26. PFD and Navigation Display with IM Features from Latorella (2015)[Reprinted from Baxley et al., 2014] ..................................................................... 2-39
Figure 2-27. CDTI Traffic Display and AGD with IM Features from Latorella (2015)[Reprinted from Baxley et al., 2014] ..................................................................... 2-40
Figure 2-28. Numeric AGD with IM Features from Swieringa et al. (2014) [Reprinted fromBaxley et al., 2014] ................................................................................................2-41
Figure 2-29. Graphic AGD with IM Features from Swieringa et al. (2014) [Reprinted fromBaxley et al., 2014] ................................................................................................2-41
Figure 2-30. CDTI Traffic Display with IM Features from Baxley et al. (2016) [Reprintedfrom Baxley et al., 2016]........................................................................................ 2-43
Figure 2-31. Graphic AGD with IM Features from Baxley et al. (2016) [Reprinted fromBaxley et al., 2016] ................................................................................................2-43
Figure 2-32. Early / Late (Progress) Indicator When Greater than 210 Seconds from ABP(Left) and within 210 Seconds from ABP (Right) [Reprinted from Baxley etal., 2016] ................................................................................................................ 2-44
Figure 2-33. CDTI Traffic Display with IM Features from Bone and Penhallegon (2006) .......... 2-46Figure 2-34. AGD with IM Features from Bone and Penhallegon (2006) .................................. 2-46Figure 2-35. CDTI Traffic Display with IM Features from Penhallegon et al. (2011) ................. 2-48Figure 2-36. AGD with IM Features from Penhallegon et al. (2011) ......................................... 2-49Figure 3-1. Flight Deck Simulator................................................................................................. 3-2Figure 3-2. CDTI Traffic Display and AGD Locations .................................................................... 3-2Figure 3-3. Minimum Requirements for Feasibility Check and Progress Indicator ..................... 3-4Figure 3-4. Graphical Progress Indicator ..................................................................................... 3-5Figure 3-5. Graphical Progress Indicator Design / Behavior ........................................................ 3-5Figure 3-6. Speed Tape ................................................................................................................ 3-6Figure 3-7. CDTI Traffic Display with IM Information Labeled..................................................... 3-7Figure 3-8. AGD with IM Information Labeled............................................................................. 3-7Figure 3-9. CDTI Traffic Display and AGD During Awaiting Entry State ....................................... 3-8Figure 3-10. CDTI Traffic Display and AGD During Evaluate State............................................... 3-9Figure 3-11. CDTI Traffic Display and AGD During Execute State .............................................. 3-10Figure 3-12. CDTI Traffic Display and AGD During Execute State—IM Speed Conformance
Monitoring Status Visual Advisory ........................................................................ 3-11Figure 3-13. CDTI Traffic Display and AGD During Execute State—Feasibility Check Status
Indication............................................................................................................... 3-12Figure 3-14. CDTI Traffic Display and AGD During Suspend State ............................................. 3-13Figure 3-15. CDTI Traffic Display and AGD During Terminate State .......................................... 3-14

© The MITRE Corporation. All rights reserved
xv
Figure 3-16. IM Operation in the Achieve-by Stage .................................................................. 3-15Figure 3-17. STARS Keyboard..................................................................................................... 3-17Figure 3-18. STARS-Like Display................................................................................................. 3-18Figure 3-19. ATPA....................................................................................................................... 3-18Figure 3-20. Prototype TSAS Features on STARS ....................................................................... 3-19Figure 3-21. Prototype TSAS Timeline on STARS ....................................................................... 3-20Figure 3-22. RNP RF Turn Traffic Geometry............................................................................... 3-21Figure 3-23. IM Clearance States and Transitions ..................................................................... 3-23Figure 3-24. IM Clearance Window ........................................................................................... 3-25Figure 3-25. Prototype IM Features on STARS .......................................................................... 3-27Figure 3-26. IM Information in Trail Aircraft Data Block ........................................................... 3-29Figure 3-27. IM Information in Trail Aircraft Data Block When Transitioning to a No
Speed (NS) Solution ...............................................................................................3-30Figure 3-28. IM Information in Lead Aircraft Data Block........................................................... 3-32Figure 3-29. Pseudo-Pilot Interface (Simpilot)........................................................................... 3-36Figure 3-30. PHX Airport. ........................................................................................................... 3-37Figure 3-31. PHX-Like Airspace Overview: Arrival Procedures and Controller Airspace ........... 3-38Figure 3-32. Arrival Procedures ................................................................................................. 3-38Figure 3-33. Geometry Where RNAV Aircraft is Following RNP RF Turn Aircraft on the
Same Arrival........................................................................................................... 3-39Figure 3-34. Traffic Pairing Geometries .................................................................................... 3-40Figure 3-35. Sample IM Operations with the PTP and ABP Options ......................................... 3-41Figure 4-1. 100-Point Agreement Scale ....................................................................................... 4-1Figure 4-2. 100-Point Agreement Scale Agreement Rating Breakdown ..................................... 4-2Figure 4-3. Sample Summary Figure ............................................................................................ 4-3Figure 4-4. Symbols Used in the Summary Figures and Their Meaning ...................................... 4-4Figure 4-5. Sample Box and Whisker Plot Defined ...................................................................... 4-6Figure 4-6. Sample Heat Map ...................................................................................................... 4-6Figure 4-7. Controller Responses to Post-Scenario Statements on the Baseline Condition
without IM ............................................................................................................. 4-12Figure 4-8. Controller Responses to the Bedford Workload Rating for the Baseline................ 4-13Figure 4-9. Controller Responses for Controller Acceptance Rating Scale for the Baseline ..... 4-13Figure 4-10. Controller Ranking of Operations. Frequency by Category................................... 4-14Figure 4-11. Controller Average Ranking of Operations Relative to One Another ................... 4-14Figure 4-12. Controller Responses to “IM is compatible with terminal metering
operations”............................................................................................................ 4-15Figure 4-13. IM Initiation Locations for Both Achieve-by IM Clearance Types ......................... 4-17Figure 4-14. IM Initiation Locations for Capture then Maintain IM Clearance Type ................ 4-17Figure 4-15. Location of Controller Suspensions ....................................................................... 4-18Figure 4-16. IM Termination Locations for Both Achieve-by IM Clearance Types .................... 4-20Figure 4-17. IM Termination Locations for Capture then Maintain IM Clearance Type ........... 4-20Figure 4-18. Average Rate of IM Speeds per Minute for (a) Achieve-by and (b) Maintain
Stages..................................................................................................................... 4-25Figure 4-19. Distribution of IM Speeds for Achieve-by Stage with FAF / YOKXO as ABP .......... 4-26

© The MITRE Corporation. All rights reserved
xvi
Figure 4-20. Distribution of IM Speeds for Achieve-by Stage with Merge / DERVL as ABP ...... 4-26Figure 4-21. Distribution of IM Speeds for Maintain Stage ....................................................... 4-26Figure 4-22. Distribution of IM Speed Change Magnitude with (a) FAF / YOKXO as ABP
and (b) Merge / DERVL as ABP .............................................................................. 4-27Figure 4-23. IM Speed Reversal Locations for (a) the Min and (b) the Min+ Tool Sets............. 4-28Figure 4-24. IM Speed Reversal Locations for (a) Achieve-by and (b) Maintain Stages............ 4-29Figure 4-25. Scatterplot of Time Between IM Speeds and Distance to the PTP with FAF /
YOKXO as ABP (Achieve-by Clearance Type)......................................................... 4-31Figure 4-26. Scatterplot of Time between IM Speeds and Distance to the PTP with Merge
/ DERVL as ABP (Achieve-by then Maintain Clearance Type) ...............................4-31Figure 4-27. Mean Duration of IM Speed Presentation Time as Related to Compliance ......... 4-33Figure 4-28. IM Speed Conformance Monitoring Advisory Locations for the (a) Min Tool
Set and (b) Min+ Tool Set ...................................................................................... 4-34Figure 4-29. IM Speed Conformance Monitoring Advisory Locations for the (a) Achieve-
by and (b) Maintain Stages of the Achieve-by then Maintain Clearance Type..... 4-34Figure 4-30. Schedule Deviation at Constraint Points ...............................................................4-37Figure 4-31. Aircraft Slot Marker Center Deviation in Mean Seconds for Feeder
Controller Airspace ................................................................................................4-39Figure 4-32. Aircraft Slot Marker Center Deviation in Mean Seconds at Handoff from
Feeder to Final Controller...................................................................................... 4-39Figure 4-33. Aircraft Slot Marker Center Deviation in Mean Seconds for Final Controller
Airspace ................................................................................................................. 4-40Figure 4-34. Lead and Trail Position Relative to Slot Markers When the Lead Aircraft was
Ahead of its Slot Marker Center (Feeder Airspace and Handoff) ......................... 4-42Figure 4-35. Lead and Trail Position Relative to Slot Markers When the Lead Aircraft was
Ahead of its Slot Marker Center (Final Airspace, DERVL, and YOKXO) ................. 4-43Figure 4-36. Lead and Trail Position Relative to Slot Markers When the Lead Aircraft was
Behind its Slot Marker Center (Feeder Airspace and Handoff)............................. 4-44Figure 4-37. Lead and Trail Aircraft Position Relative to Slot Markers When the Lead
Aircraft was Behind its Slot Marker Center (Final Airspace, DERVL, andYOKXO)................................................................................................................... 4-45
Figure 4-38. Spacing Error Distribution for IM and Non-IM Aircraft at DERVL ......................... 4-47Figure 4-39. Spacing Error Distribution for IM Aircraft by IM Clearance Type and Non-IM
at YOKXO................................................................................................................ 4-47Figure 4-40. Spacing Error Distribution for IM Aircraft at DERVL.............................................. 4-48Figure 4-41. Spacing Error Distribution for IM Aircraft by IM Clearance Type at YOKXO ......... 4-48Figure 4-42. Location Where an Aircraft was Below the Applicable Separation Standard ....... 4-49Figure 4-43. Controller Responses to Post-Scenario Statement “Given the appropriate
training, IM during terminal metering is operationally acceptable” .................... 4-50Figure 4-44. Pilot Responses to Post-Scenario Statement “Given the appropriate
training, IM is operationally acceptable” .............................................................. 4-51Figure 4-45. Summary of Controller and Pilot Responses on IM Desirability and
Acceptability Statements....................................................................................... 4-52

© The MITRE Corporation. All rights reserved
xvii
Figure 4-46. Controller and Pilot Responses to “My level of traffic awareness wasacceptable”............................................................................................................ 4-53
Figure 4-47. Controller Responses to Post-Scenario Statement “I was confident that thespacing of the aircraft would remain outside my separation requirement” ........ 4-54
Figure 4-48. Controller Responses to Post-Scenario Statement “I was able to detectwhen spacing / separation issues were developing for aircraft”.......................... 4-55
Figure 4-49. Pilot Responses to Post-Scenario Statement “I could detect whether I wouldremain within tolerances to achieve and maintain the assigned spacinggoal”....................................................................................................................... 4-56
Figure 4-50. Summary of Controller and Pilot Responses on Spacing AcceptabilityStatements............................................................................................................. 4-58
Figure 4-51. Controller Responses to “There were an acceptable number of aircraftperforming IM”...................................................................................................... 4-59
Figure 4-52. Controller Responses to “There were an acceptable number of aircraftperforming IM… What percentage and above is reasonable?” ............................ 4-59
Figure 4-53. Summary of Controller and Pilot Responses on IM Trust Statements.................. 4-60Figure 4-54. Pilot Responses to “Did you ever try to “out-guess” the IM algorithm and
the IM speeds?”..................................................................................................... 4-61Figure 4-55. Pilot Responses to “Did you choose not to fly an IM speed?” .............................. 4-61Figure 4-56. Controller and Pilot Response Means to the Bedford Workload Rating .............. 4-63Figure 4-57. Summary of Pilot Responses on Workload Statements........................................ 4-64Figure 4-58. Controller Response Means to Controller Acceptance Rating Scale..................... 4-65Figure 4-59. Controller Responses to Post-Scenario Statement “I had the necessary
display elements for conducting IM operations”.................................................. 4-67Figure 4-60. Controller Responses to “The terminal metering elements were helpful for
the IM and non-IM aircraft” .................................................................................. 4-69Figure 4-61. Summary of Controller Responses on IM Display Element Statements ............... 4-71Figure 4-62. Controller Responses to “How did aircraft conducting IM during terminal
metering effect your need to monitor traffic?” .................................................... 4-72Figure 4-63. Controller Responses to “The necessary aircraft monitoring was acceptable” .... 4-72Figure 4-64. Summary of Pilot Responses on Min Display Element Statements ...................... 4-73Figure 4-65. Summary of Pilot Responses on Min+ Display Element Statements .................... 4-74Figure 4-66. Pilot Responses to Post-Scenario Statement “I had the necessary display
elements for conducting IM” ................................................................................ 4-75Figure 4-67. Pilot Responses to “Did the combination of both the AGD and CDTI
implementations include all the information necessary for you to conductIM?” ....................................................................................................................... 4-76
Figure 4-68. Pilot Responses to “Did you find any elements on the displays to beconfusing or misleading?” ..................................................................................... 4-76
Figure 4-69. Pilot Responses to “Considering total time on the IM displays, estimate thetotal percentage of time using each display”........................................................ 4-77
Figure 4-70. Summary of Pilot Responses on the Instrument Scan .......................................... 4-78Figure 4-71. Summary of Pilot Responses to Display Acceptability Statements ....................... 4-79

© The MITRE Corporation. All rights reserved
xviii
Figure 4-72. Summary of Controller and Pilot Responses on Role and ResponsibilitiesStatements............................................................................................................. 4-80
Figure 4-73. Summary of Controller and Pilot Responses on Phraseology Statements............ 4-81Figure 4-74. Controller and Pilot Responses to “Did you have any issues during
communications when the lead aircraft call sign was used?” .............................. 4-82Figure 4-75. Controller Responses to Post-Scenario Statements on En Route Initiation.......... 4-84Figure 4-76. Controller Responses to the Bedford Workload Rating for En Route
Initiation ................................................................................................................ 4-85Figure 4-77. Controller Responses for Controller Acceptance Rating Scale for En Route
Initiation ................................................................................................................ 4-85Figure 4-78. Summary of Controller and Pilot Responses on Simulation Assessment
Statements............................................................................................................. 4-86
Figure A-1. Trail and Lead Aircraft Independent Feasibility Criteria Example.............................A-2Figure A-2. Feasibility Criteria When Greater than 30 NM / 7 Minutes from the ABP ...............A-3Figure A-3. Trail and Lead Aircraft Independent Feasibility Criteria Example.............................A-4Figure D-1. Slot Marker Deviation ...............................................................................................D-4Figure E-1. Relative Slot Marker Deviation at Various Airspace Locations When Lead
Aircraft was Ahead of its Slot Marker Center.......................................................... E-2Figure E-2. Relative Slot Marker Deviation at Various Airspace Locations When Lead
Aircraft was Behind its Slot Marker Center ............................................................. E-4

© The MITRE Corporation. All rights reserved
xix
List of TablesTable 2-1. Metering Capabilities and the Associated IAT SDs ..................................................... 2-7Table 2-2. NASA ATD-1 TSAS and IM Controller HITL Simulations ............................................ 2-15Table 3-1. STARS IM Prototype Controller Input Commands.................................................... 3-24Table 3-2. Summary of Displayed IM Information in the IM Clearance Window and
Aircraft Data Blocks ...............................................................................................3-33Table 3-3. Controller and Pilot Grouping and Daily Activities ................................................... 3-46Table 3-4. Independent Variables.............................................................................................. 3-49Table 3-5. Flight Crew Independent Variable Exposure by Traffic File and Run ....................... 3-50Table 3-6. Controller Independent Variable Exposure by Day, Traffic File, and Run ................ 3-51Table 3-7. Data Collection Day Details....................................................................................... 3-52Table 4-1. List of Hypotheses and Statistical Tests ...................................................................... 4-7Table 4-2. Mean Spacing Error in Seconds (SD) for Participant Flight Crews.............................. 4-8Table 4-3. Number of Planned and Analyzed Runs per Scenario Type ..................................... 4-10Table 4-4. Aircraft Participants Across Scenarios Types............................................................ 4-10Table 4-5. IM Initiation Sequence.............................................................................................. 4-11Table 4-6. Frequency of IM Operations by IM Initiation Location and IM Clearance Type ...... 4-11Table 4-7. Frequency of IM Operations by Controller Tool Set and IM Clearance Type........... 4-11Table 4-8. Frequency of IM Initiations as a Percentage of the Sample ..................................... 4-15Table 4-9. Frequency of IM Proposals Rejected ........................................................................ 4-16Table 4-10. IM Initiation Delay in Mean Seconds (SD) .............................................................. 4-16Table 4-11. IM Initiation Location as a Percentage of the Sample............................................ 4-18Table 4-12. Frequency of IM Suspensions by Suspension Reason and Subsequent Action...... 4-19Table 4-13. Mean Time to Resume or Terminate in Seconds (SD) after IM Suspension .......... 4-19Table 4-14. Percentage (and Frequency) of IM Terminations................................................... 4-19Table 4-15. Frequency of IM Termination Actions .................................................................... 4-21Table 4-16. Mean Time to Terminate after Initiation in Seconds (SD) ...................................... 4-21Table 4-17. Frequencies for Reasons for Controller IM Termination........................................ 4-22Table 4-18. Frequencies and Reasons for Participant Flight Crew Reports of Unable IM ........ 4-23Table 4-19. Total Frequency of IM Speeds ................................................................................ 4-24Table 4-20. Average Number of IM Speeds (SD) ....................................................................... 4-24Table 4-21. Average Rate of IM Speeds (SD) per Minute .......................................................... 4-25Table 4-22. Mean Speed Change Magnitude (SD) in Knots by Flight Crew Tool Set and
Achieve-by then Maintain Stage ........................................................................... 4-27Table 4-23. Percentage of Speed Reversals............................................................................... 4-28Table 4-24. Percentage of Speed Increases............................................................................... 4-29Table 4-25. Mean Time in Seconds (SD) Between IM Speeds ................................................... 4-30Table 4-26. Percentage of IM Speed Compliance...................................................................... 4-32Table 4-27. Mean Duration (SD) of IM Speed Presentation Time (in Seconds) as Related
to Compliance........................................................................................................ 4-32Table 4-28. Percentage of IM Speed Conformance Monitoring Advisories .............................. 4-33

© The MITRE Corporation. All rights reserved
xx
Table 4-29. Percentage of IM Speed Conformance Monitoring Advisories Inside theMOPS No Advisory Threshold (Should Not have been Triggered per DO-316[RTCA, 2015a]) ....................................................................................................... 4-35
Table 4-30. Percentage of IM Speed Conformance Monitoring Advisories Outside theMOPS No Advisory Threshold (Should have been Triggered per DO-316[RTCA, 2015a]) ....................................................................................................... 4-35
Table 4-31. Schedule Deviation in Seconds (SD) at Constraint Points ...................................... 4-36Table 4-32. Aircraft Slot Marker Center Deviation in Mean Seconds (SD) and NM (SD) .......... 4-38Table 4-33. Percentage of Time Aircraft were in Slot Markers ................................................. 4-40Table 4-34. Mean Spacing Error in Seconds (SD) at Two Points................................................ 4-46Table 4-35. Aircraft Role and Performance Baseline / Goal Achievement................................4-46Table 4-36. Percentage of Time IM Aircraft were within 10 Seconds of the ASG (95%
Performance Goal) During the Maintain Stage ..................................................... 4-49Table 4-37. Mean (SD) Controller Response to Post-Scenario Statement “Given the
appropriate training, IM during terminal metering is operationallyacceptable” for TRACON IM Initiation................................................................... 4-50
Table 4-38. Mean (SD) Pilot Response to Post-Scenario Statement “Given theappropriate training, IM is operationally acceptable” .......................................... 4-51
Table 4-39. Mean (SD) Controller Response to Post-Scenario Statement “I was confidentthat the spacing of the aircraft would remain outside my separationrequirement” ......................................................................................................... 4-54
Table 4-40. Mean (SD) Controller Response to Post-Scenario Statement “I was able todetect when spacing / separation issues were developing for aircraft” .............. 4-55
Table 4-41. Mean (SD) Pilot Response to Post-Scenario Bedford Workload Rating Scale........ 4-62Table 4-42. Mean (SD) Controller Response to Post-Scenario Bedford Workload Rating
Scale....................................................................................................................... 4-62Table 4-43. Mean (SD) Controller Response to Post-Scenario Controller Acceptance
Rating Scale............................................................................................................ 4-65Table 4-44. Mean (SD) Controller Response to Post-Scenario Statement “I had the
necessary display elements for conducting IM operations” ................................. 4-66Table 4-45. Mean (SD) Pilot Response to Post-Scenario Statement “I had the necessary
display elements for conducting IM” .................................................................... 4-75Table 4-46. Total Time in Seconds (SD) Aircraft were off the RNAV Path ................................. 4-80
Table D-1. Speed Reversal Determination Methodology............................................................D-2Table E-1. Lead and Trail Deviation in Mean Seconds (SD) Relative to Slot Markers When
the Lead Aircraft was Ahead of its Slot Marker Center........................................... E-1Table E-2. Lead and Trail Deviation in Mean NM (SD) Relative to Slot Markers When the
Lead Aircraft was Ahead of its Slot Marker Center ................................................. E-1Table E-3. Lead and Trail Deviation in Mean Seconds (SD) Relative to Slot Markers When
the Lead Aircraft was Behind its Slot Marker Center .............................................. E-3Table E-4. Lead and Trail Deviation in Mean NM (SD) Relative to Slot Markers When the
Lead Aircraft was Behind its Slot Marker Center .................................................... E-3
© The MITRE Corporation. All rights reserved
1-1
1 IntroductionPrior to the introduction of any new operation into the National Airspace System (NAS),Human-in-the-loop (HITL) simulations can be a tool used to reduce technical risk and answeroperational and conceptual questions that go beyond expert judgment. These simulations canbe especially valuable if new concepts are being introduced that have not yet been examinedfrom a perspective of integration with other systems.
The Federal Aviation Administration (FAA) plans to deploy capabilities and procedures toextend time-based metering into the terminal environment by 2019 via Terminal Sequencingand Spacing (TSAS). This will extend metering operations from en route into the terminal /Terminal Radar Approach Control (TRACON) environment. In the past, TRACON operations havebeen distance-based and tactical. Terminal metering introduces more structured arrivalprocedures and time-based spacing. Terminal metering is being designed to solve the problemsassociated with tactical control in the terminal airspace (e.g., increased time and distanceflown, leading to increased fuel burn). It is intended to keep aircraft on optimized routes longerthan would otherwise be possible and to enable shorten traffic patterns.
The FAA and industry are also developing flight deck requirements for a concept called IM, inwhich flight crews space relative to another aircraft based on an Air Traffic Control (ATC)clearance. This improves spacing consistency and predictability in both en route and terminalenvironments by enabling an aircraft to be spaced closer to a given separation standard. Thisincreases overall arrival throughput and capacity.
Interval Management (IM) and TSAS have been examined in numerous simulations asindependent concepts. However, these concepts will need to function together in the futureNAS environment. While some past work has examined integrated IM and TSAS operations, thisHITL builds on that work by examining several remaining open questions. The simulation willexamine how controllers should use the two spacing methods (relative and absolute) tomanage arrival aircraft in the terminal. During IM / relative spacing, the IM aircraft performsspacing adjustments relative to the lead aircraft. In absolute spacing with TSAS, spacingadjustments are made with respect to crossing a specific location at a designated time,independent of the lead aircraft (once the schedule is frozen). When using the TSAS toolsduring terminal metering, the controller actively issues speed instructions to aircraft asnecessary to get them on schedule. During IM operations, flight crews fly speeds generatedwithin the flight deck to achieve the Assigned Spacing Goal (ASG). The different spacingmethods and the impact on the controller and flight crew acceptability and informationrequirements required further study.
The document has six main sections, including this one. Section 2 – Background introduces theterminal metering and IM concepts and provides a review of past literature. Section 3 –Methods describes the simulation environment and how the simulation was conducted. Section4—Results provides the results of the data collection. Section 5—Discussion integrates theresults into an overall discussion of findings and conclusions. Section 6—Recommendationssuggests how the results should be considered by conceptual and technical flight deck andground requirements development activities.

© The MITRE Corporation. All rights reserved
2-1
2 BackgroundThe FAA expects to see continued traffic growth through 2030 with severe congestion at majorairports such as Hartsfield–Jackson Atlanta International Airport (KATL), O'Hare InternationalAirport (KORD), San Francisco International Airport (KSFO), and the New York City area airports(FAA, 2015). As part of the solution to address this growth, the FAA plans to implementNextGen enhancements such as Trajectory Based Operations (TBO) to manage future trafficdemands and to enable more efficient and environmentally-friendly navigation procedures(FAA, 2013). TBO operations utilize Performance Based Navigation (PBN) and time-basedmetering to increase efficiency and predictability.
PBN consists of stringent performance navigation requirements that enable accurate andpredictable flight paths. PBN is used to achieve benefits such as optimally-placed routes (e.g.,avoiding terrain) with reduced flight path length (FAA, 2016). Time-based metering managesflow rates of aircraft into constrained airspace by building a sequence and schedule withScheduled Times of Arrival (STAs) at specified points. Controllers provide instructions (oftenwith the help of automation) to aircraft to meet the schedule.
PBN and time-based metering are used together to develop an optimized trajectory (negotiatedbetween an airline and the FAA) that has accurate, predicted crossing times for specific pointswhich leads to more efficient operations for each individual flight (e.g., fewer tacticalmaneuvers and more time on optimized PBN routes), while predictably managing multipleflights in constrained airspace.
In addition to PBN and time-based metering, new and advanced tools are necessary to enableTBO. Multiple concepts (e.g., relative spacing and absolute spacing) and capabilities (e.g., flightdeck and ground capabilities to support metering and data link) that are being developedsomewhat independently will need to work together. Additionally, different types of tools (e.g.,controller decision support tools, Required Time of Arrival [RTA] / Time of Arrival Control[TOAC], IM) will need to be utilized to meet the time-based schedule. Not all tools, however,achieve the schedule in the same way or with the same level of accuracy. The appropriate toolneeds to be chosen to meet the desired goal and benefit.
2.1 Metering and TSASTime-based metering involves delivering aircraft at a specific point at a specific time. Time-based metering is currently conducted in en route arrival operations with a system called TimeBased Flow Management (TBFM). TBFM is used to synchronize multiple traffic flows and todeliver aircraft to the TRACON boundary on schedule. Area Navigation (RNAV) route data isused to build four-dimensional trajectories to determine runway assignments, the overall trafficsequence, and STAs for individual aircraft at specified points (including points near the TRACONboundary). Information is presented to the en route controller to meet the sequence andschedule developed by TBFM. While a schedule is built to the runway, metering currently stopsat the TRACON boundary. Once the aircraft are in the TRACON, TRACON controllers no longerhave the sequence and schedule information, so they must reevaluate the traffic situation andthen determine an appropriate sequence and schedule. TRACON controllers must maneuver

© The MITRE Corporation. All rights reserved
2-2
the aircraft without the sequence and schedule information, which can lead to inefficiencies.While delivering aircraft metered to the TRACON boundary can reduce fuel burn and increasetraffic capacity, further benefits can be realized if metering continues into the TRACON.
Terminal metering is intended to solve the problems associated with tactical control in theterminal airspace (e.g., increased time and distance flown, leading to increased fuel burn). It isintended to keep aircraft on optimized routes longer than would otherwise be possible and toenable shorten traffic patterns such as those enabled by Required Navigation Performance(RNP) Radius-to-Fix (RF) turns.
During terminal metering and while aircraft are still in the en route environment, EstimatedTimes of Arrival (ETAs) are calculated by TBFM at the meter fix (where aircraft cross intoterminal airspace), merge points, additional schedule constraints, and the runway threshold.ETAs are used to create a schedule and sequence with STAs to the control points to satisfyminimum spacing and wake separation requirements (with an additional buffer). The sequenceand schedule is frozen prior to the top-of-descent of the aircraft.
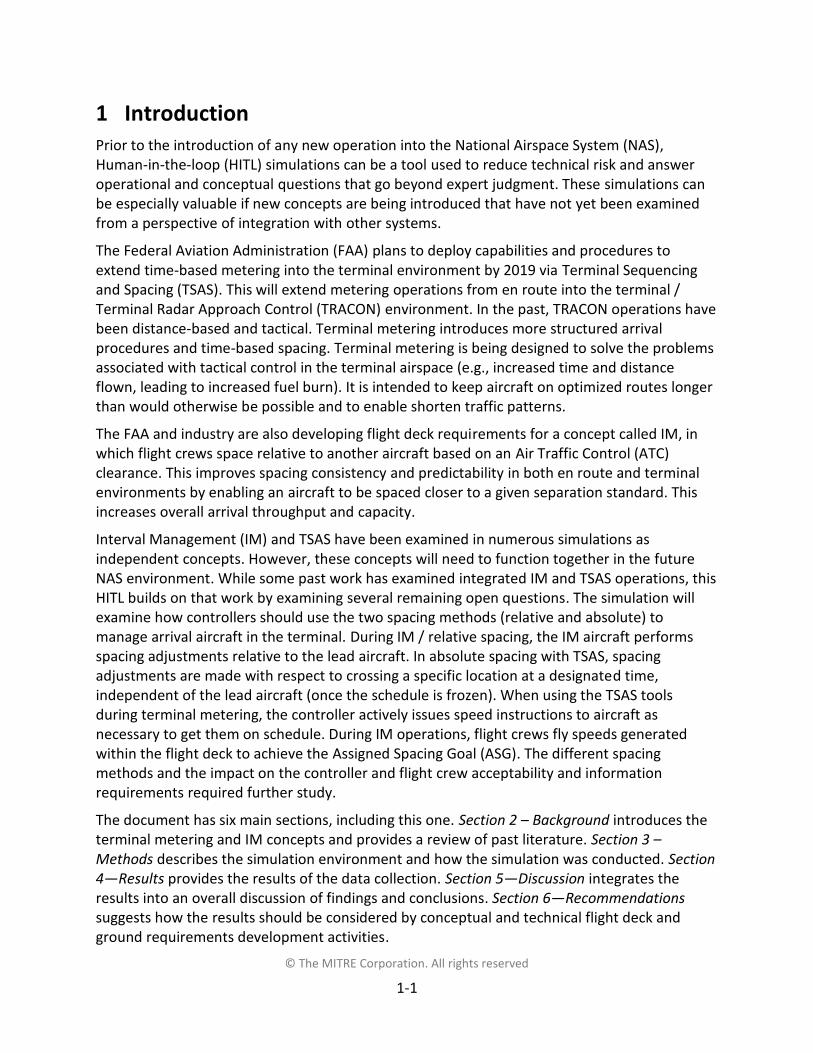
Aircraft are sequenced and maneuvered in the en route environment such that only speedsshould be required for aircraft to meet the schedule and remain on the PBN procedure inTRACON airspace. En route controllers use TBFM to precondition and deliver aircraft to theTRACON within some error tolerance. TRACON controllers then work to the schedule byprimarily using speed instructions to resolve any schedule issues. Figure 2-1 shows a sampleterminal metering operation. It shows multiple routes to the airport including some at themerge. Arriving aircraft are shown with runway and sequence assignments. A table is alsoshown with STAs that aircraft are expected to meet at the various merge points.

© The MITRE Corporation. All rights reserved
2-3
Figure 2-1. Sample Graphical Depiction of Terminal Metering Operations
Time-based terminal metering is enabled by TSAS. TSAS adds more sophisticated schedulingcomponents to TBFM and controller tools to Standard Terminal Automation ReplacementSystem (STARS). On STARS, TSAS displays both scheduling and sequence information to thecontroller. TSAS also provides decision support tools to help the controller meet the scheduleby getting aircraft to the appropriate points by the STA. Figure 2-2 shows a prototype set of theTSAS tools.
Figure 2-2. Sample TSAS Prototype Tools
Z
6AAL652090 24180 A26
21
220
Slot marker speed
Slot marker Sequence number
Runway assignment
Aircraft IASSpeed advisory orearly / late indicator
© The MITRE Corporation. All rights reserved
2-4
The tools shown in Figure 2-2 consist of the following:
Runway assignment: Runway assigned to the aircraft by the scheduler
Sequence number: Order of the aircraft arriving to the assigned runway
Slot marker: Graphical representation of where the aircraft should be to be on schedule
Slot marker speed: Indicated Air Speed (IAS), in knots, at which the slot marker ismoving
Speed advisory or early / late indicator
o Speed advisory: TBFM-calculated IAS, in knots, to get the aircraft to the next controlpoint on schedule
o Early / late indicator: An E or L followed by the amount of time, in minutes:seconds,the aircraft is early or late relative to the schedule (shown if a speed advisory willnot resolve the spacing issue)
Aircraft IAS: Estimate of the aircraft’s IAS, in knots, calculated by TBFM
A timeline is also provided by TSAS that shows aircraft ETAs and STAs relative to a specifiedlocation that can be chosen by the controller.
TSAS was initially developed by National Aeronautics and Space Administration (NASA) andexamined in numerous simulation activities (several of which are summarized in Robinson,Thipphavong, and Johnson, 2015) TSAS was tech transferred to the FAA and is planned to beimplemented at select airports in 2019.
2.2 IM
2.2.1 IM Operational OverviewIM is a set of equipment capabilities and procedures for controllers and the flight crew. Flightdeck capabilities are used to support a range of IM operations with a goal of managed inter-aircraft spacing (e.g., achieve an interval on final approach) based on an ATC clearance. Groundtools can be used to support the set-up and monitoring of the IM operation. IM can be used inseveral environments (e.g., en route miles-in-trail and terminal metering operations),depending on the operational objective and controller needs. ATC responsibilities, includingseparation responsibilities, do not change.
IM is not designed to be implemented in all conditions, so controllers will use their knowledge,and automation support, as needed, to determine when IM operations should be conducted.ATC will still be responsible for appropriately sequencing and spacing aircraft prior to theinitiation of IM. Such set-up can be conducted via current ATC capabilities or in more complexenvironments with new capabilities. Set-up involves ATC issuing an IM clearance that eitheruses speed adjustments alone, or a single turn and then speed adjustments. The IM clearanceincludes information such as lead aircraft identification, IM clearance type (e.g., achieve-by

© The MITRE Corporation. All rights reserved
2-5
then-maintain), ASG units (i.e., time or distance) and value (e.g., 90 seconds and 15 miles), andIM special points (e.g., Achieve-By Point [ABP] and Planned Termination Point [PTP]).
Once this information is provided to the flight crew, it is entered into the flight deck IMequipment. The equipment checks that the appropriate information has been entered for theoperation and that the lead aircraft is in surveillance range. If the lead aircraft is not insurveillance range, the system continues to search. Once the aircraft is in range, is on theexpected trajectory, and meets the necessary performance requirements, IM is initiated andthe equipment starts providing information (primarily the speed to fly, termed “IM speed”).Situation awareness information is also provided to assist the flight crew in monitoring theprogression of IM.
With the presentation of each new IM speed, the flight crew ensures that the IM speed iscompatible with the aircraft’s current configuration and environmental conditions. The flightcrew is expected to follow the IM speeds in a timely manner consistent with other cockpitduties unless other conditions (e.g., safety, operational, equipment, or regulatory issues)prevent doing so. If any of these issues arise, the flight crew will maintain their lastimplemented IM speed and contact ATC to report being unable to conduct IM. Similarly, if ATChas any conditions that prevent continued IM operations, the controller will contact the flightcrew and terminate or suspend IM. If the IM is suspended, the controller may choose to resumeIM at a later point, should the appropriate conditions exist. If no issues arise for either thecontroller or the flight crew causing a suspension or termination, the flight crew continuesfollowing the IM speeds and the controller continues monitoring the operation until the aircraftreaches the PTP. At this point, the flight deck IM equipment removes the IM speed from thedisplay and IM is terminated.
For additional information on the broader IM concept and preliminary requirements, see DO-361 and DO-328A (RTCA, 2015a, 2015b). These documents describe near-term operations;however, updates are being developed to enable more advanced operational implementationssuch as dependent runway operations. For further details on the IM capabilities utilized in thissimulation, see Sections 3.1.1 and 3.1.2.
2.2.2 IM BenefitsIM takes advantage of advances in technology to support current operations, and allows thecontroller to delegate the low-level, tactical spacing task to IM capable aircraft. Controllerscurrently try to achieve desired spacings by giving maneuver instructions to aircraft without theflight crews necessarily having an understanding of the goals. Instead of simply being able toassign a specific in-trail spacing goal, the controller has to provide several workload intensiveinstructions which include trial-and-error to determine the appropriate goal. By allowing flightcrews to achieve or maintain an ASG, controllers may be able to more efficiently managemerging aircraft and improve throughput. The remainder of this section will review the benefitsmechanism and summarize related results from past IM activities. It will also highlight otherexpected benefits.

© The MITRE Corporation. All rights reserved
2-6
2.2.2.1 Throughput BenefitsIM is a relative spacing operation, in which trajectory corrections are made relative to real-timebehavior of a lead aircraft (i.e., the lead aircraft’s ATA). This is in contrast to an absolute spacingoperation, such as time-based metering, in which an aircraft is controlled to cross a specificpoint at a designated time. IM is a tactical tool and the spacing objective can be based on anunderlying schedule, separation standard, or other operational need.
In an absolute spacing operation, the error distribution of both aircraft must be consideredwhen setting the schedule and spacing goals. This is because both aircraft achieve the scheduleindependently and could contribute to a spacing that encroaches on the minimum separationstandard. With IM, however, the error distribution of the lead aircraft does not need to beconsidered because the IM Aircraft is correcting for it. Therefore, a spacing goal for an IM paircan be closer than would otherwise be possible with absolute spacing alone (e.g., TOAC orterminal metering without IM). Figure 2-3 contrasts the error distributions that must beaccounted for in absolute (top diagram) and relative (bottom diagram) spacing operations.
Figure 2-3. Absolute (Top) and Relative (Bottom) Spacing Operations Utilization of AircraftSpacing Error Distributions

© The MITRE Corporation. All rights reserved
2-7
With the spacing goal set, IM can further be used to improve spacing consistency andpredictability by enabling flight crews to make more frequent and efficient speed adjustmentsthan are possible with ground-based metering and pilot-controller voice communications. Thisis because airborne equipment can provide more speeds than the ground to make trajectorycorrections. Also, since an aircraft will know its own trajectory more precisely than a groundsystem, the speeds will be generated using better information and will thus be more efficient.Setting, then achieving, a consistent, low-variance spacing interval reduces the time intervalbetween aircraft in a traffic flow, which allows each aircraft to be spaced closer to a givenseparation standard. This enables increased arrival throughput and sector or facility capacity.
The performance metric used by the FAA to measure delivery benefits is termed Inter-ArrivalTime (IAT). The IAT is defined as the difference in time when two consecutive aircraft cross acommon point. For example, if a lead aircraft crosses the runway threshold at 12:30:30 and atrail aircraft crosses the runway threshold at 12:31:50, the IAT is 80 seconds. A population ofIATs will have a Standard Deviation (SD) associated with it, which indicates the extent ofvariations in the IAT. Assuming a normal distribution, one SD will include 68% of the range ofIATs in the population. Table 2-1 shows the assumed one IAT SD at the Final Approach Fix (FAF)used to model benefits for different traffic management capabilities.
Table 2-1. Metering Capabilities and the Associated IAT SDs
Capability IAT SDNo metering (baseline) 18.01
En route metering 16.52
GIM-S and TSAS 12.03
IM 5.04
1. Singha and Haines (1975)
2. Spinoso, Coville, and Roberts (2014)
3. Weitz (2017)
4. DO-361 (RTCA, 2015a)
Ground-based Interval Management-Spacing (GIM-S)
Each added capability in the first column of Table 2-1 reduces the IAT variance, which meansthat aircraft can be placed closer together relative to a separation standard (i.e., a lowerspacing goal can be used), without an increase in the number of controller interventionsneeded to avoid separation violations.

© The MITRE Corporation. All rights reserved
2-8
Figure 2-4 illustrates how IAT SD distributions relate to a separation standard. For example, ifthe IAT SD is 12 seconds as with GIM-S and TSAS, aircraft will need to be spacing with an IAT ofapproximately 81 seconds to avoid an unacceptable number of controller interventions (asshown in the magenta distribution1). If a controller tries to space aircraft closer together andthe IAT SD is limited to 12 seconds, more controller interventions will be needed to preventseparation violations. However, if the IAT SD can be reduced to 5 seconds with IM (as shown inthe red distribution), aircraft can be delivered at approximately 65 seconds with the same rateof controller interventions as the 12-second IAT SD distribution.
Figure 2-4. Various IAT SD Distributions Relative to the Separation Standard
[Reprinted from Weitz, 2017]
1 The 81-second value is derived assuming a uniform flow, a minimum (time-based) separation of 53 seconds atthe FAF, and a controller intervention rate of 1 per 100 operations. The 53-second minimum (time-based)separation is derived from a minimum separation distance of 2.5 NM and an assumed groundspeed of 170 knots
0 20 40 60 80 100 1200
0.01
0.02
0.03
0.04
0.05
0.06
0.07
0.08
0.09
0.1
IAT (seconds)
Pro
babi
lity
IAT SD = 5.0-sec
IAT SD = 8.0-sec
IAT SD = 10.0-sec
Min(time-based)
Spacing
IAT SD = 12.0-sec

© The MITRE Corporation. All rights reserved
2-9
Rognin et al. (2005) demonstrated the benefit of accurate and low variance spacing whencomparing an en route metering capability only, to one with IM (i.e., all the aircraft were IMcapable). In the condition with IM, almost all aircraft were within 5 seconds of the ASG. The enroute metering capability alone had a wider and flatter distribution shown in Figure 2-5. The IMdistribution translated to an additional two aircraft per hour. Prevot et al (2007) found similarresults where IM (70% of the aircraft) had a reduced mean and variance and allowed for anadditional aircraft or two per hour (Figure 2-6).
Figure 2-5. Spacing Distribution of Aircraft at the FAF with an En Route Metering CapabilityAlone (Blue Line) and an En Route Metering Capability with IM (Green Line) [Reprinted from
Rognin et al., 2005]
Figure 2-6. Spacing Error at the Runway without IM (Blue Line) and with IM (Red Line)[Reprinted from Prevot et al., 2007]

© The MITRE Corporation. All rights reserved
2-10
If IM helps deliver all aircraft with an IAT SD of 5 seconds versus 12 seconds (and the associatedIAT of 65 seconds versus 80 seconds), an increase of approximately 11 aircraft per hour can berealized. IM operations 100% of the time may not be possible; however significant benefits arestill possible even with partial IM equipage. Figure 2-7 shows throughput increases at differentlevels of IM equipage and the delivery of aircraft at the 5 second IAT SD, versus a groundsystem only (GIM-S and TSAS). As shown, the number of aircraft landing per hour increases asthe number of IM operations increases and throughput benefits are still realized at lower levelsof equipage.
Figure 2-7. Throughput Increase Relative to the IM Equipage / IM Operation Rate
[Reprinted from Weitz, 2017]
HITL simulations (e.g., Baxley et al., 2013; Swieringa, Wilson, and Shay, 2014; Kibler, Wilson,Hubbs, and Smail, 2015) and field tests have shown the 5-second IAT SD to be possible. Lohr,Oseguera-Lohr, Abbott, Capron, and Howell (2005) conducted a flight test where a 90 secondsIM ASG with RNAV procedures was achieved with an average of 89.3 seconds with a standarddeviation of 4.9 seconds. Penhallegon, Bone, and Stassen (2016a) reported a field test with arelatively small number of aircraft conducting optimized RNAV routes where flight crews withhigh speed conformance were within +/- 6 seconds at the ABP and +/- 8 seconds of the ASG asthe lead aircraft touched down on the runway (after maintain operations). Swieringa et al.(2017) found similar behavior from a flight test where aircraft were within +/- 2 seconds of theASG at the PTP with SDs less than 3 seconds (after maintain operations on a RNAV StandardTerminal Arrival Route [STAR]). Achieve-by results from that flight test are still being examined.
0 10 20 30 40 50 60 70 80 90 10044
46
48
50
52
54
56
IM Equipage Rate (%)
Thro
ughp
ut (a
c/hr
)

© The MITRE Corporation. All rights reserved
2-11
Past efforts have shown similar benefits. Grimaud, Hoffman, Rognin, and Zeghal (2003) foundthat more aircraft were delivered closer to the targeted spacing interval in the extendedterminal area with IM (42%) than without (17%). Additionally, fewer aircraft were deliveredwith too small (or too large) spacing intervals. Overall, they reported a more homogeneous andstable flow at the delivery point with more aircraft achieving the targeted spacing value whenaircraft were conducting IM.
2.2.2.2 Other IM BenefitsIM is also expected to reduce the number of controller interventions. Numerous studies haveshown a reduction in controller interventions for similar concepts conducted in the en routeand terminal areas (e.g., Grimaud, Hoffman, Rognin, Zeghal and Deransy, 2001; Grimaud et al.,2003; Aligne, Grimaud, Hoffman, Rognin, and Zeghal, 2003; and Mercer, Callatin, Lee, Prevot,and Palmer, 2005). A series of studies specifically examining IM in the en route and arrivalenvironments (Bone, Penhallegon, Stassen, Simons, and DeSenti, 2007; Bone, Penhallegon, andStassen, 2008a; Bone, Penhallegon, and Stassen, 2008b; Penhallegon and Bone, 2008) reporteda reduction in controller instructions in IM scenarios (as compared to scenarios without IM)even with spacing disruptions and the introduction of other issues.
Because IM is expected to reduce the number of controller interventions, a reduction infrequency congestion is also expected to result. Grimaud et al. (2001) found a reduction in thenumber of communications when using IM, though not a reduction in the duration of thecommunications. In a flight test / demonstration, terminal controllers described a positiveeffect on communications with pilots (FAA, 2001). A study specifically examining IM in the enroute environment (Bone et al., 2007) reported both subjective and objective data indicating areduction in controller-pilot communications. Controllers reported that their communicationswere easy and were reduced with IM. Objective data revealed fewer ATC-initiatedcommunications and less total time on the frequency during IM. Although communicationsduring IM operations were generally found to be acceptable, the IM clearance continues to bean area of concern due to the potential length and complexity of the communication. It willcontinue to be examined in this simulation.
IM is expected to be particularly beneficial during optimized RNAV routes. Optimized RNAVroutes allow aircraft to maximize their individual efficiencies; however, this can come at theexpense of the efficiency of the overall stream. Past work has found that the vast majority ofpilots find optimized RNAV routes to be acceptable (Clarke et al., 2006). However, to avoid thelosing their benefits, optimized RNAV routes require no ATC interventions under nominalconditions. Appropriate spacing must be achieved in the en route environment so that terminalcontrollers are not required to intervene. Achieving the appropriate spacing can be challengingdue to uncertainty in the vertical trajectory and arrival time at the FAF (due to winds andaircraft performance differences). Therefore, spacing at the start of the optimized RNAV routeis greater than that realized today during high density operations (Erkelens, 2000; Ren, Clarke,and Ho, 2003).
By having aircraft manage their own spacing with IM, aircraft conducting optimized RNAVroutes can effectively balance individual and stream efficiency, and operate in a manner

© The MITRE Corporation. All rights reserved
2-12
beneficial to the overall system. IM is used to set up the appropriate spacing at the entry to theoptimized RNAV route and to achieve appropriate spacing on final approach by compensatingfor uncertainties during the arrival. This should allow for an increased ability to conductoptimized RNAV routes due to consistent, accurate spacing and sustained capacity duringoptimized RNAV routes. Additionally, if it is possible through IM to achieve a consistent spacingat the entry to the optimized RNAV route and manage the spacing through the optimized RNAVroute, the entry spacing may be able to be reduced and the final spacing may be tighter than anunmanaged spacing without IM.
A similar concept of the flight deck managed separation during optimized RNAV routes hasbeen previously proposed (in ‘t Veld, van Paassen, Mulder, and Clarke, 2003). In that work, itwas noted that the ATC task of spacing aircraft during an optimized RNAV route is difficult andthat tools such as IM could help.
2.3 PBN and RNP RF TurnsRNAV is a method of navigation that increases efficiency by allowing aircraft to fly direct routesbetween selected points rather than flying from ground navigation aid to ground navigation aid.RNAV enables PBN operations that specify performance requirements for both RNAV and RNProutes that enable accurate and predictable flight paths. PBN is used to achieve benefits such asensured deconfliction between defined routes, new routes that would not otherwise bepossible due to terrain, lower approach minimums, closer routes, optimally placed route, andreduced flight path length. The benefits are enabled through the stringent, definedperformance requirements. PBN procedures and routes are already in place and are helpingusers realize benefits (FAA, 2016).
PBN RNAV has specified navigation performance standards. PBN RNP is a refinement of RNAVand also has specified navigation performance (in Nautical Miles [NMs]), but it requires on-board performance monitoring and alerting. RNP allows for precise navigation on definedroutes. Advanced RNP procedures such as RNP Authorization Required (AR) approachoperations are enabled by advanced navigation equipment and have stringent lateralnavigation requirements and can include a RNP RF turn (also known as RF leg). A RNP RF turnallows an aircraft to fly a precisely defined arc when transitioning from one leg to anotherthereby avoiding different turn paths when such a segment is not defined between the legs.RNP RF turns can be used with an instrument approach to reduce track mileage and aircraft canjoin the final approach course as close as the FAF. RNP RF turns onto final approach can bechallenging for controllers but are expected to be supported by TSAS and will be part of arrivaland approach procedures in the terminal metering environment (Wynnyk and Kopald, 2013).

© The MITRE Corporation. All rights reserved
2-13
2.4 IM and MeteringRuigrok and Korn (2007) proposed how IM and metering could work together and be mutuallybeneficial. They suggested using a ground based metering capability to smooth inbound flowsand provide accurate spacing at a point like the initial approach fix where IM could be used toachieve further accuracy from the initial approach fix to the FAF. Callantine, Cabrall, Kupfer,Omar, and Prevot (2012) stated that terminal controller metering tools and IM arecomplementary and both can be utilized for the overall success of terminal meteringoperations. The strengths of each capability are used and the weaknesses of each are reduced.The ground tool is used to sequence and merge aircraft (where absolute spacing is important)and the flight deck tool is used when relative spacing between aircraft becomes moreimportant in the later stages of approach and landing. Previous simulations have shown thatcontrollers using terminal metering make this switch from absolute spacing to relative spacingwhen aircraft are close to or on final approach and some have suggested using relative spacingtools on final (Callantine, Palmer, and Kupfer, 2010; Kupfer, Callantine, Martin, Mercer, andPalmer, 2011; Callantine et al., 2012). Wynnyk and Kopald (2013) stated that final controllerswere more focused on relative spacing / separation and that slot markers changed from aschedule objective to an on-going status indication of whether or not a merge was going to besuccessful. The following section reviews relevant IM and metering HITL simulation activities.
2.4.1 Past Research on IM and En Route MeteringBenson, Peterson, Orrell, and Penhallegon (2011) examined IM during en route metering. Theyexamined center controller acceptability of IM and different display implementations. Theyreported general controller acceptance of IM and all the tested interfaces. They also reportedthat controllers found metering and IM compatible. Most controllers reported beingcomfortable with flight crew monitoring for conformance and did not want an additionalground tool. However, some said it may help situation awareness.
In a follow-on study, Peterson, Penhallegon, and Moertl (2012) also examined IM during enroute metering but with different levels of equipage and new controller display interfaces. Theyexamined center controller acceptability of IM procedures and requirements for groundautomation and reported general controller acceptance of IM and the interface. They alsoreported that controllers could acceptably manage a mix of IM and non-IM aircraft. Controllersalso found metering and IM to be compatible, though they reported some workload issues athigher levels of IM equipage due to the communication requirements associated with issuingthe IM clearance and with managing off-nominal situations. Overall, controllers reported havingall the necessary information to conduct IM operations and that IM information in spacing listand data block locations was acceptable. The authors recommended further examination of IMin the TRACON, including aircraft already conducting IM transitioning into the TRACON.
Rognin et al. (2005) also conducted a simulation examining IM with a en route meteringcapability. Aircraft transitioned into the TRACON, but there was no terminal metering tool.Controllers were provided new tools to manage IM aircraft. Overall, controllers found IM anden route metering to be compatible and complementary. TRACON controllers reported

© The MITRE Corporation. All rights reserved
2-14
favorably upon receiving aircraft already conducting IM from the en route environmentbecause the transfer conditions were more stable.
2.4.2 Past Research on IM and Terminal Metering with TSASThe main body of work to examine IM in a terminal area metering environment was conductedby NASA under the Air Traffic management Demonstration-1 (ATD-1) umbrella of activities. Themajority of the HITL simulations are summarized in Robinson et al. (2015). That work will bereviewed next from the perspective of the controller, because from the flight crew perspective,both the metering and non-metering environment look very similar. Flight crew procedures donot change between the environments and the receipt of a time-based ASG may be the onlyindication to the flight crew that they are in a metering environment.
2.4.2.1 NASA ATD-1 Concept of OperationsNASA’s ATD-1 activity started in 2011 to develop, demonstrate, and transfer time-basedspacing capabilities to the FAA. The ATD-1 concept is very similar to the time-based meteringenvironment and the IM concept as described in Sections 2.1 and 2.2. In the ATD-1 concept, enroute controllers manage and meter aircraft via TBFM to deliver them to the TRACON boundarysuch that speed alone should achieve the schedule. Aircraft fly PBN arrival procedures withspeed and altitude constraints. For aircraft that are equipped, the en route controller can issuean IM clearance (sometimes with an associated STA). If an STA is provided, it is entered in theflight deck and flown until IM can begin. En route controllers hand off aircraft near the terminalboundary with a schedule error of less than 30 – 40 seconds (Robinson et al., 2015). Terminalcontrollers use TSAS to continue to manage and meter aircraft. They also monitor on-going IMoperations. The final controller may also use the Automated Terminal Proximity Alert (ATPA)capability to monitor separation as aircraft join the final approach. ATD-1 activities ended in2017 with a flight test of the flight deck IM component (Swieringa et al., 2017).
2.4.2.2 NASA ATD-1 Controller HITLsBetween 2012 and 2014, NASA conducted sixteen simulations under the ATD-1 activity withcontrollers as participants (Robinson et al., 2015). Some simulations included IM and others didnot. Of the sixteen simulations, seven had published reports on IM and TSAS integration withcontroller participants. A report on an additional HITL simulation became available in 2016(Baxley et al., 2016). Table 2-2 shows the dates and key papers for these simulations.
In these simulations, controller participants were either active or retired controllers. In manycases, the same controllers participated in multiple simulations. Overall, the ATD-1 IM TSASwork with controllers as participants included a low percentage (approximately 10-20%) of IMaircraft. However, some of the simulations appeared to have fewer IM aircraft (e.g., three IMaircraft in a 75 aircraft per hour run in Thipphavong et al. 2013) or did not have IM as part ofthe main focus (e.g., Wynnyk and Kopald, 2013). Baxley et al. (2016) was a notable exceptionthat had a high level of IM aircraft. High level summaries and results are summarized here andspecific, relevant details are discussed in Section 2.5.1.

© The MITRE Corporation. All rights reserved
2-15
Table 2-2. NASA ATD-1 TSAS and IM Controller HITL Simulations
HITLName
ConductDate Paper
CA-1 Jan 2012 Cabrall, Callantine, Kupfer, Martin, andMercer (2012)
CA-2 April 2012 Callantine et al. (2012)CA-3 June 2012 Callantine et al. (2012)FIAT-1 Oct 2012 Thipphavong et al. (2013)CA-4 Dec 2012 Callantine, Kupfer, Martin, and Prevot (2013)TSS-2 2013 Wynnyk and Kopald (2013)CA-5.3 2014 Callantine, Kupfer, Martin, and Mercer (2014)IMAC 2015 Baxley et al. (2016)
CA – Controller Managed Spacing (CMS) Air Traffic management Demonstration (ATD)
FIAT – Fully Integrated ATD-1 Test
TSS – Terminal Sequencing and Spacing
IMAC – IM Alternative Clearances
The first ATD-1 simulation examining TSAS and IM integration was CA-1, as reported in Cabrallet al. (2012). Nine controllers were participants (acting as TRACON and center controllers).Controllers were asked to not interfere with IM operations, even if there was a spacing issue,“to enable close examination of the behavior of the [IM] algorithm in an operational setting”(Cabrall et al., 2012, p. 6). Eight aircraft were equipped with flight deck IM equipment.
Controllers reported acceptable workload, tools, procedures, and phraseology for theintegrated operations and that they were able to integrate IM traffic into their operations. Theauthors did indicate, however, that there were some spacing issues with IM aircraft, whichseemed to be due to lack of conditioning aircraft prior to initiating IM operations. When usingthe TSAS tools (e.g., early / late indicators, slot markers, timeline) as well as the IM data blockindicators for IM, feeder controllers indicated that the timeline and data block indicators wereboth helpful and useful. Their replies also indicated higher helpfulness ratings but lowerusability ratings for the slot markers and early / late indicators for IM, even if both showedlarge schedule errors for IM aircraft. However, controllers seemed to want the tools to helpmanage IM operations. Final controller ratings were not provided. Controllers reportedfavorably on manually interacting with the IM status designators and also reported few issueswith the IM clearance.
In the follow-on / CA-2 simulation, the focus was on pre-conditioning the traffic (Callantine etal., 2012). Center and TRACON controllers were participants. Eight aircraft were IM-equipped.The same IM status designators and update methods for the TRACON controllers that wereused for CA-1 were used for CA-2. Some conditions removed the slot markers and speedadvisories for aircraft conducting IM. Results reporting was limited; however, the IM resultsthat were reported indicated that pre-conditioning the IM traffic overcame the IM aircraft

© The MITRE Corporation. All rights reserved
2-16
delivery problems seen in CA-1. Additionally, center and TRACON controllers reported findingthe IM status designators in the data block useful.
The CA-3 HITL built on the previous simulations and examined controller tools, procedures, andphraseology (Callantine et al. 2012), but with different IM status designators. Approximately11% of the aircraft were IM-equipped. Center and TRACON controllers were participants.Overall, controller replies indicated that the tools, procedures, and phraseology wereacceptable and useful. Controllers reported that mixed IM and TSAS operations were not anissue. For this simulation, when controllers were considering terminating IM, they wereencouraged to suspend IM instead, so they could resume IM at a later point. Center controllerssuspended some IM operations, mostly due to concerns with separation at merge points. Theresults indicate that IM reduced the inter-arrival spacing variation as compared to aircraft onlyconducting TSAS operations and that trail aircraft conformed to the underlying schedule whenthe lead aircraft did. One noted issue was the high number of issues with IM communications.The authors do not provide much detail on the exact nature of the concerns, but acknowledgedthat it needed to be addressed.
FIAT-1 was conducted to further evaluate the ATD-1 operational concept and its validity(Thipphavong et al. 2013). There were three IM-equipped aircraft per run in a demand ofaround 75 aircraft per an hour run. In some scenarios, the lead aircraft was not in the samesector as the trail aircraft. Center and TRACON controllers were participants. Overall, IMoperations worked with the TSAS operations. The authors again confirmed the need to pre-condition aircraft so that speed changes alone will be sufficient to achieve the desired spacingin the TRACON. When aircraft were on the same route, an IM operation was more likely to beengaged than when the aircraft were not on the same route. All controllers reportedmanageable workload, though the center controllers reported higher workload than theTRACON controllers and increased communications with IM aircraft (as compared to non-IMaircraft). Both could be attributed to the requirement to issue the IM clearance. TRACONcontrollers reported lower workload than the center controllers and reported communicatingwith the IM aircraft the same or less than non-IM aircraft.
For the majority of responses, there were no reported spacing issues for IM aircraft pairs andnon-IM aircraft did not need to be maneuvered for IM aircraft pairs. Aircraft in IM pairs spentless time off path than the non-IM pairs. When compared to aircraft not conducing IM, aircraftthat were conducting IM showed worse schedule conformance at the meter fixes and meterpoints in the feeder airspace, but were spaced closer with less variance at the FAF. Controllersreported mismatches between the trail aircraft position and the slot marker. This behavior isexpected based on the IM algorithm design. Slot markers, speed advisories, and the timelineswere reported as less useful for IM operations.
CA-4 examined the pre-conditioning of traffic, different controller tool sets, and IM integration,among other things (Callantine et al., 2013). There were eight IM aircraft per run in a demandof around 43 aircraft per runway per hour (for a fifteen-minute run). The IM status designatorsin the data block were also updated. Center and TRACON controllers were participants. Authorsreported having some data confounding issues due to winds and system behaviors thatnegatively affected IM operations (leading to numerous suspensions) and the ability to measure

© The MITRE Corporation. All rights reserved
2-17
final approach spacing accuracy for IM. However, center controllers found the IM clearanceacceptable (in contrast to CA-3), and reported a desire to split the communication into twoparts. IM was reported by controllers, on average, to increase task complexity without doing soexcessively.
The TSS-2 simulation mainly examined issues related to TSAS operations (Wynnyk and Kopald,2013). Four TRACON controllers participated. There were three IM aircraft per run in a demandof around 45 aircraft per runway per hour (for a half hour run). Controllers were told IM wasnot a key part of the simulation, and very little IM-related data was reported. However, fromthe results that were provided, the TRACON controllers’ average rating was neutral forusefulness of the TSAS tools for IM. However, average rating for other tasks such as managingtraffic and managing the schedule received a similar rating. The majority of controllers reportedthat the IM designator (indicator of the status of the IM operation) was an important part of acustom toolset.
The CA-5.3 simulation examined how TSAS can improve efficiency of arrival operations duringhigh demand (Callantine et al., 2014). Center and TRACON controllers were participants.Though the authors did not report specific IM-related result, they did mention that maintaininginter-arrival spacing without IM was an issue and required further examination.
Finally, the IMAC simulation mainly examined acceptability and system performance ofdifferent IM operations (Baxley et al., 2016). Eight Center and TRACON controllers wereparticipants (pilots were also participants). Overall, controllers rated the concept, workload,and displays acceptable. The Controller Acceptance Rating Scale ratings also indicatedacceptability. The authors recommended a feasibility check prior to initiating IM and during IMconduct so the controller knows when the ASG is invalid.
2.4.2.3 MITRE Concept Evaluation ActivitiesThree concept evaluations were conducted by MITRE in 2016 to explore IM and TSASintegration issues in the MITRE Integration Demonstration and Experimentation for Aeronautics(IDEA) lab using a team of FAA ground system, flight deck, and ATC domain experts. The goalwas to seek input from experts on the integration of the TSAS and IM operations, the prototypedisplays, and plans for a follow-on HITL simulation (this activity) in all the capabilities beingutilized. Each evaluation was a step in the development process as the lab capability matured.Improvements were made over the course of the evaluations as the lab implementationmatured and as input was received. Over the course of the three evaluations, sample changesand improvements included: increased traffic density, the reposition of an ABP to the merge oftwo flows, updated IM information on the STARS display, and the addition of RNP RF turns.These and other relevant changes will be discussed in subsequent sections. Overall, theparticipants found the operations to have potential to work together, but had questions thatwould need to be addressed in the HITL simulation.

© The MITRE Corporation. All rights reserved
2-18
2.5 Study Purpose and Design
2.5.1 ATC TopicsThe understanding of an operation and the information displayed to the controller is key to thesuccessful implementation of an operation. Fundamental to the ATC task is keeping cognizantof current and evolving conditions, i.e., maintaining situation awareness. When aircraft areconducting IM, controllers monitor aircraft speed control instead of actively directing it.Previous studies have indicated that monitoring of aircraft under flight deck spacing operationswas increased for non-spacing aircraft in a spacing stream (Mercer et al., 2005), but reduced foraircraft that had been sequenced and were maintaining their spacing (Aligne et al., 2003).Regardless of the impact on monitoring, there did not appear to be an effect on safety or a lossof situation awareness. A summary report of several European IM simulations (Hebraud,Martin, Leone, and Troise, 2006) reported on a study of Italian airspace that found improvedcontroller situation awareness when using IM during metering operations, which also led toimproved coordination between controllers.
Related to situation awareness is the controllers trust in the IM operation. They must fullyunderstand the objectives and methods IM uses to achieve and maintain spacing and they mustbe able to trust that flight crews will properly follow the IM speeds. The degree to which theirmental models conform to the reality of IM operations allow them to appropriately calibratetheir level of trust as conditions change. For example, if IM usually proceeds in a predictablefashion, but one aircraft starts deviating from the expected procedures, controllers will morelikely be able to detect the situation and intervene before it escalates. Mercer, et al. (2005)found that predictability is important for controller acceptance. During IM operations,controllers will need to know what spacing to expect at key points and that the flight crews willoperate their aircraft in predictable ways.
Over-trust, resulting in a loss of situation awareness, can also be an issue. If controllerscompletely trust an operation, they can become complacent and not perform their normal,necessary checks on the traffic. This can result in controllers taking longer to detect adeveloping situation. Therefore, ways to minimize controller over-trust must be considered byconcept developers.
Past work has generally found IM can work in a metering environment with limited issues (e.g.,Rognin et al., 2005; Benson et al., 2011; Baxley et al., 2016). However, some key topics remainopen. The remainder of this section will review the relevant work related to the open topics.
2.5.1.1 IM Operations Relative to TSAS Slot MarkersIn Cabrall et al. (2012), TRACON controllers reported favorably on IM overall and they reportedthat the slot markers were helpful and usable for IM operations. However, feeder controllersreported the slot markers were very similar in helpfulness but less usable for IM aircraft ascompared to non-IM aircraft. They reported confusion regarding IM spacing behavior relativeto the slot markers and therefore, the underlying schedule. The controllers expected to have IMaircraft also in the slot markers and were uncomfortable when the IM aircraft were not in theslot markers. Controllers also appeared to be unsure of IM aircraft behavior relative to the slot

© The MITRE Corporation. All rights reserved
2-19
markers. They reported problems with IM aircraft arriving early relative to the schedule. Theauthors indicated that follow-on work would look at enhancements to the slot markers toprovide controllers information on IM operation progress. However, it was not seen in thesubsequent reports.
In the follow-on simulation, Callantine et al. (2012) reported scenarios where the slot markerswere removed when aircraft were conducting IM. However, no results were reported. In thethird of the series of these simulations, while it is not explicitly stated, a figure seems toindicate that the slot markers were used for IM aircraft in the TRACON (Callantine et al., 2012).TRACON controllers again reported slot markers as being helpful and they reported beingconfident in their use. However, the reported results did not differentiate between slot markeruse for IM and non-IM operations, so it is unclear whether the issue discussed in Cabrall et al.(2012) is still applicable. In the conclusion, the authors point out that the TRACON tool useduring IM operations requires controller acceptance as well as consistent understanding anduse. When summarizing this third simulation, Callantine et al. (2013) noted that controllers hadsome misunderstanding of IM aircraft behavior.
In another ATD-1 simulation, Thipphavong et al., (2013) reported that IM trail aircraft hadworse schedule conformance at the terminal meter points (indicating slot marker deviations)but better at the FAF, as compared to aircraft not performing IM. TRACON controllers reportedthat they saw short-term, but less long-term, mismatches between the IM aircraft position andthe slot marker position. As the authors note, this is to be expected based on IM algorithmbehavior. Finally, controllers reported that the slot markers were less useful for IM aircraft thanfor non-IM aircraft.
As mentioned previously, after most ATD-1 activities, MITRE concept evaluations wereconducted in preparation for the HITL simulation reported here. The participants in the conceptevaluations also determined that IM spacing behavior and deviation from slot markers shouldcontinue to be examined in the concept evaluations, followed by the HITL simulation. Someoptions were tested during the concept evaluations that led to the final simulationimplementation that will be reviewed in Section 3.1.3.3. One option that was tested at the thirdevaluation, was a change in slot marker color of an aircraft conducting IM. Differentiating theIM trail aircraft was reported as being helpful and controllers appeared to have a betterunderstanding of IM spacing behavior and reported seeing aircraft closing to their ASG.However, some controllers still expressed concerns about on-going deviations from the slotmarkers in the feeder’s airspace. They reported that their goal was to get all aircraft into theirslot markers so that the handoff to the final controller would be acceptable and that they feltuncomfortable when aircraft were not in the slot markers.
2.5.1.2 IM Status Information on ATC Surveillance DisplaysTo help controllers actively manage and monitor IM operations, IM status information shouldbe provided directly on the surveillance display. Such information will help the controllerdetermine which aircraft are part of an IM operation, what their role is (i.e., trail or lead), andthe status of the IM operation (e.g., active). Past work examined this topic and is reviewed next.

© The MITRE Corporation. All rights reserved
2-20
In Bone et al. (2007), a HITL simulation of an achieve-by IM operation is reported that was atransitional implementation that had no active controller involvement in the set-up of IM or inissuing the IM information. The UPS operations center provided the IM information to the trailaircraft based on the arrival sequence and the ASG that was agreed-upon with the TRACON.The controllers monitored IM and intervened when necessary. The simulation was supportingan early field implementation where controller tools would not be available in time. In thissimulation, controllers did not know which aircraft were conducting IM, only that some in thestream were capable. Based on the results, the authors noted that controllers may need:
to know which aircraft are actually (versus potentially) conducting IM,
a better understanding of IM aircraft behavior (e.g., relationship between IM speedsflown and the ASG),
to know whether or not the ASG can be achieved, and
more information to determine when an intervention in the IM operation is necessary.
In a follow-on simulation, during capture then maintain IM operations, Penhallegon and Bone(2008) had pilots report when conducting IM, instead of having the controller assume. Whilethe controllers did not have IM-specific display features, they were reported to use existingdisplay features to flag aircraft that were conducting IM. The controllers did not report themonitoring and intervention needs reported in the previous simulation. However, thisdifference may be because maintain operations may lend themselves better to monitoring thestatus of IM than do achieve operations because aircraft are on a common route.
EUROCONTROL IM-related research with controllers (e.g., Aligne et al., 2003) used basically thesame tool set (Figure 2-8). Controllers were informed of IM equipage through the flight plan.For the surveillance display IM features, circles were placed around the trail (larger circle) andthe lead (smaller circle) aircraft. A line linking the aircraft was also available as an optionaldisplay element. The line included a numeric value of the current spacing between the aircraftin distance or time. The features were orange when the lead aircraft was being identified andselected by the trail aircraft flight crew and was green when IM became active. Controllersreported that the tools were useful (Aligne et al., 2003; Rognin et al., 2005).
Figure 2-8. EUROCONTROL IM Controller Information [Reprinted from Aligne et al., 2003]

© The MITRE Corporation. All rights reserved
2-21
Benson et al. (2011) reported a simulation where center controller data blocks showed trail andlead aircraft role and IM status: pending versus active (in the fourth line). IM eligibility was notshown in the preferred IM window implementation (but was examined in an alternativeimplementation). A flyout window was also available that allowed controllers to initiate andterminate IM and show the IM operation state and aircraft role in IM. It used color coding todifferentiate between the IM pending (clearance issued but not yet accepted by the flight crew)and active states (Figure 2-9). Controllers used the option to initiate and terminate IM with thedata block. The data blocks were reported to have provide IM situation awareness benefits.Most controllers wanted the trail and lead identification and lead or trail role in data block andthought it was part of a minimum set of information.
Figure 2-9. MITRE IM Controller Data Block Information [Reprinted from Benson et al., 2011]
Peterson et al. (2012) conducted a follow-on simulation and developed an alternative datablock and fly-out menu for IM. In this implementation, the controller could accept or reject aproposed IM operation, as well as change the status states of the IM operations. The statusstates shown were: capable (FC), pending (FP), active (FA), or terminated (FT). The flyout menuwas where the proposal for the IM operation was rejected and where the status states werechanged (Figure 2-10). The majority of controllers reported that the data block was theirpreferred method for conducting IM operations, although controller responses appeared mixed
© The MITRE Corporation. All rights reserved
2-22
as to the necessity to display IM information in the data block. The majority of controllersagreed that each of the states should be depicted.
Figure 2-10. MITRE IM Controller Data Block Information [Reprinted from Peterson et al.,2012]
In Cabrall et al. (2012), IM status information for the IM trail aircraft was provided to TRACONcontrollers in the second line of the data block, after the aircraft type. No IM equipped indicatorwas shown for the trail aircraft. A “®” was used when aircraft were flying RTAs prior to startingIM and an “S” was used when aircraft were conducting IM. Controllers manually updated thestatus designators based on flight crew reports. Controllers found the status information itself,as well as the need to manually update the status, acceptable. The information was rated ashighly helpful and highly usable. However, controllers reported wanting a single inputcommand to toggle between the status states.
The same method was used in the follow-on simulation reported in Callantine et al. (2012).However, there were also conditions where the TSAS speed advisories were removed during IMfor the IM trail aircraft. Both Center and TRACON controllers reported that the statusinformation was useful. In the third simulation of the series, data blocks for the Centercontrollers had a “/S” indicator in the third line of the data block for the IM trail aircraft. Thissimulation added an IM equipped indicator for the trail aircraft. A command was used to turnthe field magenta when IM started. A “®” was included if the aircraft was flying the RTA prior toIM. A command could be used to toggle between the states. The status information was passedto the TRACON controller where the information was provided in the same field as the previoustwo simulations (Callantine et al., 2012). The TRACON controllers provided high ratings for thehelpfulness and their confidence in the IM status information. Center controller feedback wasnot reported. The authors note that there were some issues with setting the status, but thereason for the issues was unclear from the report.
In another simulation, Thipphavong et al., (2013) used a similar approach to that reported inCallantine et al. (2012). Data blocks for the Center controllers had a “/S” indicator in the third

© The MITRE Corporation. All rights reserved
2-23
line of the data block to indicate IM capable for the trail aircraft. A command was used to turnthe field magenta when IM started. TRACON controller IM designations in the data block werenot described. The lead aircraft was sometimes identified in the data block for the lead aircraftcontroller when both aircraft were not in the same sector. TRACON controllers reported thatthe TSAS speed advisories were less useful for IM operations than for non-IM operations, butwere still “somewhat useful.” The IM status indicators were rated as more useful than the slotmarkers by TRACON controllers, but the slot markers were still reported to be used 40% of thetime. Controllers reported that they did not want to have other IM status indicators, such assuspended or terminated, in the data block. When the lead aircraft was identified for thecontroller, IM operations were suspended less often and controllers confirmed they liked theinformation.
In the follow-on simulation, the indicators and their location changed for both center andTRACON controllers (Callantine et al., 2013). Center controllers had the following information inthe zero line of the data block: “@” for IM-equipped, “R” when the aircraft was flying a RTAprior to IM, and “S” for active IM operations. The “@” symbol changed to magenta when thecontroller issued the IM clearance and made an entry. The “R” and “S” indicators were shownafter controller entry (Figure 2-11). For the TRACON controllers, the IM status was transfer fromthe center controller systems. In this simulation, the designators were: “FIM” [Flight deck-basedIM] for IM clearance issued, “RTA” when the aircraft was flying a RTA prior to IM, and “SPC” foractive IM operations. The designators for this simulation were in the third line of the data blockreplacing the TSAS speed advisories and early / late indicator (Figure 2-12). This simulation hadwind-related issues that affected IM operations; however, both center and TRACON controllersreported favorably on the IM status designators and the associated updating.
Figure 2-11. Center Controller Data Block Information from Callantine et al. (2013) [Reprintedfrom Callantine et al., 2013]

© The MITRE Corporation. All rights reserved
2-24
Figure 2-12. TRACON Controller Data Block Information from Callantine et al. (2013)[Reprinted from Callantine et al., 2013]
One of the final NASA simulations is reported in Baxley et al. (2016). As with past simulations,center controllers had IM status information in the data block (top line) which included threestatus levels: IM capable, IM issued, and IM active / reported “paired.” TRACON controllers hadIM status information in the data block including: IM issued (“FIM”) and (“SPC”) IM active /reported “paired.” Overall, the controller reported the display elements as acceptable. Theauthors recommended indicating in the data block of the trail aircraft: (1) whether an aircraft isIM capable, and (2) whether an IM clearance has been issued.
In concept evaluations conducted in preparation for this HITL simulation, the IM information inthe data block was examined. The IM information replaced the TSAS speed advisory and early /late indicator. The first concept evaluation included the lead aircraft identification in the datablock of the trail aircraft, along with the aircraft role (trail or lead aircraft) and IM state status.Controllers reported the lead aircraft identification in the trail aircraft data block as beingunnecessary information (this information was also available in an IM clearance window). In thesubsequent concept evaluations, this information was removed but the aircraft role and statestatus information persisted. Controllers did not report issues with IM information replacing theTSAS speed advisories or the early / late indicator for the trail aircraft.
2.5.1.3 IM Clearance Information on ATC Surveillance DisplaysBesides needing information in the data block about the status of the IM operation, similar ordifferent information may be needed in a window that provides the IM clearance information.Previous simulations examined this topic only from the center controller perspective and will bereviewed next.
The information and format provided to the center controller in the first two simulations inCallantine et al. (2012) is unclear. However, the third simulation provided the IM information inthe meter list. The IM information provided was the ABP, the ASG, the lead aircraft, and thelead aircraft’s Intended Flight Path Information (IFPI). Center controllers reported positively onthe overall set of tools available to them, including the meter list. The same information wasprovided in the meter list in the simulations as was reported in Callantine et al. (2013) andThipphavong et al., (2013). No display issues were noted. Controllers in Thipphavong et al.,(2013) reported that the meter list was “very useful.” Baxley et al. (2016) had a similar

© The MITRE Corporation. All rights reserved
2-25
implementation but reported there may have been unintended consequences in their displayedclearance information because they did not have time to incorporate a capability to only showthe controller the relevant IM clearance information for each IM clearance type utilized. Thisrequired the controller to know which information was required for which operation and toonly issue the necessary information. They suggested fixing this for future implementations.However, controllers generally reported favorably on the display implementation.
Benson et al. (2011) reported a simulation with center controllers that evaluated two differentdisplay implementations (i.e., IM window and alert list) for IM clearance information. The IMwindow will be reviewed as it had more favorable objective results, was the preferredimplementation, and is the most relevant implementation. The IM window included four mainareas: (1) timeline, (2) a window for the clearance information, (3) a window with IM state andstatus information as well as an area to initiate or terminate IM, (4) a “trash can” for recentlyterminated IM operations. The “FIM List” timeline showed when an IM clearance would beavailable (Figure 2-13). The “FIM information” window showed the lead and trail aircraftidentifications, ASG, lead aircraft sector, and predicted spacing at the ABP. It used color codingto differentiate between the IM pending (clearance issued but not yet accepted by the flightcrew) and active states. The rest of the clearance (the ASG) was in the “command info” windowwhich is where the clearance was presented.

© The MITRE Corporation. All rights reserved
2-26
Figure 2-13. MITRE IM Window Controller Information [Reprinted from Benson et al., 2011]
The timeline received favorable feedback. For the information in the window with IM state andstatus, the controllers reported that the predicted interval at the ABP was useful but were spliton whether it was a requirement and just over half thought it was “useful as an indicator of[IM] status.” Controllers did not report the sector information for the lead aircraft to be veryuseful.
In a follow-on simulation, Peterson et al. (2012) used the existing TBFM metering list (whichincluded the Meet Time Error [MTE]) to add IM information. The only IM information that wasadded was IM status state, the ASG, and an indication of the ability of an aircraft to act as a leadfor an IM operation. The trail aircraft was already listed as the first element in the TMAmetering list and the lead aircraft was inferred to be the aircraft directly ahead in the schedule.The controller was not able to interact with the list. All interactions were via the data block. Thecurrently available MTE parameter was provided to the controllers as the spacing compliancetool. Controllers reported having this information was useful. However, only a slight majority ofcontrollers reported that the MTE was useful for maintaining awareness of IM operations. More

© The MITRE Corporation. All rights reserved
2-27
downstream controllers found it useful than did upstream controllers. Controllers reported thatthe IM status state, the ASG, and the lead aircraft indication were useful.
2.5.1.4 ATC Research NeedsAs can be seen from past work, general acceptance of IM operations has been reported innumerous simulations, including some examining IM during metering (e.g., Rognin et al., 2005;Penhallegon and Bone, 2008; Benson et al., 2011; Callantine et al., 2012; Baxley et al., 2016).However, there are still issues that need to be addressed related to the interaction betweenTSAS (absolute spacing) and IM (relative spacing), as well as controller information needs in theTRACON. The interactions between these two types of spacing behaviors is important tounderstand since both are expected to be fielded by the FAA to maximize capacity.
As discussed in Sections 2.1 and 2.2, IM and TSAS operations achieve operational spacing goalsin different ways. During IM / relative spacing, the IM aircraft performs spacing adjustmentsrelative to a lead aircraft. In absolute spacing, spacing adjustments are made with respect tocrossing a specific location at a designated time, independent of the lead aircraft (once theschedule is frozen). The following issues have been identified in past IM and metering activities.
Controllers can have difficulty visualizing time-based spacing (as compared to distance-based operations) (e.g., Aligne et al., 2003)
Under certain conditions, separation can be an issue because the IM algorithm is onlyconsidering spacing at a point (the ABP) and not separation along the way. Baxley et al.(2016) recommended examining placing the ABP at the location where the aircraft routesmerge to ensure separation at that point. Controllers that participated in the conceptevaluation activities also expressed concern about this potential issue.
IM aircraft can be outside of the slot markers. While slot markers were found useful ingeneral, in some instances, they were reported as less so for IM aircraft. Proposals tomodify slot makers have been mentioned (e.g., Cabrall et al., 2012) but not reported ortested.
Necessary IM information and where it should be displayed to support the controller inIM operations is still an open topic. For example, it remains unclear what informationcontrollers require to monitor the progress of the IM operation and to determineacceptable spacing for the handoff and final spacing at the ABP. Splitting the informationbetween a clearance window and the data block also still needs examination.
While past simulations did not report issues with TRACON controllers receiving aircraftalready conducting IM from the en route environment, concept evaluation activities leadingup to this simulation did have some questions from controllers about the acceptability ofthis. Therefore, the topic should be explored further to see if HITL participants have anyconcerns.
This simulation will attempt to address these open issues and continue validation of othertopics from past efforts.

© The MITRE Corporation. All rights reserved
2-28
2.5.2 Flight Deck Topics
2.5.2.1 Flight Deck Display Spacing InformationDisplays for IM must include the necessary information to perform IM and must not containinformation that conflicts with IM tasks. Any annunciations must also be salient. In order forpilots to trust the IM system, they must be able to develop an appropriate mental model (i.e.,abstract functional understanding) of the operation and to fully understand the objectives andmethods IM uses to achieve and maintain spacing. For example, they will need to understandthat the spacing to be achieved is based on a time interval, and that distance spacing will bevariable due to winds and compression. The degree to which their mental models conform tothe reality of the IM operations will allow them to appropriately calibrate their level of trust. Agood mental model is also important for situation awareness in that it provides a mechanismfor integrating and comprehending information and allows for projecting future states (Endsley,1995).
Over the course of HITL research on IM2, there has been shown to be general acceptability ofIM and the ability to meet the spacing goals (e.g., Hebraud, Hoffman, Pene et al., 2004;Swieringa et al., 2014; Penhallegon, Mendolia, Bone, Orrell, and Stassen, 2011). However, adominant, re-occurring issue is flight crew understanding and trust in the IM algorithm’sbehavior and the related ability to monitor the progress of the spacing task. Past simulationshave attempted to support the flight crews and through examination of different displayfeatures. The past work has shown that certain features can lead to confusion, additionalworkload and head-down time, or simply may not be utilized. The past work also shows that anideal, or even reasonable, implementation has been challenging to achieve. The remainder ofthis section will review this past work.
2.5.2.1.1 EUROCONTROL ResearchThe first IM simulations conducted by EUROCONTROL included a limited number of pilots, andonly a basic Cockpit Display of Traffic Information (CDTI) capability (Zeghal, Hoffman, Cloerec,Grimaud, and Nicolaon, 1999). Only qualitative feedback was received as the main effort was todetermine the feasibility of IM. Results revealed some issues that the authors speculated weredue to the rudimentary CDTI (e.g., no IM speeds).
The second set of flight deck experiments was conducted in 2002 and is reported in Hebraud,Hoffman, Papin et al. (2004). These two evaluations (May and December) were conducted afterthe initial small-scale experiment examining feasibility of spacing and the requirements for theCDTI. The setup for the spacing was conducted through the Control and Display Unit (CDU), anda CDTI traffic display was placed on the navigation display. In both experiments, pilots reportedfavorably on their situation awareness and their active participation in the maintenance of
2 “IM” is used generically in this section. Not all simulation examined the full capabilities now being defined innew versions of DO-361 and DO-328A (RTCA, 2015a, 2015b). Most examined only a subset of those capabilitiesor an early implementation of those capabilities, under different concept names.

© The MITRE Corporation. All rights reserved
2-29
spacing. Flight crews were found to be able to maintain spacing within the tolerances, with fewexceptions.
For spacing information in the May experiment, the CDTI traffic display included lead aircraftground speed, closure rate to lead aircraft (difference between lead aircraft and ownshipgroundspeed), a required spacing arc and a predicted spacing cue (position on trajectory wherespacing will be acquired) (Figure 2-14). The predicted spacing cue changed to amber if thespacing was predicted to be outside tolerances. IM speeds were not provided to the flight crew.Pilots reporting desiring spacing trend information and IM speeds.
Figure 2-14. Navigation Display with IM Information from Hebraud, Hoffman, Papin et al.(2004) First Evaluation [Reprinted from Hebraud, Hoffman, Papin et al., 2004]
Based on the findings from the May evaluation, changes were made for the Decemberevaluation. The required spacing arc and the data block information were removed. The CDTItraffic display now included an IM speed and spacing scale (Figure 2-15). The spacing scaleshowed current spacing, required spacing, spacing trend, closure rate, and tolerance margins(Figure 2-16). When current spacing was out of tolerances, the flight crew was alerted. Flightcrews were also prompted with the visual advisory “losing spacing” when spacing was an issue.

© The MITRE Corporation. All rights reserved
2-30
Figure 2-15. Navigation Display with IM Information from Hebraud, Hoffman, Papin et al.(2004) Second Evaluation [Reprinted from Hebraud, Hoffman, Papin et al., 2004]
Figure 2-16. Spacing Scale from Hebraud, Hoffman, Papin et al. (2004) Second Evaluation andHebraud, Hoffman, Pene et al. (2004) [Reprinted from Hebraud, Hoffman, Pene et al., 2004]
The majority of pilots reporting that the spacing task could be conducted with the displayedinformation and that the new features were helpful. Pilots reported the new spacing scale wasintuitive and useful, though the closure rate information was of little use. Some pilots alsothought they focused too much on the new spacing scale while others felt it was well integratedinto their scan. Pilots also reported liking the IM speeds and questioned the relevance of thepredicted spacing cue. Finally, pilots reported a worry about focusing on the spacing taskrequirements too much when busy or forgetting when no action is needed during a long periodof time.
A third flight deck evaluation was conducted in 2003 and was reported in Hebraud, Hoffman,Pene et al. (2004). The display implementation was very similar to the December 2002evaluation (Hebraud, Hoffman, Papin et al., 2004). This experiment added flashing for the IMspeeds when there was a difference of 7 knots between the IM speed and the current IAS.

© The MITRE Corporation. All rights reserved
2-31
While the December 2002 evaluation prompted the flight crews with the visual advisory “losingspacing” when spacing was an issue, this experiment changed the visual advisory to either“ASAS ACCELERATE” or “ASAS SLOW DOWN.”
The 2003 evaluation found the spacing task to be acceptable and all pilots reported the spacingas easy. They reported favorably on their active participation in the maintenance of spacing andwere found to be able to maintain spacing within the tolerances with no loss of spacing withthe displayed information. They again reported that spacing scale may have too muchinformation and that the closure rate information was of little use. However, pilots reportedthe trend information was useful. They noted the flashing of the IM speed was good but thatthere should be more alerting. Pilots reported potential fixations on the spacing scale and apossible reduction in monitoring other flight information.
After this set of evaluations, the final flight deck requirements were defined by EUROCONTROL(Hoffman, Pene, and Zeghal, 2006). The requirements relevant to the spacing cues are notedbelow.
The flight deck implementation shall include the following:
Advisory if IM is infeasible (visual alert only during the feasibility check)
Advisory if spacing is drifting and may exceed tolerances (visual alert) with message forcorrective action
Caution if tolerances are exceeded (visual and aural alerts) with message for correctiveaction
Warning if the clearance cannot be complied with (visual and aural alerts) with reasonwhy the clearance cannot be complied with
Spacing indicator with current spacing, required spacing, spacing trend, and tolerancemargins in the main field of view (preferably analog representation). Information on wherethe ASG will be reached
o Note closure rate is excluded
Guidance indicator / IM speed in the main field of view
2.5.2.1.2 NASA ResearchMuch of the early work on in-trail following, spacing, and merging applications was conductedby NASA Langley and was from the flight crew perspective in the terminal environment duringapproach (e.g., Abbott and Moen, 1981; Williams and Wells, 1986). The work continued underdifferent names and programs. The most relevant recent work is reviewed here.
Oseguera-Lohr, Lohr, Abbott, and Eischeid (2002) conducted an IM pilot evaluation in a high-fidelity simulator with active airline pilots. The CDU was used to enter the IM information andprovided relevant information (i.e., lead aircraft identification and groundspeed, currentspacing, ASG, as well as current distance to the lead aircraft). The IM speed was provided onthe Electronic Attitude Direction Indicator in association with the standard fast / slow bug (leftside of Figure 2-17). New IM speeds were annunciated with a box flashing for 5 seconds around

© The MITRE Corporation. All rights reserved
2-32
the IM speed value. On the Electronic Attitude Direction Indicator, the IM speed was shownimmediately numerically but the fast / slow bug for the IM speed followed a scheduled speedreduction (though the exact method is not described in detail). The IM speed was also shownon the airspeed indicator. The navigation display included a highlighted target aircraft alongwith its associated flight identification and range in NM, spacing position indicator (aka “picnictable”), and history data from the target aircraft (right side of Figure 2-17). It also showed theASG (“PDA” field) and IM Speed (“CMD” field). The spacing position indicator showed thepredicted spacing relative to the ASG. When the predicted spacing was the same as the ASG,the apex of ownship fit into the “v” of the indicator.
Figure 2-17. Primary Flight Display (PFD) and Navigation Display with IM Features fromOseguera-Lohr et al. (2002) [Reprinted from Baxley et al., 2014]
Pilots reported the tools were acceptable. Head-down time was found to be higher thancurrent operations, but acceptable. No major changes were proposed for the displayimplementations. In a summary of this work, however, Baxley, Shay, and Swieringa (2014)stated the fast / slow symbology was found to be borderline effective, the speed changenotification should be longer than 5 seconds, and the spacing position indicator receivedvarying reports of usefulness.
As a follow on to Oseguera-Lohr et al. (2002), Lohr et al. (2005) made minor updates to the IMdisplay information (e.g., the IM speed location on the fast / slow indicator was moved to bealongside the bug) and algorithm to conduct a flight test. Information was provided to indicateto the flight crew that the current IM speed was limited due to configuration or proceduralreasons. As with the previous activity, the pilots reported the tools were acceptable. Head-down time was found to be higher than current operations, but acceptable. The authors notedan issue with the spacing position indicator. Although pilots had been told to follow the IMspeeds and only use the spacing position indicator for spacing awareness, they had a desire toquickly drive the aircraft symbol into the spacing position indicator versus following the IM

© The MITRE Corporation. All rights reserved
2-33
speeds, which would progressively get them in the proper position over time. This,unnecessarily, led to additional workload and unnecessary speed inputs. The authorsrecommended additional work to refine the IM tools.
Prevot et al. (2004) describes a CDTI used by flight crews in their work on trajectory-orientedoperations with limited delegation. It is described and shown in greater detail in NASA (2004).Figure 2-18 shows the implementation. The CDTI included lead aircraft identification, ASG,spacing box, and a line between the trail and lead aircraft showing the ASG and 30-secondmarkers. The spacing box was green if the trail aircraft was within tolerance but changed toyellow when the aircraft was greater than 10 seconds ahead of the ASG and changed to whitewhen greater than 20 seconds behind the ASG. Limited results were found related to the use ofthis implementation for IM.
Figure 2-18. IM Features on the CDTI from NASA (2004). [Reprinted from NASA, 2004]
Barmore, Abbott, and Capron (2005) examined IM with pilots flying a desktop simulator. Thissimulation used displays very similar to those used in previous simulations, with a fewmodifications (e.g., no fast / slow indicator) and the use of PFDs and navigation displays (Figure2-19). Crews were alerted if the current speed was not within 5 knots and closing on the IMspeed. The IM speeds were coupled to the autothrottle so the flight crew did not enter the IMspeeds through the Mode Control Panel (MCP). The Multifunction Control and Display Unit(MCDU) was used for set-up and provided the same information as that in Oseguera-Lohr et al.(2002). In a summary of this work, Baxley et al. (2014) stated the spacing position indicator wasagain problematic (e.g., low usefulness ratings, over-control issues) and that it should beremoved or improved.

© The MITRE Corporation. All rights reserved
2-34
Figure 2-19. PFD and Navigation Display with IM Features from Barmore et al. (2005)[Reprinted from Baxley et al., 2014 (Highlights Added)]
Murdoch, Barmore, Baxley, Abbott, and Capron (2009) conducted an IM HITL simulation duringoptimized RNAV routes. The objectives of the HITL were to assess pilot ability and acceptabilityof IM procedures during nominal and off-nominal situations and to evaluate human and systemperformance in terms of aircraft spacing and system performance. Two separate simulationplatforms were used and the displays are shown in Figure 2-20 and Figure 2-21. It can be seenin the PFD and navigation display in Figure 2-20 that elements have been removed (relative tothe previous simulation) and only the IM speed and mode are shown on the PFD. Also, only thetarget aircraft highlighting is shown on the navigation display. The same is true with Figure2-21, except the spacing position indicator also appears to have been used. The MCDU wasused for set-up and provided IM information during conduct. Using subjective measures ofacceptability, completeness of procedures, and workload, Murdoch et al. (2009) found overallfavorability of IM and the tools across nominal and off-nominal events.

© The MITRE Corporation. All rights reserved
2-35
Figure 2-20. PFD and Navigation Display with IM Features Implementation 1 from Murdoch etal. (2009) [Reprinted from Baxley et al., 2014]
Figure 2-21. PFD and Navigation Display with IM Features Implementation 2 from Murdoch etal. (2009) [Reprinted from Baxley et al., 2014]
Baxley et al. (2013) conducted an IM HITL simulation during dependent runway operations.Controller Pilot Data Link Communications (CPDLC) was used to convey and load the IMclearance information into the flight deck IM equipment. The MCDU was used for set-up andprovided IM information during conduct. Three separate simulation platforms were used. ThePFDs are shown in Figure 2-22. As can be seen, the IM speeds were shown above the airspeedtape and as a bug alongside the airspeed tape. A green box was placed around a new IM speed

© The MITRE Corporation. All rights reserved
2-36
for 10 seconds. Pilots were also notified if the IM speed was limited due to procedural speeds.Pilots were notified if they were greater than 6 knots above the IM speed (by an Engine-Indicating and Crew-Alerting System [EICAS] message). No early / late (progress) indicator orfast / slow indicator was present. For the navigation displays, the only IM feature included wasthe highlighting of the target aircraft, except for one exploratory run where a conformance boxwas shown (Figure 2-23). The conformance box showed the band within which it was stillpossible to reach the ASG by the ABP. The goal of the box was to provide better spacingpredictability. Spacing error was presented on the MCDU.
Figure 2-22. PFDs with IM Features from Baxley et al. (2013) [Reprinted from Baxley et al.,2013]
Figure 2-23. Navigation Display with IM Features from Baxley et al. (2013) [Reprinted fromBaxley et al., 2013]

© The MITRE Corporation. All rights reserved
2-37
Pilots reported general acceptance of the display elements but the majority reported wanting amore salient speed change notification such as flashing or an associated aural alert. Pilots alsoreported a strong preference for a progress indicator and the ability to predict new IM speeds.Some comments indicated that the pilots may have had a poor mental model of therelationship between the spacing error and the IM speeds and the conformance box did nothelp much with the issue or pilot comfort in IM. However, the conformance box did provideuseful information for IM operations about the current time error relative to the toleranceboundary. Pilot reported it should be a tool available for IM. The authors recommendedexamining tools that provide a clear indication of the relationship between the time error andthe arrival of new IM speeds and a tool similar to the conformance box showing the currentstatus and trend of IM. Spacing error was only shown on the first IM page on the MCDU and theauthors were concerned about the amount of time the crews would spend viewing the MCDUpage for this key piece of information. Flight crews were reported to use the spacing errorinformation but not spending excessive amounts of time referencing the MCDU.
NASA continued the IM work under its ATD-1 activity. Kibler et al. (2015) examined IMoperations in a HITL simulation that used an auxiliary / Electronic Flight Bag (EFB) displaylocation and an Automatic Dependent Surveillance-Broadcast (ADS-B) Guidance Display (AGD).In this simulation, the EFB was used to enter the IM information. The AGD had a fast / slowindicator and the IM speed (Figure 2-24). New IM speeds were annunciated with a Light-Emitting Diode (LED) light on the AGD. The EFB display hosted the CDTI traffic display (Figure2-25). The traffic display included spacing information such the IM speed, a fast / slowindicator, and the ASG.
The fast / slow indicator provided trend and acceleration and deceleration information and wasnot simply an indication of whether the aircraft’s current IAS or MCP speed matched the IMspeed. It was designed to assist the flight crew with matching the acceleration / decelerationprofile expected by the IM algorithm. The NASA algorithm attempts to keep the number of IMspeeds low (i.e., display one large speed command versus several smaller ones). By giving fewerIM speeds, the deviation from the expected speed profile can be greater so NASA provides thefast / slow indicator to help the flight crew follow the expected profile. The fast / slow indicatorshows the flight crew whether the aircraft is on the expected speed profile, which is otherwiseunknown to the flight crew. The flight crew is expected to set the IM speed in the MCP but isalso expected to use the fast / slow indicator to manage pitch / drag to decelerate (forexample) to match the profile (and to avoid poor performance when off-profile). Based on thedesign, there could be a situation where an IM speed is given that the flight crew quicklydecelerates to, which takes them off the expected profile. In this situation, the IAS / MCP speedwould match the IM speed but the fast / slow indicator would show the aircraft slow (becausethe aircraft has decelerated too quickly relative to the assumed profile).
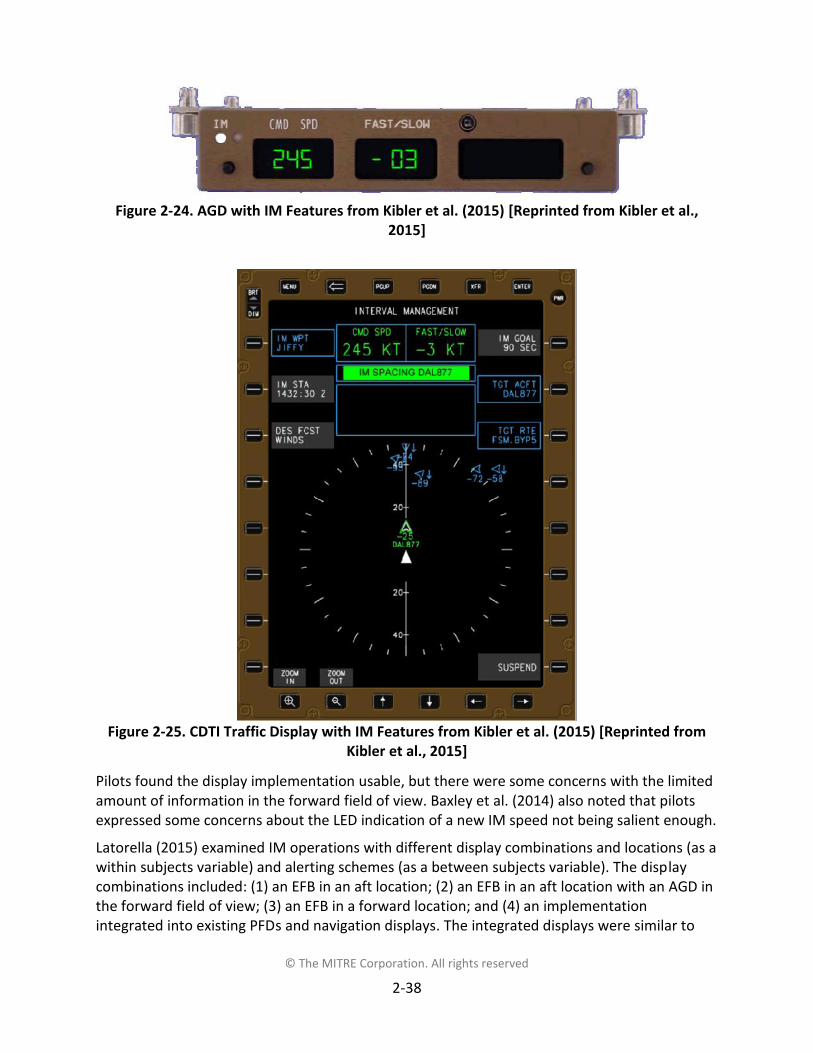
© The MITRE Corporation. All rights reserved
2-38
Figure 2-24. AGD with IM Features from Kibler et al. (2015) [Reprinted from Kibler et al.,2015]
Figure 2-25. CDTI Traffic Display with IM Features from Kibler et al. (2015) [Reprinted fromKibler et al., 2015]
Pilots found the display implementation usable, but there were some concerns with the limitedamount of information in the forward field of view. Baxley et al. (2014) also noted that pilotsexpressed some concerns about the LED indication of a new IM speed not being salient enough.
Latorella (2015) examined IM operations with different display combinations and locations (as awithin subjects variable) and alerting schemes (as a between subjects variable). The displaycombinations included: (1) an EFB in an aft location; (2) an EFB in an aft location with an AGD inthe forward field of view; (3) an EFB in a forward location; and (4) an implementationintegrated into existing PFDs and navigation displays. The integrated displays were similar to

© The MITRE Corporation. All rights reserved
2-39
Baxley et al. (2013) except for the addition of a flashing box around new IM speeds and the lackof the conformance box (Figure 2-26). The EFB and AGD implementations are shown in Figure2-27. Fast / slow indications were also provided in a manner similar to previous simulations.Either the EFB or the MCDU were used for set-up. As with previous simulations, the MCDUprovided IM information during the conduct of IM.
The alerting triggers included: (1) new IM speeds; (2) deviations from IM speeds; and (3)reminders if the IM speeds were not entered into the MCP. The triggers were alerted eithervisually or visually and aurally. The three alerting methods were: (1) all visual only; (2) all visualand aural alerting; and (3) visual only for new IM speeds and reminders with visual and auralalerting for deviations from the IM speed.
Figure 2-26. PFD and Navigation Display with IM Features from Latorella (2015) [Reprintedfrom Baxley et al., 2014]

© The MITRE Corporation. All rights reserved
2-40
Figure 2-27. CDTI Traffic Display and AGD with IM Features from Latorella (2015) [Reprintedfrom Baxley et al., 2014]
Relevant results here are those related to the alerting. The all visual and aural alerting methodgenerally did better than the all visual only alerting, and sometimes better than the visual /visual and aural combination. There were also results that had interactions between the displaycombination and the alerting scheme (as well as Pilot Flying [PF] seat position). However,though most are less relevant to this work, they are important when considering the displayand alert combination. The author recommended additional work to optimize the IM displaysand the associated alerting schemes with a strong consideration for the use of visual and auralnotifications.
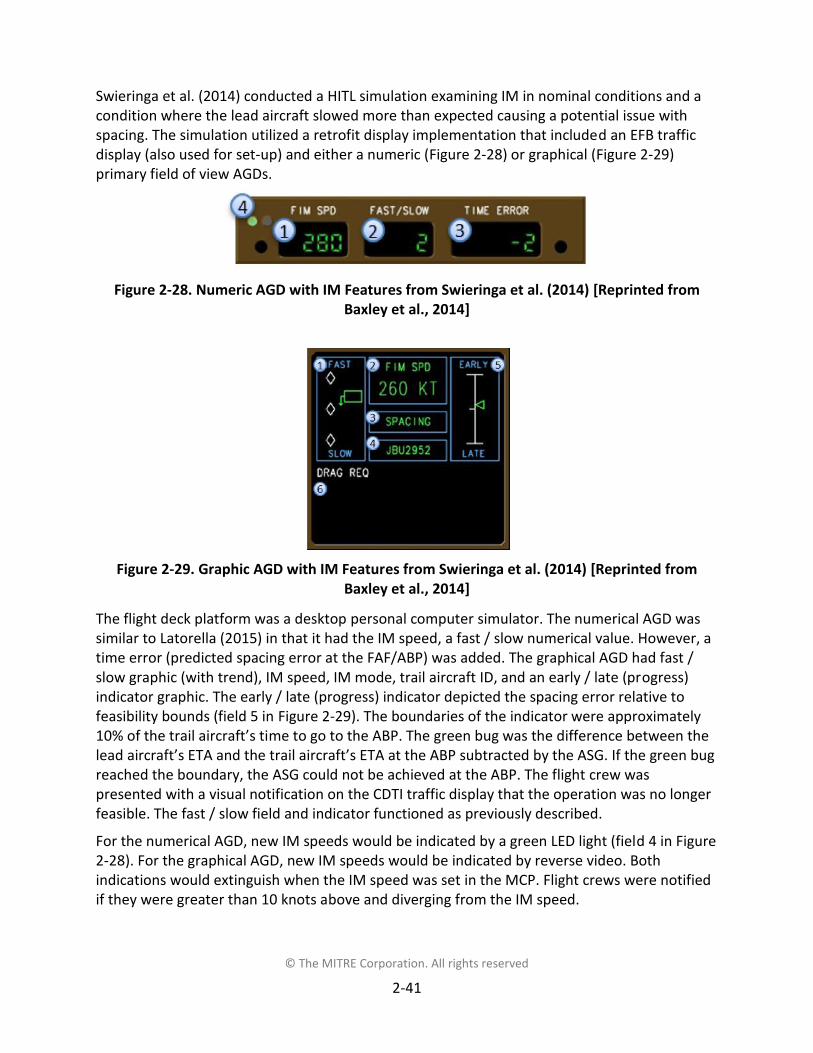
© The MITRE Corporation. All rights reserved
2-41
Swieringa et al. (2014) conducted a HITL simulation examining IM in nominal conditions and acondition where the lead aircraft slowed more than expected causing a potential issue withspacing. The simulation utilized a retrofit display implementation that included an EFB trafficdisplay (also used for set-up) and either a numeric (Figure 2-28) or graphical (Figure 2-29)primary field of view AGDs.
Figure 2-28. Numeric AGD with IM Features from Swieringa et al. (2014) [Reprinted fromBaxley et al., 2014]
Figure 2-29. Graphic AGD with IM Features from Swieringa et al. (2014) [Reprinted fromBaxley et al., 2014]
The flight deck platform was a desktop personal computer simulator. The numerical AGD wassimilar to Latorella (2015) in that it had the IM speed, a fast / slow numerical value. However, atime error (predicted spacing error at the FAF/ABP) was added. The graphical AGD had fast /slow graphic (with trend), IM speed, IM mode, trail aircraft ID, and an early / late (progress)indicator graphic. The early / late (progress) indicator depicted the spacing error relative tofeasibility bounds (field 5 in Figure 2-29). The boundaries of the indicator were approximately10% of the trail aircraft’s time to go to the ABP. The green bug was the difference between thelead aircraft’s ETA and the trail aircraft’s ETA at the ABP subtracted by the ASG. If the green bugreached the boundary, the ASG could not be achieved at the ABP. The flight crew waspresented with a visual notification on the CDTI traffic display that the operation was no longerfeasible. The fast / slow field and indicator functioned as previously described.
For the numerical AGD, new IM speeds would be indicated by a green LED light (field 4 in Figure2-28). For the graphical AGD, new IM speeds would be indicated by reverse video. Bothindications would extinguish when the IM speed was set in the MCP. Flight crews were notifiedif they were greater than 10 knots above and diverging from the IM speed.

© The MITRE Corporation. All rights reserved
2-42
Several tests were conducted comparing the numerical and graphical AGDs during noperturbation conditions and a perturbation condition (lead aircraft slowed below profilespeed). Graphical AGD use during a perturbation was found to provide better situationawareness than the numerical AGD with no perturbations, but both had positive ratings.Graphical AGD use during a perturbation was found to be more intuitive than the numericalAGD with or without perturbations. There were no differences found between the displays andconditions when pilots were asked if the IM speeds made sense, but both had positive ratings.Related to this finding (as the early / late [progress] indicator was attempting to support thisunderstanding), pilots reported that they did not use the early / late (progress) indicator oftenand did not find it very useful. The fast / slow indicator was reported it to be moderately usefulbut comments indicated pilots did not use it and did not think it should be a requirement fordisplay.
Pilots were faster to implement the IM speeds with the graphical AGD, which the authorsattributed to the more salient method of alerting to the new IM speeds (versus somethingbetter in the graphical elements). No significance for the deviation from the IM speeds.
Overall, the graphical AGD was found to be better than the numerical AGD. However, thenumerical AGD was reported to be sufficient but not ideal. The authors stated reasons why thespecific implementation of the early / late (progress) indicator could be problematic and whyother algorithms may have different outcomes. They also stated variations in the system cancause the spacing error to increase, but be nulled out later in the operation, leading to difficultyin understanding and interpreting the displayed information and how it relates to the possibilityof getting a new IM speed. The authors suggest that a future simulation could examine theprogress indicator with a different algorithm and a different representation to increase theusefulness. In a summary of this simulation, Baxley et al. (2014) recommend removing the early/ late (progress) indicator if it cannot be improved. They also recommend adding an aural chimeor flashing indicator to improve the saliency of new IM speed notifications.
Baxley et al. (2016) reported the final HITL simulation of the ATD-1 activity. It included nominaland off-nominal events (e.g., separation issue). The simulation used an auxiliary / EFB display(Figure 2-30) and a graphical AGD (Figure 2-31) in the primary field of view. The EFB was usedfor set-up. New IM speeds were annunciated by the IM speed being shown in reverse videountil the IM speed was set in the MCP. If that was not done within 10 seconds, the field flashed.As can be seen both an early / late indicator and a fast / slow (progress) indicator were used(features D and H in Figure 2-30). The early / late indicator was only shown on the auxiliary /EFB display (feature A in Figure 2-31).

© The MITRE Corporation. All rights reserved
2-43
Figure 2-30. CDTI Traffic Display with IM Features from Baxley et al. (2016) [Reprinted fromBaxley et al., 2016]
Figure 2-31. Graphic AGD with IM Features from Baxley et al. (2016) [Reprinted from Baxleyet al., 2016]
As with previous work, the early / late indicator was intended to assist the flight crew indetermining whether the ASG could be achieved, within tolerances, by the ABP. It was modifiedfrom previous simulations and displayed to the flight crew when specified by DO-361 (RTCA,2015a). Two scales were shown. One when the aircraft was greater than greater than 210

© The MITRE Corporation. All rights reserved
2-44
seconds from ABP and within 210 seconds of the ABP (Figure 2-32). When greater than 210seconds, the scale was +/- 120 seconds and the circle had a diameter of 20 seconds centered onthe spacing error. When within 210 seconds, the scale was +/- 45 seconds, and the circle had adiameter of 20 seconds centered on the spacing error.
Figure 2-32. Early / Late (Progress) Indicator When Greater than 210 Seconds from ABP (Left)and within 210 Seconds from ABP (Right) [Reprinted from Baxley et al., 2016]
The fast / slow indicator was intended to allow the pilot to determine current IAS and IM speedmismatches and what action to take. As mentioned previously, it is not simply an indication ofwhether the aircraft’s current IAS matched the IM speed. In this simulation, the green triangleon the indicator considered the IM speed, delay due to pilot behavior, and aircraft decelerationrate. It stayed fixed at the center of the display. The solid white triangle was the aircraft’scurrent IAS. The two triangles could have been aligned when an IM speed change occurred, butthen started to diverge when the aircraft should have been changing speed to match the IMspeed and the expected speed profile.
Pilots reported that the fast / slow indicator was not very useful, confusing, and many werereported to have ignored it. The authors reported pilot confusion when the aircraft’s currentIAS matched the IM speed but the fast / slow indicator displayed a “too slow” alert because theaircraft decelerated faster than the algorithm expected. A redesign and move to the speed tapeon the PFD was recommended by the authors.
Pilots also reported that the early / late (progress) indicator was not very useful and could beconfusing. However, results were mixed and variable. The authors also stated that the pilotaction when reaching the boundary were unclear, as it was not an indicator of infeasibleoperations. Again, the authors stated a need to improve the design, including showing theinfeasible limits. The authors also recommend defining pilot procedures to notify ATC when theoperation becomes infeasible.
The IM speed limit notifications were reported as confusing to pilots since there was no actionto take based on the information. Finally, based on pilot attention concerns, the authorsrecommended keeping the alerting scheme associated with IM speeds but to add an additionalaural alert at 15 seconds if the flight crew had not yet implemented the IM speed.

© The MITRE Corporation. All rights reserved
2-45
2.5.2.1.3 MITRE ResearchThe MITRE Corporation has been conducting simulations and participating in field and flighttests of IM over the course of many years to support concept and requirements definitions.Several were in conjunction with community activities where NASA also participated andsupported through the previously reported activities. The following paragraphs review the mostrelevant MITRE activities.
An early effort supporting a flight event examined IM (Bone, Helleberg, and Domino, 2003).Two IM algorithms were used. In one, the symbology on the navigation display and algorithmwere very similar to Oseguera-Lohr et al. (2002), as the organizations were working together onthe capability. The navigation display included the lead aircraft identification, weight category,ground speed, and distance from the trail aircraft. The navigation display also provided the IMspeed and the speed set in the MCP, as well as the spacing position indicator and history trail.For this implementation, a flashing box was provided around the IM speed when a new onewas displayed. An IM speed bug was also presented on the airspeed tape of the PFD.
For the other algorithm, the navigation display had the same features except for the spacingposition indictor and history trail. This algorithm included an aural alert (e.g., “Reduce speed180”) for new IM speed notifications. Based on previous feedback, a graphical prediction toolwas provided that attempted to provide the flight crew an independent check of thefunctioning of the underlying algorithm and supported the prediction of the new IM speeds. Itshowed a zone where getting a new IM speed was likely and a zone where getting a new IMspeed was unlikely.
Pilots in this activity reported wanting to be able to monitor the progress of the spacingoperation in relation to the ASG, including being able to predict when new IM speeds would beissued. Pilots reported wanting to know when to abandon IM due to spacing issues. Pilotfeedback was mixed as to whether an aural alert was necessary for new IM speeds. However,pilots reported that flashing box for new IM speeds was insufficient.
The authors recommended improving the spacing prediction tool such that the flight crew isbetter able to judge the underlying functionality of the algorithm and to explore making it clearto the flight crew when the speeds available and the existing spacing do not allow for IM to beconducted successfully (i.e., when to report “unable”). They also recommended furtherexploration on the need for an aural advisory for new IM speeds.
In support of a retrofit field implementation of IM, MITRE conducted several activities tosupport the definition of the concept and display requirements. Key activities are reportednext.
An initial activity conducted with FAA certification and test pilots was reported in Bone andPenhallegon (2006). An aft retrofit EFB was used to host the CDTI traffic display (Figure 2-33)and for setup. The display included the current IAS and the IM speed, a fast / slow graphicalindicator (simply current IAS relative to IM speed), as well as the lead aircraft identification,weight category, ground speed, and distance from the trail aircraft. An AGD was attached to theMCP just below the airspeed window and was intended to provide the key pieces ofinformation for IM conduct. It provided the IM speed, as well as closure rate and range to the

© The MITRE Corporation. All rights reserved
2-46
lead aircraft (Figure 2-34). New IM speeds were presented in reverse video on the AGD until thepilot set the MCP speed to the IM speed.
Figure 2-33. CDTI Traffic Display with IM Features from Bone and Penhallegon (2006)
Figure 2-34. AGD with IM Features from Bone and Penhallegon (2006)
The pilots questioned the use of closure rate and thought an aural may be necessary toannunciate a new IM speed. Further research was suggested. The pilots also believed an alertwas necessary if the flight crew was significantly off from the IM speed. Pilot opinions were spliton the usefulness of the fast / slow indicator.
This work continued with line pilots and the first activity is reported in Bone et al. (2008a).Nominal and off-nominal scenarios were evaluated. The traffic display implementation was thesame as in Bone and Penhallegon (2006). One scenario removed the traffic display and theflight crew only had the AGD. The intent was to examine the ability of the flight crew to conductIM with only the information available on the AGD. The AGD was also the same, except theclosure rate field was changed to differential ground speed based on pilot feedback. Onescenario included new fields on the AGD. The range to the lead aircraft was replaced by in-traildistance and a new field was added: in-trail time. New IM speeds were presented on the AGDwith the same method as Bone and Penhallegon (2006).
All display features were found to be useful and little discrimination was found between thedifferent elements. Pilots reported the in-trail time was useful, but the in-trail distance was less
140GS 2601200/15
15
S
12
20
GS 250 19.8 NMUPS350 HVY
UPS350+09
+12
TRK MAG
275 IASF
S
275Merging & Spacing Data
TGTFID
SPCINT
MRGWPT
UPS350
90 sec
ENL
FAS
MINDIST
140 kt
3.0 nm
STOP
HIDE MENU
HIDE DATA
140GS 2601200/15
15
S
12
20
GS 250 19.8 NMUPS350 HVY
UPS350+09
UPS350+09
+12
TRK MAG
275 IASF
S
275Merging & Spacing Data
TGTFID
SPCINT
MRGWPT
UPS350
90 sec
ENL
FAS
MINDIST
140 kt
3.0 nm
STOP
HIDE MENU
HIDE DATA
275 + 1019.8
CMD CRRNG
275 + 1019.8
CMD CRRNG

© The MITRE Corporation. All rights reserved
2-47
so. Pilots reported wanting additional information for the condition where the spacing wasbecoming an issue. Pilots had issues determining when to intervene when a spacing issue wasnoted. All pilots agreed that they had a clear understanding of the target spacing and how wellit was being achieved. While the pilots followed a majority of the IM speeds and achieved theASG within tolerances, the authors report some mistrust of the IM equipment and speed. Thiswas believed to be due in part from the complexity of the algorithm, the algorithm acting oninformation unknown to the pilot (e.g., trajectory information), a potential for better displayelements (e.g., in-trail time versus differential ground speed), and a potentially poor mentalmodel. Finally, pilots were in disagreement on the need for and implementation of an auralalert to indicate a new CMD. Pilots reported an aural may only be necessary if the IM speed hasbeen ignored for some period of time.
A follow-on study was conducted and reported in Bone et al. (2008b). Nominal and off-nominalscenarios were evaluated. The traffic display implementation was the same as in the previoustwo activities, except a graphical position indicator (aka “picnic table”) was displayed (providingthe same information as that in previous NASA activities). The AGD displayed the IM speed andrange to the lead aircraft. When new IM speeds were presented on the AGD, they flashed for aset amount of time, depending on the difference between the current IAS and the IM speed.The flashing was cleared when a speed was entered into the MCP (the speed did not need tomatch the IM speed) within 20 knots of the IM speed.
Pilots reported the displays had the necessary information and that they understood how IMwas progressing. The authors speculated that there was less distrust of the algorithm and theassociated IM speeds than seen in Bone et al. (2008a). That was stated to be due to increasedtraining and the removal of the differential ground speed on the AGD.
Pilots spent more time viewing the CDTI traffic display when an overtake situation wasdeveloping. Most pilots did not report a need for an aural alert to annunciate new IM speedsand opinions were varied on whether an aural alert is necessary if the IM speed has beenignored for some period of time.
An Aviation Communication & Surveillance Systems (ACSS) avionics implementation similar tothat studied in the MITRE simulations was certified, implemented on UPS aircraft, and used inlimited revenue flight starting in 2008. A field test of that operation is reported in Penhallegonet al. (2016a). One noteworthy display outcome was that the visual-only alerting for new IMspeeds was reported by the pilots to be acceptable.
After the ACSS and UPS implementation was fielded, IM research continued. Penhallegon et al.(2011) reported on a simulation investigating IM during the departure phase of flight. The CDTIsdiscussed in the 2006-2008 studies were largely based on the ACSS SafeRoute system that washosted on a UPS flight deck implementation. The departure simulation, however, utilized a newCDTI that allowed for the integration, control, and operation of multiple ADS-B functions(Figure 2-35). The auxiliary / EFB displays for this activity were also in a different location andnearly perpendicular to the pilots’ forward position due to the desire to replicate certain actualaircraft space constraints. The new locations were also closer to the pilots’ forward field ofview. The traffic displays included new elements such as the lead aircraft route and informationshown in a data block next to the lead aircraft (i.e., identification, ground speed, differential
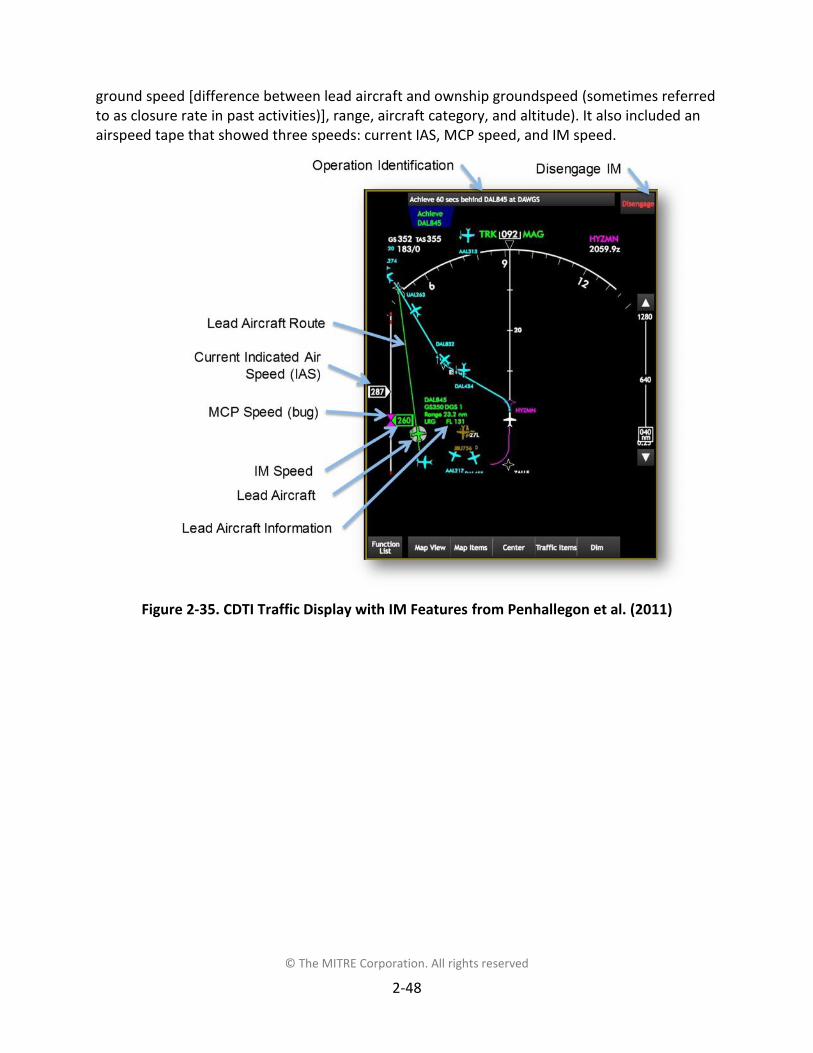
© The MITRE Corporation. All rights reserved
2-48
ground speed [difference between lead aircraft and ownship groundspeed (sometimes referredto as closure rate in past activities)], range, aircraft category, and altitude). It also included anairspeed tape that showed three speeds: current IAS, MCP speed, and IM speed.
Figure 2-35. CDTI Traffic Display with IM Features from Penhallegon et al. (2011)

© The MITRE Corporation. All rights reserved
2-49
The AGD included the lead aircraft identification, in-trail time, and the IM speed (Figure 2-36).New IM speeds were indicated by depicting a box around the IM speed for 10 seconds (to beconsistent with the typical time period for PFD autoflight mode annunciation changes).
Figure 2-36. AGD with IM Features from Penhallegon et al. (2011)
Pilots showed high compliance with IM speeds and reported that the displays had thenecessary information. All display features were found to be useful and little discrimination wasfound between the different elements. Target aircraft weight category had the most “not veryuseful” ratings. Differential ground speed was rated overall as more useful than in-trail time;however, they were both rated highly which suggests that pilots used them together to obtainspacing trend / performance information. The information that differential ground speedprovides is whether the IM Aircraft is opening or closing on the target, and how quickly. Theinstantaneous differential ground speed provided differences in ground speeds based oncurrent ground speeds, whereas the algorithm was basing the IM speeds on a past speed andposition of the target aircraft. Therefore, pilots would see the differential ground speedincrease as the lead aircraft slowed with no associated IM speed (the IM speed would arrive atthe future position where the target aircraft slowed, and not before). This seemed to lead somepilots in other simulations into making a speed change and question why the system was notcorrecting (e.g., Bone et al., 2008a). However, this effect was not necessarily observed in thecurrent study. The majority of pilots felt that they had a clear understanding of their spacingand how well it was being achieved. This, coupled with high IM speed conformance andminimal initiated speeds not issued by IM, indicated they appeared to trust the performance ofthe system and were not confused by the differential ground speed. As with other simulations,there were pilots that reported wanting more salient new IM speed annunciations, includingmentions of an aural annunciation.

© The MITRE Corporation. All rights reserved
2-50
2.5.2.2 Flight Deck Display Spacing Information Research NeedsAs can be seen from past work, much is understood about useful IM flight deck displayfeatures. However, some questions remain open. Key topics that still need to be resolved arerelated to the necessary and appropriate spacing and trend information as well as theappropriate alerting associated with IM speed changes and deviations.
Appropriate alerting to IM speed changes has been challenging to specify. Some pilots haveexpressed a desire for aural alerting, though overall pilot feedback has been varied on whetheraural alerting is necessary at all, and, if so, for what issue (e.g., new IM speed, deviation fromIM speed). There are also some concerns about the intrusiveness and the appropriateness ofaural alerting. This is an area where further study is necessary.
For the spacing and trend information, past simulations have examined different displayfeatures to support the flight crews in their desire to monitor the progress of and trust in theIM operation. The spacing information has taken on numerous forms including: current intervalrelative to the ABP, projected interval at the ABP, differential ground speed, closure rate,straight-line range, etc.
Past work has shown that certain information can lead to confusion, additional workload andhead-down time, or lack of use. Most past work has found some analog, graphical display ofthis information to be most useful. Some work has been successful in specifying and requiring afeature for conveying required spacing relative to current spacing and spacing trendinformation (i.e., Hoffman et al., 2006). However, other past work has continued to recommend(e.g., Bone et al., 2008a; Baxley et al., 2014) a similar feature, yet the exact implementation hasbeen difficult to specify / develop. DO-361 (RTCA, 2015a) includes requirements andrecommendations for a progress indicator that should now be considered in the design of sucha feature. This is an area that would benefit from additional study.
The past work shows that an ideal, or even reasonable minimum, implementation has beenchallenging to finalize. Some tools may also only be necessary for certain IM algorithms (e.g., afast / slow indicator in the NASA work).
This HITL simulation will continue to study these issues by examining the minimumimplementation defined in DO-361 (RTCA, 2015a) and an implementation that adds additionalelements to increase pilot confidence in the operation.

© The MITRE Corporation. All rights reserved
3-1
3 MethodA majority of the simulation methodology described in this section was reviewed with key FAAstakeholders during the concept evaluations (reviewed in Section 2.4.2.3). Reviews of themethodology allowed the stakeholders to provide feedback that could be incorporated in thefinal simulation design. After incorporating inputs, dry run testing was executed with internaland external participants. Suggestions for changes from the development activities wereincorporated prior to data collection activities.
3.1 Simulation EnvironmentThe simulation was conducted in the MITRE IDEA Laboratory. The simulation utilized controller,flight crew, and pseudo-pilot workstations from past ADS-B simulations that were modified asnecessary for this effort. The following sections describe the utilized capabilities.
3.1.1 Flight Deck WorkstationThe flight deck simulator consisted of a typical Boeing 777 flight deck layout as shown in Figure3-1. The equipment included standard elements such as a MCP, two radio management panels,EICAS, a Flight Management System (FMS) with CDU interfaces, dual PFDs, and dual navigationdisplays. The simulator also included a 180-degree out-the-window visual capability. New trafficdisplay components were added to accommodate IM (i.e., elements on the CDTI traffic displayand AGD). Two CDTI traffic displays were hosted on auxiliary displays: one at the captain’seleven o’clock position and the other located at the First Officer’s (FO’s) one o’clock position.The AGD was located above the stand-by attitude indicator. The locations of the CDTI trafficdisplay and AGD are shown in Figure 3-2. The utilized CDTI traffic display and AGD elementswere based on requirements for ADS-B and IM (DO- 317B / RTCA, 2014, DO-361 / RTCA, 2015a).Most all the requirements were met, however, some were not implemented based on theexpectation that they would not be utilized in the simulation (e.g., IM turn requirements). TheIM algorithm utilized was specified in DO-361 (RTCA, 2015a) and is described further in Section3.1.2.
The flight deck IM equipment did not have an interface to the FMS or autothrottle systembased on the desire to examine a near-term, retrofit implementation. The following sectionsreview the IM implementation in detail.

© The MITRE Corporation. All rights reserved
3-2
Figure 3-1. Flight Deck Simulator
Figure 3-2. CDTI Traffic Display and AGD Locations

© The MITRE Corporation. All rights reserved
3-3
3.1.1.1 CDTIPer DO-317B (RTCA, 2014, p. 96), “the CDTI is defined as the displays and controls necessary tosupport [ADS-B In applications]...the CDTI may be integrated into a number of display andcontrol sub-elements.” Based on that definition, the CDTI implementation in this simulationconsisted of two display elements: the CDTI traffic display and the AGD.
As noted previously, the IM features were based on requirements in DO-361 (RTCA, 2015a).DO-361 (RTCA, 2015a) specifies five CDTI states:
Awaiting entry: IM operation is not yet active but system / input interface is ready forflight crew entry.
Evaluate: IM information is being processed and is available for flight crew coordination/ confirmation.
Execute: IM operation is active.
Suspend: IM operation is temporarily inactive.
Terminate: IM operation is complete / inactive.
DO-361 (RTCA, 2015a) also defines over 20 information elements (e.g., IM speed, ASG, suspendindication, alerts) that have different display requirements per each of the five CDTI states.Information elements are either required to be displayed, available to be displayed with simpleaction, or required to not be displayed. Some of the information elements are required to bedisplayed in the primary field of view. Other information elements are also recommended to bedisplayed (e.g., the graphical route of the lead aircraft). The required features wereimplemented per the standard. Particular features of interest for this simulation and furtherdescription include the progress indictor, feasibility check status indication, and the IM speedconformance monitoring status visual advisory.
The behavior of the IM speed conformance is defined in DO-361 (RTCA, 2015a). After an IMspeed is presented to the flight crew, an 11 second delay is activated that allows time for theflight crew and aircraft to react to the new speed. After the 11 seconds has transpired, theaircraft’s current speed is compared to an expected speed change profile (0.5 knots [kts] persecond), built as a linear change of speed between the current aircraft speed and the IM speed.If the aircraft deviates from that speed change profile by more than 5 knots (faster for adeceleration or slower for an acceleration), the IM speed conformance visual and aural advisoryis displayed to the flight crew. When the aircraft speed is brought within 5 knots of the IMspeed, the speed conformance monitoring stops and no additional advisories are provided.Monitoring is stopped at this point because the flight crew is within acceptable tolerances ofthe IM speed. If any corrections are necessary after that point, a new IM speed will bepresented and monitoring will be resumed.
The HITL simulation implementation of the conformance monitoring and alertingunintentionally deviated from that defined in DO-361 (RTCA, 2015a). The HITL implementationtriggered the advisory at any speed off the expected speed change profile (i.e., the 5 kttolerance was not implemented). It also advised after the aircraft’s speed got within 5 knots of

© The MITRE Corporation. All rights reserved
3-4
the IM speed, but then again went greater than 5 knots of the profile speed (i.e., themonitoring and alerting was not inhibited after the aircraft was within 5 knots of the IM speed).
Per DO-361 (RTCA, 2015a), the feasibility check status indication was provided when theequipment determined the ASG could not be achieved even if the IM trail aircraft flew itsfastest or slowest speeds relative to the speed profile. It was only provided during the achievestage when greater than 30 NM from the ABP. A visual advisory was provided to the flight crew.If the aircraft was unable to slow enough to achieve the ASG [as determined by the equation(Predicted Spacing Interval [PSI] + 0.15 x time-to-go [TTG]) < ASG], the flight crew was providedwith the message: “Not feasible, ASG too large.” If the aircraft was unable to speed up enoughto achieve the ASG [as determined by the equation (PSI – 0.11 x TTG) > ASG] the flight crew wasprovided with the message: “Not feasible, ASG too small.” The multiplier for the TTG value islarger because the aircraft has a greater capability to slow down than it does to speed up.
For time-based ASGs, a progress indicator is required to be provided to the flight crew forsituation awareness information during the maintain stage and when within 30 NM of the ABPfor the achieve stage. At a minimum, the progress indication is defined as simply the display ofthe numerical values of the ASG and either the PSI (during the achieve stage) or the MeasuredSpacing Interval (MSI) (during the maintain stage)3. The progress indicator is one of theinformation elements that must be displayed in the primary field of view.
The minimum implementation of the feasibility check and progress indicator in the context ofthis simulation environment (described in 0) is shown in Figure 3-3. In that figure, the black textrelates to information provided when the aircraft is greater than 30 NM from the ABP and thegreen text relates to information provided when 30 NM or less from the ABP.
Figure 3-3. Minimum Requirements for Feasibility Check and Progress Indicator
3 The MSI and PSI were, unintentionally, shown outside of 30 NM from the ABP in the simulation. However, theamount of time that the participant flight crew was actively conducting IM outside of 30NM from the ABP waslimited, especially when the DERVL waypoint was the ABP.
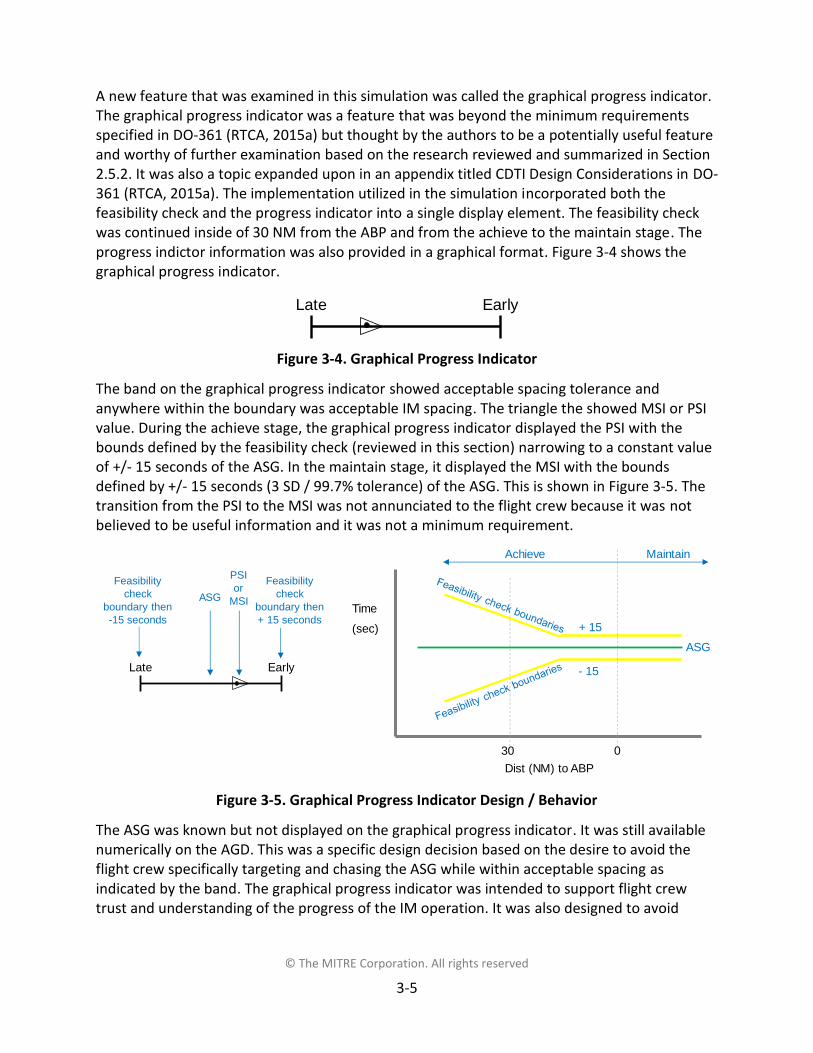
© The MITRE Corporation. All rights reserved
3-5
A new feature that was examined in this simulation was called the graphical progress indicator.The graphical progress indicator was a feature that was beyond the minimum requirementsspecified in DO-361 (RTCA, 2015a) but thought by the authors to be a potentially useful featureand worthy of further examination based on the research reviewed and summarized in Section2.5.2. It was also a topic expanded upon in an appendix titled CDTI Design Considerations in DO-361 (RTCA, 2015a). The implementation utilized in the simulation incorporated both thefeasibility check and the progress indicator into a single display element. The feasibility checkwas continued inside of 30 NM from the ABP and from the achieve to the maintain stage. Theprogress indictor information was also provided in a graphical format. Figure 3-4 shows thegraphical progress indicator.
Figure 3-4. Graphical Progress Indicator
The band on the graphical progress indicator showed acceptable spacing tolerance andanywhere within the boundary was acceptable IM spacing. The triangle the showed MSI or PSIvalue. During the achieve stage, the graphical progress indicator displayed the PSI with thebounds defined by the feasibility check (reviewed in this section) narrowing to a constant valueof +/- 15 seconds of the ASG. In the maintain stage, it displayed the MSI with the boundsdefined by +/- 15 seconds (3 SD / 99.7% tolerance) of the ASG. This is shown in Figure 3-5. Thetransition from the PSI to the MSI was not annunciated to the flight crew because it was notbelieved to be useful information and it was not a minimum requirement.
Figure 3-5. Graphical Progress Indicator Design / Behavior
The ASG was known but not displayed on the graphical progress indicator. It was still availablenumerically on the AGD. This was a specific design decision based on the desire to avoid theflight crew specifically targeting and chasing the ASG while within acceptable spacing asindicated by the band. The graphical progress indicator was intended to support flight crewtrust and understanding of the progress of the IM operation. It was also designed to avoid
Late Early
Dist (NM) to ABP
Time(sec)
30 0
Achieve
ASG+ 15
Maintain
- 15
Feasibilitycheck
boundary then-15 seconds
Feasibilitycheck
boundary then+ 15 seconds
ASG
PSIor
MSI
Late Early
© The MITRE Corporation. All rights reserved
3-6
leading the flight crew to outguess the IM algorithm and to implement speeds other than theIM speeds provided.
Another above-the-minimum feature implemented on the CDTI was the speed tape, which wasalso expected to be useful. The speed tape showed three speeds: the aircraft IAS, the speed setin the MCP, and IM speed. If all symbols aligned, the IM speed was set in MCP and aircraft wasflying the IM speed. The speed tape was displayed on the CDTI traffic display and is shown inFigure 3-6.
Figure 3-6. Speed Tape

© The MITRE Corporation. All rights reserved
3-7
The information provided on the CDTI traffic display and the AGD is shown in Figure 3-7 andFigure 3-8. The CDTI provided basic traffic information, and was used to set up and perform IMoperations. The AGD served as the source of key IM information, including alert notification(i.e., advisory [ADV] flag), as specified in DO-361 (RTCA, 2015a). Two flight deck tool sets wereexamined in the simulation. The first was termed “min” and was built to the standards specifiedin DO-361 (RTCA, 2015a). The second was termed “min+” and included two features notrequired in DO-361 (RTCA, 2015a): the graphical progress indicator and speed tape.
Figure 3-7. CDTI Traffic Display with IM Information Labeled
Figure 3-8. AGD with IM Information Labeled
© The MITRE Corporation. All rights reserved
3-8
3.1.1.2 CDTI Traffic Display and AGD During CDTI States / AlertsThe following figures show sample CDTI traffic display and AGD displays during IM operations.The implementations are shown with min+ implementation that was used in some scenarios.
Figure 3-9 shows the CDTI traffic display and the transitions when entering information in theinterface. The screenshot on the left shows an aircraft selected and the Operation button at thetop center of the display. After pressing the Operation button, the display provided options forchoosing the ADS-B In application (as shown in the middle screenshot). Once IM was chosen,the IM clearance options were shown. For the participant pilots in this simulation, only the IMachieve options were utilized. After selecting “Achieve”, the specific menu to IM achieveoperations was displayed and the Pilot Monitoring (PM) then entered the necessaryinformation by selecting a field and using soft keyboards to input the clearance. That menu isshown in the right screenshot and has the lead aircraft field (i.e., “Behind”) auto-populatedbased on that aircraft being previously selected4. The lead aircraft field could be manuallypopulated if the lead aircraft had not been selected or a different aircraft had been selected.After entering the necessary information into the menu, a “Confirm” button was provided thatallowed for cross-cockpit coordination with the PF. Once the confirm button was pressed, thedisplays transitioned to the evaluate state.
Figure 3-9. CDTI Traffic Display and AGD During Awaiting Entry State
4 This feature is not a minimum requirement for a CDTI traffic display.

© The MITRE Corporation. All rights reserved
3-9
In the evaluate state, the menu with all the information entered along with the first IM speedwas shown to both the PM and the PF for review and coordination (Figure 3-10). The IM speedwas also shown on the AGD in white, to differentiate it from the green IM speeds in the executestage. Once an SI and IM speed had been calculated and provided, an execute (Exec) buttonwas provided on the PM’s CDTI traffic display (in the same location as the Confirm button).Once both flight crew members agreed that the information was correct and the operation wasfeasible, the PM pushed the execute (Exec) button.
Figure 3-10. CDTI Traffic Display and AGD During Evaluate State

© The MITRE Corporation. All rights reserved
3-10
The displays during the execute state are shown in Figure 3-11. When a new IM speed waspresented on the AGD, a white box surrounded the speed and remained for 10 seconds. The SIfield on the AGD presented the PSI if in the achieve stage and the MSI if in the maintain stage.
Figure 3-11. CDTI Traffic Display and AGD During Execute State

© The MITRE Corporation. All rights reserved
3-11
Figure 3-12 shows the displays if the IM speed conformance monitoring status visual and auraladvisory was triggered. The AGD provided the flag for the advisory notification and the CDTItraffic display presented the content of the advisory. This advisory message and all others wereonly removed from the CDTI traffic display after the flight crew pressed the “Msg Canc/Rcl”button.
Figure 3-12. CDTI Traffic Display and AGD During Execute State—IM Speed ConformanceMonitoring Status Visual Advisory

© The MITRE Corporation. All rights reserved
3-12
Figure 3-13 shows the displays if the feasibility check status indication was triggered. The AGDprovided the flag for the advisory notification and the CDTI traffic display presented the contentof the advisory.
Figure 3-13. CDTI Traffic Display and AGD During Execute State—Feasibility Check StatusIndication
© The MITRE Corporation. All rights reserved
3-13
Figure 3-14 shows the displays if a suspension occurred by the flight crew pushing the Suspendbutton. As can be seen, the majority of the information is removed from the AGD. A Resumebutton was provided on the CDTI traffic display which would call up the clearance menu (asshown in Figure 3-9 in the right screenshot) so that clearance information could be edited ifnecessary. All fields could be edited except the lead aircraft identification.
Figure 3-14. CDTI Traffic Display and AGD During Suspend State

© The MITRE Corporation. All rights reserved
3-14
When reaching the PTP or when IM was terminated by the flight crew pushing the Terminatebutton, the displays looked like those in Figure 3-15. The AGD provided the flag for the advisorynotification and the CDTI traffic display presented the content of the advisory. IM informationwas removed from the displays.
Figure 3-15. CDTI Traffic Display and AGD During Terminate State
3.1.2 IM Sample AlgorithmThe IM algorithm used in the simulation was that defined in DO-361 (RTCA, 2015a). Theparticipant aircraft only used the achieve-by then maintain IM clearance type while the pseudo-pilot aircraft used both the capture then maintain IM clearance type and achieve-by thenmaintain IM clearance type (with a maintain stage when there was no RNP RF turn, and withouta maintain stage for RNP RF turn operations).

© The MITRE Corporation. All rights reserved
3-15
The achieve operation was used when aircraft were on different routes at the start of theoperation, as depicted in Figure 3-16. In the Achieve stage, the time-to-go algorithm was used.Four-dimensional reference trajectories were used to predict the lead and trail aircrafts’ times-to-go to the ABP, the PSI at the ABP (defined as the difference between the trail aircraft’s time-to-go at the ABP and the lead aircraft’s time-to-go at the ABP), and the IM speeds. IM speedswere calculated to drive the trail aircraft to an along-path position where its time-to-go to theABP was equal to the lead’s time-to-go plus the ASG (as shown by the light-blue dashedchevron in Figure 3-16). IM speeds were flown to make continual progress towards the ASG,with higher error tolerances allowed when further from the ABP where the time-to-goestimates were subject to larger errors. As the trail aircraft got closer to the ABP, errors in thepredicted times-to-go were decreased, and the IM speeds aided the flight crew in preciselyachieving the ASG.
Figure 3-16. IM Operation in the Achieve-by Stage
TTG – Time-To-Go
Once the ABP was reached, the aircraft went into the maintain stage and the time-historycontrol law was used. A MSI was calculated during the maintain stage. The MSI was thedifference between the current time and the time when the lead aircraft crossed the trailaircraft’s along-path position. If the MSI is equal to the ASG (i.e., no spacing error), IM speedswere calculated to drive the trail aircraft to match the ground speed of the lead aircraft at atime equal to the ASG in the past. If there was a spacing error, the IM speed calculationincluded the trail aircraft’s past speed plus a term that is proportional to the spacing error. Themaintain stage ended when reaching the PTP.
The capture operation5 was used when aircraft were on, and would remain on, a commonroute. Operationally, the behavior can be related to the achieve stage. However, the trail
5 DO-361 (RTCA, 2015a) requires extrapolation of aircraft positions at initiation if sufficient historical track data isnot available. This allows for the presentation of IM speeds until sufficient data is available and the spacinginterval and IM speed can be calculated without extrapolating. This requirement was not implemented for thissimulation due to a misunderstanding of the requirement. However, the authors do not believe that this gap inthe requirements affected the outcomes of the HITL.

© The MITRE Corporation. All rights reserved
3-16
aircraft captured the ASG (without a defined ABP) more quickly and then maintained the ASGuntil the PTP. The IM speeds were calculated as described for the maintain stage.
For both operations, time-based ASGs were used. The IM speeds were presented in 10 ktincrements when greater than 10 NM from the ABP and in 5 kt increments when less than 10NM from the ABP and when in the maintain stage. The IM algorithm limited the IM speeds to+/- 15% of the arrival procedure profile speed. The IM speeds were also limited by themaximum operating limit, the minimum final approach speed, and a regulatory restriction (250kts below 10,000 feet).

© The MITRE Corporation. All rights reserved
3-17
3.1.3 ATC WorkstationThe ATC interface was hosted on a STARS display with added TSAS and IM functionality. Thefollowing sections provide details on the implementations.
3.1.3.1 STARSThe terminal workstation had a representative 2K display that hosted a STARS interface thatwas very similar to the currently fielded STARS system. The workstation had a STARS keyboardand trackball (Figure 3-17). Some keyboard entries were programmed to serve as special IMfunctions (described in Section 3.1.3.3). The STARS workstation software consisted of aTerminal Controller Workstation display (Figure 3-18), and contained the majority of the basicSTARS functionality. A key, relevant spacing feature presented was ATPA, which is a spacingtool used on the final approach course. It provided distance and alerting information relative tothe lead aircraft and the associated separation standard (Figure 3-19). The overall functionalityavailable for the simulation was found sufficient for the simulation by controller domainexperts during development and concept evaluation activities.
Figure 3-17. STARS Keyboard
© The MITRE Corporation. All rights reserved
3-18
Figure 3-18. STARS-Like Display
Figure 3-19. ATPA

© The MITRE Corporation. All rights reserved
3-19
3.1.3.2 TSAS InterfaceFor this simulation, TSAS and terminal metering were the foundation upon which IM wasimplemented. The TSAS software code that was integrated into MITRE’s IDEA Lab was that usedin the Operational Integration Assessment (OIA) event conducted in May of 2015 at the FAAWilliam J. Hughes Technical Center (Witzberger, Martin, Sharma, and Robinson, 2015). Theinterface design was heavily based on those used in the OIA because a final design had notbeen specified and the OIA implementation was that used in the last major ATD-1 TSAS HITLsimulation activity. Minor modifications (e.g., sequence number and runway assignment fieldlocations) were made based on feedback from the concept evaluation activities leading up tothe HITL simulation. The TSAS features implemented included the following (shown in Figure3-20) as well as a timeline (shown in Figure 3-21). For more information on these TSAS featuressee Section 2.1.
Runway assignment
Sequence number (for the assigned runway)
Slot marker
Slot marker speed
Speed advisories or early / late indicators
Aircraft IAS
Timeline
Figure 3-20. Prototype TSAS Features on STARS
Z
6AAL652090 24180 A26
21
220
Slot marker speed
Slot marker Sequence number
Runway assignment
Aircraft IASSpeed advisory orearly / late indicator

© The MITRE Corporation. All rights reserved
3-20
Figure 3-21. Prototype TSAS Timeline on STARS

© The MITRE Corporation. All rights reserved
3-21
The appropriate time to remove the TSAS slot markers was discussed during the developmentof the simulation environment in the concept evaluation activities. At the time, it was expectedthat the TSAS slot markers would not be shown for aircraft when ATPA is active unless there areaircraft that are part of a RNP RF turn operation (Figure 3-22). It was stated that slot markerswould, at least, remain for the aircraft performing the RNP RF turn and the two aircraft that itwould go between (because the merge could be challenging for controllers without the slotmarkers). However, feedback from controller and ground experts indicated keeping the slotmarkers for all aircraft would be acceptable since the final design had not been specified andprevious work had slot markers present on final approach for all aircraft.
Figure 3-22. RNP RF Turn Traffic Geometry
During the development of the simulation environment, the impact of the TSAS features on IMwas considered. When using the TSAS features during terminal metering, the controller activelyissues speed instructions to aircraft to get them on schedule. During IM, flight crews fly speedsgenerated within the flight deck to achieve the ASG issued by the controller. While the IMaircraft is working toward the ASG, it may not be clear to the controller how well the operationis progressing or whether an aircraft will ultimately achieve the ASG or the underlying schedule.This could cause the controller to be concerned about or pay extra attention to the IM aircraft.The controller also needs to maintain awareness of which aircraft are conducting IM (and donot need speed instructions) and which aircraft are not conducting IM (that may need speedinstructions).
The use of the TSAS slot marker is likely to be affected by IM. Since IM is a relative spacingoperation, an IM trail aircraft is only adjusting its path to move into its slot marker if the leadaircraft is also doing so. While this relative spacing operation is also conducted by the controllerat times (e.g., on final approach when not all aircraft are in their slot markers), it may beconfusing to the controller to have some aircraft doing it on their own via the IM speeds.
IM may also lead to some confusion relative to the slot markers because it provides speeds toachieve the ASG at the ABP, while TSAS provides speeds to more constraint points and may getthe aircraft into the slot markers more quickly. In other words, it is expected that certaingeometries will lead to conditions where the IM trail aircraft are outside of their slot markersfor longer periods than aircraft being managed by controllers with TSAS features.
IM working toward achieving the ASG at a single point, and TSAS managing to several constraintpoints, could also lead to confusion if speed advisories and early / late indications are shown.

© The MITRE Corporation. All rights reserved
3-22
The speed advisories could be confusing if the controller sees a speed advisory that does notmatch the current IAS of an aircraft conducting IM. If the controller compares the speeds, itcould appear that IM will not meet the ASG. The early / late indication could be confusing forsimilar reasons. However, the equivalent of the TSAS early / late indication should probably stillbe provided for IM if the ground system determines the IM cannot solve the spacing error.
The other TSAS information elements including: runway assignment, sequence number for theassigned runway, slot marker indicated airspeed, aircraft indicated airspeed, and the timeline,are likely to be used by controllers in a similar way with or without IM. However, the aircraftindicated airspeed could be useful in helping the controller determine what speed the trailaircraft flight crew is flying for IM.
3.1.3.3 IM InterfaceThe ATC IM interface was added to the lab implementation of STARS. The display wasdeveloped in consideration of past work (e.g., Benson et al. 2011; Callantine et al., 2013) as wellas an early draft of a preliminary design document developed within (but not released by) theFAA. The TSAS features were not modified for IM operations. However, the speed advisory andearly / late indicator were replaced by IM information for the trail aircraft. The TSAS speedadvisories have been reported as less useful for IM operations (Thipphavong et al., 2013) andremoved in other simulations (Callatine et al., 2012) as well as concept evaluations prior to thissimulation.
Three main features were added for IM: an IM clearance window, aircraft role in and status ofIM in the aircraft data block, and a slot marker color change. This section will provideintroductory / background information and then review the specific features.
IM states were shown in previous simulations, though not all the states were the same (e.g.,Aligne et al., 2003; Benson et al., 2011; Baxley et al., 2016). For this simulation, the followingstates were defined from a ground system perspective and were relevant to the IM interface:
Pre-initiation: Automation is evaluating pairs of aircraft for IM. Eligible pairs arepresented to the controller as an IM operation proposal.
Initiation: Automation has proposed the IM clearance to the controller but the IMoperation has not been started.
Conduct: IM proposal has been accepted by the controller and is active if the controllerissued the clearance and the flight crew engaged IM.
Suspension: IM operation is temporarily inactive.
Termination: IM operation is inactive.
Each of the states can have sub-states related to the validity and feasibility of the operation (asshown in Figure 3-23). Transitions between states were either through controller or automationaction. See Appendix A for further information on the validity and feasibility checks. Controllerinputs to change states are shown in Table 3-1.

© The MITRE Corporation. All rights reserved
3-23
Figure 3-23. IM Clearance States and Transitions
Active
Active – No Speed
Active – Invalid
SuspendedEligible
Eligible – No Speed
Eligible – Invalid
Resume (/ Active)
Potential pair butfeasibility check failed
Controllerinput
Validitycheckfailed
Feasibilitycheck failedpassed /
Controllerinput
Suspended – No Speed
Suspended – Invalid
Validitycheckfailed
Feasibilitycheck failedpassed /
Controllerinput
Terminated
Terminated – No SpeedTerminated – Invalid
Validitycheck failed/ passed
Feasibilitycheck failedpassed /
Controllerinput
Validitycheckfailed
Feasibilitycheck failedpassed /
Clearanceremoved
Controllerinput
RejectedClearance removedafter 30 seconds
Clearance removedafter 30 seconds
Potential pair
Controllerinput
Validitycheckfailed
Validitycheckfailed
Validitycheckfailed
From Eligible or Eligible – No Speed

© The MITRE Corporation. All rights reserved
3-24
Table 3-1. STARS IM Prototype Controller Input Commands
Desired outcome Input commandsActivate / resume IM [MULTI FUNC] TA [SLEW TO TRAIL AIRCRAFT] [LEFT CLICK]Terminate / reject IM [MULTI FUNC] TT [SLEW TO TRAIL AIRCRAFT] [LEFT CLICK]
Suspend IM [MULTI FUNC] TS [SLEW TO TRAIL AIRCRAFT] [LEFT CLICK]Re-propose rejected IM [MULTI FUNC] TE [SLEW TO TRAIL AIRCRAFT] [LEFT CLICK]
Acknowledge alert [SLEW TO TRAIL AIRCRAFT] [LEFT CLICK]
Prior to providing the clearance information to the controller, validity checks were conducted(see Appendix A). Validity checks were made to determine whether the criteria for initiating IMwere met. If any of the validity check failed, the clearance was not proposed to the controller.Feasibility checks were also conducted prior to proposing and during any eligible IM clearanceproposal. Feasibility checks determined whether the IM operation could achieve the ASG withspeed alone (the equivalent of the TSAS early / late indicator). If any of the feasibility checksfailed, that information was presented to the controller in the status field as “Eligible – NoSpeed.” In order to overcome the feasibility issue, the controller needed to provide a vector orspeed greater or less than that IM would provide (i.e., greater or less than 15% of the profilespeed). Feasibility checks were also conducted during the suspended and terminated states(see Appendix A).
3.1.3.3.1 IM Clearance WindowBased on past work, it was determined that an IM clearance window should be used to provideinformation that the controller would communicate as part of the IM clearance. The STARSdisplay did not have a metering list to integrate the IM information into, so one had to bedeveloped.
It was determined that the clearance window should also show the status of the clearanceinformation (e.g., a proposed IM clearance versus an active IM operation). The informationprovided in the IM clearance window is expected to support that shown in the data block. Suchinformation may be necessary if not all states are shown in the data block (e.g., suspension orinvalid) or may be necessary to specify that status of each pair in the list so data blocks do notneed to be cross referenced.
Four of the five defined states were shown to the controller. Pre-initiation and initiation werecombined and labeled as “Eligible.” Conduct was labeled as “Active.” Suspension andtermination were labeled as “Suspended” and “Terminated” respectively.
If the clearance was determined to be valid and feasible, the clearance information and an“Eligible” status was provided in the IM clearance window to the controller with the trailaircraft. The information in the IM clearance window was only shown to the controller with thetrail aircraft, whether or not that controller also had the lead aircraft. The clearance could beaccepted or rejected by the controller. If the clearance was rejected, the Status field changed to“Rejected.” The text remained for 30 seconds prior to the full IM clearance proposal being

© The MITRE Corporation. All rights reserved
3-25
removed. This delay allowed for awareness of the rejected operation and to allow for re-activation if the rejection was in error. If an operation had been rejected, it was not proposedagain to the same controller / sector. However, it was proposed to the final controller. Thesame held true for terminated operations. If the clearance was accepted, instead of rejected,the status field changed to “Active.”
The order of the IM clearances in the IM clearance window were based on the runwaysequence. This means a new proposal did not always appear at the top of the list but couldappear somewhere further down the list based on the lead aircraft sequence number for therunway. This order was consistent with the order of the TSAS timeline.
The text in the window was color-coded to indicate different statuses (shown in Figure 3-24 andsummarize with other information in Table 3-2 at the end of this section). White text indicatedan action was possible (i.e., activation possible). The white text status states were one of thefollowing: “Eligible,” “Eligible – No Speed,” or “Suspended.” Green text indicated an IMoperation had been accepted by the controller. The status state was “Active.” Yellow textindicated an action was required (i.e., termination or a maneuver). The yellow text status stateswere one of the following: “Active – Invalid,” “Active – No Speed,” “Suspended – Invalid,”“Suspended – No Speed,” or “Terminated,” “Terminated – Invalid,” or “Terminated – NoSpeed.” Dark gray text indicated the information was going to be removed (based the proposalbeing inactive). The dark gray status state was “Rejected.” Note that the “Terminated” statuswas intended to be dark gray instead of yellow but the mismatch was not detected in time tocorrect the error before data collection.
Figure 3-24. IM Clearance Window
IM information
Trail Aircraft Clearance Type Spacing Goal Lead Aircraft (sector) ABP Lead Aircraft Route Status
SWA1825 Achieve 85 (72) AWE209 DERVL EAGUL6 Eligible
SWA947 Capture 83 (99) AAL431 Rejected
AAL529 Achieve 100 (115) AAL227 DERVL EAGUL6 Active – No speed
SWA1011 Capture 93 (99) SWA2053 (F) Active

© The MITRE Corporation. All rights reserved
3-26
Each of the fields in the IM clearance window are labeled and were in the same order as wasexpected in the issuance of the IM clearance over the voice frequency. Fields of note will bereviewed next.
The clearance types used in the simulation were achieve-by then maintain and capture thenmaintain. They were abbreviated as “Achieve” and “Capture” for brevity in the display andwhen issuing the clearance over the voice frequency. The ASG in the spacing goal field, wascalculated by TBFM and was the trail aircraft STA at the ABP minus the lead aircraft STA at theABP. The ASG had an “IM aware” buffer reduction of 0.1 NM based on the expected lowspacing variance provided by IM (as compared to metering only operations). The ASG waspresented with a 1-second resolution.
Next to the ASG was a spacing prediction value in parentheses (shown in some scenarios).Benson et al. (2011) and Aligne et al. (2003) reported that controllers found the predictedinterval at the ABP to be useful. It may become more critical as the ABP is close to or within acontroller’s airspace, as was the case for this simulation. Peterson et al. (2012) also reportedcontrollers finding it useful to having delay information. However, only a slight majority ofcontrollers reported that the MTE was useful for maintaining awareness of IM operations. Sincethis information is not available in the TRACON with TSAS, it was added with the granularityreduced to second (from a minute shown in en route). For achieve operations, the differencebetween the TSAS-calculated trail aircraft ETA at the ABP and the lead aircraft ETA at the ABPvalue was shown. For capture operations, the difference between the TSAS-calculated trailaircraft ETA at the FAF and the lead aircraft ETA at the FAF value was shown. These values wereprovided to allow the controllers to compare the spacing estimated by TBFM / TSAS (ETAdifferential / prediction) to the ASG and to determine how the operation was progressing.
After the lead aircraft identification in the lead aircraft field, the sector of the lead aircraft wasincluded if both aircraft were not in the same sector (in case coordination between thecontrollers was necessary). The ABP was either DERVL (the merge point) or YOKXO (the FAF andRNP RF turn final approach intercept) (later shown in Figure 3-32). The lead aircraft route wasthe IFPI of the lead aircraft. If it was a capture operation, the lead aircraft route was not shownsince it is a requirement that both aircraft be on the same route to conduct the captureoperation (which was checked by TBFM in this simulation as noted in Appendix A). It was alsonot shown so the controller knew that it was not necessary to convey in the IM clearance. Ifthe routes were different because the achieve operation was being conducted, the threeoptions for the lead aircraft route were: EAGUL6, BRUSR1, and BRUSR1.RNP (i.e., the BRUSR1arrival with the RNP RF turn).

© The MITRE Corporation. All rights reserved
3-27
The clearance information was removed for the feeder controller during a handoff of active IMoperations two minutes after the handoff of the trail aircraft. This delay was utilized to avoid IMinformation being cleared from the IM clearance window when a handoff of the trail aircraftwas accepted prior that aircraft crossing the sector boundary. It was desirable to have the IMinformation cleared from the IM clearance window when the trail aircraft crossed the sectorboundary, but it was reported that this information was not readily available within the STARSsystem. Two minutes was chosen as a reasonable number to test. Further testing would beneeded to determine whether two minutes is reasonable. The clearance information wasremoved for the final controller when the trail aircraft landed.
3.1.3.3.2 Other IM Information on the STARS DisplayIM information was also provided in other locations on the STARS display. The aircraft role inand status of IM indications are shown in Figure 3-25. The information for the trail aircraft wasshown in the third line of the data block. The field was not time-shared with other information.
Figure 3-25. Prototype IM Features on STARS
Z
6AAL652090 24T(A) A26L(A)
21
220
Blue slot marker
Trail aircraft statusLead aircraft status

© The MITRE Corporation. All rights reserved
3-28
As mentioned previously, the information for the trail aircraft replaced the TSAS speed advisoryand early / late indication because IM was the speed solution, and thus, the TSAS speedadvisories become unnecessary. However, an early / late indication relative to IM operationscould still be a key piece of information. As mentioned previously, such information was shownin the IM clearance window.
The status states for the trail aircraft were one of the following: “T(E)” / eligible, “T(A)” / active,“T(S)” / suspended, “T(I)” / invalid, or “T(NS)” / No Speed. Termination was not shown. Thetransitions between the major states are shown in Figure 3-26. The transitions to infeasible / nospeed states is shown in Figure 3-27. The infeasible state was only shown in yellow / as alertedfor active of suspended operations because controller action was required prior to theoperation returning to an active state.

© The MITRE Corporation. All rights reserved
3-29
Figure 3-26. IM Information in Trail Aircraft Data Block

© The MITRE Corporation. All rights reserved
3-30
Figure 3-27. IM Information in Trail Aircraft Data Block When Transitioning to a No Speed (NS) Solution

© The MITRE Corporation. All rights reserved
3-31
Based on positive feedback in previous simulations (e.g., Thipphavong et al., 2013), lead aircraftinformation was also shown in the aircraft data block. The information for the lead aircraft wasshown in the fourth line of the data block and did not replace any TSAS features. The field wasnot time-shared with other information. The status states were one of the following: “L(A)”/active and “L(S)”/ suspended. The lead aircraft was shown as active during invalid and infeasiblestates so the controller had awareness that the lead aircraft was part of an IM operation thatthe trail aircraft controller had not yet terminated. During the invalid and infeasible state, thecontroller with the trail aircraft was either working to correct the issue or would soon terminateIM. It was not expected that the lead aircraft controller needed to be notified of invalid andinfeasible states when the trail aircraft controller was working on the issue. It was expected tobe sufficient for the lead aircraft controller to simply know the lead aircraft was part of anactive operation. Therefore, the lead aircraft controller was only notified when the lead aircraftwas part of an IM operation. The lead controller was not notified of a proposed, infeasible, orinvalid operation. The lead aircraft controller was notified of a terminated operation by theremoval of IM information. The transitions between the major states are shown in Figure 3-28.If an aircraft acted as both a lead and trail aircraft, the information was the same as shown inthe figures but the trail and lead information would be present in one aircraft’s data block.
The capability of an aircraft to conduct RNP RF turns was also shown in the aircraft data blockand was shown as “/W” after the aircraft flight identification. Although it would have beenpreferable to show the “/W” after the aircraft type, it was not possible due to the availabledevelopment time.
Table 3-2 summarizes the information shown in the IM Clearance Window and the data blocks.

© The MITRE Corporation. All rights reserved
3-32
Figure 3-28. IM Information in Lead Aircraft Data Block

© The MITRE Corporation. All rights reserved
3-33
Table 3-2. Summary of Displayed IM Information in the IM Clearance Window and AircraftData Blocks
Stage State
IM clearance windowpresentation text and
(color)
Trail aircraftdata block
presentation
Lead aircraftdata block
presentation
Pre-InitiationValid and feasible Eligible
(white) T(E) None
Infeasible Eligible – No Speed(white) T(NS) None
Initiation
Valid and feasible Eligible(white) T(E) None
Invalid None1 None1 None1
Infeasible Eligible – No Speed(white) T(NS) None
Conduct
Valid and feasible Active(green) T(A) L(A)
Invalid Active – Invalid2
(yellow) T(I)2 L(A)
Infeasible Active – No Speed2
(yellow) T(NS)2 L(A)
Suspension
Valid and feasible Suspended(white) T(S) L(S)
Invalid Suspended – Invalid2
(yellow) T(I)2 L(S)
Infeasible Suspended – No Speed2
(yellow) T(NS)2 L(S)
Termination
Valid and feasible Terminated(yellow) None None
Invalid Terminated – Invalid(yellow) None None
Infeasible Terminated – No Speed(yellow) None None
Notes1. The clearance proposal is removed so no information is shown.
2. An alert is associated with this information. The alerts are triggered during Active andSuspended stages. Alerts are not triggered if the IM operation is at the Pre-Initiation, Initiation,or the Termination stages since the controller has not started or has ended the IM operation.
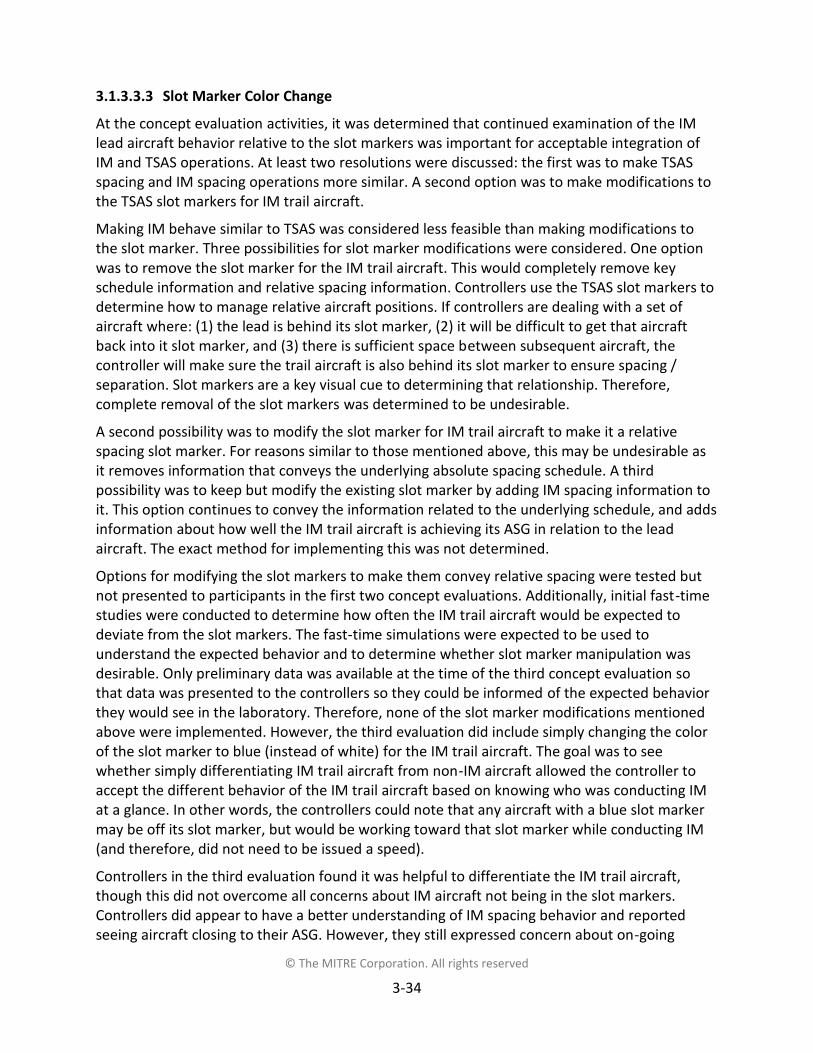
© The MITRE Corporation. All rights reserved
3-34
3.1.3.3.3 Slot Marker Color ChangeAt the concept evaluation activities, it was determined that continued examination of the IMlead aircraft behavior relative to the slot markers was important for acceptable integration ofIM and TSAS operations. At least two resolutions were discussed: the first was to make TSASspacing and IM spacing operations more similar. A second option was to make modifications tothe TSAS slot markers for IM trail aircraft.
Making IM behave similar to TSAS was considered less feasible than making modifications tothe slot marker. Three possibilities for slot marker modifications were considered. One optionwas to remove the slot marker for the IM trail aircraft. This would completely remove keyschedule information and relative spacing information. Controllers use the TSAS slot markers todetermine how to manage relative aircraft positions. If controllers are dealing with a set ofaircraft where: (1) the lead is behind its slot marker, (2) it will be difficult to get that aircraftback into it slot marker, and (3) there is sufficient space between subsequent aircraft, thecontroller will make sure the trail aircraft is also behind its slot marker to ensure spacing /separation. Slot markers are a key visual cue to determining that relationship. Therefore,complete removal of the slot markers was determined to be undesirable.
A second possibility was to modify the slot marker for IM trail aircraft to make it a relativespacing slot marker. For reasons similar to those mentioned above, this may be undesirable asit removes information that conveys the underlying absolute spacing schedule. A thirdpossibility was to keep but modify the existing slot marker by adding IM spacing information toit. This option continues to convey the information related to the underlying schedule, and addsinformation about how well the IM trail aircraft is achieving its ASG in relation to the leadaircraft. The exact method for implementing this was not determined.
Options for modifying the slot markers to make them convey relative spacing were tested butnot presented to participants in the first two concept evaluations. Additionally, initial fast-timestudies were conducted to determine how often the IM trail aircraft would be expected todeviate from the slot markers. The fast-time simulations were expected to be used tounderstand the expected behavior and to determine whether slot marker manipulation wasdesirable. Only preliminary data was available at the time of the third concept evaluation sothat data was presented to the controllers so they could be informed of the expected behaviorthey would see in the laboratory. Therefore, none of the slot marker modifications mentionedabove were implemented. However, the third evaluation did include simply changing the colorof the slot marker to blue (instead of white) for the IM trail aircraft. The goal was to seewhether simply differentiating IM trail aircraft from non-IM aircraft allowed the controller toaccept the different behavior of the IM trail aircraft based on knowing who was conducting IMat a glance. In other words, the controllers could note that any aircraft with a blue slot markermay be off its slot marker, but would be working toward that slot marker while conducting IM(and therefore, did not need to be issued a speed).
Controllers in the third evaluation found it was helpful to differentiate the IM trail aircraft,though this did not overcome all concerns about IM aircraft not being in the slot markers.Controllers did appear to have a better understanding of IM spacing behavior and reportedseeing aircraft closing to their ASG. However, they still expressed concern about on-going

© The MITRE Corporation. All rights reserved
3-35
deviations from the slot markers in the feeder’s airspace. They reported that their goal was toget all aircraft into their slot markers so that the handoff to the final controller would beacceptable and that they felt uncomfortable when aircraft were not in the slot markers.
Based on this feedback, it was decided that the slot marker color modification (shown in Figure3-25) was a good initial change to test. Therefore, the chosen modification to test was the trailaircraft slot marker color change from white to blue during some scenarios when controllermade the keyboard entry to indicate IM was active. The slot markers for trail aircraft remainedblue when an IM trail aircraft was in the suspended state but returned to white when controllermade the keyboard entry to indicate IM was terminated. The slot markers for trail aircraft andall other aircraft remained white.
3.1.3.3.4 Controller Tool Sets for EvaluationThe following three IM tool sets were developed for the simulation to examine the controllerinformation needs:
Basic: TSAS features, the IM clearance window, as well as the IM trail and lead aircraftstatus fields in the data blocks
Basic+ cue: The basic tool set plus the slot marker color change (cue)
Basic+ cue and prediction: The basic+ cue tool set plus the spacing prediction value(shown in parentheses after the lead aircraft identification in the IM clearance window)
3.1.4 Pseudo-Pilot WorkstationPseudo-pilots acted as “pilots” for all (some IM capable and some not IM capable) aircraft otherthan the participant flight crew’s aircraft. This allowed the controller to interact normally withthe traffic. It also allowed aircraft to maneuver based on controller instructions, which isreflected on both the controller and flight crew displays. The pseudo-pilots used an interfacetermed Simpilot which allowed users to simultaneously control multiple simulated aircraft(Figure 3-29). It provided basic information about the aircraft (e.g., aircraft call sign, type) andallowed the pseudo-pilot to control various aspects of the aircraft (e.g., heading, airspeed,altitude, route, communications frequency) and respond to controller instructions by enteringcommands.
The pseudo-pilots also initiated, suspended, resumed, and terminated IM per instructions fromthe controller. When the controller entered the command to accept the IM clearance, a pop-upwindow with the clearance information was displayed to the pseudo-pilot. Once the controllerissued the IM clearance via a voice communication, the pseudo-pilot acknowledged theclearance and then pressed “ok” in the window to engage the IM sample algorithm. Thisimplementation was to assist the pseudo-pilot (who was managing several aircraft) in enteringall the information associated with the IM clearance. However, it made the acceptance andentry of the clearance easier than it was for the participant aircraft flight crews and is more likea CPDLC implementation that allowed for loading of the IM clearance into the fight deck IMequipment without the need to memorize or write down the information and then type it in.

© The MITRE Corporation. All rights reserved
3-36
Figure 3-29. Pseudo-Pilot Interface (Simpilot)

© The MITRE Corporation. All rights reserved
3-37
3.1.5 AirspaceThe airspace modeled for this simulation was based on Phoenix International Airport (KPHX).North RNAV operations were run and aircraft landed to the west on runway 26, which wasoperated as a landing only runway. Aircraft also landed on runway 25L but as independentoperations (even though real-world operations at KPHX are not run independently). The airportenvironment is shown in Figure 3-30. The weather was visual meteorological conditions.
Figure 3-30. PHX Airport.
The two RNAV arrival procedures (BRUSR1 and EAGUL6) that were used were heavily based oncurrent arrival procedures. Minor modifications were made to have the arrival connect to theinstrument approach procedure. Modifications were also made to accommodate the RNP RFturns. RNP RF turns onto final approach can be challenging for controllers but are expected tobe supported by TSAS and will continue to be part of arrival and approach procedures in theterminal metering environment (Wynnyk and Kopald, 2013). Therefore, they were examined todetermine the impact of IM.
The airspace had one feeder (Apache airspace) and one final (Freeway airspace) position. Figure3-31 provides an overview of the airspace. The waypoints and the associated altitude andspeed constraints for the arrival procedures as shown in Figure 3-32. The TSAS constraint pointsused in the simulation were RHYAN (RNP RF turn start), DERVL (merge point outside final), andYOKXO (FAF).

© The MITRE Corporation. All rights reserved
3-38
Figure 3-31. PHX-Like Airspace Overview: Arrival Procedures and Controller Airspace
Figure 3-32. Arrival Procedures

© The MITRE Corporation. All rights reserved
3-39
Based on the arrival and approach geometries, a mix of different types of aircraft pairings couldoccur. For example, aircraft flying RNAV arrivals could follow aircraft flying the same or adifferent RNAV arrival. An aircraft flying the BRUSR1 arrival with the RNP RF turn could followanother aircraft flying the RNP RF turn, or it could follow an aircraft flying either RNAV arrivalwithout the RNP RF turn. Aircraft flying either arrival could follow an aircraft flying the BRUSR1arrival with the RNP RF turn. The geometries are shown in Figure 3-34 on the next page (withpotential IM pairings noted). One of the more interesting geometries is shown in Figure 3-33,where an aircraft flying the BRUSR1 RNAV arrival is following an aircraft flying the BRUSR1 withthe RNP RF turn. The sequence to the runway designed by TBFM can initially appear confusing ifthe RNP RF turn is not considered.
Figure 3-33. Geometry Where RNAV Aircraft is Following RNP RF Turn Aircraft on the SameArrival

© The MITRE Corporation. All rights reserved
3-40
Figure 3-34. Traffic Pairing Geometries
© The MITRE Corporation. All rights reserved
3-41
The IM operations were Multi-Stream Arrivals with Metering, as defined in Hicok and Barmore(2016) (Figure 3-35).
Figure 3-35. Sample IM Operations with the PTP and ABP Options
3.1.6 TrafficSimulation traffic included the participants’ aircraft along with other aircraft arriving from thenorth for the RNAV approach to Runway 26 (as shown previously in Figure 3-31). Aircraft alsolanded on runway 25L, but as independent operations. Attempts were made to develop trafficflows that were high density and kept the controller workload at a high but reasonable level.The arrival rate was approximately 40 aircraft per hour to Runway 26. The higher workloadenvironment was desirable to keep the controllers engaged, but not so much that disturbancesin the traffic flow occurred (and vectoring became necessary). The intent was to examine theintegration of IM operations in the terminal metering environment without disturbances. Thedensity of the flow was modified several times prior to selecting the final density for datacollection based on controller and ground expert inputs during the concept evaluations.Equivalent traffic levels were used through the entire simulation to avoid workload differencesbetween scenarios. Each traffic file was derived from real world traffic files with arrivals toKPHX.
At scenario start, traffic started arriving from the two flows and gradually built to the fulldensity of traffic that lasted until the data collection was complete for the scenario and the

© The MITRE Corporation. All rights reserved
3-42
scenario was terminated by one of the researchers (typically at the point where the participantaircraft landed and / or when the final off-nominal event occurred).
All aircraft in the simulation were capable of flying the RNAV arrivals. There was a mixture ofaircraft that were capable of flying the RNP RF turn (approximately 20%) and aircraft that werenot capable of flying the RNP RF turn (approximately 80%). This RNP RF turn capability split wascoordinated with key stakeholders and believed to represent a reasonable number of aircraftcapable in the future of flying the more challenging routing.
All aircraft in the simulation were ADS-B out and capable of as acting as an IM lead aircraft.There was a mixture of aircraft that were capable as acting as an IM trail aircraft (approximately60%) and aircraft that were not capable as acting as IM aircraft (approximately 40%). This IMcapability split was also coordinated with key stakeholders and believed to represent areasonable mix of aircraft. It was also an increase over past work done under ATD-1 (asreviewed in Section 2.4.2.2). However, it is reasonably short of 100% equipage, which is unlikelyto be realistic in the near term and may be easier to manage based on not having to deal withthe difficulties of mixed equipage. The participant aircraft was always IM capable (except in onebaseline condition).
Aircraft were delivered from the en route environment to the TRACON boundary with a setdeviation around the center of the slot markers, which simulated the management of aircraftby an en route controller prior to them entering the TRACON. Aircraft arrived no earlier than 30seconds and no later than 15 seconds, with a distribution between those maximum values. Theexpected delivery for terminal metering operations is approximately +/- 30 seconds (Robinsonet al., 2015). However, based on aircraft being able to more easily decelerate than accelerate inthe TRACON, and the chosen arrival procedures, the 15-second threshold was chosen for thisactivity. This is consistent with a simulation reported in Callatine et al. (2014) in which en routecontrollers were asked to deliver aircraft +/- 30 seconds with a preference for the early side.
Pseudo-piloted aircraft were mainly large but also included heavy category aircraft. Aircrafttypes included: Airbus A306, Airbus A319, Airbus A320, Airbus A321, Boeing 717-200, Boeing737-300, Boeing B737-700, Boeing 737-800, Boeing 737-900, Boeing 767-300, BombardierCRJ200, Bombardier CRJ700, Bombardier CRJ900, McDonnell Douglas DC-10, McDonnellDouglas MD-11, and McDonnell Douglas MD-90. Pseudo-piloted aircraft flew final approachspeeds of either 140 or 150 kts6. The aircraft started to slow to the final approach speed at theFAF. Pseudo-piloted aircraft that performed the achieve or capture IM clearance types used theIM sample algorithm. The speeds were not entered by the pseudo-pilots, but were flownautomatically once the pseudo-pilot engaged IM.
The participant flight crew aircraft was always capable of RNAV (but not the RNP RF turn) andIM. The participant aircraft utilized the IM sample algorithm and always flew an achieve IMclearance type.
6 TBFM assumed a final approach speed of 140 kts for all aircraft.
© The MITRE Corporation. All rights reserved
3-43
3.2 ParticipantsParticipant controllers were coordinated through the FAA and NATCA. The standard proceduresinvolved submitting a request with specific requirements, followed by approvals, and finallyidentification of participants. Controllers were compensated for their participation throughstandard FAA processes. Controller requirements included:
Currently working at an ATC-10 or above STARS-equipped TRACON facility
At least 2 years of experience as a Certified Professional Controller (CPC)
Certified, operationally current, and holding a valid medical certificate (temporarilymedically disqualified may qualify if current)
No prior TSAS simulation experience
Twelve controllers were desired for the simulation, but recruiting difficulties lead to nine totalcontrollers participating. The controllers acted as TRACON final and feeder controllers and werefrom a variety of TRACONs, including: Atlanta (A80), Charlotte (CLT) [x2], Miami (MIA), Orlando(F11), Philadelphia (PHL) [x2], Potomac (PCT), and Tampa (TPA). The tower controller positionswere not staffed. Controllers had an average experience of 15.4 years (with a minimum of 7years and a maximum of 30.5 years) actively controlling air traffic. The average age of thecontrollers was 39 years with a minimum of 30 years and a maximum of 53 years.
Flight crews were recruited by MITRE. A request for participation was developed anddistributed to members of the MITRE database. The request stated that each pilot was requiredto be an Air Transport Pilot (ATP), have at least 100 hours of Federal Aviation Regulation Part121 “glass cockpit” experience, be qualified in turbojet aircraft with auto throttles, and haveoperated an aircraft using their ATP rating within the last 12 months. Pilots were told theywould be compensated for their participation.
It was desirable to have both pilots be from the same airline and to have a pairing of a Captainand a First Officer (FO) for each simulation day. However, prior to recruiting, it was determinedthe results were not likely to be affected by not meeting either of these conditions. Therefore,these were determined to be goals but not requirements.
A total of 18 pilots (acting as nine flight crews) were recruited and participated in the study.Seven of the pilots were qualified as Captains and 11 were FOs. Their estimated average totalflight hours was 10,110 hours (with a minimum of 2500 hours and a maximum of 25,000 hours).The pilots were currently flying a variety of aircraft types, i.e., Airbus A319, A320, and A321, aswell as Boeing 717, 737, 747, 757, 767, and 777. During the simulation, one pilot acted as thePF, and one pilot acted as the PM. The roles were not switched during the simulation.
MITRE staff members acted in two to four pseudo-pilot positions (depending on the number ofcontroller participants). The authors served as observers for both the flight crew controllers.

© The MITRE Corporation. All rights reserved
3-44
3.3 IM OperationsThe IM operations conducted in the simulation were as described in Section 2.2.1. This sectionnotes some specific topics where changes, or specific implementation decisions, were made forthis simulation.
3.3.1 ProceduresControllers were instructed to manage aircraft and sector operations as normal for TRACONfacilities. They were also asked to keep aircraft on their RNAV or RNP RF route while using theTSAS features and IM to achieve the schedule. They were told to intervene when necessary forspacing or separation issues. Controllers were reminded that if they intervened when aircraftwere flying the profile speeds on the arrival that they needed to direct the aircraft to resumethe profile / normal speed. They were told to clear aircraft for the instrument approach whenacting as a final controller. Finally, the controllers were asked to hand off all aircraft to thetower controller around the FAF. This is common at some facilities but less common at otherfacilities. Handing off around the FAF gave a consistent hand off point and allowed thecontroller to monitor IM operations for as long as reasonably possible.
For metering operations, controllers were told that the TSAS speed advisories were additionalinformation for issuing an appropriate speed and that they did not need to be implementedexactly as presented.
Controllers were asked to conduct IM and follow IM procedures and phraseology for anyaircraft that was IM capable. Controllers were told that only the feeder controller should issuethe IM clearance. They were asked to issue as many IM operations as possible, but that theycould reject a proposed IM clearance if there was an operational reason to do so. They weretold that when a “no speed” issue was presented to them, IM was possible between the pair ofaircraft if a more aggressive speed assignment (than the 15% of the profile speed restriction) orvector was utilized prior to initiating IM. They were also reminded that coordination wasnecessary between the lead aircraft controller and the trail aircraft controller if the lead aircraftcontroller needed to vector that aircraft.
Pilots were told they would be assigned the role of PF or PM and would remain in that rolethroughout the simulation. They were told to follow normal cockpit procedures and if therewere differences in airline policies they should agree on an approach during training. They werealso asked to fly the flight deck simulator as if it were a large category aircraft (versus a heavy).This was done based on expectations of having a larger pool of large category aircraft pilots andbecause the aircraft model was more similar to a large aircraft model.
Pilots were briefed that the PM should enter the IM clearance information and then coordinatewith the PF on the entered information and the first IM speed prior to executing IM. They werereminded that their tasks were to fly the IM speeds and to monitor the IM operation. Theywere told that the IM speeds overrode the profile speeds and that they should not announceeach IM speed to the controller. They were told that if the IM speed conformance advisory wastriggered, that they should ensure the appropriate speed was set in the MCP and the aircraftwas working toward the IM speed. Pilots were told that if the feasibility check was triggered

© The MITRE Corporation. All rights reserved
3-45
(and they could not continue IM), to fly the current speed, contact ATC, and report “unableinterval spacing.” When the feasibility check was not in effect, but the pilots had either theprogress indicator or the graphical progress indicator, they were told they should determinewhether IM was progressing toward the ASG. If not, they were told to maintain the currentspeed, contact ATC, and report “unable interval spacing.” Pilots were told that the graphicalprogress indicator showed the acceptable tolerances of spacing and that they should notdeviate from IM speeds to keep the triangle symbol centered. The PF was told to fly the IMspeeds unless conditions prevented it or there were other operational reasons not to do so.The PM was told to call out any nonconformance with IM speeds or infeasible indications. Pilotswere told they did not need to monitor for separation issues, as that remained theresponsibility of ATC.
3.3.2 CommunicationsThis section will describe the specific communications used in this simulation. The phraseologywas developed based on the most recent IM communications material at the time of simulationdesign (DO-328A / RTCA, 2015b, DO-350A / RTCA, 2016a, DO-351A / RTCA, 2016b). During thedevelopment of DO-350A (RTCA, 2016a) and DO-351A (RTCA, 2016b), controllers reportedissues with the use of the terms “interval management” or “IM.” The discussion led to the useof “interval spacing” in that material. Therefore, that term was used in this simulation. Stepswere taken to keep the IM clearance concise (e.g., avoiding using the PTP in the clearance bymaking it part of the procedure and known to pilots [shown in the arrival and approachprocedures] and controllers)
The controllers had four specific IM communications:
Initiation (samples)
o “AAL245 achieve 100 seconds by DERVL behind United 123 on EAGUL6”
o “SWA2598 capture 78 seconds behind FDX783”
Suspend
o “Suspend interval spacing” with speed instruction
Resume
o “Resume interval spacing”
Terminate
o “Terminate interval spacing” with speed instruction
The controllers were asked to issue the IM clearance only as feeder controllers. However, eitherthe feeder or final controller could suspend, resume, or terminate IM. The final controller wasresponsible for issuing the approach clearance for the RNAV approach with or without the RNPRF turn. The phraseology consisted of:
“Cleared RNAV runway two six approach” or
“Cleared RNP runway two six approach”
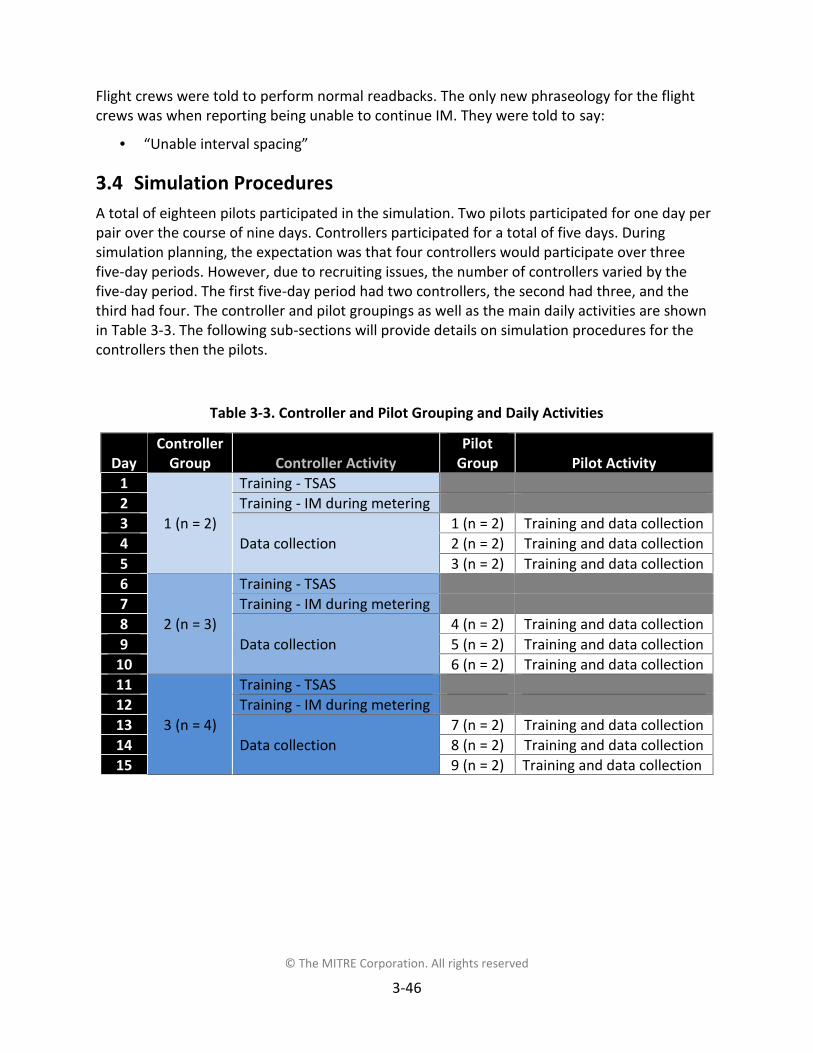
© The MITRE Corporation. All rights reserved
3-46
Flight crews were told to perform normal readbacks. The only new phraseology for the flightcrews was when reporting being unable to continue IM. They were told to say:
“Unable interval spacing”
3.4 Simulation ProceduresA total of eighteen pilots participated in the simulation. Two pilots participated for one day perpair over the course of nine days. Controllers participated for a total of five days. Duringsimulation planning, the expectation was that four controllers would participate over threefive-day periods. However, due to recruiting issues, the number of controllers varied by thefive-day period. The first five-day period had two controllers, the second had three, and thethird had four. The controller and pilot groupings as well as the main daily activities are shownin Table 3-3. The following sub-sections will provide details on simulation procedures for thecontrollers then the pilots.
Table 3-3. Controller and Pilot Grouping and Daily Activities
DayController
Group Controller ActivityPilot
Group Pilot Activity1
1 (n = 2)
Training - TSAS2 Training - IM during metering3
Data collection1 (n = 2) Training and data collection
4 2 (n = 2) Training and data collection5 3 (n = 2) Training and data collection6
2 (n = 3)
Training - TSAS7 Training - IM during metering8
Data collection4 (n = 2) Training and data collection
9 5 (n = 2) Training and data collection10 6 (n = 2) Training and data collection11
3 (n = 4)
Training - TSAS12 Training - IM during metering13
Data collection7 (n = 2) Training and data collection
14 8 (n = 2) Training and data collection15 9 (n = 2) Training and data collection

© The MITRE Corporation. All rights reserved
3-47
3.4.1 Controller TrainingBased on feedback from the concept evaluation activities leading up to the HITL, the trainingstarted with a day of terminal metering and TSAS-only training. While the simulation activitywas not examining terminal metering and TSAS operations alone, these operations were new tothe controllers so it was introduced before adding IM into those operations. The following daywas used to introduce IM into that terminal metering environment.
The first day started with having each participant complete a demographics questionnaire. Thiswas followed by the first part of the pre-simulation briefing which contained information on theresearch background, the operational reason for introducing terminal metering, the terminalmetering concept and TSAS, the simulation environment (e.g., airport, arrivals, airspace, RNP RFturns), roles and responsibilities, as well as operational considerations.
After the first day pre-simulation briefing, controllers were taken to the IDEA lab to familiarizedthemselves with the STARS workstation and to ask any questions. Controllers were briefed onthe basic display features, information new for terminal metering and TSAS, as well as thesimulated KPHX airspace. Controllers were then given a “cheat sheet” with key information onit such as keyboard entries. The remainder of the day involved running through trainingscenarios. The training progressed from low to medium and finally high-density traffic duringterminal metering operations. Controllers trained with each density and in both the feeder andfinal roles. The first day ended with a high-density traffic during terminal metering operationsscenario that acted as a baseline.
The second day started with the second part of the pre-simulation briefing that described IMoperations during terminal metering. Controllers were told the simulation activity was nottrying to force a choice between TSAS and IM, but that they may get asked questionscomparing the operations and associated tools to ensure proper integration of the operations.They were also informed that the researchers were not soliciting feedback on STARS and TSASindependent of IM, as the goal was to have integrated IM and terminal metering operationsand not independent operations. The briefing provided background information on IM and theintegration of IM into the terminal metering environment. It also provided the operationalreason for introducing IM, IM operations, and operational considerations when conducting IMduring terminal metering. The briefing provided details on pilot and controller roles andresponsibilities, IM display features, and the communications procedures as detailed in Section3.3.2.
After the second day briefing, controllers were taken to the IDEA lab to be familiarized with IM.They were briefed on the new information for IM. The “cheat sheet” was reviewed for the IMelements such as the sample IM communications and IM keyboard entries. The remainder ofthe day involved running training scenarios. The training progressed from low to medium andfinally high density traffic with IM aircraft now present in the terminal metering operations.Controllers training with each density and in both the feeder and final roles.
Based on past research (e.g., Bone, Penhallegon, Benson, and Orrell, 2013; Cardosi, personalcommunication, October 4, 2014), it was felt that controllers would benefit from understandingthe information available to flight crews. Therefore, in addition to the overviews of the flight

© The MITRE Corporation. All rights reserved
3-48
deck displays and the associated information from the briefing, demonstrations in the flightdeck simulator were provided.
3.4.2 Pilot Training and Data collectionThe next three days for the controllers consisted of data collection. A new set of pilots joinedthe simulation each day. While the pilots were being trained each day in the morning, thecontrollers participated in data collection scenarios where IM was initiated in the en routeenvironment and continued IM into the TRACON. Only pseudo-piloted aircraft were part ofthese scenarios.
For pilots, the day started by completing a consent form and demographics questionnaire. Thiswas followed by the pre-simulation briefing. The briefing provided background information onIM, IM operations and communications, pilot and controller roles and responsibilities, displayfeatures and the simulation environment, as well as operational considerations whenconducting IM. The pilots were also given basic information about the relationship betweentime and distance spacing during IM.
After the pre-simulation briefing, the pilots were taken to the flight deck simulator forfamiliarization and training on the various interfaces and procedures they would encounterduring the data collection scenarios. The flight crew first conducted an arrival and approach,without IM or a CDTI, to become familiar with the flight deck simulator. They then conducted apractice BRUSR1 arrival and approach with IM where they were taught how to interact with andutilize the min tool set. They then conducted the EAGUL6 arrival and approach with IM but withthe min+ tool set.
When pilot training was completed, both the controllers and pilots started the joint datacollection activities. Each scenario lasted approximately 40 minutes and post-scenarioquestionnaires were given after each run / scenario. Prior to executing each scenario, pilots andcontrollers were informed of the specific conditions for the current scenario. Pilots wereinformed of their call sign for the run via a note placed in the flight deck (Sun Country [SCX] wasalways used as the company name but the flight number changed for each approach).
After data collection runs, participants were provided with a final questionnaire encompassingthe entire simulation. Once they completed the final questionnaire, the controllers and pilotswere offered an opportunity to have a short, informal debrief.

© The MITRE Corporation. All rights reserved
3-49
3.5 Experimental DesignThe independent variables for the simulation are shown in Table 3-4. The variables wereintended to test where pilots and controllers had sufficient information, in their role, todetermine how well IM was progressing and whether spacing issues were developing. Thetesting of the controller variables was expected to provide some data on the necessaryinformation for the controller that would be specified in a ground requirements document.Only a very preliminary version of such a document existed at the time the simulation wasbeing defined. However, for the flight deck displays, requirements have been already writtenfor the CDTI (traffic display and AGD implementation in this simulation) so the testing of theindependent variables could provide validation of the minimum set of requirements and couldprovide data on necessary additions.
Table 3-4. Independent Variables
Controller Flight CrewRole
(Within)Feeder
FinalTool Set(Within)
Tool Set(Within)
Basic MOPS CDTI minimum (min)Basic+ cue MOPS CDTI minimum plus (min+) [Graphical
progress indicator and speed tape]Basic+ cue and prediction
MOPS – Minimum Operational Performance Standards
A total of six traffic files were developed for data collection and were derived from real worldKPHX operations. Each file was unique but very similar in traffic density (approximate rate of 40aircraft per hour), mix of aircraft type and category (larges and heavies), aircraft capabilities (IMand RF RNP), and delivery relative to the schedule from the simulated en route controller. Eachtraffic file lasted approximately 40 minutes and the controller managed traffic for the fullscenario. The flight crew could fly one arrival and approach to landing and then be repositionedoutside of the TRACON airspace to fly the arrival and approach a second time within the sametraffic file. The participant aircraft flight crew was given sufficient time to get acclimated to thenew position and aircraft state before checking in and receiving the first controller instruction.Each participant experienced the same set of data collection scenarios (in a repeated measuresdesign).
One of the traffic files (traffic file 4) was used as the en route initiation scenario withoutparticipant flight crew participation. This same traffic file was then used for the baselinecondition for the flight crew. In that case, the traffic file looked like the other traffic files to thecontroller, but the participant flight crew was not equipped to do IM.

© The MITRE Corporation. All rights reserved
3-50
Over the course of each data collection day, flight crews flew twice through each traffic file. Theparticipants flew a baseline without IM in traffic file 4 and flew IM in traffic files 1, 2, 3, 5, and 6.While all pilots experienced the independent variables in the same run within the traffic file,the run order of the traffic files was counterbalanced across participant groups. Flight crewsflew two arrivals and approaches within each traffic file. The run in which they utilized eitherthe min CDTI implementation or the min+ implementation is shown in Table 3-5.
Table 3-5. Flight Crew Independent Variable Exposure by Traffic File and Run
OperationIM Tools /
Independent Variable (T)raffic File-(R)unBaseline NA T4-R1; T4-R2
IM Min T1-R1; T2-R2; T3-R2; T5-R1; T6-R2IM Min+ T1-R2; T2-R1; T3-R1; T5-R2; T6-R1
Over the course of the three-day data collection days, the controllers experienced traffic file 4with en route initiation, while pilots were trained. For the remainder of the day, controllersexperienced the other six traffic files with the flight deck participants. The block order of thetraffic files was counter-balanced across participant groups.
Off-nominal events were introduced for the controllers through pseudo-pilot action. Each dayeach controller experienced an event where the termination or suspension of IM was required.The pseudo-pilot was told to acknowledge the IM clearance from the feeder controller but tofly a constant speed without engaging IM. The trail aircraft held its speed and startedencroaching upon the lead aircraft (which eventually led to a separation issue) until thecontroller intervened. The issue started to evolve in the feeder controller’s airspace, but thespacing issue may not have been fully realized until the final controller’s airspace based on theslow progression of the overtake. Table 3-6 shows the traffic file run order and traffic overtakeevents for the three groups of controllers.

© The MITRE Corporation. All rights reserved
3-51
Table 3-6. Controller Independent Variable Exposure by Day, Traffic File, and Run
Note: Traffic overtake conditions are highlighted in orange.
Group Operation IM Tools A Controller Role /B Controller Role
Baseline NA Feeder/Final D1-T4-R1Baseline NA Final/Feeder D1-T4-R2IM En Route Initiation TSAS tools Feeder/Feeder D4-T4-RC1IM En Route Initiation TSAS tools and slot marker color change Feeder/Feeder D3-T4-RC1IM En Route Initiation TSAS tools, slot marker color change, and ETA differential Feeder/Feeder D5-T4-RC1IM TSAS tools Feeder/Final D3-T4-R1 D4-T5-R1 D5-T6-R1IM TSAS tools and slot marker color change Feeder/Final D3-T1-R2 D4-T6-R2 D5-T4-R2IM TSAS tools, slot marker color change, and ETA differential Feeder/Final D3-T2-R3 D4-T4-R3 D5-T1-R3IM TSAS tools Final/Feeder D3-T3-R4 D4-T1-R4 D5-T2-R4IM TSAS tools and slot marker color change Final/Feeder D3-T5-R5 D4-T2-R5 D5-T3-R5IM TSAS tools, slot marker color change, and ETA differential Final/Feeder D3-T6-R6 D4-T3-R6 D5-T5-R6Baseline NA Feeder/Final D1-T4-R1Baseline NA Final/Feeder D1-T4-R2IM En Route Initiation TSAS tools Feeder/Feeder D3-T4-RC1IM En Route Initiation TSAS tools and slot marker color change Feeder/Feeder D5-T4-RC1IM En Route Initiation TSAS tools, slot marker color change, and ETA differential Feeder/Feeder D4-T4-RC1IM TSAS tools Feeder/Final D3-T4-R2 D4-T1-R2 D5-T6-R2IM TSAS tools and slot marker color change Feeder/Final D3-T1-R3 D4-T2-R3 D5-T4-R3IM TSAS tools, slot marker color change, and ETA differential Feeder/Final D3-T6-R1 D4-T4-R1 D5-T5-R1IM TSAS tools Final/Feeder D3-T3-R5 D4-T5-R5 D5-T2-R5IM TSAS tools and slot marker color change Final/Feeder D3-T5-R6 D4-T6-R6 D5-T3-R6IM TSAS tools, slot marker color change, and ETA differential Final/Feeder D3-T2-R4 D4-T3-R4 D5-T1-R4Baseline NA Feeder/Final D1-T4-R1Baseline NA Final/Feeder D1-T4-R2IM En Route Initiation TSAS tools Feeder/Feeder D5-T4-RC1IM En Route Initiation TSAS tools and slot marker color change Feeder/Feeder D4-T4-RC1IM En Route Initiation TSAS tools, slot marker color change, and ETA differential Feeder/Feeder D3-T4-RC1IM TSAS tools Feeder/Final D3-T4-R3 D4-T1-R3 D5-T2-R3IM TSAS tools and slot marker color change Feeder/Final D3-T5-R1 D4-T6-R1 D5-T4-R1IM TSAS tools, slot marker color change, and ETA differential Feeder/Final D3-T6-R2 D4-T4-R2 D5-T1-R2IM TSAS tools Final/Feeder D3-T3-R6 D4-T5-R6 D5-T6-R6IM TSAS tools and slot marker color change Final/Feeder D3-T1-R4 D4-T2-R4 D5-T3-R4IM TSAS tools, slot marker color change, and ETA differential Final/Feeder D3-T2-R5 D4-T3-R5 D5-T5-R5
(D)ay-(T)raffic File-(R)un Order
1
2
3

© The MITRE Corporation. All rights reserved
3-52
A summary of each data collection day (1 day for pilots; 3 days for controllers) is provided inTable 3-7.
Table 3-7. Data Collection Day Details
TrafficFile(s) Flight Crew (2 per day) Controllers (3 per day)
4(with en
routeinitiation)
Introductory Briefing and BackgroundQuestionnaire. Training in lab
Controller role:A - Feeder; B- FeederScenario:TSAS and IM en route initiationIndependent variable (order varied between days):(1) Basic,(2) Basic+ cue, or(3) Basic+ cue and prediction
1, 2, 3, 4,5, and 6
Pilot role (remained fixed):PF; PMOperation (order varied within day):(1) Baseline - No IM (x2 runs)(2) IM (x10 runs)Tools (order varied within day):Min CDTI then Min CDTI+ orMin CDTI+ then Min CDTI
Controller role (swapped after 3rd scenario):Feeder; FinalOperation (traffic file order varied within day):TSAS and IM (x6)Tools (order varied within day):(1) Basic,(2) Basic+ cue, or(3) Basic+ cue and prediction
3.6 Data CollectionFour methods of data collection were used for this simulation: paper questionnaires, systemrecorded data, observations, and final debriefs (when chosen by the participants). Three typesof questionnaires were used, including:
1. Demographics: Upon arrival, participants were asked to fill out a demographicsquestionnaire which captured participants’ experience. Controllers and pilots hadseparate questionnaires.
2. Post- scenario: After each run / scenario, participants were asked to fill out aquestionnaire based on the run / scenario just experienced. All post-scenarioquestionnaires included the Bedford Workload Rating Scale (Roscoe, 1984) along withadditional rating scale and yes / no questions with a comment field for each. Thecontroller questionnaires included the Controller Acceptance Rating Scale (Lee, Kerns,Bone, and Nickelson, 2001). Pilot participants completed a post-scenario questionnaireafter each run during a scenario (two runs per scenario) and controllers completed thisquestionnaire after each scenario. Separate post-scenario questionnaires were used forthe baseline and IM scenarios. Controllers and pilots also had separate questionnaires(Appendix B).
3. Post-simulation: After the final scenario, participants were asked to complete the longer,final questionnaire covering all the scenarios experienced. The questionnaire included aseries of rating-scale and yes / no questions with a comment field for each. Controllersand pilots had separate questionnaires (Appendix C).

© The MITRE Corporation. All rights reserved
3-53
In these questionnaires, participants were asked to provide subjective feedback on areas suchas the overall IM concept, workload, situation awareness, head down / scan time, displays,communications, and simulation realism.
Objective metric data was automatically recorded by the simulation platform or by theobservers and included:
ATC
o Interactions with displays
Inputs for IM initiation, rejection, suspension, resumption, and termination
o IM initiation delay
o Location of IM initiations, rejections, suspensions, resumptions, and terminations
All aircraft
o Schedule conformance
o Slot marker deviation
o Events below the applicable separation standard
o Frequency of infeasible / no speed events
o Time on the RNAV procedure
o Spacing error at key locations
o How well the ASG was maintained
o Arrival rates / throughput
Participant aircraft
o IM speeds
o MCP selected speed
o Distance to ABP
o Frequency of IM terminations
o Interactions with displays (e.g., TTF selection and data entry)

© The MITRE Corporation. All rights reserved
4-1
4 ResultsThis section begins with a description of the analysis method for both subjective and objectivedata. It then describes baseline scenarios and the operations (terminal metering and RNP RFturns) that form the operational foundation for IM. It then covers the objective data, including:the conduct of IM operations (mainly controller actions related to IM), IM speeds (forparticipant pilot aircraft) and flight crew actions related to those speeds, and aircraft spacingand separation results (for pseudo-pilot and participant pilot aircraft). Subjective data for bothpilots and controllers is covered next (e.g., acceptability of IM, displays, responsibilities). Timeon RNAV arrivals and communication results are then provided, followed by en route IMinitiation results, as related to controllers. Finally, the section ends with results for theparticipants’ assessments of the simulation.
4.1 Analysis Method
4.1.1 Subjective DataThe subjective results are based on responses to the statements from both the post-scenarioand post-simulation questionnaires. The post-simulation questionnaires comprise most of thedata so in these cases, the source will not be noted unless it helps for clarity. Any data from thepost-scenario questionnaires will be noted. Controller and pilot comments were included if theywere enlightening or if a sufficient number of participants made similar comments.
Controller results are based on nine participants while pilot results are based on 18participants. Controller responses are divided by the independent variable of controller role.Pilot responses are usually combined (as role was not a planned independent variable), unlessthere was a clear reason to report the roles separately.
Some questions in the questionnaires were yes / no with an opportunity for open-endedcomments. Most response-scale items were statements with 100 hash marks (without numericlabels) and an opportunity to provide open-ended comments. The scale was anchored on theleft with the label “Strongly Disagree” and on the right with the label “Strongly Agree” (Figure4-1).
Figure 4-1. 100-Point Agreement Scale
Most items were presented as a statement, and participants were asked to rate their level ofagreement. Participants were told to draw a straight line anywhere on the scale, includingbetween the lines and right on the end points. During data reduction, responses were roundedto the nearest single digit between 0 and 100. In the presentation of the results, any responsesbelow the midpoint (i.e., lower than 50) on the scale were considered to be on the “disagree”side while any responses above the midpoint (i.e., higher than 50) on the scale were considered

© The MITRE Corporation. All rights reserved
4-2
to be on the “agree” side. Any responses at the midpoint (i.e., equal to 50) were considered tobe “neutral” (Figure 4-2).
Figure 4-2. 100-Point Agreement Scale Agreement Rating Breakdown
When presenting results on the 100-point agreement scale in the post-simulationquestionnaires, the following terminology / methodology is used to describe the levels ofagreement.
All [controllers / pilots] [agreed / disagreed]
o All of the participants are on the agree or disagree side of the scale
The majority (n; %) of [controllers / pilots] [agreed / disagreed]
o Low variability, e.g., SD of less than approximately 25 (unless one value is driving aSD slightly higher)
[Controller / Pilot] responses were variable but the majority (n; %) [agreed / disagreed]
o Responses have a SD of greater than approximately 25 and distribution is relativelybiased in one direction
[Controller / Pilot] responses were variable
o Responses have a SD of greater than approximately 25 and the distribution isrelatively flat across the scale
To summarize a series of related statements, figures like that shown in Figure 4-3 are shownlater in the relevant section to show the scale and the disagreement and agreement sides.“Smiling” or “frowning” faces are shown on the scale where the replies to the statements havea subjectively positive or negative meaning. For the post-simulation questionnaires, thestatement is directly quoted from the questionnaire and shown to the left of the graph. If thesame statement was used for both controllers and pilots, it is only shown once. When thecontroller and pilot statements were slightly different, brackets are used and the controller textis presented before the “/” and the pilot text is presented after. For example, “The spacing[achieved by the aircraft / I achieved] was acceptable.” Figures for the post-scenario individualquestions show the tool set to the left of the graph.

© The MITRE Corporation. All rights reserved
4-3
Figure 4-3. Sample Summary Figure
The means (M) and SDs are included on the figures. The means are shown by points and theSDs are shown by the bars. Symbols are also used to indicate the responding party and theparticular condition the reply relates to. Note that the symbol labels may be combined in thefigures where necessary. See Figure 4-4 for details on the symbols and their use.

© The MITRE Corporation. All rights reserved
4-4
Figure 4-4. Symbols Used in the Summary Figures and Their Meaning
The Bedford Workload Rating Scale was used to measure subjective workload across scenarios.The Controller Acceptance Rating Scale was used for controllers to measure operationalacceptability.

© The MITRE Corporation. All rights reserved
4-5
4.1.2 Objective DataThe objective data for aircraft is either shown as pseudo-pilot, participant pilot / flight crewaircraft, or combined data. Generally, the pseudo-pilot and participant pilot data is combined toprovide detail of the controller’s experience on the overall set of aircraft (e.g., in Section 4.5 -Aircraft Spacing and Separation). However, participant pilot aircraft data is reported separatelywhen a distinction is made between the behavior of the participants (who operated the aircraftaccording to their own desires during the IM operation) versus the behavior of the pseudo-pilotaircraft (which behaved as designed by the IM sample algorithm (e.g., Section 4.4.5 - IM Speedsand Flight Crew Actions).
The arrival procedures were not the same length and did not take the same amount of time tofly. The BRUSR1 arrival from TRACON entry to touchdown was on average 14.2 minutes (SD =0.8) and the EAGUL6 arrival was 11.5 minutes (SD = 1.4).
The majority of the data is comprised of IM initiations in the TRACON. Baseline / non-IMoperations are reported in Section 4.2 and IM en route initiation is reported in Section 0.
The arrival rate targeted for the simulation was 40 aircraft per hour to the runway. The averagearrival rate realized across the IM TRACON initiation scenarios was 46.5 (SD = 7.6). The averagearrival rate across the IM en route initiation scenarios was 55.1 (SD = 2.5).
When the IM clearance types and stages are mentioned, the following conventions are used.
Both achieve-by then maintain clearance type options
o Achieve-by
o Achieve-by then maintain
o Achieve stage
o Maintain stage
Capture then maintain
o Maintain stage
When flying the achieve-by option, the ABP and PTP were YOKXO (FAF) and there is nomaintain stage. When flying the achieve-by then maintain option the ABP was DERVL (mergepoint) and the PTP was YOKXO (FAF). Aircraft were considered in the maintain stage of theachieve-by then maintain clearance type once the ABP was reached. For the capture thenmaintain clearance type, aircraft were considered in the maintain stage once the aircraft gotinside the 10-second maintain tolerance. Data reported for the maintain stages can include themaintain stages of both clearance types.
Participant flight crews flew both achieve-by then maintain clearance type options. Pseudo-pilot aircraft flew both clearance types.

© The MITRE Corporation. All rights reserved
4-6
When the data is presented, box and whisker plots are used. Figure 4-5 shows a sample with adescription of the various points.
Figure 4-5. Sample Box and Whisker Plot Defined
Heat maps are also utilized to show the frequency of events along the arrival procedure. Figure4-6 shows an example. Colors with longer wavelengths (e.g., reds) indicate more frequentevents than colors with shorter wavelengths (e.g., blues).
Figure 4-6. Sample Heat Map
4.1.3 Statistical Method and ResultsFour hypotheses were tested across pilot and controller participants as listed in Table 4-1.Hypotheses one, three, and four consisted of more than one dependent measure. In thesecases, statistical tests were used to test each measure. Alpha was set at 0.05.

© The MITRE Corporation. All rights reserved
4-7
Table 4-1. List of Hypotheses and Statistical Tests
# Particiants Hypothesis Dependent MeasureStatistical
Test
1 Pilots
Flight crews willachieve andmaintain spacingbetter with themin+ tool set ascompared to themin tool set
1a. Spacing error at ABPPairedSamples t-test
1b. Spacing error during maintainPairedSamples t-test
2 Pilots
Flight crews willcomply with moreIM speeds with themin+ tool set ascompared to themin tool set
Frequency of IM speeds complied with Chi-square
3 Pilots
Flight crews willfind the min+ toolset moreacceptable thanthe min tool set
1) Subjective question: I could detectwhether I would remain withintolerances to achieve and maintain theassigned spacing goal
2 x 2MixedANOVA
2) Subjective question: I had thenecessary display elements forconducting IM
2 x 2MixedANOVA
4 Controllers
Controllers will findthe new displayelements for IMuseful as comparedto only the basic
1) Subjective question: I was confidentthat the spacing of the [IM] aircraftwould remain outside myseparation requirement
RepeatedMeasuresANOVA
2) Subjective question: I had thenecessary display elements forconducting IM operations
RepeatedMeasuresANOVA
Table 4-1 also cites the statistical test used to measure each hypothesis. The researchersconsidered a Multivariate Analysis of Variance (MANOVA) for hypothesis three and four giventhere are several dependent variables to measure and to control for Type I family-wise error.The general assumption for a MANOVA is for there to be some level of correlation betweendependent measures within a range from 0.3 to 0.7 (Mayers, 2013). To test for this, a series ofPearson Correlations were conducted across the dependent measures. All correlationsexceeded r = 0.7 for both hypotheses; therefore, a separate Analysis of Variance (ANOVA) wasconducted for each dependent measure. This resulted in a total of seven statistical tests. To

© The MITRE Corporation. All rights reserved
4-8
adjust the alpha level of p < 0.05 for family-wise error, a Bonferroni Correction was employed,resulting in a familywise alpha level of p < 0.01. This was the criterion used to determinestatistical significance.
4.1.3.1 Hypothesis 1: Flight Crews will Achieve and Maintain Spacing Better with the Min+Tool Set as Compared to the Min Tool Set
This hypothesis only includes participant aircraft. Therefore, it is a subset of the data presentedin Sections 4.5.3 and 4.5.4 that includes both participant and pseudo-pilot aircraft. The spacingerror for the achieve and maintain stages is shown in Table 4-2.
Table 4-2. Mean Spacing Error in Seconds (SD) for Participant Flight Crews
Flight crew tool set
Stage of achieve-by thenmaintain
Achieve Maintain
Min 2.5(1.2)
0.96(0.05)
Min+ 1.9(0.7)
1.0(0.00)
For the measure of spacing error at the ABP, two measurement points were used. DERVL wasused for trail aircraft that performed the achieve-by then maintain clearance type and hadDERVL as the ABP (Note: Those aircraft then went into the maintain stage until the PTP). YOKXOwas used by trail aircraft that performed the achieve-by clearance type and had YOKXO as theABP. A dependent t-test was used to measure for statistical differences between the min andmin+ tool sets. No statistically significant result was found.
Participant flight crews performed achieve-by then maintain operations with the maintainphase occurring after the aircraft crossed the ABP at DERVL and until crossing the PTP atYOKXO. This is a relatively short portion of the arrival and approach. A dependent t-test wasused to measure for statistical differences between min and min+ tool sets. No statisticallysignificant result was found.
4.1.3.2 Hypothesis 2: Flight Crews will Comply with More IM Speeds with the Min+ Tool Setas Compared to the Min Tool Set
This hypothesis was measured using the number of IM speeds the flight crews complied with.Differentiating crew role is irrelevant for this measure since only the PF was responsible forimplementing the IM speeds. The type of data analyzed is binary since the PF either implementsor does not implement a speed; therefore, a chi-squared analysis was used to measure thefrequency difference between complying or not complying to each IM speed between the minand min+ tool sets. This test did not reveal any statistically significant differences between thetool sets.

© The MITRE Corporation. All rights reserved
4-9
4.1.3.3 Hypothesis 3: Flight Crews will Find the Min+ Tool Set More Acceptable than the MinTool Set
The third hypothesis addressed whether flight crews will find the min+ tool set more acceptablethan the min tool set. The hypothesis was measured using the following post-scenariosubjective questions: 1) “I could detect whether I would remain within tolerances to achieveand maintain the assigned spacing goal,” and 2) “I had the necessary display elements forconducting IM.” The researchers tested for statistical equivalence using the Two One-SidedTest (TOST) between both pilot roles (i.e., PF and PM) so that the PF and PM results for eachtool set could be combined across all measures. This method would increase the sample sizewithin each condition (i.e., from nine to 18).
Four TOST comparisons were conducted, one for each set across the two measures (i.e., post-scenario questions). None of the tests revealed statistically equivalent results. This suggestsdifferent uses of the tool sets between the roles, which resulted in different perceptions. In thisinstance, pilot role was treated as another independent variable. Therefore, two 2 x 2 MixedANOVAs were conducted for the tool sets and pilot role across the two measures. The tests didnot reveal any statistically significant results.
4.1.3.4 Hypothesis 4: Controllers Will Find the New Display Elements for IM Useful asCompared to Only the Basic
The forth hypothesis addressed if controllers found the new display elements for IM usefulcompared to the basic tool set. Two post-scenario questions were developed to address thishypothesis: 1) I was confident that the spacing of the [IM] aircraft would remain outside myseparation requirement, and 2) I had the necessary display elements for conducting IMoperations. A 3 x 2 Repeated Measures ANOVA was conducted for controller role (i.e., feederand final) and IM tool set (i.e., basic, basic+ cue, and basic+ cue and prediction) across each ofthe two dependent measures. This was done in lieu of one MANOVA due to the previously-described unfavorable correlations between dependent measures. There were no main effectsor interactions for both Repeated Measures ANOVAs.

© The MITRE Corporation. All rights reserved
4-10
4.1.4 Summary DataOne hundred thirty participant controller runs and 108 participant flight crew runs wereplanned. Due to technical issues with the simulation environment, three controller IM TRACONinitiation runs were excluded from data analysis, which also resulted in the loss of sixparticipant flight crew runs. An additional 11 participant flight crew runs (that did not affect theoverall controller runs) were excluded due to technical issues with the simulation environment.Table 4-3 shows the number of runs for both controllers and participant flight crews by scenariotype. Table 4-4 shows the number of aircraft per environment.
Table 4-3. Number of Planned and Analyzed Runs per Scenario Type
ScenarioPlanned # of runs Analyzed # of runs
Controller Flight crew Controller Flight crewBaseline 10 18 10 18IM En Route Initiation 27 --- 27 ---IM TRACON Initiation 90 90 87 73Total 127 108 124 91
Table 4-4. Aircraft Participants Across Scenarios Types
IM initiationlocation Aircraft role
Totalaircraft
En route IM trail 306Non-IM 418
TRACON IM trail 1151Non-IM 1356
None (Baseline) Non-IM 265Total 3496
Table 4-5 summarizes the IM initiations for both the TRACON and en route scenarios. For IMTRACON initiation scenarios, 1203 total IM operations were proposed to the controllers. Ofthose, 2.7% (33 of 1203) IM proposals were rejected by the controllers and 1170 IM operationswere issued. Of those, 1.6% (19) were not engaged due to the pseudo-pilot not properlyengaging the operation or simulation technical issues7. Therefore, a total of 1151 (95.6%) IMoperations were properly engaged and initiated. For the en route initiation scenarios, 306 IMoperations were conducted. Table 4-5 summarizes the number of IM proposals, clearances, andinitiations. Table 4-6 summarizes the IM operations by IM initiation point and clearance type.Table 4-7 summarizes the IM operations by controller tool set and clearance type. While thereare different totals for the different clearance types and for the three controller tool setoptions, it is not believed to impact any feedback / results as both were frequently experienced.
7 These aircraft flew the RNAV profile instead of IM.

© The MITRE Corporation. All rights reserved
4-11
Table 4-5. IM Initiation Sequence
TRACON IM initiationEn route IM
initiation
TotalBoth
achieve-byCapture then
maintain Combined
IM proposals presentedto the controller 924 279 1203 -- --
IM proposals issued bycontroller 894 276 1170 -- --
IM operation initiatedand engaged / flown 882 269 1151 306 1457
Table 4-6. Frequency of IM Operations by IM Initiation Location and IM Clearance Type
IM initiation location
IM clearance type
Achieve-by(no maintain)
Achieve-bythen maintain
Capturethen
maintain CombinedTRACON 449 433 269 1151En route 145 81 80 306Combined 594 514 349 1457
Table 4-7. Frequency of IM Operations by Controller Tool Set and IM Clearance Type
Controller tool set
IM clearance type
Achieve-by(no maintain)
Achieve-bythen maintain
Capturethen
maintain CombinedBasic 134 147 87 368Basic+ cue 153 157 95 405Basic+ cue and prediction 146 145 87 378Combined 433 449 269 1151
It should be noted that controllers sometimes had difficulty allowing aircraft to arrive in theirplanned sequence or to achieve a large interval8 if they thought manual controller action wouldresult in a more efficient operation. They preferred to shortcut the route and / or tighten thespacing between aircraft (which was the reason for most vectoring). However, this did notalways lead to a better traffic situation, and sometime led to spacing issues.
8 Large intervals were due to the initial sequence and spacing of arrival aircraft. The TBFM/TSAS schedule does notcontain logic to speed an aircraft up above the profile speed to close a naturally occurring large gap.

© The MITRE Corporation. All rights reserved
4-12
4.2 Terminal Metering Only Operations (Baseline)The baseline condition for the controllers was terminal metering operations without IM. Thepost-scenario results are presented in this section. The majority of controllers agreed with allstatements regardless of role (Figure 4-7).
Figure 4-7. Controller Responses to Post-Scenario Statements on the Baseline Conditionwithout IM

© The MITRE Corporation. All rights reserved
4-13
In the post-scenario questionnaire, controllers were asked to rate their average overallworkload during the baseline on the Bedford Workload Rating Scale. The majority of controllersfound workload to be acceptable for both roles (Figure 4-8).
Figure 4-8. Controller Responses to the Bedford Workload Rating for the Baseline
In the post-scenario questionnaire, controllers were asked to rate their acceptability of thebaseline with Controller Acceptance Rating Scale. The majority of controllers found IMoperationally acceptable across the tool sets (Figure 4-9). Finally, there was one conditionwhere an aircraft pair’s spacing was below the applicable separation standard that occurred forunknown reasons and was not analyzed further.
Figure 4-9. Controller Responses for Controller Acceptance Rating Scale for the Baseline
4.3 Integrated Ground OperationsWhile the focus of the simulation was the integration of IM into the terminal meteringenvironment, it was desirable to understand all three operations that were new to thecontrollers: terminal metering, RNP RF turn operations, and IM. Therefore, controllers wereasked to rank the three operations relative to one another from the most to least challenging.Figure 4-10 shows each operation and how often each appeared in each category. Figure 4-11

© The MITRE Corporation. All rights reserved
4-14
shows each operation and the relative ranking. RNP RF turns operations had the fewest “leastchallenging” rankings and appears to be the most challenging operation. Terminal metering hadthe fewest “most challenging” rankings. IM ranked between RNP RF turn and meteringcomplexity.
Figure 4-10. Controller Ranking of Operations. Frequency by Category
Figure 4-11. Controller Average Ranking of Operations Relative to One Another

© The MITRE Corporation. All rights reserved
4-15
Controllers were asked whether IM was compatible with terminal metering operations. Themajority (8/9; 89%) agreed (M=69.9; SD=22.1) (Figure 4-12).
Figure 4-12. Controller Responses to “IM is compatible with terminal metering operations”
4.4 IM Operations ConductThis section covers controller actions based on an IM clearance proposal as well as controllerand participant flight crew actions related to IM once active.
4.4.1 IM InitiationAs described previously, a total of 1203 IM clearances were presented / proposed tocontrollers. Of the 1203 proposals, 97.2% (1170 of 1203) were initiated by controllers. Ofinitiated IM aircraft, 76.4% (894 of 1170) were achieve-by then maintain operations and 23.5%(276 of 1170) were capture then maintain operations. Table 4-8 shows the distribution of IMinitiations by IM operation and condition.
Table 4-8. Frequency of IM Initiations as a Percentage of the Sample
Controller tool set
(n = IM clearance type
Bothachieve-by
Capture thenmaintain Combined
Basic 76.2 23.8 32.0Basic+ cue 76.0 24.0 35.2Basic+ cue and prediction 77.1 22.9 32.8Combined 76.4 23.6 100
Of the 1203 IM clearance proposals presented to the controller, thirty-three were rejected bythe controller entering the keyboard command. Of the 33 rejections, thirty (2.5% of allinitiations presented and 3.3% of all achieve-by clearances) were one of the achieve-byclearance type options and three (0.2% of all initiations presented and 1.0% of all capture thenmaintain clearances) were capture then maintain (Table 4-9). On average, controllers rejectedIM clearances 116.7 sec (SD=132.6; Range= 20 – 703 seconds) after they were proposed. Onecontroller accounted for 19 (58%) of the rejections.

© The MITRE Corporation. All rights reserved
4-16
Table 4-9. Frequency of IM Proposals Rejected
Controller tool set
IM clearance type
Bothachieve-by
Capture thenmaintain Combined
Basic 10 2 12Basic+ cue 10 1 11Basic+ cue and prediction 10 0 10Combined 30 3 33
The reasons for the rejections were often not clearly articulated but some that were notedincluded simply not wanting to use IM or the ASG being too large (e.g., 232 seconds).
After excluding rejections, a total of 1170 IM operations were initiated by the controllers byentering the keyboard command. On average, controllers entered the keyboard command 30.6seconds (SD=28.8) after an IM operation was proposed / displayed. Table 4-10 shows IMinitiation delay by scenario and condition. Controllers were on average 11 seconds fasterinitiating IM for capture then maintain clearances (M=25.3; SD=22.7), as compared to bothachieve-by clearance type options (M=35.9; SD=36.2). Initiation delay across the controller toolset were similar but the basic+ cue and prediction tool set was 4.3 seconds faster than the basictool set.
Table 4-10. IM Initiation Delay in Mean Seconds (SD)
Controller tool set
IM clearance type
Bothachieve-by
Capture thenmaintain Combined
Basic38.5
(39.0)26.2
(25.4)32.4
(32.2)
Basic+ cue35.6
(34.3)27.0
(20.6)31.3
(27.5)
Basic+ cue and prediction33.8
(35.2)22.4
(18.5)28.1
(26.9)
Combined36.0
(36.2)25.2
(21.5)30.6
(28.8)
Of the total IM initiations then were engaged / flown, 74.1% (853 of 1151) occurred in the firstsegment of the BRUSR1 (between BRUSR and ANNTI) and EAGUL6 (between HOMMR andVNNOM) STARs. Figure 4-13 and Figure 4-14 show the IM initiation locations by IM clearance
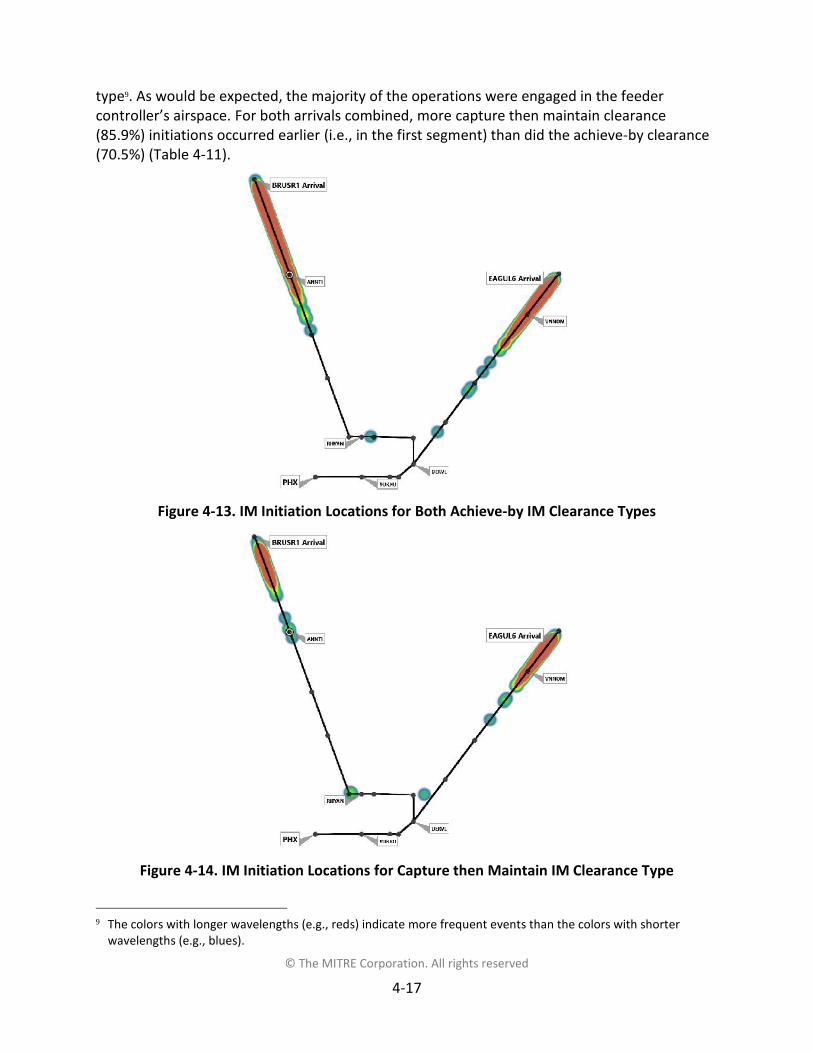
© The MITRE Corporation. All rights reserved
4-17
type9. As would be expected, the majority of the operations were engaged in the feedercontroller’s airspace. For both arrivals combined, more capture then maintain clearance(85.9%) initiations occurred earlier (i.e., in the first segment) than did the achieve-by clearance(70.5%) (Table 4-11).
Figure 4-13. IM Initiation Locations for Both Achieve-by IM Clearance Types
Figure 4-14. IM Initiation Locations for Capture then Maintain IM Clearance Type
9 The colors with longer wavelengths (e.g., reds) indicate more frequent events than the colors with shorterwavelengths (e.g., blues).

© The MITRE Corporation. All rights reserved
4-18
Table 4-11. IM Initiation Location as a Percentage of the Sample
Location
BRUSR1 EAGUL6 CombinedBoth
achieve-by
Capturethen
maintain
Bothachieve-
by
Capturethen
maintain
Bothachieve-
by
Capturethen
maintainFirst segment 69.9 84.5 71.4 86.7 70.5 85.9After first segment 30.1 15.5 28.6 13.3 29.5 14.1Combined 82.9 17.1 69.7 30.3 76.6 23.4
4.4.2 IM SuspensionsEight IM active operations were suspended (less than 1% [8 of 1151]). The locations of thesuspensions are shown in Figure 4-15. The reasons for the suspension, and the action after thesuspension, are shown in Table 4-12. Of the eight suspended IM operations, three laterresumed, three never resumed,10 and two were later terminated. Five of the eight (63%), werefrom one controller. The times to resume or terminate the IM operation are shown in Table4-13.
Figure 4-15. Location of Controller Suspensions
10 These were cases were the controller entered a suspend command but never re-engaged. Therefore, while thecontroller entered the command for suspension, IM was terminated since it never resumed. The controller,however, did not enter the command for termination.

© The MITRE Corporation. All rights reserved
4-19
Table 4-12. Frequency of IM Suspensions by Suspension Reason and Subsequent Action
Reason
Subsequent action
ResumedNot
resumed Terminated CombinedPerceived potential toincrease efficiency / spacing 2 2
Lead vectored 2 2Spacing concern 2 2Unknown 1 1 2Total 3 3 2 8
Table 4-13. Mean Time to Resume or Terminate in Seconds (SD) after IM Suspension
Subsequent actionResumed (n = 3) 83.3 (59.1)Terminated (n = 2) 91.0 (118.8)
4.4.3 Controller IM TerminationsForty-eight terminations occurred accounting for 4.2% (48 of 1151) of the IM operations. Forty-four terminations were for pseudo-pilot aircraft and four were for flight deck participantaircraft. Table 4-14 shows the terminations by controller tool set. Percentages are based on thenumber of total operations conducted when that tool set was used. A higher number ofterminations occurred for the basic+ cue and prediction tool set as compared to both other toolsets, with more (7) relative to the basic tool set. Figure 4-16 and Figure 4-17 show the IMtermination locations by IM clearance type.
Table 4-14. Percentage (and Frequency) of IM Terminations
Controller tool set TotalBasic 3.5 (13)Basic+ cue 3.7 (15)Basic+ cue and prediction 5.3 (20)Combined 4.2 (48)

© The MITRE Corporation. All rights reserved
4-20
Figure 4-16. IM Termination Locations for Both Achieve-by IM Clearance Types
Figure 4-17. IM Termination Locations for Capture then Maintain IM Clearance Type

© The MITRE Corporation. All rights reserved
4-21
Of the 48 IM terminations, 60.4% (29 of 48) were achieve-by clearances and 39.6% (19 of 48)were capture operations (Table 4-15). However, 3.3% (29/882) of the terminations were fromall the achieve-by clearances and 7.1% (19/269) were from all the capture then maintainclearances.
The majority (81.3%; 39 of 48) of terminations were terminated by ATC, followed by the pilotresponding to the controller’s termination instructions. Thirteen percent (6 of 48) of cases werewhere only the pseudo-pilot or flight crew terminated. In all six cases, the controller either gavea speed or told the flight crew to terminate IM, but neglected to make the keyboard entry.Finally, there were 6.3% (3 of 48) cases where only the controller made a keyboard entry toterminate and potentially issued a voice instruction. In all three cases, the pseudo-pilotsappeared to have forgotten to terminate IM (but this did not appear to cause any spacingissues).
Table 4-15. Frequency of IM Termination Actions
Termination actions
IM clearance typeBoth
achieve-byCapture then
maintain CombinedATC termination entry only 3 0 3ATC termination entry and pilottermination entry
22 17 39
Pilot termination entry only 4 2 6Total 29 19 48
The mean time from initiation to termination is shown in Table 4-16. Clearances wereterminated later for achieve-by clearance types (M = 298.7; SD = 190.3) as compared to thecapture then maintain clearance types (M = 196.0; SD = 166.1) . The tool sets had similar timesand variances, although the basic+ cue tool set had a lower variance than the others.
Table 4-16. Mean Time to Terminate after Initiation in Seconds (SD)
Controller tool set
IM clearance typeBoth
achieve-byCapture then
maintain Combined
Basic303.1
(198.8)200.6
(203.1)251.9
(201.0)
Basic+ cue332.2
(183.1)147.3(74.0)
239.8(128.6)
Basic+ cue and prediction260.8
(189.0)240.0
(221.1)250.4
(205.1)
Combined298.7
(190.3)196.0
(166.1)247.4
(178.2)

© The MITRE Corporation. All rights reserved
4-22
Table 4-17 shows the reasons for the IM terminations. These reasons were stated to theobserver or noted in the post-scenario questionnaire by the controller (if they are in a categoryother than “unknown”). The “perceived potential to increase efficiency / spacing” categoryincludes situations such as those where the controller thought the ASG was too large or that alead or trail aircraft could be given a vector. It should be noted that some of the actions afterthe termination made the traffic situation more complex and created a worse spacing situationthan if the original schedule and sequence had been utilized. However, in other situations itwas possible to space an aircraft closer than the ASG that was provided by TBFM (e.g., 180seconds)11. Approximately half (10 of 21; 48%) of the “perceived potential to increase efficiency/ spacing” events could be attributed to one controller who vectored more frequently thanother controllers.
Table 4-17. Frequencies for Reasons for Controller IM Termination
Reason TotalPerceived potential to increaseefficiency / spacing 21
Unknown 12Spacing concern 10RF turn concerns 2Prefer not using IM 1Forgot IM active 1“Trying something” 1Total 48
The “spacing concern” category includes situations where the controller noted an IM operationwould create a problematic spacing situation (e.g., IM trail aircraft not slowing). The “RNP RFturn operation concern” were situations where the controller terminated IM based on aconcern for spacing with an aircraft that was part of an RNP RF turn operation. The “prefer notusing IM” was where a controller preferred to manually manage the speed of the aircraft. The“forgot IM active” was a situation where the controller issued a speed to an IM trail aircraftafter forgetting the aircraft was flying IM. Observers noted other situations where thisoccurred, but the pilot reported doing IM and the controller chose not to terminate. Finally, the“’Trying something” category was where the controller stated either he wanted to try amaneuver to see how IM would react, or to see if an instruction would improve a situation.
11 Large intervals were due to the initial sequence and spacing of arrival aircraft. The TBFM/TSAS schedule does notcontain logic to speed an aircraft up above the profile speed to close up a naturally occurring large gap.

© The MITRE Corporation. All rights reserved
4-23
4.4.4 Flight Crew Reports of UnableIn addition to the controller terminations, there were five participant flight crew reports ofunable12. Two were due to receiving an “ASG too large” message when trying to initiate IM(Table 4-18). Three were made by the flight crews based on the information provided by the IMdisplay information.
Table 4-18. Frequencies and Reasons for Participant Flight Crew Reports of Unable IM
Flight crew tool set
Reason“ASG too
large”message
Display infoindicated a
need CombinedMin 1 1 2Min+ 1 2 3Combined 2 3 5
4.4.5 IM Speeds and Flight Crew ActionsThis section reports data related to IM speed characteristics and participant flight crew /aircraft behavior relative to those IM speeds13. Flight crew participants flew the BRUSR1 arrival33% (24 of 73) of the time and EAGUL6 arrival 67% (49 of 73) of the time. The BRUSR1 arrivalfrom TRACON entry to touchdown was on average 14.2 minutes (SD=0.8) and the EAGUL6arrival 11.5 minutes (SD=1.4) based on the length of flight path for each arrival. The PTP wasalways YOKXO. If the lead aircraft was not flying the RNP RF turn (45/73; 62%), the ABP was themerge point / DERVL. However, when the lead aircraft was flying the RNP RF turn (28/73; 38%),the ABP was at the FAF / YOKXO and there was no maintain stage.
12 Pseudo-pilots did not have enough information to report unable, so none did so.13 As a reminder, the pilot participants only flew achieve-by then maintain IM type (no capture then maintain).

© The MITRE Corporation. All rights reserved
4-24
4.4.5.1 Frequency of IM Speed ChangesTable 4-19 shows the number of speeds received by participant flight crews. The averagenumber of IM speeds is shown in Table 4-20. The average number of IM speeds is higher for theachieve-by stage based on the IM aircraft flying for a longer period of time in that stage (on theorder of 7 minutes) while the average number of speeds for the maintain stage is less based onthe shorter period of time in that stage (on the order of one minute).
Table 4-19. Total Frequency of IM Speeds
Flight crew tool setStage of achieve-by then maintain
Achieve-by Maintain CombinedMin 526 53 579Min+ 469 65 534Combined 995 118 1113
Table 4-20. Average Number of IM Speeds (SD)
Flight crew tool setStage of achieve-by then maintain
Achieve-by Maintain Combined
Min 14.2(2.1)
1.5(2.5)
15.7(3.6)
Min+ 13.0(2.7)
2.1(2.0)
15.1(3.4)
Combined 13.6(2.4)
1.8(2.3)
15.4(3.5)
While the overall number of IM speeds is important, it may be more important to understandthe rate of IM speeds. The rates are shown in Table 4-21. The rates were similar for the twotool sets. The rate of IM speeds per minute was higher with less variance for the achieve-bystage (M = 2.1; SD = 0.6) as compared to the maintain stage (M = 1.5; SD = 1.3). The rates forthe stages and tool set are shown in Figure 4-18.

© The MITRE Corporation. All rights reserved
4-25
Table 4-21. Average Rate of IM Speeds (SD) per Minute
Flight crew tool set
Stage of achieve-by then maintainAchieve-by
(n = 73)Maintain(n = 45)
Combined(n = 73)
Min (n = 37) 2.1(0.4)
1.7(1.5)
2.0(0.4)
Min+ (n = 36) 2.1(0.7)
1.2(1.0)
1.9(0.5)
Combined (n = 73) 2.1(0.6)
1.5(1.3)
2.0(0.5)
Figure 4-18. Average Rate of IM Speeds per Minute for (a) Achieve-by and (b) Maintain Stages
The distributions of the IM speeds are shown in Figure 4-19, Figure 4-20, and Figure 4-21 withshading to show density (wider shaded areas have more data points). As can be seen in theachieve-by stage figures, the speed are less frequent further out (e.g., 45 – 30 NM), thenbecome more frequent (30 – 15 NM), and are most frequent close to the ABP. Figure 4-21 forthe maintain stage, shows the IM speeds to be fairly evenly distributed across the entirety ofthe stage (note the different scale based on the maintain stage being conducted for a shorteramount of time).

© The MITRE Corporation. All rights reserved
4-26
Figure 4-19. Distribution of IM Speeds for Achieve-by Stage with FAF / YOKXO as ABP
Figure 4-20. Distribution of IM Speeds for Achieve-by Stage with Merge / DERVL as ABP
Figure 4-21. Distribution of IM Speeds for Maintain Stage

© The MITRE Corporation. All rights reserved
4-27
4.4.5.2 Magnitude of IM speedsThe average magnitude difference between IM speeds was 6.4 knots (SD=2.3) (Table 4-22). Asnoted in Section 3.1.2, the algorithm was designed to present the IM speeds in 10 ktincrements when greater than 10 NM from the ABP, and in 5 kt increments when less than 10NM from the ABP and when in the maintain stage. As would be expected then, the magnitudechanges were higher for the achieve-by stage (M=6.6; SD=2.3) with 5 and 10-knot incrementsthan the maintain stage (M=5.0; SD=0.0) with only 5-knot increments. The magnitude changeswere similar for the two tool sets. Figure 4-22 shows the distribution of the speed changes andthe transitions at 10 miles from the ABP for the two different ABPs. The 5 and 10-kt incrementschedules can be clearly seen.
Table 4-22. Mean Speed Change Magnitude (SD) in Knots by Flight Crew Tool Set and Achieve-by then Maintain Stage
Flight crew tool setStage of achieve-by then maintain
Achieve-by Maintain Combined
Min 6.6(2.3)
5.0(0.0)
6.5(2.3)
Min+ 6.5(2.3)
5.0(0.0)
6.3(2.2)
Combined 6.6(2.3)
5.0(0.0)
6.4(2.3)
Figure 4-22. Distribution of IM Speed Change Magnitude with (a) FAF / YOKXO as ABP and (b)Merge / DERVL as ABP
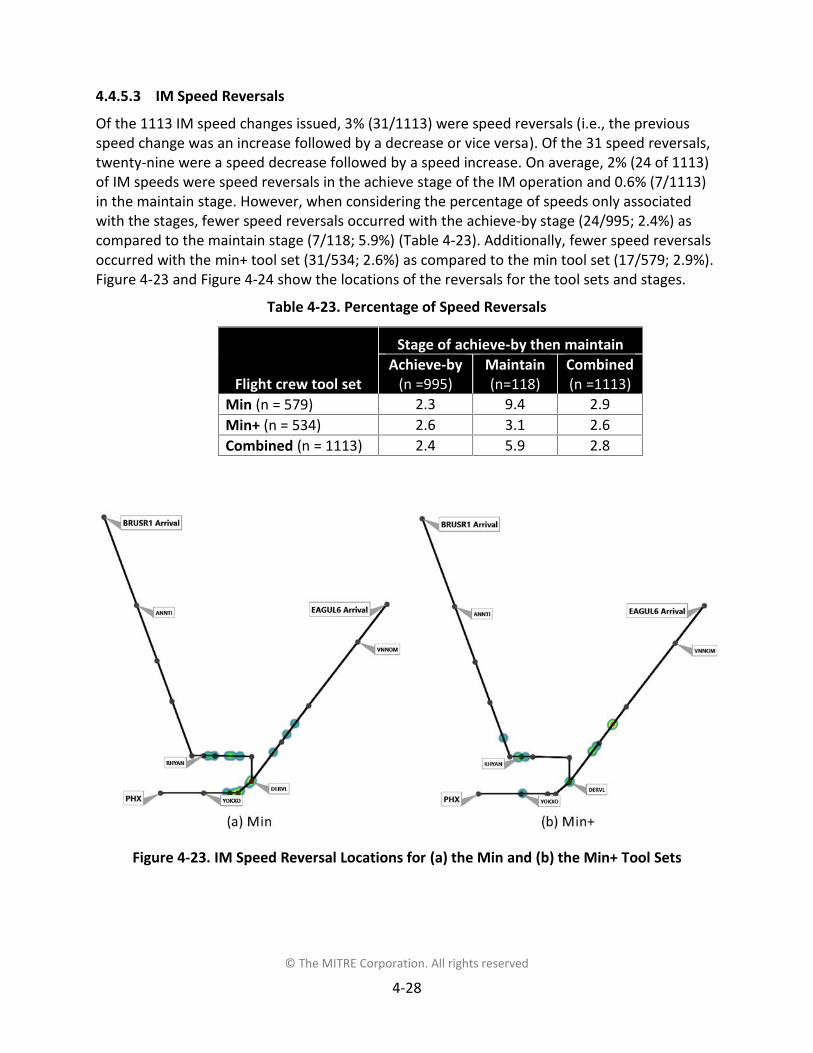
© The MITRE Corporation. All rights reserved
4-28
4.4.5.3 IM Speed ReversalsOf the 1113 IM speed changes issued, 3% (31/1113) were speed reversals (i.e., the previousspeed change was an increase followed by a decrease or vice versa). Of the 31 speed reversals,twenty-nine were a speed decrease followed by a speed increase. On average, 2% (24 of 1113)of IM speeds were speed reversals in the achieve stage of the IM operation and 0.6% (7/1113)in the maintain stage. However, when considering the percentage of speeds only associatedwith the stages, fewer speed reversals occurred with the achieve-by stage (24/995; 2.4%) ascompared to the maintain stage (7/118; 5.9%) (Table 4-23). Additionally, fewer speed reversalsoccurred with the min+ tool set (31/534; 2.6%) as compared to the min tool set (17/579; 2.9%).Figure 4-23 and Figure 4-24 show the locations of the reversals for the tool sets and stages.
Table 4-23. Percentage of Speed Reversals
Flight crew tool set
Stage of achieve-by then maintainAchieve-by
(n =995)Maintain(n=118)
Combined(n =1113)
Min (n = 579) 2.3 9.4 2.9Min+ (n = 534) 2.6 3.1 2.6Combined (n = 1113) 2.4 5.9 2.8
Figure 4-23. IM Speed Reversal Locations for (a) the Min and (b) the Min+ Tool Sets

© The MITRE Corporation. All rights reserved
4-29
Figure 4-24. IM Speed Reversal Locations for (a) Achieve-by and (b) Maintain Stages
4.4.5.4 IM Speed IncreasesOf the 1113 IM speeds changes, seventeen percent (194/1113) were speed increases andrequired acceleration (Table 4-24). When considering the percentage of speeds only associatedwith the stages, fewer speed increases occurred with achieve-by stage (150/995; 15.1%) ascompared to maintain stage (44/118; 37.3%). Additionally, fewer speed increases occurred forthe Min+ tool set (86/534; 16.1%) as compared to the min tool set (108/579; 18.7%)
Table 4-24. Percentage of Speed Increases
Flight crew tool setStage of achieve-by then maintain
Achieve-by Maintain CombinedMin 14.3 62.3 18.7Min+ 16.0 16.9 16.1Combined 15.1 37.3 17.4

© The MITRE Corporation. All rights reserved
4-30
4.4.5.5 Time Between IM Speed Changes and DTGOn average, the time between IM speeds was 29.2 sec (SD=34.8) (Table 4-25). Most of thetimes between IM speeds were between 6 second (10th percentile) and 87.9 second (90th
percentile). There was more time between IM speeds for the achieve-by stage (32.3) than forthe maintain stage (26.1). There was also more time between speed changes for the min+ toolset (32.7) than there was for the min tool set (25.7).
Table 4-25. Mean Time in Seconds (SD) Between IM Speeds
Flight crew tool setStage of achieve-by then maintain
Achieve-by Maintain Combined
Min 31.5(38.7)
19.9(28.2)
25.7(33.5)
Min+ 33.1(45.1)
32.3(27.3)
32.7(36.2)
Combined 32.3(41.9)
26.1(27.8)
29.2(34.8)
Most IM speed changes occurred between 3.6 NM (10 percentile) and 27.4 NM (90 percentile)from the PTP. Figure 4-25 and Figure 4-26 show the relationship between the time between IMspeeds and the distance to the ABP and PTP. The dots show specific events and the blue line is acurved of best fit. The bars on top and right side of the graph show frequencies of events fordistance to the PTP (top) and time between IM speeds (right).
Figure 4-25 shows that relationship when the participant flight crew flew the achieve-by IMclearance with YOKXO as the ABP (and PTP). Figure 4-26 shows that relationship when theparticipant flight crew flew the achieve-by then maintain IM clearance with DERVL as the ABP(and YOKXO as the PTP). As can be seen in both figures, IM speeds were generally closertogether and occurred more often when close to the ABP. The speeds were closest in time andmost frequent when the aircraft was about 10 miles to the ABP for the achieve-by IM clearanceand about 5 miles from the ABP for the achieve-by then maintain IM clearance.

© The MITRE Corporation. All rights reserved
4-31
Figure 4-25. Scatterplot of Time Between IM Speeds and Distance to the PTP with FAF /YOKXO as ABP (Achieve-by Clearance Type)
Figure 4-26. Scatterplot of Time between IM Speeds and Distance to the PTP with Merge /DERVL as ABP (Achieve-by then Maintain Clearance Type)

© The MITRE Corporation. All rights reserved
4-32
4.4.5.6 Compliance with IM SpeedsCompliance with IM speeds is defined as the participant flight crew dialing in the IM speed inthe MCP speed window. For the simulation, the flight crew was considered to be in compliancewith the IM speed if the speed set in the MCP speed window was within 2 kts of the IM speed14.
As shown in Table 4-26, flight crews complied with more IM speeds when in the achieve-bystage (76.6%) than when in the maintain stage (70.3%) and with the min+ tool set (79.2%) thanthe min tool set (72.9%). However, the statistical test noted in Section 4.1.3.2, did not reveal astatistically significant difference between the two tool sets.
When flight crews complied with IM speeds, the IM speeds had been presented for a longerperiod of time (M=40.6; SD=41.4) (Table 4-27 and Figure 4-27). When flight crews did notcomply with IM speeds, the IM speeds had been presented for a shorter period of time (M=7.9;SD=10.2).
Table 4-26. Percentage of IM Speed Compliance
Flight crew tool setStage of achieve-by then maintain
Achieve-by Maintain CombinedMin 74.1 60.4 72.9Min+ 79.3 78.5 79.2Combined 76.6 70.3 75.9
Table 4-27. Mean Duration (SD) of IM Speed Presentation Time (in Seconds) as Related toCompliance
Flight crewtool set
Stage of achieve-by then maintainAchieve-by Maintain Combined
CompliedNot
complied CompliedNot
complied CompliedNot
complied
Min 34.1(39.1)
8.5(8.4)
45.5(40.6)
8.4(21.1)
39.8(39.9)
8.5(14.8)
Min+ 38.1(48.7)
8.1(4.7)
44.6(37.0)
6.7(6.5)
41.4(42.9)
7.4(5.6)
Combined 36.1(43.9)
8.3(6.6)
45.1(38.8)
7.6(13.8)
40.6(41.4)
7.9(10.2)
14 The MCP speed knob in the flight deck simulator sometimes made it difficult to dial in the speed to the exact kt,so some latitude was allowed.

© The MITRE Corporation. All rights reserved
4-33
Figure 4-27. Mean Duration of IM Speed Presentation Time as Related to Compliance
4.4.5.7 IM Speed Conformance Monitoring AdvisoryOut of 73 runs, thirty-eight (52%) had at least one IM speed conformance monitoring advisory.There were a total of 160 advisories accounting for 14% (160 of 1113) of IM speeds. The 160advisories were associated with 119 IM speeds: 86 (72.3%) were for one IM speed and 33(27.7%) were for the same IM speed15.
For all advisories, fewer occurred with the min+ tool set (61/534; 11.4%) as compared to themin tool set (99/579; 17.1%) (Table 4-28). Figure 4-28 shows the location of the advisories forthe individual tool sets. Additionally, fewer advisories occurred with the achieve-by stage(136/995; 13.7%) as compared to the maintain stage (24/118; 20.3%). Figure 4-29 shows thelocation of the advisories for the stages of the achieve-by then maintain clearance type.
Table 4-28. Percentage of IM Speed Conformance Monitoring Advisories
Flight crew tool setStage of achieve-by then maintain
Achieve-by Maintain CombinedMin 16.9 18.9 17.1Min+ 10.0 21.5 11.4Combined 13.7 20.3 14.4
15 As noted previously, the implementation for this simulation allowed for multiple alerts for one IM speed. This isnot required / specified in DO-361 (RTCA, 2015a).

© The MITRE Corporation. All rights reserved
4-34
Figure 4-28. IM Speed Conformance Monitoring Advisory Locations for the (a) Min Tool Setand (b) Min+ Tool Set
Figure 4-29. IM Speed Conformance Monitoring Advisory Locations for the (a) Achieve-by and(b) Maintain Stages of the Achieve-by then Maintain Clearance Type

© The MITRE Corporation. All rights reserved
4-35
Of the 160 advisories, 67 (41.9%) were inside the MOPS no advisory threshold (i.e., should nothave been triggered) and 93 (58.1%) were outside the MOPS no advisory threshold16. As seenfor all advisories combined, fewer advisories occurred with the min+ tool set (18/534; 3.4%) ascompared to the min tool set (49/579; 8.5%) when the alert should not have been triggered(Table 4-29). Additionally, fewer advisories occurred with the min+ tool set (43/534; 8.1%) ascompared to the min tool set (50/579; 8.6%), but the difference is greatly reduced when thealert should have been triggered (Table 4-30).
The average number of advisories for the achieve-by stage (60/995; 6.0%) are very similar tothe maintain stage (7/118; 5.9%) when the alert should not have been triggered. However,fewer advisories occurred with the achieve-by stage (77/995; 7.7%) as compared to themaintain stage (16/118; 13.6%) when the alert should have been triggered.
Table 4-29. Percentage of IM Speed Conformance Monitoring Advisories Inside the MOPS NoAdvisory Threshold (Should Not have been Triggered per DO-316 [RTCA, 2015a])
Flight crew tool setStage of achieve-by then maintain
Achieve-by Maintain CombinedMin 8.9 3.8 8.5Min+ 2.8 7.7 3.4Combined 6.0 5.9 6.0
Table 4-30. Percentage of IM Speed Conformance Monitoring Advisories Outside the MOPSNo Advisory Threshold (Should have been Triggered per DO-316 [RTCA, 2015a])
Flight crew tool setStage of achieve-by then maintain
Achieve-by Maintain CombinedMin 8.2 13.2 8.6Min+ 7.2 13.8 8.1Combined 7.7 13.6 8.4
4.5 Aircraft Spacing and SeparationThis section reports data related to aircraft spacing and separation. It includes both pseudo-pilot and participant flight crew aircraft17. Measures in this section indicate how well the IMaircraft achieved or maintained the ASG, and also how well aircraft conformed to theunderlying schedule and the associated slot markers. A detailed analysis of each of thesemeasures is not conducted in this paper. The main purpose of reviewing these measures is tocompare how IM aircraft behaved relative to non-IM aircraft and whether they generallybehaved the same.
16 As noted previously, the implementation for this simulation alerted more often than specified in DO-361 (RTCA,2015a).
17 The participant flight crews only flew the achieve-by then maintain IM clearance (i.e., no capture then maintain).Pseudo-pilot aircraft flew all clearances.

© The MITRE Corporation. All rights reserved
4-36
4.5.1 Schedule ConformanceSchedule conformance measures how well aircraft met the original schedule at the variousconstraint points (including the ABPs and PTP for IM). The measure, termed schedule deviation,is the difference between the STA and the ATA of an aircraft.
Table 4-31 and Figure 4-30 show the schedule deviation at the constraint points. The first twodata columns are the meter fixes. IM aircraft were not included at these points because it wasdifficult to determine whether or not aircraft had started IM. The non-IM aircraft arerepresentative of the spacing of IM aircraft upon entering the TRACON. Aircraft, on average,reached the meter fix ahead of schedule (by design, as described in Section 3.1.6).
At the merge / DERVL, IM aircraft (M= -2.4; SD=11.9) had more schedule deviation and slightlymore variance as compared to non-IM aircraft (M=0.0; SD=10.4). At the FAF / YOKXO, IMaircraft (M= -7.1; SD=10.9) had more schedule deviation and about the same variance ascompared to non-IM aircraft (M= -4.9; SD=11.2).
At the merge / DERVL, IM aircraft had a mean deviation from schedule of less than 6 secondsand similar variances but the achieve-by type (M= -5.3; SD=12.1), had more schedule deviationthan the achieve-by then maintain (M= -1.1; SD=12.1) or the capture then maintain (M= -2.3;SD=10.9). At the FAF / YOKXO, all IM aircraft terminated IM. IM aircraft had a mean deviationfrom schedule within 1 second of each other and similar variances.
All aircraft were ahead of schedule, on average, at YOKXO (the FAF).
Table 4-31. Schedule Deviation in Seconds (SD) at Constraint Points
Aircraft role - IMclearance type
Constraint pointBRUSR
(BRUSR1meter fix)
HOMRR(EAGUL6
meter fix)DERVL
(merge)
RHYAN(RNP RF
turn)YOKXO(FAF)
IM trail -Achieve-by -- -- -5.3
(12.1)-0.3(9.6)
-6.5(10.1)
ABP & PTPIM trail -Achieve-by thenmaintain
-- ---1.1
(12.1)ABP
-4.4(15.2)
-7.5(12.0)PTP
IM trail –Capture thenmaintain
-- -- -2.3(10.9)
-2.0(11.4)
-7.1(10.3)PTP
IM trail -Combined -- -- -2.4
(11.9)-2.4
(12.7)-7.1
(10.9)
Non-IM -8.8(17.6)
-3.3(21.0)
0.0(10.4)
-1.7(9.1)
-4.9(11.2)

© The MITRE Corporation. All rights reserved
4-37
Figure 4-30. Schedule Deviation at Constraint Points
4.5.2 Aircraft Position as Related to Slot MarkersThis section provides information on how each aircraft deviated from the center of the slotmarkers (Section 4.5.2.1 Absolute Slot Marker Deviation), the amount of time aircraft were intheir slot markers (Section 4.5.2.2 Aircraft Time in Slot Markers), and the difference betweenthe deviation from the center of the slot marker for a trail aircraft as compared to its leadaircraft (Section 4.5.2.3 Relative Slot Marker Deviation).
4.5.2.1 Absolute Slot Marker DeviationThe absolute slot marker deviation metric shows how close an individual aircraft was to thecenter of its slot marker. A positive value indicates the aircraft was (behind schedule and)behind the center of the slot marker. A negative value indicates the aircraft was (ahead ofschedule and) ahead of the center of the slot marker. A zero value indicates the aircraft wascentered in its slot marker (see Appendix D for examples).
Aircraft were delivered from en route into feeder airspace with a distribution around the slotmarkers. The feeder controller was expected to work to get non-IM aircraft on schedule / intotheir slot markers before handing off to the final controller. IM aircraft were working towardachieving or maintaining the ASG, regardless of slot marker position. The final controller

© The MITRE Corporation. All rights reserved
4-38
received the aircraft and was expected to get non-IM aircraft on schedule / into their slotmarkers (until around the final approach path where the controller is likely more concernedabout the relative spacing between aircraft than the schedule).
Table 4-32 shows both time and distance (shaded gray) for deviations from the center of theslot marker by overall time in feeder and final airspace and at the handoff from final to feeder.Distance is included for a general reference, while time is discussed for the results. Figure 4-31,Figure 4-32, and Figure 4-33 show the distributions of the time deviation. Lines are shown inthese figures for the slot marker radius for the feeder (15 seconds) and the final (5 seconds)controllers.
Table 4-32. Aircraft Slot Marker Center Deviation in Mean Seconds (SD) and NM (SD)
Airspace location
Aircraft role – IM clearance typeIM trail -
Bothachieve-by
IM trail -Capture then
maintainIM trail -
Combined Non-IM
sec NM sec NM sec NM sec NM
Feeder -15.7(20.0)
-1.2(1.6)
-12.5(16.4)
-1.0(1.3)
-14.1(18.2)
-1.1(1.5)
-14.6(13.5)
-1.1(1.1)
Handoff to final 2.0(6.4)
0.2(0.5)
1.8(5.5)
0.2(0.4)
1.9(6.0)
0.2(0.5)
0.1(4.7)
0.0(0.4)
Final -13.6(12.8)
-0.8(0.8)
-12.2(12.4)
-0.7(0.8)
-12.9(12.6)
-0.8(0.8)
-11.1(9.3)
-0.7(0.6)
IM (M= -14.1; SD=18.2) and non-IM aircraft (M= -14.6; SD=13.5) had similar deviations ahead ofthe slot marker center in the feeder’s airspace. At the handoff, the IM aircraft (M=1.9; SD=6.0)were further behind schedule and further behind the slot marker center as compared to thenon-IM aircraft (M=0.1; SD=4.7). In final controller’s airspace, IM (M= -12.9; SD=12.6) and non-IM aircraft (M= -11.1; SD=9.3) had similar deviations from the slot marker center and wereahead of schedule.
In the feeder’s airspace, aircraft with the achieve-by clearance types (M= -15.7; SD=20.0) werefurther behind the slot marker center as compared to aircraft with the capture then maintainclearance type (M= -12.5; SD=16.4). At the handoff, aircraft with the achieve-by clearance types(M=2.0; SD=6.4) and aircraft with capture then maintain clearance type (M=1.8; SD=5.5) hadsimilar deviations behind the slot marker center. In the final controller’s airspace, aircraft withthe achieve-by clearance types (M= -13.6; SD=12.8) and aircraft with capture then maintainclearance type (M= -12.2; SD=12.4) had similar deviations ahead of the slot marker center.
The general trend appears to be that all aircraft in the feeder airspace were ahead of schedule,on average. This is, in part, based on the distribution of aircraft around the slot marker centerwhen received from en route airspace as more aircraft were delivered ahead of schedule (asdescribed in Section 3.1.6). Then, all aircraft were delivered by the feeder to final controller onaverage within 2 seconds of their slot marker centers. In the final controller’s airspace, all

© The MITRE Corporation. All rights reserved
4-39
aircraft were, on average, ahead of the slot marker centers. Most differences between IM andnon-IM aircraft, and the two IM clearance types, were minor.
Figure 4-31. Aircraft Slot Marker Center Deviation in Mean Seconds for Feeder ControllerAirspace
Figure 4-32. Aircraft Slot Marker Center Deviation in Mean Seconds at Handoff from Feeder toFinal Controller

© The MITRE Corporation. All rights reserved
4-40
Figure 4-33. Aircraft Slot Marker Center Deviation in Mean Seconds for Final ControllerAirspace
4.5.2.2 Aircraft Time in Slot MarkersSlot markers have a 15-second radius for the feeder controller and a 5-second radius for thefinal controller. Therefore, the absolute slot marker deviation metric can be used to determinewhether aircraft were in their slot markers. Table 4-33 shows the percentage of time aircraftwere in their slot markers while in the feeder and final controller’s airspace. From the previoussection, Figure 4-31, Figure 4-32, and Figure 4-33 show the distributions of the time deviationas well as the radius of the slot markers (as the lines drawn at 5 and 15 seconds).
Table 4-33. Percentage of Time Aircraft were in Slot Markers
Airspace location
Aircraft role – IM clearance typeIM Trail -
Bothachieve-by
IM Trail -capture then
maintainIM trail -
Combined Non-IMFeeder 41.2 50.5 45.9 54.2Final 17.2 16.9 17.1 19.1
Overall, all aircraft were in their slot markers less often in the feeder’s airspace as compared tothe final’s airspace. IM aircraft (45.9%) were in the slot markers for less time in the feeder’sairspace as compared to non-IM aircraft (54.2%). Both achieve-by clearance type aircraft(41.2%) spent less time in their slot marker in the feeder’s airspace as compared to the capturethen maintain aircraft (50.5%). All aircraft had similar amount of time (approximately 17.5%)spent in their slot markers in the final controller’s airspace.
In summary, IM aircraft (particularly those flying the achieve-by clearance types) appeared tospend more time outside the slot markers than non-IM aircraft in the feeder controller’s sector.This is likely because the controller was working to get non-IM aircraft into their slot markersprior to the handoff to the final controller, while the achieve-by aircraft were still workingtoward the ASG at a later point (DERVL and YOKXO) in the final controller’s airspace. All aircraft

© The MITRE Corporation. All rights reserved
4-41
ended up spending similar amounts of time in the slot markers in the final controller’s airspace.As seen with the slot marker deviation data, the final controller appeared to let aircraft runahead of schedule after receiving aircraft very close to the slot marker centers.
4.5.2.3 Relative Slot Marker DeviationThe relative slot marker deviation measure provides information on where the trail aircraft wasrelative to its slot marker based on the lead aircraft position relative to its slot marker (seeAppendix D for sample configurations). The relative slot marker deviation is broken intoconditions where the lead aircraft was either ahead of the center of the slot marker or it wasbehind the center of the slot marker18. The reason to examine the relative slot marker deviationis to determine whether the behavior of an aircraft performing IM has an unexpected positionfor its own slot marker relative to the lead aircraft.
The figures in this section portray the results of this measure for the various possible relativetrail and lead aircraft positions. The lead aircraft is used as the reference. The figures show theslot marker (scaled to the appropriate size for both feeder [15-second radius] and final [5-second radius] controller’s airspace), the mean (as a dot), and the standard deviation (as thedashed bar). The figures are intended to show the relative position of the aircraft. The slotmarker radius and aircraft distance from the slot marker center are to scale, but the time /distance between the slot markers is not. Additional details on the compilation of this data areavailable in Appendix E.
Figure 4-34 and Figure 4-35 show the average relative positions of the lead and trail aircraft totheir slot markers when the lead was ahead of its slot marker center. The figures show thatacross all the conditions when the lead aircraft was ahead of its slot marker center, the IM trailaircraft was also ahead with similar variance. IM pairs and non-IM pairs also look very similaracross all conditions.
18 The number of events where the lead aircraft was perfectly in the center of the slot marker (i.e., 0 deviation)were too rare to include.

© The MITRE Corporation. All rights reserved
4-42
Figure 4-34. Lead and Trail Position Relative to Slot Markers When the Lead Aircraft wasAhead of its Slot Marker Center (Feeder Airspace and Handoff)
IM pair
Non-IM pair
Feederairspace
IM pair
Non-IM pair
Handoffto Final
Direction of Travel

© The MITRE Corporation. All rights reserved
4-43
Figure 4-35. Lead and Trail Position Relative to Slot Markers When the Lead Aircraft wasAhead of its Slot Marker Center (Final Airspace, DERVL, and YOKXO)
IM pair
Non-IM pair
FinalAirspace
IM pair
Non-IM pairDERVL
IM pair
Non-IM pair
YOKXO
Direction of Travel

© The MITRE Corporation. All rights reserved
4-44
Figure 4-36 and Figure 4-37 show the relative positions of the lead and trail aircraft to their slotmarkers when the lead was behind its slot marker center.
Figure 4-36. Lead and Trail Position Relative to Slot Markers When the Lead Aircraft wasBehind its Slot Marker Center (Feeder Airspace and Handoff)
IM pair
Non-IM pair
Feederairspace
IM pair
Non-IM pair
Handoffto Final
Direction of Travel

© The MITRE Corporation. All rights reserved
4-45
Figure 4-37. Lead and Trail Aircraft Position Relative to Slot Markers When the Lead Aircraftwas Behind its Slot Marker Center (Final Airspace, DERVL, and YOKXO)
Figure 4-36 shows (when the lead was behind the slot marker center) that the situations weresimilar, but the IM aircraft pairs were often further apart than the non-IM pairs in the feederairspace and at the handoff to the final controller. Figure 4-37 shows the same was true overthe course of time that the aircraft were in the final controller’s airspace. However, at bothDERVL and YOKXO, the IM trail aircraft is also behind with similar variance. IM pairs and non-IMpairs also look very similar for both DERVL and YOKXO.
Overall, the figures show few differences between IM and non-IM aircraft.
4.5.3 Spacing ErrorThe following reviews the spacing error (the difference between the planned interval and theachieved interval) in seconds measured at DERVL and YOKXO. For all aircraft, the plannedinterval was the STA of the trail aircraft minus the STA of the lead aircraft at the same point. ForIM aircraft, the planned interval became the ASG at the ABP. For IM aircraft the spacing error isa direct measure of how close the IM aircraft were to the ASG. For non-IM aircraft, it is ameasure of how well the aircraft met the planned interval. (see Appendix D for further detail).For both IM and non-IM aircraft, this is not a measure of schedule conformance.
IM pair
Non-IM pairFinal
Airspace
IM pair
Non-IM pairDERVL
IM pair
Non-IM pair
YOKXO
Direction of Travel

© The MITRE Corporation. All rights reserved
4-46
Trail IM aircraft that did achieve-by only operations and those that did capture then maintaindid not have a specified spacing goal at DERVL so the aircraft are excluded for measurement atthat point. Those aircraft are included, along with all other aircraft for the spacing error atYOKXO (also the PTP and FAF). Table 4-34 shows the spacing errors by aircraft role andoperation at the two points.
Table 4-34. Mean Spacing Error in Seconds (SD) at Two Points
Waypoint
Aircraft role - IM clearance typeIM trail -Achieve-
by (nomaintain)
IM trail -Achieve-by then
maintain
IM trail –Capture
thenmaintain
IM trail –Total
Non-IM
DERVL ---0.2
(4.5)ABP
--- 0.2(4.5)
1.0(8.5)
YOKXO-1.0(4.9)
ABP & PTP
0.2(3.0)PTP
0.6(5.1)PTP
0.4(4.1)
0.4(8.2)
The IM aircraft that achieved at DERVL (M=0.2; SD=4.5) had less spacing error and less variancethan the non-IM aircraft (M=1.0; SD=8.5). With respect to meeting performance baseline / goaldiscussed in Section 2.2.2.1, IM aircraft that achieved at DERVL met the performance goal(Table 4-35). The non-IM aircraft also met their performance baseline. When aircraft reachedYOKXO, all aircraft had similar spacing errors, though non-IM aircraft had the largest variance.All IM aircraft and non-IM aircraft met the performance baseline / goals at YOKXO.
Table 4-35. Aircraft Role and Performance Baseline / Goal Achievement
Waypoint
Aircraft role - IM clearance type
IM trail -Achieve-by
IM trail -Achieve-by then
maintain
IM trail –Capture then
maintain Non-IM95%
10 secs68%
5 secs95%
10 secs68%
5 secs95%
10 secs68%
5 secs68%
12 secs
DERVL --- ---Yes
95.8%ABP
Yes88.4%ABP
--- --- Yes75.6%
YOKXO
Yes97.4%ABP &
PTP
Yes89.5%ABP &
PTP
Yes98.5%
PTP
Yes93.5%
PTP
Yes100%PTP
Yes100%PTP
Yes77.1%

© The MITRE Corporation. All rights reserved
4-47
See Figure 4-38 and Figure 4-39 for the spacing error for IM and non-IM aircraft for the twopoints. See Figure 4-40 and Figure 4-41 for more detail19 on the spacing error of only the IMaircraft. The blue horizontal lines in the figures show the IM performance goal of 5 seconds andthe gray horizontal lines show the TSAS performance baseline of 12 seconds. Overall, IM andnon-IM aircraft met the performance baseline / goals expected for the operations.
Figure 4-38. Spacing Error Distribution for IM and Non-IM Aircraft at DERVL
Figure 4-39. Spacing Error Distribution for IM Aircraft by IM Clearance Type and Non-IM atYOKXO
19 One event during for capture then maintain clearance type was late by 55 seconds and was removed. Thisallowed greater detail to be portrayed for the remaining events.

© The MITRE Corporation. All rights reserved
4-48
Figure 4-40. Spacing Error Distribution for IM Aircraft at DERVL
Figure 4-41. Spacing Error Distribution for IM Aircraft by IM Clearance Type at YOKXO
4.5.4 Maintenance of the ASGWhile aircraft performing achieve operations reach the ASG at a point, aircraft in the maintainstage are required to maintain the ASG throughout. The maintain stage began (1) at the ABP(DERVL) for achieve-by then maintain operations and (2) when the MSI was within 10 secondsof the ASG for capture then maintain operations.
Achieve-by clearance types when in the maintain stage were within 10 seconds of the ASG (the95% tolerance performance goal) on average 97.7% of the time, which met the performancegoal. Capture then maintain operations that were in the maintain stage were within tolerance100% of the time.

© The MITRE Corporation. All rights reserved
4-49
Table 4-36. Percentage of Time IM Aircraft were within 10 Seconds of the ASG (95%Performance Goal) During the Maintain Stage
IM clearance typeAchieve-by then maintain 97.7Capture then maintain 100
In summary, the maintain stage of the achieve-by then maintain clearance type met theperformance goal over the course of the maintain stage as well as at the PTP of YOKXO (asshown in Section 4.5.3). For the capture then maintain clearance type, the performance goalwas met over the course of the maintain stage and at the merge point of DERVL and at the PTPof YOKXO (as shown in Section 4.5.3).
4.5.5 Events Below Separation StandardFive events occurred where an aircraft was below the applicable separation standard20. None ofthe events were for trail aircraft conducting IM. One event was an aircraft that had started IMbut then subsequently terminated IM. The controller stated that the reason for the terminationwas so he could speed the trail aircraft up beyond the IM speeds, so IM was unrelated to theseparation issue. There were no specific causes determined for the other events. Figure 4-42shows the locations of the events.
Figure 4-42. Location Where an Aircraft was Below the Applicable Separation Standard
Note: Two events occur just prior to DERVL and overlap on the figure.
20 No events inside of YOKXO were considered as the was no tower controller in the simulation.
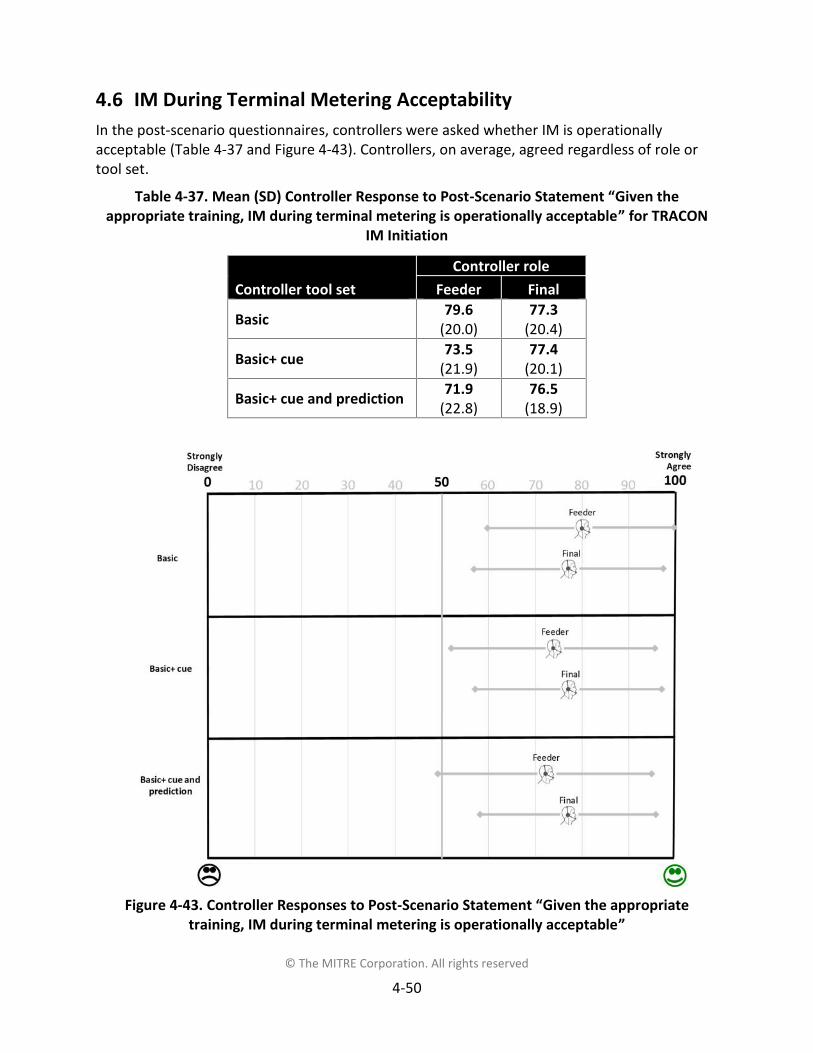
© The MITRE Corporation. All rights reserved
4-50
4.6 IM During Terminal Metering AcceptabilityIn the post-scenario questionnaires, controllers were asked whether IM is operationallyacceptable (Table 4-37 and Figure 4-43). Controllers, on average, agreed regardless of role ortool set.
Table 4-37. Mean (SD) Controller Response to Post-Scenario Statement “Given theappropriate training, IM during terminal metering is operationally acceptable” for TRACON
IM Initiation
Controller tool setController role
Feeder Final
Basic 79.6(20.0)
77.3(20.4)
Basic+ cue 73.5(21.9)
77.4(20.1)
Basic+ cue and prediction 71.9(22.8)
76.5(18.9)
Figure 4-43. Controller Responses to Post-Scenario Statement “Given the appropriatetraining, IM during terminal metering is operationally acceptable”
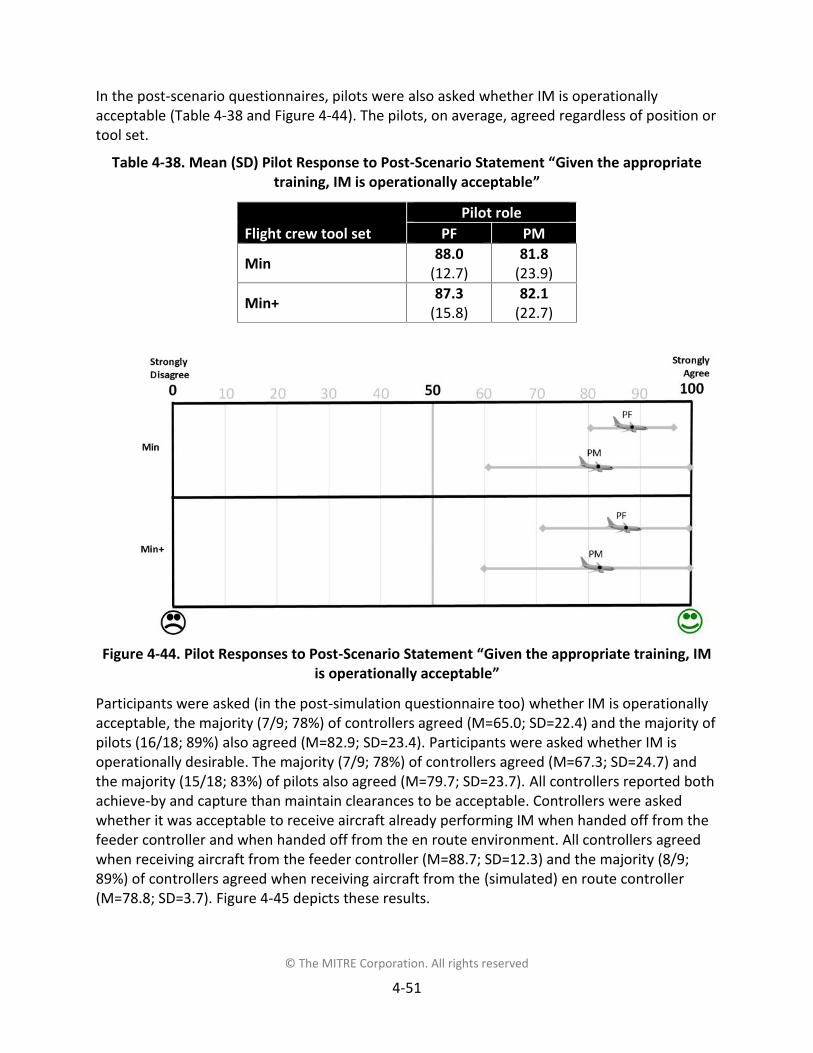
© The MITRE Corporation. All rights reserved
4-51
In the post-scenario questionnaires, pilots were also asked whether IM is operationallyacceptable (Table 4-38 and Figure 4-44). The pilots, on average, agreed regardless of position ortool set.
Table 4-38. Mean (SD) Pilot Response to Post-Scenario Statement “Given the appropriatetraining, IM is operationally acceptable”
Flight crew tool setPilot role
PF PM
Min 88.0(12.7)
81.8(23.9)
Min+ 87.3(15.8)
82.1(22.7)
Figure 4-44. Pilot Responses to Post-Scenario Statement “Given the appropriate training, IMis operationally acceptable”
Participants were asked (in the post-simulation questionnaire too) whether IM is operationallyacceptable, the majority (7/9; 78%) of controllers agreed (M=65.0; SD=22.4) and the majority ofpilots (16/18; 89%) also agreed (M=82.9; SD=23.4). Participants were asked whether IM isoperationally desirable. The majority (7/9; 78%) of controllers agreed (M=67.3; SD=24.7) andthe majority (15/18; 83%) of pilots also agreed (M=79.7; SD=23.7). All controllers reported bothachieve-by and capture than maintain clearances to be acceptable. Controllers were askedwhether it was acceptable to receive aircraft already performing IM when handed off from thefeeder controller and when handed off from the en route environment. All controllers agreedwhen receiving aircraft from the feeder controller (M=88.7; SD=12.3) and the majority (8/9;89%) of controllers agreed when receiving aircraft from the (simulated) en route controller(M=78.8; SD=3.7). Figure 4-45 depicts these results.

© The MITRE Corporation. All rights reserved
4-52
Figure 4-45. Summary of Controller and Pilot Responses on IM Desirability and AcceptabilityStatements

© The MITRE Corporation. All rights reserved
4-53
4.6.1 Traffic Spacing Awareness and AcceptabilityParticipants were asked whether their level of traffic awareness was acceptable. Responses areshown next and in Figure 4-46.
Controllers
o IM trail aircraft
All controllers agreed (M=86.6; SD=10.5)
o Non-IM aircraft
All controllers agreed (M=91.8; SD=7.6)
Pilots
o Lead aircraft for IM
All pilots agreed (M=90.3; SD=9.6)
o Aircraft other than lead aircraft
The majority (16/18; 89%) of pilots agreed (M=83.6; SD=20.2)
Figure 4-46. Controller and Pilot Responses to “My level of traffic awareness was acceptable”

© The MITRE Corporation. All rights reserved
4-54
In the post-scenario questionnaire, controllers were asked whether they were confident thespacing of the aircraft would remain outside their separation requirement. The results areshown in Table 4-39 and Figure 4-47. The controllers, on average, agreed regardless of role, toolset, or aircraft role. Higher variability was exhibited in the feeder and final replies for IM aircraftwith the basic+ cue and prediction tool set. As mentioned in Section 0, a statistical test was runon this measure and no statistically significant difference was found.
Table 4-39. Mean (SD) Controller Response to Post-Scenario Statement “I was confident thatthe spacing of the aircraft would remain outside my separation requirement”
Controller tool set
Controller roleFeeder Final
IM Non-IM IM Non-IM
Basic 79.7(24.2)
83.3(24.9)
77.9(20.8)
85.1(15.3)
Basic+ cue 81.6(22.8)
86.0(13.3)
80.1(24.6)
89.1(16.1)
Basic+ cue and prediction 75.7(26.7)
80.3(21.5)
75.9(28.0)
88.5(14.6)
Figure 4-47. Controller Responses to Post-Scenario Statement “I was confident that thespacing of the aircraft would remain outside my separation requirement”

© The MITRE Corporation. All rights reserved
4-55
In the post-scenario questionnaire, controllers were asked whether they could detect spacingor separation issues. The results are shown in Table 4-40 and Figure 4-48. Controllers agreed,on average, regardless of role, tool set, or aircraft role. Higher variability was exhibited infeeder replies for IM aircraft with all tool sets and for non-IM aircraft with the basic tool set.
Table 4-40. Mean (SD) Controller Response to Post-Scenario Statement “I was able to detectwhen spacing / separation issues were developing for aircraft”
Controller tool set
Controller roleFeeder Final
IM Non-IM IM Non-IM
Basic 82.5(25.6)
84.5(25.5)
80.2(22.9)
88.2(12.8)
Basic+ cue 79.8(25.1)
84.0(21.8)
82.3(21.9)
90.0(10.1)
Basic+ cue and prediction 78.8(26.0)
84.3(19.6)
81.3(20.8)
86.2(15.9)
Figure 4-48. Controller Responses to Post-Scenario Statement “I was able to detect whenspacing / separation issues were developing for aircraft”

© The MITRE Corporation. All rights reserved
4-56
In the post-scenario questionnaire, pilots were asked whether they could determine if theywould remain within tolerances of the ASG. The results are shown in Figure 4-49. Pilots, onaverage, agreed regardless of role or tool set.
Figure 4-49. Pilot Responses to Post-Scenario Statement “I could detect whether I wouldremain within tolerances to achieve and maintain the assigned spacing goal”
The following questions are from the post-simulation questionnaire and are summarized inFigure 4-50. Participants were asked whether they could detect spacing or separation issuesduring IM. The responses were:
Controllers
o IM aircraft
Controller responses were variable but the majority (6/9; 67%) agreed (M= 64.8;SD= 26.7)
o Non-IM aircraft
The majority (8/9; 89%) of controllers agreed (M= 85.7; SD= 18.8)
Pilots
o Min
The majority (16/18; 89%) of pilots agreed (M= 72.6; SD= 22.7)
o Min+
The majority (17/18; 94%) of pilots agreed (M= 86.2; SD= 15.8)

© The MITRE Corporation. All rights reserved
4-57
Controllers were asked if the spacing of the aircraft would remain outside their separationrequirement. The majority (7/9; 78%) of the controllers agreed for IM aircraft (M=63.1;SD=27.7) and all controllers agreed for non-IM aircraft (M= 80.3; SD=14.6). Participants wereasked whether the spacing when conducting IM was acceptable. The majority (7/9; 78%) ofcontrollers agreed for IM aircraft (M=68.7; SD=22.7) and the majority (7/8; 88%; missing=1)agreed for non-IM aircraft (M=82.1; SD=16.5). The majority (17/18; 94%) of pilots agreed(M=85.1; SD=22.4).
Several comments were made on the questions related to controller confidence in monitoringand predicting spacing and separation. A majority (approximately 7/9; 78%) of controllersexpressed issues with not “knowing what the [IM aircraft / flight crew] is doing” / not knowingthe speeds to be flown and when. Controllers reported trusting the flight crew and letting it“play out,” but feeling out of the loop. Similar comments were also made to the researchobservers. The observers noted that even though IM appeared to perform as expected,controllers did not feel entirely comfortable allowing aircraft to conduct IM, especially whenclose to the separation standard. Certain geometries appeared to increase that unease, e.g.,two aircraft (one acting as an IM trail aircraft) on one route with an aircraft between them(acting as the IM lead aircraft) on the other route.
When controllers were asked whether the handed-off aircraft would be accepted with minimalproblems, the majority (8/9; 89%) agreed for IM aircraft (M= 84.6; SD=16.6) and all agreed fornon-IM aircraft (M= 93.4; SD=6.6).
All designed-in off nominal events where a trail aircraft overtook its lead were detected by thecontrollers. Since the situation was created by speed alone, the overtake took a long time toevolve and appear to the controllers as problematic. However, by the time the trail aircraft wasin the final controller’s airspace, the situation became apparent and the final controllerterminated the IM operation. This was a point where the “no speed” alerts were no longerprovided, so the controller needed to detect the situations without an alert.
Pilots were asked whether they could determine if they would remain within tolerances of theASG. The majority (15/18; 83%) agreed (M= 75.7; SD=24.4). As mentioned in Section 0, astatistical test was run on this measure and no statistically significant difference was found.However, comments for this question and other similar ones indicate that the tolerances wereunclear, especially without the graphical progress indicator. Figure 4-50 depicts the results forthis line of questioning for pilots and controllers.

© The MITRE Corporation. All rights reserved
4-58
Figure 4-50. Summary of Controller and Pilot Responses on Spacing Acceptability Statements

© The MITRE Corporation. All rights reserved
4-59
The majority (8/9; 89%) of controllers agreed that there were an acceptable number of aircraftperforming IM (M=77.2; SD=27.6) (Figure 4-51). Controllers reported on average that 78.6%(SD=19.7; missing=2) aircraft performing IM and above was / would be reasonable (Figure4-52).
Figure 4-51. Controller Responses to “There were an acceptable number of aircraftperforming IM”
Figure 4-52. Controller Responses to “There were an acceptable number of aircraftperforming IM… What percentage and above is reasonable?”

© The MITRE Corporation. All rights reserved
4-60
Participants were asked whether it was clear that IM was driving toward appropriate spacing.Controller responses were variable but the majority (7/9; 78%) of controllers agreed for IMaircraft (M=62.9; SD=33.9) and all (8/8; 100%; missing=1) agreed for non-IM aircraft (M=89.8;SD=12.0). Pilot responses were variable but the majority (15/18; 83%) of pilots agreed (M=76.5;SD=27.9). Pilots were asked whether they trusted that the IM algorithm was providing theappropriate speeds. Their responses were variable but the majority (15/17; 88%; missing=1)agreed (M=73.4; SD=26.0). However, six pilots, regardless of whether they agreed or not,reported some level of distrust. The observer noted several pilot comments indicatingconfusion about IM speeds. For example, if aircraft had a large amount of time to make up andcould fly 250 kts, some pilots reported being confused about not receiving an IM speed of 250kts. The reason for this could have been that the IM speed was limited (as described in Section3.1.2) but still acceptable, or because the IM speed provided was the speed necessary,regardless of speed limiting. The limiting was not annunciated to the flight crew. Figure 4-53depicts these results.
Figure 4-53. Summary of Controller and Pilot Responses on IM Trust Statements

© The MITRE Corporation. All rights reserved
4-61
Pilots were asked whether they tried to out-guess the algorithm. Forty-seven percent (8/17;missing=1) provided “yes” responses (Figure 4-54). However, the majority (15/18; 83%) of pilotsreported they did not choose to ignore an IM speed (Figure 4-55).
Figure 4-54. Pilot Responses to “Did you ever try to “out-guess” the IM algorithm and the IMspeeds?”
Figure 4-55. Pilot Responses to “Did you choose not to fly an IM speed?”

© The MITRE Corporation. All rights reserved
4-62
4.6.2 WorkloadIn the post-scenario questionnaire, controllers and pilots were asked to rate their averageoverall workload on the Bedford Workload Rating Scale. Table 4-41, Table 4-42, and Figure 4-56show the ratings for both controllers and pilots. As can be seen, controllers and pilots generallyfound workload to be acceptable.
Table 4-41. Mean (SD) Pilot Response to Post-Scenario Bedford Workload Rating Scale
Flight crew tool set
Pilot role
PF PM
Min 2.7(1.2)
2.4(1.0)
Min+ 2.7(1.1)
2.5(1.0)
Table 4-42. Mean (SD) Controller Response to Post-Scenario Bedford Workload Rating Scale
Controller tool set
Controller role
Feeder Final
Basic 2.8(1.4)
2.6(1.3)
Basic+ cue 2.7(1.2)
2.6(1.2)
Basic+ cue and prediction 2.8(1.3)
2.5(1.1)

© The MITRE Corporation. All rights reserved
4-63
Figure 4-56. Controller and Pilot Response Means to the Bedford Workload Rating

© The MITRE Corporation. All rights reserved
4-64
When asked about the acceptability of their overall workload, all controllers agreed that it wasacceptable (M=88.1; SD=10.2). The pilot responses were variable (M=80.5; SD=26.2), but themajority (15/18; 83%) agreed. The majority (15/18; 83%) of the pilots also agreed they receivedan acceptable number of IM speeds (M= 75.4; SD=24.9). However, at least four pilots,regardless of whether they agreed or not, reported that the IM speeds could be too frequent attimes. Figure 4-57 depicts these results.
Figure 4-57. Summary of Pilot Responses on Workload Statements

© The MITRE Corporation. All rights reserved
4-65
4.6.3 Controller Acceptability Rating ScaleIn the post-scenario questionnaire, controllers were asked to rate their acceptability of IM withController Acceptance Rating Scale (Table 4-43 and Figure 4-58). As can be seen, controllersgenerally found the system to be acceptable.
Table 4-43. Mean (SD) Controller Response to Post-Scenario Controller Acceptance RatingScale
Controller tool setController role
Feeder Final
Basic 7.8(1.6)
8.0(1.2)
Basic+ cue 7.9(1.6)
7.8(1.8)
Basic+ cue and prediction 7.5(1.9)
7.6(1.5)
Figure 4-58. Controller Response Means to Controller Acceptance Rating Scale

© The MITRE Corporation. All rights reserved
4-66
The following comments were captured in the questionnaires or were made to the observers.They are not directly tied to one question, but are included for completeness.
The environment of terminal metering and IM during nominal conditions created arelatively low workload environment.
Controllers sometimes mentioned worries about becoming “monitors” and being lessengaged in this environment.
4.7 Displays
4.7.1 Air Traffic ControllersIn the post-scenario questionnaire, controllers were asked whether they had the necessarydisplay elements to conduct IM. The results are shown in Table 4-44 and Figure 4-59.Controllers agreed, on average, regardless of role or tool set. Higher variability existed for bothfeeder and final replies, with the basic and the basic+ cue tool sets. As mentioned in Section 0,a statistical test was run on this measure and no statistically significant difference was found.
Table 4-44. Mean (SD) Controller Response to Post-Scenario Statement “I had the necessarydisplay elements for conducting IM operations”
Controller tool setController role
Feeder Final
Basic 76.8(25.3)
71.5(26.8)
Basic+ cue 75.5(27.7)
80.3(25.9)
Basic+ cue and prediction 81.1(21.4)
82.3(15.2)

© The MITRE Corporation. All rights reserved
4-67
Figure 4-59. Controller Responses to Post-Scenario Statement “I had the necessary displayelements for conducting IM operations”

© The MITRE Corporation. All rights reserved
4-68
In order to understand the impact of terminal metering elements on IM operations, controllerswere asked whether the elements were helpful for IM and non-IM aircraft (Figure 4-60).
The majority of controllers agreed for the following elements (some with higher variability):
(Non-blue) Slot markers
o Non-IM aircraft (6/9; 67%) (M= 79.8; SD= 22.7)
Speed advisories
o IM aircraft (6/9; 67%; missing n= 1) (M= 66.1; SD= 31.2)
Note: Large variance driven by one 0 rating
o Non-IM aircraft (6/9; 67%) (M = 69.1; SD= 25.4)
Slot marker speeds
o IM aircraft (8/9; 89%) (M= 76.9; SD= 28.0)
o Non-IM aircraft (8/9; 89%) (M= 80.0; SD= 28.4)
Aircraft indicated airspeed
o IM aircraft (8/9; 89%) (M= 77.2; SD= 28.2)
o Non-IM aircraft (8/9; 89%) (M= 78.4; SD= 28.3)
Runway sequence number
o IM aircraft (8/9; 89%) (M= 82.1; SD= 19.6)
o Non-IM aircraft (8/9; 89%) (M= 82.0; SD= 19.6)
Controller responses were variable for the following elements.
(Non-blue) Slot Markers
o IM Aircraft (M= 52.8; SD= 35.0)
Early / Late indicator
o IM aircraft (M= 35.9; SD= 34.1)
o Non-IM aircraft (M= 30.2; SD= 24.9)
Runway assignment
o IM aircraft (M= 71.0; SD= 26.1)
o Non-IM aircraft (M= 70.9; SD= 26.2)
Timeline
o IM aircraft (M= 40.7; SD= 38.9)
o Non-IM aircraft (M= 34.1; SD= 36.4)

© The MITRE Corporation. All rights reserved
4-69
Figure 4-60. Controller Responses to “The terminal metering elements were helpful for the IM and non-IM aircraft”
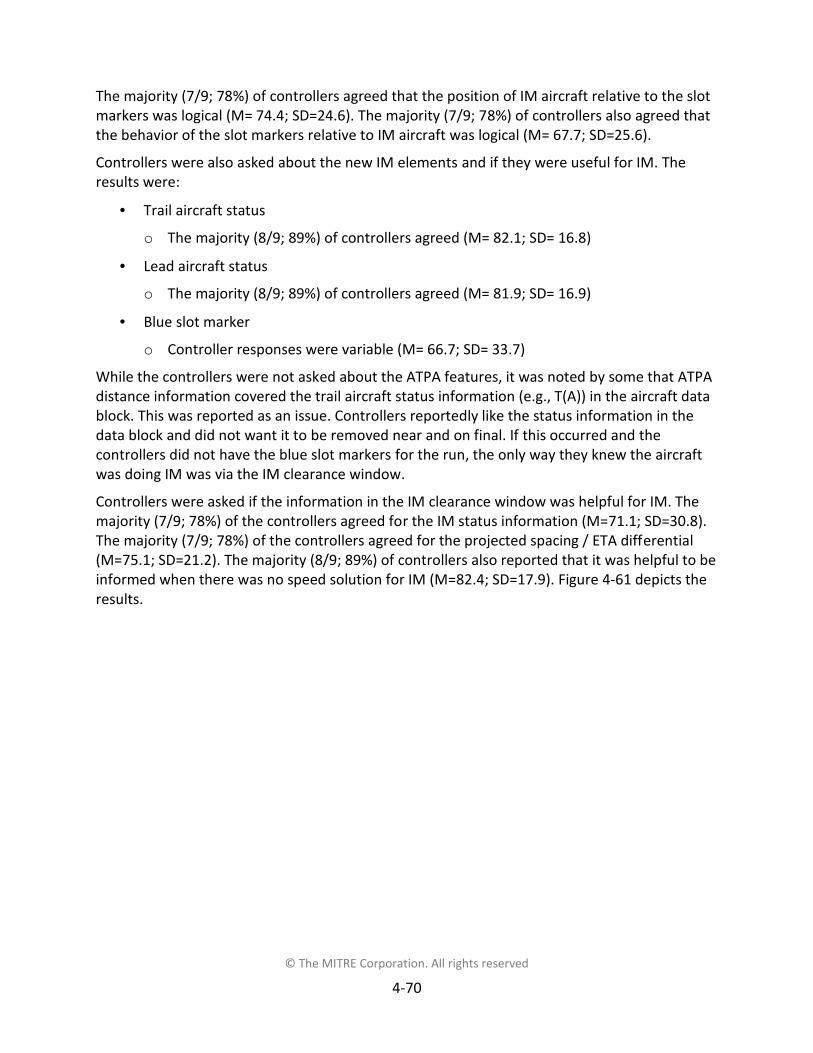
© The MITRE Corporation. All rights reserved
4-70
The majority (7/9; 78%) of controllers agreed that the position of IM aircraft relative to the slotmarkers was logical (M= 74.4; SD=24.6). The majority (7/9; 78%) of controllers also agreed thatthe behavior of the slot markers relative to IM aircraft was logical (M= 67.7; SD=25.6).
Controllers were also asked about the new IM elements and if they were useful for IM. Theresults were:
Trail aircraft status
o The majority (8/9; 89%) of controllers agreed (M= 82.1; SD= 16.8)
Lead aircraft status
o The majority (8/9; 89%) of controllers agreed (M= 81.9; SD= 16.9)
Blue slot marker
o Controller responses were variable (M= 66.7; SD= 33.7)
While the controllers were not asked about the ATPA features, it was noted by some that ATPAdistance information covered the trail aircraft status information (e.g., T(A)) in the aircraft datablock. This was reported as an issue. Controllers reportedly like the status information in thedata block and did not want it to be removed near and on final. If this occurred and thecontrollers did not have the blue slot markers for the run, the only way they knew the aircraftwas doing IM was via the IM clearance window.
Controllers were asked if the information in the IM clearance window was helpful for IM. Themajority (7/9; 78%) of the controllers agreed for the IM status information (M=71.1; SD=30.8).The majority (7/9; 78%) of the controllers agreed for the projected spacing / ETA differential(M=75.1; SD=21.2). The majority (8/9; 89%) of controllers also reported that it was helpful to beinformed when there was no speed solution for IM (M=82.4; SD=17.9). Figure 4-61 depicts theresults.

© The MITRE Corporation. All rights reserved
4-71
Figure 4-61. Summary of Controller Responses on IM Display Element Statements

© The MITRE Corporation. All rights reserved
4-72
When asked about the necessary monitoring of traffic, controller responses were variable butthe majority of controllers (7/9; 78%) reported that the monitoring of IM traffic was increased(M=3.2; SD=2.0) and the controller replies were variable for non-IM traffic (M=3.8; SD=1.9)(Figure 4-62). When asked whether the necessary monitoring was acceptable, the majority(8/9; 89%) of controllers agreed for IM aircraft (M=77.6; SD=17.4) and all controllers agreed fornon-IM aircraft (M=85.2; SD=12.1) (Figure 4-63).
Figure 4-62. Controller Responses to “How did aircraft conducting IM during terminalmetering effect your need to monitor traffic?”
Figure 4-63. Controller Responses to “The necessary aircraft monitoring was acceptable”

© The MITRE Corporation. All rights reserved
4-73
4.7.2 Flight CrewThe pilots were asked about select, key min elements as well as the min+ IM elements. For themin elements, the majority (14/18; 78%) of pilots agreed the IM speed change advisory wassufficient to detect the presence of a new speed (M=71.4; SD=23.5). All pilots agreed that theIM speed conformance monitoring alert was useful (M=85.4; SD=8.6) and the majority (17/18;94%) agreed that it is a minimum requirement (M=84.2; SD=18.4). Figure 4-64 depicts theresults.
Figure 4-64. Summary of Pilot Responses on Min Display Element Statements

© The MITRE Corporation. All rights reserved
4-74
For the min+ elements, the majority (14/18; 78%) of pilots reported that the graphical progressindicator was useful (M=81.8; SD=20.1). However, pilot responses were variable as to whetherit was a minimum requirement (M=59.2; SD=30.3). Pilots were then asked whether thegraphical progress indicator was unnecessary. Responses were variable (M=59.3; SD=31.8).
The following was captured in comments made to the observer, or were in notes from theobserver. The graphical progress indicator was generally preferred (over only the ASG and SI) todetermine whether or not the ASG would be achieved or maintained. Without the graphicalprogress indicator, pilots had no clear information on the tolerances. Even with the graphicalprogress indicator, the situation could change as the operation evolved. A situation that was, atone point, out of tolerance, could get within tolerance at a future point. Pilots wanted clearguidance from the avionics on when to report “unable interval spacing.”
Pilot responses were variable about whether the speed tape was useful (M=59.3; SD=31.8).Three pilots commented that they wanted it on or near the PFD. The responses were variableas to whether it was a minimum requirement (M=32.9; SD=27.6), though the majoritydisagreed that it was a minimum requirement (13/18; 72%). Figure 4-65 depicts these results.
Figure 4-65. Summary of Pilot Responses on Min+ Display Element Statements

© The MITRE Corporation. All rights reserved
4-75
In the post-scenario questionnaire, pilots were asked whether they had the necessary displayelements to conduct IM. Table 4-45 and Figure 4-66 shows pilots, on average, agreed,regardless of role or tool set. As mentioned in Section 4.1.3, a statistical test was run on thismeasure and no statistically significant difference was found.
Table 4-45. Mean (SD) Pilot Response to Post-Scenario Statement “I had the necessary displayelements for conducting IM”
Flight crew tool setPilot role
PF PM
Min 83.8(17.1)
79.3(22.4)
Min+ 89.2(14.1)
81.6(21.9)
Figure 4-66. Pilot Responses to Post-Scenario Statement “I had the necessary displayelements for conducting IM”

© The MITRE Corporation. All rights reserved
4-76
The majority of pilots reported the min (13/18; 72%) and the min+ (16/18; 89%)implementations included all the necessary information to conduct IM (Figure 4-67).
Figure 4-67. Pilot Responses to “Did the combination of both the AGD and CDTIimplementations include all the information necessary for you to conduct IM?”
The majority of pilots reported that no display elements were confusing or misleading onneither the AGD (16/18; 89%) or CDTI traffic display (17/17; 100%; missing=1) (Figure 4-68). Thereports of misleading information appeared to be due to initial misunderstandings orsimulation issues (e.g., “didn’t understand the box at first”), not on-going issues.
Figure 4-68. Pilot Responses to “Did you find any elements on the displays to be confusing ormisleading?”

© The MITRE Corporation. All rights reserved
4-77
Pilots reported being able to focus more on the AGD than the CDTI. The PFs reported spending83% of their time on the AGD while the PMs reported spending 67% of their time on the AGD(Figure 4-69).
Figure 4-69. Pilot Responses to “Considering total time on the IM displays, estimate the totalpercentage of time using each display”

© The MITRE Corporation. All rights reserved
4-78
The majority (17/18; 94%) of pilots reported being able to perform IM by primarily focusing onthe AGD (M=87.4; SD=14.1). When asked if they could integrate the displays into their normalscan, the majority (16/18; 89%) of the pilots agreed for the AGD (M= 75.1; SD=27.1) but theresponses were variable for the CDTI (M=54.6; SD=32.8). The majority (16/18; 89%) of the pilotsagreed that the necessary scan time was acceptable (M=74.4; SD=24.4). Pilot responses werevariable (M=63.7; SD=30.1), but the majority (13/18; 72%) agreed that the amount of headdown time was acceptable. Figure 4-70 depicts these results.
Figure 4-70. Summary of Pilot Responses on the Instrument Scan
© The MITRE Corporation. All rights reserved
4-79
Pilot were asked whether the display combination was acceptable for the CDTI states ofclearance entry, entry evaluation, and execution. The majority of pilots agreed for all states.
Clearance (awaiting) entry (15/18; 83%) (M= 79.1; SD= 23.7)
Entry evaluation / cross flight deck coordination (16/18; 89%) (M= 83.4; SD= 18.5)
Execution / IM conduct without graphical progress indicator (15/18; 83%) (M= 69.3; SD=23.1)
Execution / IM conduct with graphical progress indicator (16/18; 89%) (M= 83.0; SD=18.9)
For the awaiting entry state, the research observer noted that participants often chose to typein the lead aircraft identification instead of selecting the lead aircraft and having the fieldautomatically populated (as described in Section 3.1.1.2). This appeared to be due to thedifficulty / burden associated with finding the lead aircraft on the CDTI traffic display.
Finally, when asked if they would be willing to perform IM with the tested displays, the majority(16/18; 89%) agreed for both the minimum (M= 74.9; SD=22.3) and the minimum+ (M= 79.1;SD=25.5) implementations. Figure 4-71 depicts the results.
As would be expected, pilot comments included ones stating a preference for having the IMinformation integrated into the PFD and navigation display.
Figure 4-71. Summary of Pilot Responses to Display Acceptability Statements

© The MITRE Corporation. All rights reserved
4-80
4.8 Roles and ResponsibilitiesParticipants were asked whether their roles and responsibilities were clear. The majority (8/9;89%) of the controllers agreed for IM aircraft (M= 87.0; SD=17.8) and all controllers agreed fornon-IM aircraft (M= 93.0; SD=7.9). The majority (17/18; 94%) of the pilots agreed (M= 87.1;SD=19.2). Figure 4-72 depicts the results.
Figure 4-72. Summary of Controller and Pilot Responses on Role and ResponsibilitiesStatements
4.9 Time on RNAV ArrivalWhen aircraft were conducting IM, they were on their RNAV procedure 98.2% of the time. Non-IM aircraft were on their RNAV procedure 93.8% of the time. IM aircraft were off the RNAVpath on average 222.2 seconds (SD=187.0) and non-IM aircraft for 317.7 seconds (SD=182.0)(Table 4-46). As can be seen, less time was spent off the RNAV path for IM aircraft as comparedto non-IM aircraft.
Table 4-46. Total Time in Seconds (SD) Aircraft were off the RNAV Path
Controller tool set
Aircraft role
IM Non-IM Combined
Basic 245.6(196.5)
307.1(164.9)
276.4(180.7)
Basic+ cue 210.7(181.5)
339.4(160.3)
275.1(170.9)
Basic+ cue and prediction 210.2(183.0)
306.7(220.7)
258.5(180.7)
Combined 222.2(187.0)
317.7(182.0)
270.0(177.4)

© The MITRE Corporation. All rights reserved
4-81
4.10 CommunicationsParticipants were asked whether the IM clearance was acceptable. The majority (7/9; 78%) ofcontrollers agreed for capture then maintain (M=80.4; SD=22.1) and controller responses werevariable for achieve-by (M=57.9; SD=30.6) clearances. Four controllers reported wanting tokeep the clearance concise. Two mentioned that data link communications would help.
Participant pilots only received achieve-by clearances and the majority (16/18; 89%) agreedthat they were acceptable (M=84.6; SD=27.3). The majority (16/18; 89%) of the pilots reportedthat the necessary information was available in the clearance to detect and select the leadaircraft (M=82.8; SD=22.2).
Participants were asked whether the use of the lead aircraft identification in the IM clearancewas acceptable. The majority (7/9; 78%) of controllers agreed (M=82.9; SD=19.9). Pilotresponses were variable (M=79.4; SD=27.6) but the majority (14/17; 82%; missing=1) agreed.Figure 4-73 depicts these results.
Figure 4-73. Summary of Controller and Pilot Responses on Phraseology Statements
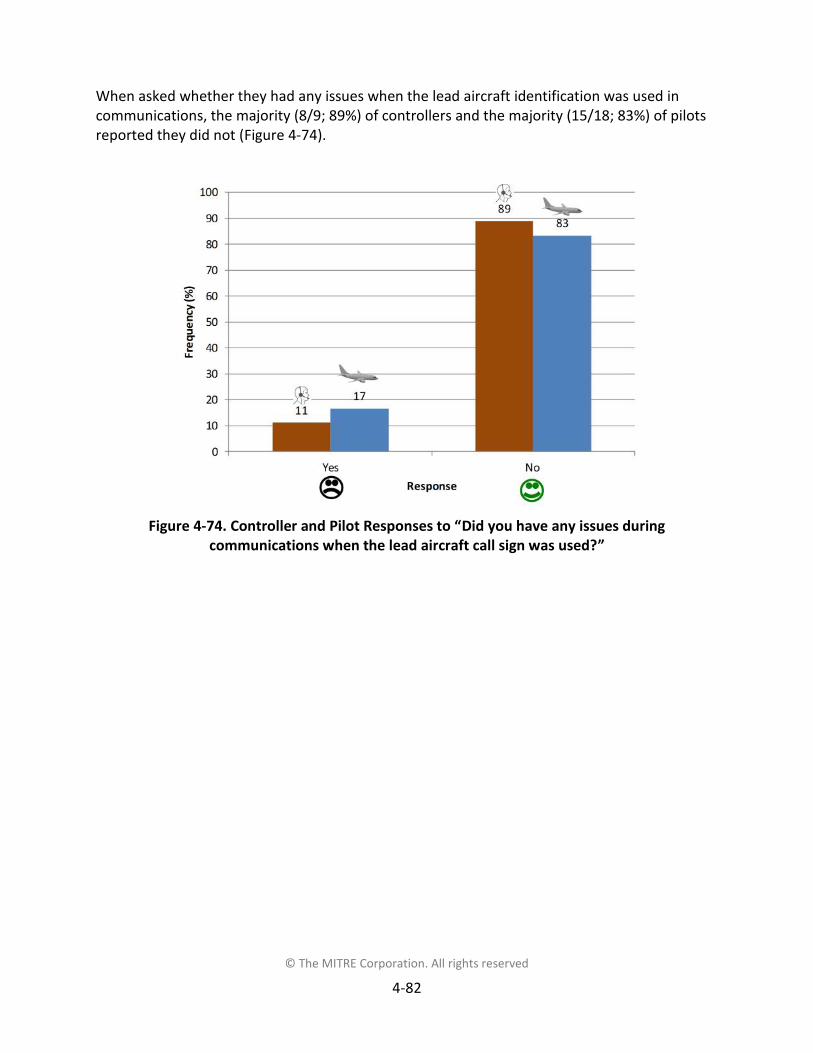
© The MITRE Corporation. All rights reserved
4-82
When asked whether they had any issues when the lead aircraft identification was used incommunications, the majority (8/9; 89%) of controllers and the majority (15/18; 83%) of pilotsreported they did not (Figure 4-74).
Figure 4-74. Controller and Pilot Responses to “Did you have any issues duringcommunications when the lead aircraft call sign was used?”

© The MITRE Corporation. All rights reserved
4-83
4.11 En Route InitiationThe main topic to examine in the simulation was controllers initiating IM in the TRACON.However, some questions existed about receiving aircraft into the TRACON that were alreadyconducting IM. Since the en route IM initiation scenarios were outside the main set ofscenarios, the majority of the post-scenario results are presented separately in this section. Theresults are shown in Figure 4-75. Note that the post-simulation questionnaire did notdistinguish between TRACON and en route initiation so the results are only from the post-scenario questionnaire.
In the post-scenario questionnaire, controllers, on average, agreed when there were askedwhether they:
Were confident the spacing of the aircraft would remain outside their separationrequirement
o Higher variability existed for IM aircraft for all tool sets and for non-IM aircraft forthe basic+ cue tool set
Could detect spacing or separation issues
o Higher variability existed for IM aircraft for the basic+ cue and the basic+ cue andprediction tool sets
IM is operationally acceptable
o Higher variability existed for IM aircraft for the basic+ cue tool set
Had the necessary display elements to conduct IM
o Higher variability existed for IM aircraft for the basic+ cue tool set

© The MITRE Corporation. All rights reserved
4-84
Figure 4-75. Controller Responses to Post-Scenario Statements on En Route Initiation

© The MITRE Corporation. All rights reserved
4-85
In the post-scenario questionnaire, controllers were asked to rate their average overallworkload during en route initiation on the Bedford Workload Rating Scale. Figure 4-76 showsthe ratings. Controllers generally found workload to be acceptable across the tool sets.
Figure 4-76. Controller Responses to the Bedford Workload Rating for En Route Initiation
In the post-scenario questionnaire, controllers were asked to rate their acceptability of IMduring en route initiation with Controller Acceptance Rating Scale. Figure 4-77 shows theratings. Controllers generally found IM operationally acceptable across the tool sets but thebasic+ cue and prediction tool set average is in the “improvement needed” category.
Figure 4-77. Controller Responses for Controller Acceptance Rating Scale for En RouteInitiation
There were zero cases of aircraft spacing below the applicable separation and no IMterminations occurred.

© The MITRE Corporation. All rights reserved
4-86
4.12 Simulation AssessmentParticipants were asked whether the training they received was adequate. All controllersagreed for IM (M=93.0; SD=7.4) and TSAS / terminal metering (M=93.1; SD=7.1). The majority(16/17; 94%; missing=1) of the pilots agreed (M=82.2; SD=14.0). Participants were also askedwhether the overall activity was effective for evaluating IM during terminal metering. Themajority (8/9; 89%) of controllers agreed (M=81.7; SD=18.3), and the majority (16/17; 94%;missing=1) of pilots agreed (M=85.8; SD=13.9). Figure 4-78 depicts these results.
Figure 4-78. Summary of Controller and Pilot Responses on Simulation AssessmentStatements

© The MITRE Corporation. All rights reserved
5-1
5 Discussion
5.1 IM During Terminal MeteringTerminal metering was of more interest (from a research perspective) for the controllerparticipants, than the pilot participants, because it was new to them. Also, terminal meteringwas less of an issue for the flight crews because it was relatively transparent to them becausethey conduct IM operations in the same manner in and out of metering environments.Therefore, the flight crew questions and replies are more relevant in consideration of IMoperations, while the controller replies cut across the entire environment of terminal metering,RNP RF turns, and IM.
Majorities of both controllers and pilots reported IM during terminal metering wasoperationally desirable and acceptable. A majority of controllers reported IM was compatiblewith terminal metering operations (as seen with: Rognin et al., 2005; Callantine et al., 2012;Peterson et al., 2012; Baxley et al., 2016). At times, the IM / relative spacing operation was verysimilar to the behavior of controllers who transition from an absolute spacing operation to arelative spacing operation in the later stages of approach and landing during terminal meteringoperations (as seen with: Callantine et al., 2012).
Controllers also reported that it was acceptable to receive aircraft from both a (simulated) enroute controller and a (participant) feeder controller. The majority of controllers reported theywere confident both IM and non-IM aircraft would be handed off with minimal problems,though non-IM aircraft received higher / more positive ratings. Controllers did not appear tohave issues with two different ABPs, nor spacing / separation issues with IM aircraft that werestill in the achieve stage when passing the merge point.
Controllers found mixed IM (~60%) and non-IM equipage acceptable. The percentage of IMaircraft in this simulation was higher than other work done in the past that also found mixed IMand non-IM equipage to be acceptable (e.g., Callantine et al., 2012). Therefore, this level as wellas lower levels such as those seen in early NASA ATD-1 simulations (e.g., 3 aircraft per scenario,10 – 20%) appear to be acceptable. However, equipage levels higher than 60% appear to bemore desirable based on controller feedback from this simulation.
The majority of controllers and pilots reported that roles and responsibilities were clear. Themajority of both groups also reported that overall workload was acceptable, though the pilotresults were more variable. The majority of controllers and pilots reported acceptable trafficawareness, and associated monitoring, for IM and non-IM aircraft. However, though controllerresponses were variable, the majority reported that their monitoring increased with IM aircraft.This may indicate some level of distrust of IM aircraft or a shift from actively controlling tomonitoring aircraft.
While IM during terminal metering appears acceptable, a few issues were noted about theoverall metering environment with IM and structured arrivals that join the final approachcourse with speeds and altitudes for the flight crew to fly. Controllers noted that thisenvironment created a relatively low workload environment and that it could cause controllers

© The MITRE Corporation. All rights reserved
5-2
to act more as “monitors” and be less engaged. They also reported RNP RF turns as challengingin general based on an aircraft joining the final approach course late in the approach / at theFAF.
5.2 IM Conduct
5.2.1 ControllersOf all the IM clearances proposed by the terminal metering system, 97% were initiated by thecontrollers. Of the 3% rejected, over half were by one controller. The capture then maintainclearances were rejected less often than the achieve-by clearance types, and were initiatedapproximately 11 seconds faster and earlier in the airspace. This seems likely due to thedifferent geometries of the two clearance types. In the capture then maintain operations,aircraft are on the same path (likely easier to visualize) and the clearance information isreduced (likely easier to read and interpret21). Thipphavong et al. (2013) also found controllerswere more likely to initiate IM when the IM trail aircraft and the lead were on the same routeas is seen in the capture then maintain clearance type.
Less than 1% of IM operations were suspended and of those, less than half were resumed. Overhalf of the suspensions were from one controller. One quarter of the suspensions were due tospacing concerns. Other known reasons were related to increasing efficiency and vectoring thelead. Controller terminations of IM occurred in approximately 4% of the IM operations and themost frequent reasons were the same as those for suspensions. There were 4% fewerterminations for achieve-by operations and they occurred over 1.5 minutes later in the airspaceas compared to capture then maintain operations. Few differences were found between thedifferent controller tool sets.
The majority of controllers reported: (1) they were confident both IM and non-IM aircraftwould remain outside their separation requirement, (2) the spacing achieved by IM and non-IMaircraft was acceptable, (3) they were able to detect spacing / separation issues developing,and (4) it was clear aircraft were working toward appropriate spacing. However, for all fourstatements, non-IM aircraft had more positive ratings and / or lower variability. Additionally,observations and comments showed controllers did not appear to feel entirely comfortableallowing aircraft to conduct IM, especially when close to the separation standard. Controllersreported some discomfort in not actively managing the aircraft speed and not knowing whenaircraft would change speeds.
Few differences were found for controller actions or replies based on controller role. Overall,IM operations for controllers went well, with almost all clearances issued and initiated, andvery few operations suspended or terminated. However, some level of discomfort in IMoperations was observed. Based on reports from controllers, the issue seemed to be related tonot actively issuing speeds to IM aircraft and thus not knowing what speeds would be flownand when.
21 This same situation is possibly seen when comparing the results noted in Bone et al. (2007) and Penhallegon andBone (2008). See Section 2.5.1.2.

© The MITRE Corporation. All rights reserved
5-3
5.2.2 Flight CrewThe achieve-by operations had a rate of 1.5 speeds per minute while capture operations had arate of approximately two per minute. The majority of pilots reported these rates as acceptableas was the case in past simulations (e.g., Swieringa et al., 2014; Kibler et al., 2015). About 6%fewer IM speed conformance advisories were issued for the achieve stage as compared to themaintain stage. For the achieve-by stage, IM speeds occurred more frequently the closer theaircraft was to the ABP. For the capture stage, IM speeds were fairly evenly distributed acrossthe entirety of the stage.
IM speed reversals (a speed decrease followed by speed increase) can be challenging (i.e.,confusing and annoying) for flight crews. Speed increases can also be challenging in arrival andapproach operations when flight crews normally only decelerate and have to configure theaircraft for landing (i.e., deployment of flaps). The observer noted that pilots had issues with IMspeeds that required an acceleration after the aircraft started the configuration for landing. Thisissue has been noted in other IM activities (e.g., Penhallegon, Bone, and Stassen, 2016b). Only3% of the IM speeds were reversals but 17% of the IM speeds were speed increases. Fewer ofboth occurred for the achieve stage as compared to the maintain stage, and most speedreversals occurred later in the operation and when in the final controller’s airspace.
The majority of the pilots reported that it was clear the IM speeds were driving towardachieving and maintaining the ASG, though responses were variable and the observer notedthat participants had issues with this. Regardless, the majority of pilots reported the spacingachieved / maintained was acceptable and that they were able to detect whether they wouldremain within tolerances for the ASG.
About half the pilots reported trying to out-guess the IM algorithm, though only a few reportedchoosing to fly a speed other than the IM speed.
As with the controllers, IM operations went well for the flight crews with most clearances beingflown and few reports of “unable.” However, some level of distrust in the IM algorithmoperations was observed. Based on reports from pilots, the issue seemed to be related to thequestion of feasibility of the IM operation.
5.3 Aircraft Spacing and SeparationIn general, aircraft entered the feeder controller’s airspace slightly ahead of schedule onaverage (as described in Section 3.1.6). On average, aircraft were also ahead of, but within 3seconds of, schedule at the constraint points of DERVL and RHYAN. Aircraft stayed ahead ofschedule at the FAF / YOKXO by approximately 7 seconds (for IM aircraft) and 5 seconds (fornon-IM aircraft).
Aircraft were in their slot markers about half time in the feeder controller’s airspace but IMaircraft were inside for less time (46%) than non-IM aircraft (54%). When aircraft were outsideof their slot markers, they were generally ahead of the slot markers (ahead of schedule). At thehandoff from the feeder to final controller, aircraft were on average within 2 seconds of theirslot marker centers. Both IM and non-IM aircraft were in the slot markers approximately 18% ofthe time in the feeder controller’s airspace. Again, when aircraft were out of the slot markers,

© The MITRE Corporation. All rights reserved
5-4
they were generally ahead of the slot markers (ahead of schedule). Wynnyk and Kopald (2013)also found non-IM aircraft conformance with their slot markers decreased over the course ofthe scenario, though not to the degree seen in this simulation.
Although aircraft were often outside of their slot markers and ahead of schedule, the relativeposition of the trail aircraft to the lead is important. Overall, the results show few differencesbetween IM aircraft and non-IM aircraft based on lead aircraft position relative to its slotmarker. The majority of the time the trail aircraft (IM or non-IM) had the same relative positionto its slot marker as the lead aircraft did to its slot marker. While minor differences between IMand non-IM pairs existed when the lead aircraft was behind its slot marker, they appearedminor and were resolved as the aircraft merged at DERVL and arrived at the FAF / YOKXO.Overall, IM and non-IM aircraft met the performance baseline / goals expected for theoperations.
Aircraft in general being out of the slot markers (yet still relatively close to the schedule) in thefinal controller’s airspace, after arriving in the slot markers is logical. The final controllersbecame more concerned with relative spacing of aircraft, as seen in past simulations. Forexample, Wynnyk and Kopald (2013) stated that final controllers were more focused on relativespacing / separation and that the slot markers changed from a schedule objective to an on-going status indication of whether or not a merge was going to be successful. IM has beenconducting relative spacing prior to this point and will continue to do so, thus an IM aircraft’sbehavior looks much like the controller’s behavior at this point. Final controllers may also bewilling to close up spacing if any gaps exist. Several controllers in this simulation expressed aninterest in closing gaps and landing aircraft as soon as possible, regardless of the schedule.
Some past work showed controller concerns with IM aircraft being outside their slot markerslonger than non-IM aircraft (e.g., Cabrall et al., 2012). This was seen in this simulation in thefeeder controller’s airspace and most likely due to achieve-by aircraft working toward the ASGthough not as quickly as the controller was getting aircraft into the slot markers for handoff tothe final controller. The majority of controllers in this simulation reported that IM aircraftposition and behavior of an aircraft relative to its slot marker was logical. However, this wasfound to be an issue in past simulations and may continue to be noted as problematic becausethe controller’s task during metering is to get aircraft into their slot markers. The controller mayget non-IM aircraft into their slot markers more quickly than IM aircraft that are working toachieve the ASG at a downstream point.
There were no controller comments suggesting that candidate IM aircraft should be in their slotmarkers in feeder controller’s airspace prior to starting IM (as there were in the conceptevaluation activities mentioned in Section 2.4.2.3).
There were only five events where the spacing within an aircraft pair was below the separationstandard in the feeder or final controller’s airspace. None of the events were for an aircraftactively conducting IM. The specific reasons for the events were unclear.

© The MITRE Corporation. All rights reserved
5-5
5.4 Displays
5.4.1 ControllersControllers were asked about the terminal metering tools, but only in relation to IM operations.They were also asked about the usefulness of the new IM display elements. Three controllertool sets were examined in this simulation:
Basic: TSAS features, the IM clearance window, as well as the IM trail and lead aircraftstatus fields in the data blocks
Basic+ cue: The basic tool set plus the slot marker color change (cue)
Basic+ cue and prediction: The basic+ cue tool set plus the spacing prediction value(shown in parentheses after the lead aircraft identification in the IM clearance window)
Controller replies on the helpfulness of the terminal metering tools for IM and non-IM aircraftwere similar to past results. The ratings were generally positive for both IM and non-IM aircraft,except for the early / late indicator (which was not available for IM aircraft) and the timeline.Both of these had lower ratings and a lot of variability. The early / late indicator was not shownfor IM aircraft, so this result does not suggest an issue with IM or IM integration. Thissimulation also did not have any specific events that caused the controller to use the timeline(e.g., schedule disruptions), nor did any results indicate that it caused issues for IM aircraft.
The ratings for the terminal metering tools were also generally similar for both IM and non-IMaircraft except for the slot markers (without the additional IM cue). Controllers found the slotmarkers (without the additional IM cue) less useful for IM but the responses had a lot ofvariability. However, observations indicate the slot markers (without the additional IM cue)were still important and utilized for IM aircraft. IM aircraft behavior relative to the slot markerswas reported in the previous section. When considering the results for the terminal meteringtools, they did not appear to conflict with IM operations and several seemed to provide asmuch useful information for IM aircraft as for non-IM aircraft.
Overall, past work such as Cabrall et al. (2012) had similar results as controllers reported theterminal metering tools were useful when controlling IM aircraft and that the slot markers wereless usable for IM aircraft. Thipphavong et al. (2013) also had similar results and reportedcontrollers found the slot markers, timeline, and speed advisories were useful but less so for IMaircraft.
When asked about the IM display information in the IM clearance window, the majority ofcontrollers reported the IM status information, the spacing prediction / ETA differential, andthe no speed alerting were helpful, as seen in past simulations with several of the elements(e.g., Peterson et al., 2012; Callantine et al., 2013; Thipphavong et al. 2013). Benson et al.(2011) and Peterson et al. (2012) also had controller reports of the spacing prediction / ETAdifferential being useful, but replies were variable as to whether it should be a minimumfeature.
For the data block IM elements, trail aircraft and lead aircraft status indicators were reported ashelpful by a majority of controllers, as with past simulations (e.g., Benson et al., 2011; Cabrall et

© The MITRE Corporation. All rights reserved
5-6
al., 2012; Callantine et al., 2012; Callantine et al., 2013). Presenting the status of the leadaircraft is not only helpful in understanding aircraft roles, it was found by Thipphavong et al.(2013) to reduce the chance of suspending an IM operation by 20%.
The color change of slot markers to blue (aka “cue”) for trail aircraft actively conducting IMreceived variable responses regarding its usefulness (note these replies are for the same slotmarkers as noted above but this question was for the color change for IM). However,observations indicate the cue was still important and utilized for IM aircraft (and may helpavoid accidentally issuing a speed to an aircraft already conducting IM). The cue may be moreuseful for controllers who did not initiate IM, and therefore do not have memory of whichaircraft had been engaged in IM. The cue is the first visual indication of which aircraft areconducting IM when entering the airspace. The cue was introduced for the simulation based onfeedback received during the concept evaluation activities leading up to the simulation. Thoseindividuals reported the cue as useful and helpful as compared to situations without it.However, controllers in this simulation did not clearly report it to be as useful and helpful.
For the different controller tool sets, statistical tests found no statistically significant differencebetween tool sets (or controller roles) for the question of being confident the IM aircraftspacing would remain outside the separation requirement. There was also no difference for thequestion of whether they had the necessary display elements. Other data did not reveal cleartrends. However, as mentioned previously, the majority of controllers reported that the spacingprediction / ETA differential was useful while the slot marker cue received some mixedresponses (although comments and observations indicated they were useful). Additional workis likely necessary to continue to determine the necessary controller tools.
The currently-fielded ATPA feature was available and utilized in the simulation. Somecontrollers reported issues with the ATPA distance covering the trail aircraft IM status (e.g,T(A)) when aircraft were on final and ATPA was active. They liked the IM information in the datablock and if they did not have the slot marker cue, the only way they knew the aircraft wasdoing IM was in the IM clearance window.
5.4.2 PilotsTwo flight deck tool sets were examined in the simulation. The first was termed “min” and wasbuilt to the standards specified in DO-361 (RTCA, 2015a). The second was the “min+” tool setthat included two features not required in DO-361 (RTCA, 2015a): the graphical progressindicator and speed tape. IM information was presented on two different displays: the CDTItraffic display and the AGD.
The AGD was the primary display to be used during IM and contained the key informationelements. It was expected to be where the pilots primarily focused with an occasional referenceto the CDTI traffic display. Pilots reported being able to primarily focus on the AGD whileoccasionally referencing the CDTI traffic display. Pilots reported the AGD was easier than theCDTI traffic display to integrate into the normal instrument scan. The pilot replies were variableas to how well the CDTI traffic display could be integrated into their normal instrument scan.However, the majority agreed that their overall scan time was acceptable and generally agreedthat the required head down time was acceptable. Related to this, pilots reported wanting the

© The MITRE Corporation. All rights reserved
5-7
IM information integrated into the PFD and navigation display, versus into new displays such asan auxiliary traffic display.
The min IM speed change advisory was reported as useful and a minimum requirement for IMby the pilots. The majority of pilots also reported that placing a box around new IM speeds wassufficient for detecting the presence of a new speed. Pilots did not report a need for an auralalert for each new IM speed. Data did show that when pilots had not complied with IM speedsthey had been presented for a shorter period of time (around 8 seconds) than those that werecomplied with. That could be due to pilots missing the IM speed (which was noted by theobserver in some cases) or pilots not having time to implement the IM speed before anotherone was displayed. Either way, it seems that it was reasonable operationally to miss the speedas another one was about to be presented. All pilots agreed that the IM speed conformancemonitoring alert was useful and the majority agreed that it is a minimum requirement. Thisalert has an aural associated with it and seemed to be sufficient for an aural alert related to IMspeeds.
Since the IM speed conformance alerting was, unintentionally, implemented differently thanspecified in DO-361 (RTCA, 2015a), it is interesting to determine whether the behavior seen inthe simulation helps validate the requirements. Approximately 58% of the advisories providedin the simulation were per the standard. The other 42% were not and were inside the tolerancethreshold specified in the standard. The number of advisories seen in the simulation were notreported to be problematic and may have actually helped more with conformance than if thealerting was implemented per the standard. The use of this result is a bit unclear due to thepotential interaction between the additional alerts and the speed conformance.
The display implementation purposefully did not make a distinction for the pilots aboutwhether they were in the achieve or maintain stage of the achieve-by then maintain clearancetype. The distinction was not believed to something that the flight crew needed to act on, sothe information was not provided. This approach did not reveal any issues with pilot awarenessof IM operations, which suggests this should not be a minimum requirement.
A majority of pilots reported a willingness to perform IM with both the min and min+ tool setsand that both included the necessary information. The majority also agreed that they were ableto detect spacing issues with both tool sets. Additionally, two statistical tests run on the use ofthe two tool sets did not reveal any statistically significant findings. This indicates that the mintool set may be sufficient as a minimum implementation. However, caution should be exercisedwith these results as past work and some data from this simulation indicate that at least thegraphical progress indicator should be considered for a useful minimum requirement. Thisresult and caution is similar to that reported in Swieringa et al. (2014) where a simulationsimilar to that reported here was conducted. The following paragraphs will review the two min+features (i.e., the graphical progress indicator and speed tape).
The graphical progress indicator was reported as useful by the majority of pilots, but opinionswere mixed as to whether it is a minimum requirement. However, much of the past work on IMhas either required this feature or has worked to perfect it. EUROCONTROL requires a graphicalspacing cue (Hoffman et al., 2006), NASA Ames used one (NASA, 2004), and NASA Langley hasbeen working to perfect one (e.g., Swieringa et al., 2014). MITRE recommended one but did not

© The MITRE Corporation. All rights reserved
5-8
have one developed based on supporting a specific implementation (Bone et al., 2003). Pilotshave also indicated a strong preference for such a feature (e.g., Baxley et al., 2013).Additionally, the feasibility check as implemented in this simulation was based on DO-361(RTCA, 2015a) defined bounds that were found to be in error (based on the use in thissimulation). As a result, the bounds used in this simulation flagged infeasible operations morethan was intended by the authors of DO-361 (RTCA, 2015a). Additionally, operations that wereshown as infeasible would become feasible again before the flight crew acted. Pilots appearedto have difficulty determining whether an operation was going to remain infeasible and whataction to take. These issues could have led to questioning whether the graphical progressindicator should be a minimum. Pilot comments in various questions indicate that it isimportant to clarify tolerances and the associated actions.
Pilot opinions were variable on whether the speed tape on the CDTI traffic display was usefuland a minimum requirement. Pilot opinion of the speed tape was likely driven by the placementof the feature on the CDTI traffic display, which was not where the pilots were expected to, ordid, focus. Moving this feature to the AGD or PFD could impact this result and make the featuremore desirable, as it contains key details such as the IM speed, whether the IM speed is set inthe MCP, and whether the aircraft is flying the IM speed. Such information has been displayedor required in past research (e.g., Hoffman et al., 2006; Bone and Long, 2014; Latorella, 2015).
Overall, the min+ tool set received more “yes” replies (compared to the min) when pilotsreported whether the display included all the necessary information. Additionally, higher /more positive ratings were provided (compared to the min) when pilots reported the ability todetect developing spacing issues. The ratings were also higher for the min+ tool set (comparedto the min) when pilots were asked whether the displays were acceptable during IM execution.
The objective data also shows more positive trends for the min+ tool set. While the rate of IMspeeds per minute and magnitude of IM speed for both tool sets were similar, pilots compliedwith approximately 6% more IM speeds and had less spacing error at the ABP for the min+ toolset (though the trends should only be considered in light of other trends as neither werestatistically significant). Pilots also received approximately 6% less IM speed conformanceadvisories for the min+ tool set.
Few to no comments were received about the need for additional display features beyond themin or min+ tool sets. However, there were pilots replies from different questions asking fortrend information on the graphical progress indicator, especially when near or at the toleranceboundaries.
5.5 CommunicationsThe participant pilots did not receive capture then maintain clearances, but those clearancesare shorter and so the amount of information contained in them should also be acceptable. Thecapture then maintain clearance was reported as acceptable by controllers. The amount ofinformation in the achieve-by clearance type was reported as acceptable by participant pilots.However, the achieve-by clearance type acceptability had variable controller responses. Justless than half of the controllers reported wanting to keep the clearance concise, though efforts

© The MITRE Corporation. All rights reserved
5-9
had already been made in this simulation to keep the clearance concise (e.g., not stating thePTP in the clearance).
The pilots also reported that the necessary information was available from the clearance todetect and select the lead aircraft. The information provided was the lead aircraft identification(e.g., American one twenty-three). Once the flight crew had the lead aircraft identification, theycould either select the traffic by touching it on the display or they could enter the aircraftidentification and it would be selected for them. The majority of the time they did the latter.
Pilots and controllers reported the use of the lead aircraft identification in the IM clearance wasacceptable, though there was some variability in the pilot replies. The majority of both pilotsand controllers reported no issues when the lead aircraft identification was used.
5.6 IM BenefitsThe spacing error (the difference between the planned interval and the achieved interval) wasmeasured for all aircraft at the FAF / YOKXO. For IM aircraft, the planned interval became theASG at the ABP and the spacing error is a direct measure of how close the IM aircraft were tothe ASG. For non-IM aircraft, it is a measure of how well the aircraft met the planned interval.Both IM and non-IM aircraft had a small spacing error (under 1 second) but the IM aircraft hadhalf the variance (4.1 seconds less) of non-IM aircraft. These results are similar to past workthat found IM reduces the inter-arrival spacing variation (e.g., Rognin et al., 2005; Prevot et al.,2007). IM aircraft met the ASG with a 4.1 second SD. Therefore, IM aircraft met theperformance goal of 5.0 seconds IAT SD mentioned in Section 2.2.2.1. Overall, IM and non-IMaircraft met the performance baseline / goals expected for the operations.
Aircraft conducting IM spent approximately 1.5 minutes more on the RNAV path (less timevectored) as compared to non-IM aircraft. This result is similar to that found by Thipphavong etal. (2013) who also found IM aircraft (and their lead aircraft) remained on the RNAV routeslonger than those not conducting IM. Keeping IM aircraft on their routes is an indication thatcontrollers were allowing those aircraft to conduct IM and that IM was not causing enough of aspacing / separation concern to vector the IM aircraft off the optimized RNAV routes.

© The MITRE Corporation. All rights reserved
6-1
6 Recommendations
6.1 IM During Terminal Metering General AcceptabilityWhile IM during terminal metering was found acceptable by controllers and flight crews ingeneral, some topics may require additional study.
Initiation geometries different than those examined here may be more challenging. Oneexample may be when the trail aircraft performing IM is in one feeder controller’s airspaceand the lead aircraft is in another feeder controller’s airspace (such as opposite cornerposts). The display tool sets and topics examined in this simulation could also be examinedin these more challenging geometries. For example, the topic of IM aircraft potentiallybeing out of their slot markers more often than non-IM aircraft may be more of an issue forfeeder controllers who are working the aircraft into the slot markers for the next constraintand the handoff to the final controller. If the lead aircraft is not in the feeder controller’ssector, this could be more of an issue. Dependent runway operations such as thosecurrently being defined in RTCA may introduce new issues, and therefore, should also beexamined.
Overall, the vast majority of IM operations were initiated and only a few were suspended orterminated by the controller. This indicated at least some level of trust on the part of thecontroller. Trust may also come with additional experience. However, controllers did reportincreased monitoring and showed some signs of mistrust.
The topic of controller trust in the behavior of IM aircraft should continue to beexamined until the appropriate operations and tools are identified to support sufficienttrust in IM.
Controllers did not have significant issues with receiving aircraft from en route controllers thatwere already conducting IM. This was noted as a potential issue in the concept evaluationactivities leading up to the simulation.
Situations should be identified where receiving aircraft conducting IM from en routecontrollers is an issue. Once they are identified, they should continue to be examined todetermine whether the issue can be addressed or those operations should be excluded.
The simulation only proposed an achieve-by clearance to controllers when the ASG wasbetween 70 and 240 seconds (as noted in Appendix A). There were times when the controllernoted ASGs closer to 240 seconds and did not find IM necessary for such large intervals.
Consideration should be given to the maximum reasonable ASG in the terminalenvironment so controllers are not bothered with IM clearances they may want to reject.

© The MITRE Corporation. All rights reserved
6-2
Flight crews were generally in agreement about the acceptability of IM speeds and algorithmbehavior, but there was some variability in replies related to the clarity of IM speeds drivingtoward the appropriate spacing. Also, approximately half the pilots reported trying to outguessthe algorithm.
The topic of flight crew trust in the behavior of IM should continue to be examined untilthe appropriate tools are identified to support sufficient trust (discussed further in displaySection 6.3.2).
While IM may contribute to controllers monitoring traffic more than actively engaging withthem, the overall environment in which IM was placed (i.e., structured arrivals that join thefinal approach course with speed and altitude restrictions) already had reduced controlleractive engagement (e.g., limited vectoring).
The topic of controllers as monitors may require additional study or, at least, continuedconsideration.
While not an IM issue, RNP RF turns from downwind to the FAF were found to be challengingfor controllers.
It may be desirable to ensure controllers have the appropriate tools (e.g., slot markerson final) to ensure these turns are not too demanding.
6.2 Aircraft Spacing and SeparationIM aircraft appeared to behave in a manner similar to non-IM aircraft. However, an issue thathas been noted in past research (e.g., Cabrall et al., 2012) is that IM aircraft may be outsidetheir slot markers for longer periods of time than non-IM aircraft. In this simulation, it was seenin the feeder controller’s airspace and was most likely due to achieve-by aircraft workingtoward the ASG, though not as quickly as the controller was getting non-IM aircraft into theirslot markers for handoff to the final controller. If aircraft conducing IM are not expeditiouslytrending toward their slot markers, this could still be an issue.
The potential issue of IM aircraft being out of the slot markers for longer periods of timethan non-IM aircraft should be further examined to determine whether it really is an issue,including in unusual and complex traffic situations. In this simulation environment, it did notappear to be a major issue.
Related to this topic, there were no discussions in this simulation of wanting to get IM aircraftinto their slot markers in the feeder controller’s airspace prior to starting IM.
This simulation indicated no need for this to be a standard operating procedure.

© The MITRE Corporation. All rights reserved
6-3
6.3 DisplaysController and pilot roles and responsibilities play a key role in the information that should bedisplayed to them. The flight crew needs sufficient information to tell the controller when theyare unable to comply with the IM clearance (since controllers expected to hear that). Thegraphical progress indicator, or something similar, could be a key element.
The controller mainly needs to know when separation will be an issue. A predicted spacing /ETA differential, or something similar, could be a key element.
Controller and pilot roles and responsibilities and the necessary display information tosupport those roles and responsibilities should continue to be defined and explored. It isnot expected that many new elements are needed, but that the appropriate ones tosupport the roles and responsibilities need to be identified and tested. The followingsections provide suggestions related to this topic area.
6.3.1 ControllersTerminal metering tools did not appear to conflict with IM operations and several seemed toprovide as much useful information for IM aircraft as for non-IM aircraft (similar to results inpast simulation such as Cabrall et al., 2012 and Thipphavong et al., 2013).
Based on the results of this simulation, the terminal metering tools tested did notconflict with IM and there were no results indicating any should be removed, including theslot markers. The only terminal metering information that was removed, and was suggestedto stay removed, was the speed advisory and early / late indicator.
While it is relatively early in the development of the controller information requirements forIM, the tool sets implemented were based on past work, including those with en routecontrollers. The basic tool set (i.e., the information in the IM clearance window and the trailand lead aircraft IM status information in the data block) was found to be useful and helpful.The validity checks and feasibility checks also appeared useful. The data did not reveal cleartrends for the benefits of the additional tools of the slot marker IM cue or spacing prediction /ETA differential.
Additional work should be performed to continue to determine the necessary controllertools and the usefulness of the slot marker IM cue and spacing prediction / ETA differential.
Additional work should be performed to see if a display feature (e.g., alert to a speedchange of a certain magnitude) would be helpful in overcoming the concern of controllersabout not knowing when aircraft conducting IM will change speeds and by how much.
When implementing the IM features, it should be ensured that features like ATPAdistance information when near / on final approach do not override IM information in thedata block.

© The MITRE Corporation. All rights reserved
6-4
6.3.2 PilotsThe information displayed to the flight crew was based on an established community standard(i.e., DO-361 / RTCA, 2015a). The standard went through a long period of development and wasinformed by past IM simulations and studies. This simulation found the minimum requirementsin that standard to be acceptable on several measures, indicating the minimum requirementsare reasonable and encompassing. Therefore, the MOPS should be considered mature for thedisplay features for the IM operations covered in that version (DO-361 / RTCA 2015a). However,the following flight deck items are still recommended for consideration.
This simulation chose not to distinguish between achieve stage and maintain stageoperations (e.g., for the graphical progress indicator or the label for the spacing interval [SI]field on the AGD). While DO-361 (RTCA, 2015a) does not require this, the results of thissimulation suggest that such a distinction is not necessary and that it should not become arequirement.
The need for an indication of speed limiting may also be a topic of interest for additionalstudy. It was not examined in this simulation; however, some pilot confusion was noted thatappeared to be related to speed limiting. While this feature has been utilized in pastsimulations (e.g., Lohr et al., 2005; Baxley et al., 2013), the results do not appear to beconclusive. This information may support trust and may support the flight crew in knowingthe best time to configure the aircraft for landing. However, the feature may provideinformation that has limited usefulness (as reported in Baxley et al., 2016) or encouragepilots to fly a non-IM speed. The usefulness of this information could be studied.
When developing the next version of DO-361 (RTCA, 2015a), the impact of those newoperations on any current requirements and findings in this report should be considered.Additional validation of the requirements on new operations, such as arrivals to dependentrunways, should be conducted.
The aural alerts for conformance monitoring appeared sufficient for informing the flight crew ofthe need to check the IAS against the IM speed. However, consideration should be given to theimplementation utilized in this simulation that (unintentionally) alerted more often thanspecified in DO-361 (RTCA, 2015a). Several past simulations have reported a pilot desire for, orbetter performance with, more salient notifications (i.e., better visual indications or auralalerts) for each new IM speed (e.g., Bone et al., 2003; Penhallegon et al., 2011; Baxley et al.,2013; Swieringa et al., 2014). More salient notifications are desirable and would reduce thetime necessary to monitor IM displays. Features such as an aural alert for each new IM speedmay be too intrusive, especially when the speeds are frequent. Therefore, the followingrecommendation is made:
Continue the examination of the most appropriate scheme for alerting to theconformance to IM speeds. If an aural alert is considered too intrusive, testing shouldinclude sufficiently salient notifications that do not require excessive monitoring of the IMdisplays.
While pilot opinions were mixed as to whether the graphical progress indicator should be aminimum requirement, the feedback on this one question should be considered in light of

© The MITRE Corporation. All rights reserved
6-5
simulation issues, other feedback on the tool, and past work. All major IM HITL simulationefforts ended up requiring or trying to perfect this type of feature (e.g., Bone et al., 2003;Hoffman et al., 2006; NASA, 2004; Swieringa et al., 2014). The results of this simulation hadmore speed compliance and more positive replies for the min+ tool set, and the graphicalprogress indicator was reported as useful.
The implementation in this simulation was directly driven by requirements available in DO-361(RTCA, 2015a). While it proved useful to have these requirements, they were found to be inerror (based on the use in this simulation)22. The result was that the bounds defined and used inthis simulation flagged infeasible operations more than was intended by DO-361 (RTCA, 2015a).This caused the flight crew to see operations flagged as infeasible and then return to feasible.This likely led to confusion about whether the operation was infeasible or not and what actionto take. Not knowing what action to take was present in past simulations too (e.g., Bone et al.,2008a; Baxley et al., 2016). These issues likely led to questioning of what operations werefeasible and whether the graphical progress indicator should be a minimum. Therefore, thefollowing are recommendations related to the graphical progress indicator.
The graphical progress indicator is believed to be a useful feature and likely a minimumrequirement. It should be designed to support pilot trust and an accurate mental model. Itshould avoid providing information that causes the flight crew to try to out-guess oroverride the IM algorithm and the associated IM speeds. It should provide clear indicationsof infeasible operations. It should not require excessive monitoring and should includefeatures that reduce monitoring (e.g., spacing error trend information and out-of-tolerancealerting [as seen in implementations like Hoffman et al., 2006]). To determine the bestdesign, it should be studied further in future simulations in nominal and off-nominalsituations after setting the feasibility threshold to the corrected values.
o For a non-graphical progress indicator as required per the minimum in DO-361(RTCA, 2015a), similar topics should be examined. For example, clear indications ofinfeasible operations may be more important with only numerical values.
The information provided in the speed tape is also considered to be a key set of information(i.e., the relationship between the IAS, MCP speed, and IM speed). Such information has beendisplayed or required in much past research (e.g., Hoffman et al., 2006; Bone and Long, 2014;Latorella, 2015).
Consideration should be given and further research should be conducted to determinewhether this information is a minimum requirement and whether it should be in theprimary field-of-view.
22 The requirements in DO-361 (RTCA, 2015a) are being updated to fix the error.

© The MITRE Corporation. All rights reserved
6-6
6.4 CommunicationsWhile the IM clearances were generally found to be acceptable, controllers did report someconcerns with the achieve-by clearance types and the amount of information in them.
Efforts should continue to examine ways to keep the clearance concise. Attentionshould also be paid to the amount of lead aircraft IFPI shared in the clearance. Thissimulation only had one element (the name of the arrival procedure). If the clearances areas concise as possible, past work has found the use of an advanced organizer such as“Interval spacing clearance available, advise when ready to copy” has been well received bypilots (Bone and Long, 2014) and controllers (Callantine et al., 2012). A few pilot requestsfor such a communication were noted in this simulation.
While the use of lead aircraft identification was included in the simulation, it was not fullyexercised with potentially confusing call signs and the use of the participant aircraftidentification in IM clearances. However, no issues were identified and pilots reported they hadthe necessary information to detect and select the lead aircraft.
6.5 BenefitsPairs of aircraft conducting IM, as expected, had half the spacing variance of non-IM pairs at theFAF. However, IM and non-IM pairs had the same spacing error at the FAF.
To take advantage of the reduced variance seen and expected with IM operations, theappropriate reduction in the spacing buffer used by TBFM for IM aircraft should bedetermined.
© The MITRE Corporation. All rights reserved
7-1
7 ReferencesAbbott, T. S., and Moen, G. C. (1981). Effect of display size on utilization of traffic situationdisplay for self-spacing task (NASA Technical Paper 1885). Hampton, VA: NASA Langley.
Aligne, F., Grimaud, I., Hoffman, E., Rognin, L., and Zeghal, K. (2003). CoSpace 2002 controllerexperiment assessing the impact of spacing instructions in E-TMA and TMS. Bretigny-sur-Orge,France: EUROCONTROL Experimental Centre.
Barmore, B.E., Abbott, T.S., and Capron, W. (2005). Evaluation of airborne precision spacing in ahuman-in-the-loop experiment. Proceedings of the American Institute of Aeronautics andAstronautics (AIAA) 5th Aviation, Technology, Integration, and Operations Conference,Arlington, VA. Reston, VA: AIAA, Inc.
Baxley, B. T., Murdoch, J. L., Swieringa, K. A., Barmore, B. E., Capron, W. R., Hubbs, C. E., Shay,R. F., and Abbott, T. S. (2013). Experimental description and results for arrival operations usingInterval Management with Spacing to Parallel Dependent Runways (IMSPiDR) (NASA/TP-2013-217998). Hampton, VA: NASA Langley.
Baxley, B. T., Shay, R. F., and Swieringa, K. A. (2014). The development of cockpit display andalerting concepts for Interval Management (IM) in a near-term environment (NASA/TM-2014-218659). Hampton, VA: NASA Langley.
Baxley, B. T., Wilson, S. R., Swieringa, K. A., Johnson, W. C., Roper, R. D., Hubbs, C. E., Goess, P.A., and Shay, R. F. (2016). Human-in-the-loop assessment of alternative clearances in IntervalManagement arrival operations (NASA/TP-2016-219362). Hampton, VA: NASA Langley.
Benson, L.M., Peterson, T. N., Orrell, G. L., and Penhallegon, W. J. (2011). Ground-based IntervalManagement – Spacing (GIM-S) controller information requirements human-in-the-loopsimulation (MTR110213). McLean, VA: MITRE CAASD.
Bone, R., Helleberg, J., and Domino, D. (2003). Surface moving map and approach spacingpreliminary findings: Safe Flight 21 Ohio River Valley 2001 MITRE CAASD flight simulations (MTR03W0000069). McLean, VA: The MITRE Corporation.
Bone, R.S., and Long, K. M. (2014). Flight crew and air traffic controller interactions whenconducting interval management utilizing voice and controller pilot data link communications(MTR130300R1). McLean, VA: The MITRE Corporation.
Bone, R. S., and Penhallegon, W. J. (2006). Flight Deck-Based Merging and Spacing (FDMS)demonstration on July 6, 2006: Initial Federal Aviation Administration (FAA) examination of aplanned cockpit implementation (MTR 06W0000072). McLean, VA: The MITRE Corporation.
Bone, R.S., Penhallegon, W.J., Benson, L. M., and Orrell, G. L. (2013) Evaluation of pilot and airtraffic controller use of third party call sign in voice communications with pilot utilization ofcockpit display of traffic information (MTR130347R1). McLean, VA: MITRE CAASD.
Bone, R. S., Penhallegon, W. J., and Stassen, H. P. (2008a). Flight Deck-Based Merging andSpacing (FDMS) impact on flight deck en route operations: FDMS 2 simulation. August -September 2006 (MTR 080034). McLean, VA: The MITRE Corporation.

© The MITRE Corporation. All rights reserved
7-2
Bone, R. S., Penhallegon, W. J., and Stassen, H. P. (2008b). Flight Deck-Based Merging andSpacing (FDMS) impact on flight deck en route operations: FDMS 3 simulation. February - March2008 (MTR 080208). McLean, VA: The MITRE Corporation.
Bone, R. S., Penhallegon, W. J., Stassen, H. P., Simons, E., and DeSenti, C. (2007). Flight deck-based merging and spacing impact on en route air traffic control operations: FDMS 1 Simulation(MTR 070071). McLean, VA: The MITRE Corporation.
Cabrall, C., Callantine, T., Kupfer, M., Martin, L., and Mercer, J. (2012). Controller-managedspacing within mixed-equipage arrival operations involving flight-deck interval management. Inthe proceedings of the 4th International Conference on Applied Human Factors and Ergonomics,San Francisco, CA. Louisville, KY: AFHE.
Callantine, T. J., Cabrall, C. D., Kupfer, M., Omar, F. G., and Prevot, T. (2012). Initialinvestigations of controller tools and procedures for schedule-based arrival operations withmixed flight-deck interval management equipage. In Proceedings of the American Institute ofAeronautics and Astronautics (AIAA) 12th Aviation, Technology, Integration, and OperationsConference, Arlington, VA. Reston, VA: AIAA, Inc.
Callantine, T. J., Kupfer, M., Martin, L., and Mercer, J. (2014). System-level performanceevaluation of ATD-1 ground-based technologies. In Proceedings of the American Institute ofAeronautics and Astronautics (AIAA) 14th Aviation, Technology, Integration, and OperationsConference, Atlanta, GA. Reston, VA: AIAA, Inc.
Callantine, T. J., Kupfer, M., Martin, L., and Prevot, T. (2013). Simulations of continuous descentoperations with arrival-management automation and mixed flight-deck interval managementequipage. Paper presented at 10th USA/Europe Seminar on Air Traffic Management Researchand Development, Napa, California. Retrieved from:http://www.atmseminar.org/papers.cfm?seminar_ID=10.
Callantine, T. J., Palmer, E. A., and Kupfer M. (2010). Human-in-the-loop simulation oftrajectory-based terminal-area operations. In Proceedings of the International Council of theAeronautical Sciences (ICAS) Congress, Nice, France. Bonn, Germany: ICAS.
Clarke, J. P., Bennett, D., Elmer, K., Firth, J., Hilb, R., Ho, N., Johnson, S., Lau, S., Ren, L.,Senechal, D., Sizov, N., Slattery, R., Tong, K., Walton, J., Willgruber, A., and Williams, D. (2006).Development, design, and flight test evaluation of a continuous descent approach procedure fornighttime operation at Louisville International Airport, Report of the PARTNER OPDDevelopment Team (Report No. PARTNER-COE-2006-02). Retrieved from:http://www.mit.edu/people/liling/files/OPD_rpt.pdf.
Endsley, M. (1995). Toward a theory of situational awareness in dynamic systems, HumanFactors, 37, 65-84.
Erkelens, L. J. J. (2000). Research on noise abatement procedures (NLR TP 98066). Amsterdam,Netherlands: NLR.
FAA (2001). Operational Evaluation-2 final report. Cargo Airline Association (CAA) ADS-BProgram and FAA Safe Flight 21 Program. Washington, DC: FAA.

© The MITRE Corporation. All rights reserved
7-3
FAA (2013). NextGen implementation plan. Washington, DC: FAA.
FAA (2015). FACT3: Airport capacity needs in the national airspace system. Washington, DC:FAA.
FAA (2016). Performance based navigation. PBN NAS navigation strategy 2016. Washington,DC: FAA.
Grimaud, I., Hoffman, E., Rognin, L, and Zeghal, K. (2003). EACAC 2001 Real-time experiments:initial evaluation of limited delegation of spacing to the flight deck (EUROCONTROL report No380). Bretigny-sur-Orge, France: EUROCONTROL Experimental Centre.
Grimaud, I., Hoffman, E., Rognin, L, Zeghal, K., and Deransy, R. (2001). EACAC 2000 real-timeexperiments: initial evaluation of limited delegation of separation tasks to the flight deck.(EUROCONTROL report No 368). Bretigny-sur-Orge, France: EUROCONTROL ExperimentalCentre.
Hebraud, C., Hoffman, E., Papin, A., Pene, N., Rognin, L., Sheehan, C., and Zeghal, K. (2004).CoSpace 2002 flight deck experiments assessing the impact of spacing instructions from cruiseto initial approach (EUROCONTROL report No 388). Bretigny-sur-Orge, France: EUROCONTROLExperimental Centre.
Hebraud, C., Hoffman, E., Pene, N, Rognin, L., Sheehan, C., and Zeghal, K. (2004). CoSpace 2003flight deck experiment assessing the impact of spacing instructions from cruise to final approach(EUROCONTROL report No 397). Bretigny-sur-Orge, France: EUROCONTROL ExperimentalCentre.
Hebraud, C., Martin, J. L., Leone, M., and Troise, O. (2006). Validation of a European gat to gateoperational concept for 2005- 2010 (Version 1.1). Brussels, Belgium: EUROCONTROL.
Hicok, D. S. and Barmore, B. E. (2016). Concept of operations for Interval Management arrivalsand approach. In Proceedings of the 2016 SciTech Conference, San Diego, California. Retrievedfrom: https://arc.aiaa.org/doi/pdf/10.2514/6.2016-1609
Hoffman, E., Pene, N., and Zeghal, K. (2006). Flight deck user requirements for airborne spacing(Sequencing and Merging) version 2.3. (Working paper EEC-2006-004). Bretigny-sur-Orge,France: EUROCONTROL Experimental Centre.
in ‘t Veld, A. C., van Paassen, M. M., Mulder, M., and Clarke, J. P. (2003). Pilot support for self-separation during decelerating approaches. In R. S. Jensen (Ed.) Proceedings of TwelfthInternational Symposium on Aviation Psychology, Dayton, Ohio.
Kibler, J. L., Wilson, S. R., Hubbs, C. E., and Smail, J. W. (2015). Air traffic managementTechnology Demonstration phase 1 (ATD) Interval Management for Near-term OperationsValidation of Acceptability (IM-NOVA) experiment (NASA/TP-2015-218767). Hampton, VA:NASA Langley.
Klooster, J. (2007). Required time-of-arrival trials. Presented at “E-Operations” Workshop,Georgia Tech, December 5 & 6, 2007. Arlington, VA : GE Aviation – Digital Systems.

© The MITRE Corporation. All rights reserved
7-4
Kupfer, M., Callantine, T., Martin, L., Mercer, J., and Palmer, E. (2011). Controller support toolsfor schedule-based terminal-area operations. Paper presented at 8th USA/Europe Seminar onAir Traffic Management Research and Development, Napa, California. Retrieved from:http://www.atmseminar.org/papers.cfm?seminar_ID=9.
Latorella, K. A. (2015). Avionics configuration assessment for flightdeck interval management: Acomparison of avionics and notification methods (NASA/TP-2015-218788). Hampton, VA: NASALangley.
Lee, K.K., Kerns, K., Bone, R., and Nickelson, M.N. (2001). Development and validation of theController Acceptance Rating Scale (CARS): Results of empirical research. In Proceedings of the4th International Air Traffic Management Research and Development Seminar, Santa Fe, NM.Retrieved from: http://atm2001.eurocontrol.fr
Lohr, G. W., Oseguera-Lohr, R. M., Abbott, T. S., Capron, W. R., and Howell, C. T. (2005).Airborne evaluation and demonstration of a time-based airborne inter-arrival spacing tool(NASA/TM-2005-213772). Hampton, VA: NASA Langley.
Mayers, A. (2013). Introduction to Statistics and SPSS in Psychology. Upper Saddle River, NJ:Pearson Education.
Mercer, J., Callatin, T. J., Lee, P. U., Prevot, T. and Palmer, E. (2005). An evaluation of airbornespacing in the terminal area. Proceedings of the 2005 IEEE/AIAA 24th Digital Avionics SystemsConference, Oct. 2005, Washington, D.C. Piscataway, N.J.: IEEE Press.
Murdoch, J. L., Barmore, B. E., Baxley, B. T., Abbott, T. S., and Capron, W. R. (2009). Evaluationof an airborne spacing concept to support continuous descent arrival operations. Proceedingsof the Eighth USA/Europe Air Traffic Management Research and Development Seminar(ATM2009). Napa, CA.
NASA (2004). 3D-CDTI User Manual v2.1. Retrieved from:https://ntrs.nasa.gov/archive/nasa/casi.ntrs.nasa.gov/20160010580.pdf
Oseguera-Lohr, R. M., Lohr, G. W., Abbott, T. S., and Eischeid, T. M. (2002). Evaluation ofoperational procedures for using a time-based airborne inter-arrival spacing tool—AIAA 2002-5824. Proceedings of the AIAA's Aircraft Technology, Integration, and Operations (ATIO) 2002,Los Angeles, California. Reston, VA: AIAA, Inc.
Penhallegon, W. J., and Bone, R. S. (2008). Flight Deck-Based Merging and Spacing (FDMS)impact on air traffic control during en route descent: FDMS 4 simulation (MTR 080304). McLean,VA: The MITRE Corporation.
Penhallegon, W., Bone, R., and Stassen, H. (2016a). Results from a field evaluation of IntervalManagement during an optimized profile descent arrival and approach. In Proceedings of the2016 SciTech Conference, San Diego, California. Retrieved from:http://arc.aiaa.org/doi/abs/10.2514/6.2016-1612
Penhallegon, W., Bone, R., and Stassen, H. (2016b). Field test of interval management-spacingduring an optimized profile descent arrival and approach (MTR110426R1). McLean, VA: TheMITRE Corporation.

© The MITRE Corporation. All rights reserved
7-5
Penhallegon, W. J., Mendolia, A., Bone, R., Orrell, G., and Stassen, H.P. (2011). Flight deck-basedInterval Management – Spacing (FIM-S) during departures: Flight crew Human-in-the-loop(HITL) simulation (MTR 110382). McLean, VA: The MITRE Corporation.
Peterson, T. N., Penhallegon, W. J., and Moertl, P. (2012). Mid-Term Interval Management –Spacing for Arrivals (MTR120203). McLean, VA: MITRE CAASD.
Prevot, T., Callantine, T., Homola, J., Lee, P., Mercer, J., Palmer, E., and Smith, N. (2007). Effectsof Automated Arrival Management, Airborne Spacing, Controller Tools, and Data Link. InProceedings of the AIAA Guidance, Navigation, & Control Conference and Exhibit, Hilton Head,SC. Reston, VA: AIAA.
Prevot, T., Callantine, T., Kopardekar, P., Smith, N., Palmer, E., and Battiste, V. (2004).Trajectory-oriented operations with limited delegation: An evolutionary path to NASmodernization. In Proceedings of the 4th AIAA Aviation Technology, Integration, and Operations(ATIO) Conference, Chicago, IL. Reston, VA: AIAA, Inc.
Ren, L., Clarke, J. P., and Ho, N. T. (2003). Achieving low approach noise without sacrificingcapacity. Proceedings of the 2003 IEEE/AIAA 22nd Digital Avionics Systems Conference, Oct.2003, Indianapolis, IN: IEEE Press.
Robinson III, J. E., Thipphavong, J., and Johnson, W. C. (2015). Enabling performance-basednavigation arrivals: Development and simulation testing of the terminal sequencing and spacingsystem. Paper presented at 11th USA/Europe Seminar on Air Traffic Management Research andDevelopment Seminar, Lisbon, Portugal. Retrieved from:http://www.atmseminar.org/papers.cfm?seminar_ID=11.
Rognin, L., Boursier, L., Cloarec, D., Favennec, B., Hoffman, E., Gordon, R., Vergne, F., andZeghal, K. (2005). CoSpace 2004 ground experiment: sequencing arrival flows with spacinginstructions and arrival manager. Bretigny-sur-Orge, France: EUROCONTROL ExperimentalCentre.
Roscoe, A. H. (1984). Assessing pilot workload in flight: Flight test techniques. Proceedings ofNATO Advisory Group for Aerospace Research and Development (AGARD) (AGARD-CP-373).Neuilly-sur-Seine, France: AGARD.
RTCA (2014). Minimum Operational Performance Standards (MOPS) for Aircraft SurveillanceApplications (ASA) System (DO-317B). Washington, DC: RTCA.
RTCA (2015a). Minimum Operational Performance Standards (MOPS) for Flight Deck-based IM(FIM) (DO-361). Washington, DC: RTCA.
RTCA (2015b). Safety, performance, and interoperability requirements document for AirborneSpacing – Flight Deck Interval Management (ASPA-FIM) (DO-328A). Washington, DC: RTCA.
RTCA (2016a). Safety and performance requirements standard for Baseline 2 ATS datacommunications (Baseline 2 SPR standard) (DO-350A). Washington, DC: RTCA
RTCA (2016b). Interoperability requirements standard for Baseline 2 ATS data communications(Baseline 2 interop standard) (DO-351A). Washington, DC: RTCA

© The MITRE Corporation. All rights reserved
7-6
Ruigrok, R. C. J., and Korn, B. (2007). Combining 4D and ASAS for efficient TMA operations. Inthe Proceedings of the 7th AIAA Aviation Technology, Integration, and Operations (ATIO)Conference, Belfast, Northern Ireland. Reston, VA: AIAA, Inc.
Singha, A. N., and Haines, A. L. (1975). Longitudinal separation standards on final approach forfuture ATC environments (MTR-6979). McLean, VA: The MITRE Corporation.
Spinoso, L., Coville, G., and Roberts, C. (2014). Analysis of the excess inter-arrival timedistribution. In Proceedings of the 2014 Integrated Communications, Navigation, andSurveillance (ICNS) Conference, Herndon, Virginia.
Swieringa, K. A., Wilson, S. R., and Shay, R. (2014). An evaluation of retrofit flight deck displaysfor Interval Management. In Proceedings of the 14th AIAA Aviation Technology, Integration, andOperations Conference, Atlanta, GA. Reston, VA: AIAA, Inc.
Swieringa, K. A., Wilson, S. R., Baxley, B. T., Roper, R. D., Abbott, T. S., Levitt, I., and Scharl, J.(2017). Flight test evaluation of the ATD-1 interval management application. In the Proceedingsof the 17th AIAA Aviation Technology, Integration, and Operations (ATIO) Conference, Denver,CO. Reston, VA: AIAA, Inc.
Thipphavong, J., Jung, J., Swenson, H. N., Witzberger, K. E., Lin, M. I., Nguyen, J., Martin, L.,Downs, M. B., and Smith, T. A. (2013). Evaluation of the controller managed spacing tools,flight-deck interval management and terminal area metering capabilities for the ATMtechnology demonstration #1. Paper presented at 10th USA/Europe Seminar on Air TrafficManagement Research and Development Seminar, Napa, California. Retrieved from:http://www.atmseminar.org/papers.cfm?seminar_ID=10.
Weitz, L. (2017). Relationship between inter-arrival time variability and throughput.Presentation to CNS Task Force. McLean, VA: The MITRE Corporation.
Williams, D. H., and Wells, D.C. (1986). Jet transport flight operations using cockpit display oftraffic information during instrument meteorological conditions (NASA Technical Paper 2567).Hampton, VA: NASA Langley.
Witzberger, K., Martin, L., Sharma, S., and Robinson, J. E. (2015). Air Traffic ManagementTechnology Demonstration – 1 (ATD-1) Operational Integration Assessment (OIA) final report.Moffett Field, CA: NASA Ames.
Wynnyk, M. and Kopald, H. (2013). Terminal Sequencing and Spacing (TSS) simulation 2 postanalysis report (MP130272). McLean, VA: The MITRE Corporation.
Zeghal, K., Hoffman, E., Cloerec, A., Grimaud, I., and Nicolaon, J-P. (1999). Initial evaluation oflimited delegation of separation assurance to the cockpit. Proceedings of the 1999 SAE/AIAAWorld Aviation Congress, San Francisco, California. Warrendale, PA: SAE International.

© The MITRE Corporation. All rights reserved
A-1
Appendix A IM Validity and Feasibility Checks
The following were the IM validity and feasibility checks that are expected to be conducted byTBFM for IM operations. Validity checks determine whether the criteria for initiating an IMoperation, or allowing an IM operation to continue, are met. Feasibility checks determinewhether IM can achieve the ASG (with speed alone).
A.1 Validity Checks In order to propose an IM operation, the following validity criteria were required to bemet:
o The trail aircraft was in the sector of the controller
o Trail aircraft was IM capable (as indicated in the flight plan)
o The trail and lead aircrafts’ routes were the same from the ABP to PTP
o Aircraft were in surveillance range, i.e., 90 NM (per IM Performance Analysis Team[IMPAT] 4/6/16)
o Trail aircraft and lead aircraft passed their respective freeze horizons
o The following validity checks were expected for a real-world implementation butwere not implemented for the simulation
o Lead aircraft is target (lead) capable (broadcasting ADS-B of sufficient quality forATC surveillance)
o Note: Should be checked during the Active, Suspended, and Terminatedstages.
o The trail and lead aircraft are conforming to their cleared routes.
o Note: Should be checked during the Active, Suspended, and Terminatedstates
o The trail and lead aircraft are landing at the same runway in sequential order.
o Note: Should be checked during the Active, Suspended, and Terminatedstates
In order to propose an Achieve-by then Maintain operation, the following validitycriteria were required to be met:
o Both the trail and lead aircraft were on different routes until the ABP, then were ona common route
o Trail aircraft had not reached the ABP or PTP

© The MITRE Corporation. All rights reserved
A-2
o Trail aircraft calculated ASG was between 70 and 240 seconds
Note: The value of 70 seconds was expected to support the minimum separationstandard of 2.5 NM. 240 seconds was determined to be a maximum reasonablevalue.
o If Trail aircraft had passed the ABP (but not the PTP) after an Achieve-by thenMaintain clearance was eligible, the trail aircraft shall remain eligible but theclearance shall switch to a Capture then Maintain
In order to propose a Capture then Maintain operation, the following validity criteriawere required to be met:
o Both the trail and lead aircraft were on the same route
o The trail aircraft and lead aircraft current spacing are within 30 seconds of the ASG
A.2 Feasibility Checks
A.2.1 Dependent Feasibility ChecksThe following pair-dependent feasibility criteria were met prior to displaying an IM clearance tothe controller or during a proposed or suspended IM operation. If they were not met during aproposed or suspended operation, the controller was notified.
If the absolute value of [trail aircraft STA – ETA] – [lead aircraft STA – ETA] was greaterthan 50 seconds, the infeasible / no speed solution situation was displayed to the controller.Example as shown in Figure A-1.
Figure A-1. Trail and Lead Aircraft Independent Feasibility Criteria Example
TrailaircraftSTA –ETA
LeadaircraftSTA –ETA
DifferenceAbsolute
value
Feasible
20 (early) -35 (late) = 55 No0 (ontime) 55 (early) = 55 No
29 (early) 30 (early) = 1 Yes
Example
The aircraft pair shall meet the following criteria:
|[trail aircraft STA – ETA] – [lead aircraft STA – ETA]|< 50seconds(i.e., <51 second differential)

© The MITRE Corporation. All rights reserved
A-3
For time-based achieve-by then maintain operations, the following pair-dependent feasibilitycriteria were met prior to displaying the IM clearance to the controller when the trail aircraftwas greater than 30 NM (approximately 7 minutes) from the ABP during an active, proposed, orsuspended IM operation. If they were not met during these states, the controller was notified.
ASG > (trail aircraft ETA – lead aircraft ETA) by more than 15% of the trail aircraft’s TTGto the ABP (i.e., trail aircraft ETA – trail aircraft current time)
o (ETAT - ETAL + 0.15 x TTGT) < ASG
o ASG too large / Not able to slow down enough to achieve the ASG
ASG < (trail aircraft ETA – lead aircraft ETA) by more than 11% of the trail aircraft’s TTGto the ABP (i.e., trail aircraft ETA – trail aircraft current time)
o (ETAT - ETAL – 0.11 x TTGT) > ASG
o ASG too small / Not able to speed up enough to achieve the ASG
Notes
o This is the same feasibility check that was done on the flight deck but was using TSASinformation.
o It may be desirable to change the 15% to 12% and the 11% to 8% so the controller isable to detect and resolve potentially infeasible conditions prior to the flight crewreporting “unable.”
The check is shown in a graphical representation in Figure A-2.
Figure A-2. Feasibility Criteria When Greater than 30 NM / 7 Minutes from the ABP
Range of attainable ASGs
Fastest flyable profile Slowest flyable profile
ASG too largeNot able to slow down
enough to achieve the ASG
ASG too smallNot able to speed up
enough to achieve the ASG
ETAT - ETALETAT - ETAL – 0.11 x TTGT ETAT - ETAL + 0.15 x TTGT

© The MITRE Corporation. All rights reserved
A-4
A.2.2 Independent Feasibility ChecksWhile not implemented in the simulation, the following pair-independent feasibility criteriashould be considered prior to displaying an IM clearance to the controller or during a proposedor suspended IM operation. If they are not met during a proposed or suspended operation, thecontroller shall be notified. See Figure A-3 for examples.
There is a speed solution for TSAS (i.e., an “E” or “L” is not shown)
The trail aircraft STA – ETA or the lead aircraft STA – ETA, is greater than 60 seconds orless than -30 seconds.
Figure A-3. Trail and Lead Aircraft Independent Feasibility Criteria Example
Status STA – ETA DifferenceEarly 30 – 15 = 15On time 30 – 30 = 0Late 30 – 59 = -29
Example(Trail or Lead Aircraft)
STA – ETA = 0
< 60 seconds early
< 30 seconds lateLate
Early
Both aircraft independently shall meet the following criteria:
STA – ETA > - 30 seconds (i.e., <30 seconds late)STA – ETA < 60 seconds (i.e., <60 seconds early)(-30 < STA – ETA <60)

© The MITRE Corporation. All rights reserved
B-1
Appendix B Post-Scenario Questionnaires
B.1 Controller Baseline Post-Scenario QuestionnaireIM DURING TERMINAL METERING HITL POST BASELINE SCENARIO ATC QUESTIONNAIRE
Instructions: Please answer the questions by drawing a line through the option on each of thescales at the point which matched your experience or circling an option (e.g., yes / no). Whenchoosing an option, keep in mind that the integration of IM into terminal metering is the areaof interest (not terminal metering alone). Consider only the current scenario when answering.If you have any questions, please ask the experimenter.

© The MITRE Corporation. All rights reserved
B-2
Workload
1. Using the chart below, how would you rate your average level of workload?
(a) Working up from the bottom left corner, answer each yes/no question and follow thepath.
(b) Circle the numerical rating that best reflects your experience.

© The MITRE Corporation. All rights reserved
B-3
Operations
2. I was able to detect when spacing / separation issues were developing for aircraft.(draw a line on each scale)
Comments:
3. I was confident that the spacing of the aircraft would remain outside my separationrequirement. (draw a line on each scale)
Comments:
4. The spacing of the aircraft was acceptable. (draw a line on the scale)
Comments:
5. Given the appropriate training, this operation is acceptable. (draw a line on eachscale)
Comments:
6. Were there any times when you had an issue with an aircraft? (circle one)
Yes No
If yes, what was the issue?

© The MITRE Corporation. All rights reserved
B-4
Displays
7. I had the necessary display elements. (draw a line on the scale)
Comments:
8. Did you experience any display difficulties? (circle one)
Yes No
If yes, explain:
Communications
9. Did you experience any communication difficulties? (circle one)
Yes No
If yes, explain:
Overall
10. Did you have any other difficulties with this particular run? (circle one)
Yes No
If yes, explain:

© The MITRE Corporation. All rights reserved
B-5
11. Using the chart below, how would you rate your acceptability of the operation.
(a) Working from the top left-hand corner, answer each yes / no question and follow the path.(b) Circle the numerical rating that best reflects your experience.

© The MITRE Corporation. All rights reserved
B-6
12. If you have any other comments about this run, please provide them.

© The MITRE Corporation. All rights reserved
B-7
B.3 Controller IM Post-Scenario QuestionnaireIM DURING TERMINAL METERING HITL POST IM SCENARIO ATC QUESTIONNAIRE
Instructions: Please answer the questions by drawing a line through the option on each of thescales at the point which matched your experience or circling an option (e.g., yes / no). Whenchoosing an option, keep in mind that the integration of IM into terminal metering is the areaof interest (not terminal metering alone). Consider only the current scenario when answering.If you have any questions, please ask the experimenter.

© The MITRE Corporation. All rights reserved
B-8
Workload
1. Using the chart below, how would you rate your average level of workload?
(a) Working up from the bottom left corner, answer each yes/no question and follow thepath.
(b) Circle the numerical rating that best reflects your experience.

© The MITRE Corporation. All rights reserved
B-9
Operations
2. I was able to detect when spacing / separation issues were developing for aircraft.(draw a line on each scale)
IM Aircraft:
Non-IM Aircraft:
Comments:
3. I was confident that the spacing of the aircraft would remain outside my separationrequirement. (draw a line on each scale)
IM Aircraft:
Non-IM Aircraft:
Comments:
4. The spacing of the IM aircraft was acceptable. (draw a line on the scale)
Comments:

© The MITRE Corporation. All rights reserved
B-10
5. Did you ever need to terminate or suspend an IM operation? (circle one)
Yes No
If yes, why?
a) Did you restart / resume the operation? (circle one)
Yes No
Comments:
6. Given the appropriate training, IM during terminal metering is operationallyacceptable. (draw a line on each scale)
Comments:
7. Were there any times when you had an issue with an IM aircraft? (circle one)
Yes No
If yes, what was the issue?
Displays
8. I had the necessary display elements for conducting IM operations. (draw a line onthe scale)
Comments:
9. Did you experience any IM-related display difficulties? (circle one)
Yes No
If yes, explain:

© The MITRE Corporation. All rights reserved
B-11
Communications
10. Did you experience any IM-related communication difficulties? (circle one)
Yes No
If yes, explain:
Overall
11. Did you have any other IM-related difficulties with this particular run? (circle one)
Yes No
If yes, explain:

© The MITRE Corporation. All rights reserved
B-12
12. Using the chart below, how would you rate your acceptability of the operation.
(a) Working from the top left-hand corner, answer each yes / no question and follow the path.(b) Circle the numerical rating that best reflects your experience.

© The MITRE Corporation. All rights reserved
B-13
13. If you have any other comments about this run, please provide them.

© The MITRE Corporation. All rights reserved
B-14
B.5 Pilot Baseline Post-Scenario QuestionnaireIM (DURING TERMINAL METERING) HITL POST BASELINE SCENARIO PILOT QUESTIONNAIRE
Instructions: Please answer the questions by drawing a line through the option on each of thescales at the point which matched your experience or circling an option (e.g., yes / no).Consider only the current scenario when answering. If you have any questions, please ask theexperimenter.

© The MITRE Corporation. All rights reserved
B-15
Workload
1. Using the chart below, how would you rate your average level of workload?
(a) Working up from the bottom left corner, answer each yes/no question and follow thepath.
(b) Circle the numerical rating that best reflects your experience.

© The MITRE Corporation. All rights reserved
B-16
Operations
2. Overall, I found this run acceptable.
3. Were there any times when you had an issue flying the approach and arrival? (circleone)
Yes No
If yes, what was the issue?
Displays
4. Did you experience any display difficulties? (circle one)
Yes No
If yes, explain:
Communications
5. Did you experience any communication difficulties? (circle one)
Yes No
If yes, explain:
Overall
6. Did you have any other difficulties with this run? (circle one)
Yes No
If yes, explain:
7. If you have any other comments about this run, please provide them.

© The MITRE Corporation. All rights reserved
B-17
B.7 Pilot IM Post-Scenario QuestionnaireIM (DURING TERMINAL METERING HITL) POST IM SCENARIO PILOT QUESTIONNAIRE
Instructions: Please answer the questions by drawing a line through the option on each of thescales at the point which matched your experience or circling an option (e.g., yes / no). Whenchoosing an option, keep in mind that IM is the area of interest (e.g., not a traffic displayalone). Consider only the current scenario when answering. If you have any questions, pleaseask the experimenter.

© The MITRE Corporation. All rights reserved
B-18
Workload
1. Using the chart below, how would you rate your average level of workload?
(a) Working up from the bottom left corner, answer each yes/no question and follow thepath.
(b) Circle the numerical rating that best reflects your experience.

© The MITRE Corporation. All rights reserved
B-19
Operations
2. I could detect whether I would remain within tolerances to achieve and maintain theassigned spacing goal. (draw a line on the scale)
Comments:
3. Did you ever consider reporting “unable interval spacing” and not do so? (circle one)
Yes No
If yes, why? Describe.
4. Did you ever report “unable interval spacing”? (circle one)
Yes No
If yes, why?
5. Given the appropriate training, IM is operationally acceptable. (draw a line on thescale)
Comments:
6. Were there any times when you had an issue conducting IM? (circle one)
Yes No
If yes, what was the issue?

© The MITRE Corporation. All rights reserved
B-20
Displays
7. I had the necessary display elements for conducting IM. (draw a line on the scale)
Comments:
8. Did you experience any IM-related display difficulties? (circle one)
Yes No
If yes, explain:
Communications
9. Did you experience any IM-related communication difficulties? (circle one)
Yes No
If yes, explain:
Overall
10. Did you have any other IM-related difficulties with this particular run? (circle one)
Yes No
If yes, explain:
11. If you have any other comments about this run, please provide them.

© The MITRE Corporation. All rights reserved
C-1
Appendix C Post-Simulation Questionnaires
C.1 Controller Post-Simulation QuestionnaireIM DURING TERMINAL METERING HITL POST EVALUATION ATC QUESTIONNAIRE
Instructions: Please answer the questions by drawing a line through the option on each of thescales at the point which matched your experience or circling an option (e.g., yes / no). Whenchoosing an option, keep in mind that the integration of IM into terminal metering is the areaof interest (not terminal metering alone). Unless otherwise indicated, consider all scenarioswhen answering. If you have any questions, please ask the experimenter.

© The MITRE Corporation. All rights reserved
C-2
Operational Integration
1. Rank the operations from most challenging to least challenging aspect of the simulationenvironment.
Enter “terminal metering,” “RNP RF turn operations,” and “Interval Management” in thecells below. Each operation should appear only once.
Most challenging
Least challenging
Comments:
a. Did one operation make another more challenging? (circle one)
Yes No
If yes, describe:
2. Provide any comments on or concerns about terminal metering or RNP RF turns(independent of IM) below. (The remainder of the questionnaire is related to IMintegration into that terminal metering environment with RNP RF turns).
Terminal metering:
RNP RF turns:
IM Operations
3. IM is operationally desirable. (draw a line on the scale)
Comments:

© The MITRE Corporation. All rights reserved
C-3
4. IM is compatible with terminal metering operations. (draw a line on the scale)
Comments:
5. Given the appropriate training, IM during terminal metering is operationally acceptable.(draw a line on each scale)
Comments:
6. I was confident that the spacing of the aircraft would remain outside my separationrequirement. (draw a line on each scale)
IM Aircraft:
Non-IM Aircraft:
Comments:
7. It was acceptable to receive aircraft already performing IM from the feeder controller.(draw a line on the scale)
Comments:
8. It was acceptable to receive aircraft already performing IM from the center. (draw a lineon the scale)
Comments:

© The MITRE Corporation. All rights reserved
C-4
9. It was clear that the speed changes made by the aircraft were driving towards the goalof appropriate spacing. (draw a line on the scale)
IM Aircraft:
Non-IM Aircraft:
Comments:
10. The spacing achieved by the aircraft was acceptable. (draw a line on each scale)
IM Aircraft:
Non-IM Aircraft:
Comments:
11. I was able to detect when spacing / separation issues were developing for aircraft. (drawa line on each scale)
IM Aircraft:
Non-IM Aircraft:
Comments:
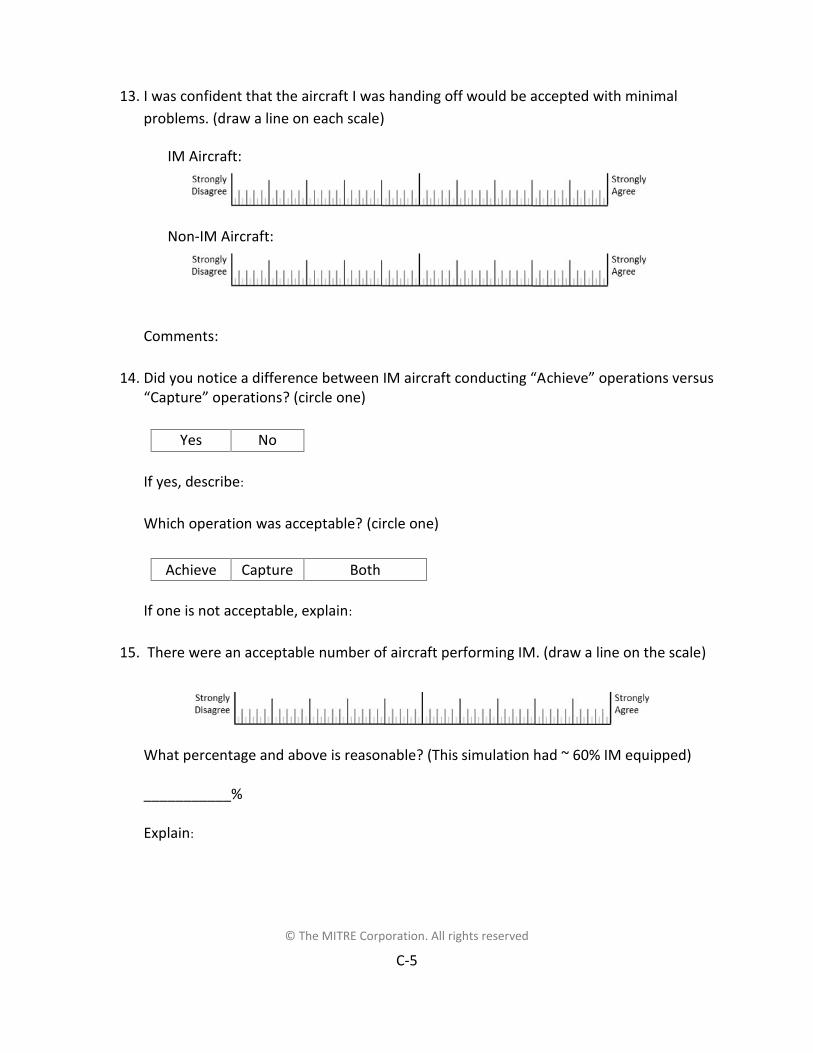
© The MITRE Corporation. All rights reserved
C-5
13. I was confident that the aircraft I was handing off would be accepted with minimalproblems. (draw a line on each scale)
IM Aircraft:
Non-IM Aircraft:
Comments:
14. Did you notice a difference between IM aircraft conducting “Achieve” operations versus“Capture” operations? (circle one)
Yes No
If yes, describe:
Which operation was acceptable? (circle one)
Achieve Capture Both
If one is not acceptable, explain:
15. There were an acceptable number of aircraft performing IM. (draw a line on the scale)
What percentage and above is reasonable? (This simulation had ~ 60% IM equipped)
___________%
Explain:

© The MITRE Corporation. All rights reserved
C-6
16. My roles and responsibilities were clear. (draw a line on the scale)
IM Aircraft:
Non-IM Aircraft:
Comments:
17. My overall workload was acceptable. (draw a line on the scale)
Comments:
18. My level of traffic awareness was acceptable. (draw a line on each scale)
IM Aircraft:
Non-IM Aircraft:
Comments:
19. How did aircraft conducting IM during terminal metering effect your need to monitortraffic? (circle one per row)
IMaircraft
GreatlyIncreases
Increases SomewhatIncreases
NoEffect
SomewhatReduces
Reduces GreatlyReduces
--------------Non-IMaircraft
GreatlyIncreases
Increases SomewhatIncreases
NoEffect
SomewhatReduces
Reduces GreatlyReduces
Comments:

© The MITRE Corporation. All rights reserved
C-7
20. The necessary aircraft monitoring was acceptable. (draw a line on each scale)
IM Aircraft:
Non-IM Aircraft:
Comments:
Communications
21. The IM clearance instruction was acceptable. (draw a line on each scale)
Achieve:
Capture:
Comments:
22. Did any of the IM clearance elements cause you any difficulties? (circle one)
Yes No
If yes, which elements? (circle all that apply):
1. Trail aircraft identification2. Clearance type3. Assigned spacing goal4. Achieve-by point5. Lead aircraft identification6. Lead aircraft route
Describe any difficulties:

© The MITRE Corporation. All rights reserved
C-8
23. Did you have any issues during communications when the lead aircraft call sign wasused? (circle one)
Yes No
If yes, describe:
24. Use of the lead aircraft call sign in the IM clearance is operationally acceptable. (draw aline on the scale)
Comments:
Display
25. The terminal metering elements were helpful for the IM and non-IM aircraft. (draw aline on each scale)
Z
AWE652090 B738/W180 A26
21220
Slot Marker
Slot MarkerSpeed
Aircraft IAS
SpeedAdvisory
RNP-CapableIndicator
0PHX26
AWE652AWE652
CTAS ETA CTAS STA
DAL1921
SWA2053
SWA1011
AWE209
SWA1825
AWE24
DAL1921
SWA2053SWA1011
AWE209AWE221
SWA1825
AWE273
AWE24
AWE251SWA2197
30
35
SWAPT PHX26 Timeline
SWA2053085 B738L 0:50 A26
Z
12
RunwayAssignment
SequenceNumber
10
21
210
Early/LateIndicator

© The MITRE Corporation. All rights reserved
C-9
(Non-Blue) Slot Markers – IM Aircraft
(Non-Blue) Slot Markers – Non-IM Aircraft
Speed Advisories - IM Aircraft
Speed Advisories - Non-IM Aircraft
Early / Late indicator - IM Aircraft
Early / Late indicator - Non-IM Aircraft
Slot Marker Speeds - IM Aircraft
Slot Marker Speeds - Non-IM Aircraft

© The MITRE Corporation. All rights reserved
C-10
Aircraft Indicated Airspeed - IM Aircraft
Aircraft Indicated Airspeed - Non-IM Aircraft
Runway Sequence Number - IM Aircraft
Runway Sequence Number - Non-IM Aircraft
Runway assignment - IM Aircraft
Runway assignment - Non-IM Aircraft
Timeline - IM Aircraft
Timeline - Non-IM Aircraft
Comments:

© The MITRE Corporation. All rights reserved
C-11
26. The IM elements were helpful for IM operations / aircraft. (draw a line on each scale)
Trail aircraft status (i.e., T(E) – Eligible, T(A) – Active, T(S) – Suspended)
Lead aircraft status (i.e., L(A) – Active, L(S) – Suspended)
Blue slot marker (to differentiate between IM aircraft from non-IM aircraft)
Comments:
Z
21
220
2DAL45621T-(A) A26L-(A)
P
Trail AircraftStatus
Lead AircraftStatus

© The MITRE Corporation. All rights reserved
C-12
27. The information in the IM window was helpful for IM operations / aircraft. (draw a lineon each scale)
IM status information (i.e., Eligible, Active, Suspended, Terminated)
Projected spacing / ETA differential [i.e., (87)] alongside the spacing goal
Comments:
28. The position of IM aircraft relative to the slot markers was logical. (draw a line on thescale)
Comments:
29. The behavior of IM aircraft relative to the slot markers was acceptable. (draw a line onthe scale)
Comments:
30. It was helpful to be informed and alerted to when IM was predicted to have no speedsolution. (draw a line on the scale)
Comments:
TrailAircraft
ClearanceType
SpacingGoal
LeadAircraft(sector)
ABP Lead AircraftRoute
Status
SWA1825 Achieve 85 AWE209 DERVL EAGUL6 Eligible
SWA1011 Capture 93 (99) SWA2053 Active
© The MITRE Corporation. All rights reserved
C-13
Overall31. What was the most difficult situation to deal with when aircraft were conducting IM
during terminal metering operations?
32. What was the easiest situation to deal with when aircraft were conducting IM duringterminal metering operations?
33. How could the conduct of IM during terminal metering operations be improved?
Evaluation34. The training I received was adequate. (draw a line on each scale)
IM operations:
Terminal metering operations:
Comments:
35. The overall activity was effective as a context for evaluating IM during terminal meteringoperations. (draw a line on the scale)
Comments:
36. Was there anything about the event that artificially affected using it as a context forevaluating IM during terminal metering operations? (circle one)
Yes No Don’t Know
If yes, explain:

© The MITRE Corporation. All rights reserved
C-14
C.3 Pilot Post-Simulation QuestionnaireIM (DURING TERMINAL METERING) HITL POST EVALUATION PILOT QUESTIONNAIRE
Instructions: Please answer the questions by drawing a line through the option on each of thescales at the point which matched your experience or circling an option (e.g., yes / no). Whenchoosing an option, keep in mind that IM is the area of interest (e.g., not a traffic displayalone). Unless otherwise indicated, consider all scenarios when answering. If you have anyquestions, please ask the experimenter.
Operations
1. I received an acceptable number of IM speeds. (draw a line on the scale)
Comments:
2. I trusted that the algorithm was providing me the appropriate IM speeds to achieve andmaintain my assigned spacing goal. (draw a line on the scale)
Comments:
3. It was clear that the IM speeds were driving towards the goal of appropriate spacing.(draw a line on the scale)
Comments:

© The MITRE Corporation. All rights reserved
C-15
4. The spacing I achieved / maintained when conducting IM was acceptable. (draw a lineon the scale)
Comments:
5. I was able to detect whether I would remain within tolerances to achieve and maintainthe assigned spacing goal. (draw a line on the scale)
Comments:
6. Did you ever try to “out-guess” the IM algorithm and the IM speeds? (circle one)
Yes No
Describe:
7. Did you choose not to fly an IM speed? (circle one)
Yes No
If yes, describe the situation(s) and why:
8. Normal termination (e.g., termination at the FAF upon completion of IM) procedureswere clear. (draw a line on the scale)
Comments:
9. Abnormal termination (e.g., termination prior to the FAF due to a spacing issue)procedures were clear. (if applicable) (draw a line on the scale)
Comments:

© The MITRE Corporation. All rights reserved
C-16
10. Suspend procedures were clear. (if applicable) (draw a line on the scale)
Comments:
11. Resume procedures were clear. (if applicable) (draw a line on the scale)
Comments:
12. Did you notice a difference between “Achieve” operations versus “Maintain”operations? (circle one)
Yes No
Comments:
Which operation was acceptable? (circle one)
Achieve Maintain Both
If one is not acceptable, explain:
13. My roles and responsibilities related to IM operations were clear. (draw a line on thescale)
Comments:
14. My overall workload was acceptable. (draw a line on the scale)
Comments:

© The MITRE Corporation. All rights reserved
C-17
15. My level of traffic awareness was acceptable. (draw a line on each scale)
Lead aircraft for IM:
Aircraft other than the lead aircraft:
Comments:
16. IM is operationally desirable. (draw a line on the scale)
Comments:
17. Given the appropriate training, IM is operationally acceptable. (draw a line on the scale)
Comments:
Communications
18. The amount of information communicated by ATC in the IM clearance was acceptable.(draw a line on the scale)
Comments:

© The MITRE Corporation. All rights reserved
C-18
19. Did any of the IM clearance elements cause you any difficulties? (circle one)
Yes No
If yes, which elements? (circle all that apply):
1. Clearance type (i.e., “Achieve”)2. Assigned spacing goal3. Achieve-by point4. Lead aircraft identification5. Lead aircraft route
Describe any difficulties
20. Did you have any issues during communications when the lead aircraft identificationwas used? (circle one)
Yes No
If yes, describe:
21. With additional experience and practice, use of the lead aircraft identification would beoperationally acceptable. (draw a line on the scale)
Comments:

© The MITRE Corporation. All rights reserved
C-19
Display
22. The CDTI and AGD displays are acceptable for the following stages (draw a line on eachscale)
Clearance Entry:
Entry evaluation / cross-flight deck coordination:
Execution / IM conduct (without the graphical progress indicator on the AGD andairspeed tape on CDTI):
Execution / IM conduct (with the graphical progress indicator on the AGDandairspeed tape on CDTI):
Suspension (if applicable):
Resumption (if applicable):
Termination (if applicable):
Comments:

© The MITRE Corporation. All rights reserved
C-20
23. The necessary information was available from the ATC clearance to detect and selectthe lead aircraft (draw a line on the scale)
Comments:
24. I was able to perform IM by primarily focusing on the AGD information whileoccasionally referencing the CDTI. (draw a line on the scale)
Comments:
25. Considering total time on the IM displays, estimate the total percentage of time usingeach display (total should equal 100). (enter a value for each display)
Display Percentage Use
AGD-----------------
CDTI-----------------
Total 100%
Comments:

© The MITRE Corporation. All rights reserved
C-21
26. I was able to detect when spacing issues were developing during IM operations. (draw aline on each scale)
With only the ASG and SI numeric information on the AGD
With the ASG and SI numeric information & graphical progress indicator on the AGD
Comments:
27. The graphical progress indicator on the AGD is useful for IM. (draw a line on the scale)
Comments:
28. The graphical progress indicator on the AGD is a minimum requirement for IM. (draw aline on the scale)
Comments:
29. The graphical progress indicator is unnecessary. The numeric ASG (Assigned SpacingGoal) and numeric SI (Spacing Interval) are sufficient information to determine whetherthe assigned spacing goal will be achieved and maintained. (draw a line on the scale)
Comments:

© The MITRE Corporation. All rights reserved
C-22
30. The speed tape on the CDTI is useful for IM. (draw a line on the scale)
Comments:
31. The speed tape on the CDTI is a minimum requirement for IM. (draw a line on the scale)
Comments:
32. The IM speed change advisory (e.g., box around IM Speed on AGD) was sufficient todetect the presence of a new IM speed. (draw a line on the scale)
Comments:
33. The IM speed conformance monitoring alert (e.g., visual and aural alert when the IMspeed was not being flown) is useful for IM. (draw a line on the scale)
Comments:

© The MITRE Corporation. All rights reserved
C-23
34. The IM speed conformance monitoring alert (e.g., visual and aural alert when the IMspeed was not being flown) is a minimum requirement for IM. (draw a line on the scale)
Comments:
35. Did the combination of both the AGD and CDTI implementations include all theinformation necessary for you to conduct IM? (circle one for each)
Without the graphical progress indicator on the AGD and airspeed tape on CDTIYes No
With the graphical progress indicator on the AGD and airspeed tape on CDTIYes No
If no, describe any instances where you would have liked more information, and theform in which the additional information would have been most useful.
36. Did you find any elements on the displays to be confusing or misleading? (circle one perrow)
AGD Yes No-----------------
CDTI Yes No
If yes, describe:
37. Did you have any issues with the two separate displays? (circle one)
Yes No
If yes, describe:

© The MITRE Corporation. All rights reserved
C-24
38. I could integrate the displays into my normal instrument scan. (draw a line on eachscale)
AGD:
CDTI:
Comments:
39. The necessary scan time was acceptable. (draw a line on the scale)
Comments:
40. My level of head down time was acceptable. (draw a line on the scale)
Comments:
41. I would be willing to perform IM with the CDTI and AGD I used today (ignore simulationissues if any existed, e.g., readability of text on the displays). (draw a line on each scale)
Without the graphical progress indicator on the AGD and airspeed tape on CDTI
With graphical progress indicator on the AGD and airspeed tape on CDTI
Comments:

© The MITRE Corporation. All rights reserved
C-25
Overall
42. What was the most difficult situation to deal with when conducting IM?
43. What was the easiest situation to deal with when conducting IM?
44. How could IM be improved?
Evaluation
45. The training I received was adequate. (draw a line on the scale)
Comments:
46. The overall activity was effective as a context for evaluating IM. (draw a line on thescale)
Comments:
47. Was there anything about the event that artificially affected using it as a context forevaluating IM? (circle one)
Yes No Don’t Know
If yes, explain:

© The MITRE Corporation. All rights reserved
D-1
Appendix D Descriptions of Objective Measures
This section provides descriptions and, where appropriate, details on each of the objectivemeasures.
D.1 IM Operations Conduct IM initiation delay by the controller
o Definition: Difference in time between when the IM clearance was presented to thecontroller and it was accepted by controller action
IM initiation point
o Definition: Position where IM started as defined by controller acceptance action
Frequency of IM initiations by the controller
o Definition: Number of times the controller initiated IM after an IM operation waspresented
Frequency of IM rejections by the controller
o Definition: Number of times the controller refused an IM clearance after it waspresented
Frequency and location of IM suspensions by the controller
o Definition: Location and number of times the controller took action to make IMtemporarily inactive
Frequency and location of IM terminations by the controller, as well as flight crewreports of “unable IM”
o Definition: Location and number of times IM is made inactive
Frequency of flight crew reports of unable IM
o Definition: Number of times participants reported being unable to conduct IM
D.2 IM Speeds and Flight Crew Actions Frequency of IM speed changes
o Definition: Number of times a new IM speed is presented
Magnitude of IM speed change relative to previous IM speed
o Definition: Degree of change between IM speeds

© The MITRE Corporation. All rights reserved
D-2
Frequency of IM speed reversals
o Definition: This occurs when a previous IM speed change was an increase that isthen followed by an IM speed decrease (or vice versa). Table D-1 provides examplesof situations that are and are not considered reversals.
Table D-1. Speed Reversal Determination Methodology
IM speed(current -2)
IM speed(current -1)
IM speed(current) Reversal?
180 Increase to 190 Increase to 200 No
180 Increase to 190 Decrease to 180 Yes
200 Decrease to 190 Increase to 200 Yes
200 Decrease to 190 Decrease to 180 No
Frequency of IM speed increases
o Definition: This occurs when the previous IM speed was lower than a new IM speed
Time between IM speed changes and distance to go
o Definition: How often IM speeds changed relative to how close the aircraft was fromthe runway
Frequency of flight crew compliance with IM speeds
o Definition: Measure of whether the flight crew dialed the IM speed into the MCPwindow
o Note: While ideally compliance would be zero difference between the MCP speedand the IM speed, the simulation MCP implementation sometimes made it difficultto match the number exactly. Therefore, setting the MCP speed to +/- 2 knots of theIM speed was considered compliance in this simulation
Frequency of IM Speed Conformance Monitoring Advisories
o Definition: The number of times the equipment determined that the IM speed wasnot being conformed with and displayed an advisory to the flight crew

© The MITRE Corporation. All rights reserved
D-3
D.3 Aircraft Spacing and Separation Schedule conformance at various points (e.g., TRACON entry, constraint points)
o Definition: Difference between the aircraft’s STA and ATA
o Note: This measure is an indication of whether aircraft were on schedule (but doesnot directly indicate whether aircraft were in their slot markers or how theirschedule conformance relates to the aircraft ahead or behind)
Absolute slot marker deviation
o Definition: Difference between aircraft position and the center of the slot marker
o Note: This measure is more operational than the schedule conformance measureand provides information about whether an aircraft was in the slot marker, and ifnot, how far outside. It does not indicate how its slot marker position relates to theaircraft ahead or behind.
o Note: The on-going measures in the controller airspace were determined by voicefrequency changes (e.g., feeder airspace was bounded by checking in on the feeder’sfrequency and then checking in on the final’s frequency)
o Note: See Figure D-1 for slot marker deviation examples
Aircraft time in slot markers
o Definition: The amount of time aircraft were inside the slot markers
o Note: Slot markers had a radius of 15 seconds in the feeder controller’s airspace and5 seconds in the final controller’s airspace
Relative slot marker deviation
o Definition: Difference between trail aircraft position and the center of the slotmarker and the lead aircraft position and the center of the slot marker
o Note: This measure is more operational than the schedule conformance measureand provides relative spacing information. For example, if a lead is outside its slotmarker, this measure will show if the trail aircraft is outside its slot marker in thesame or opposite direction. When aircraft are performing IM, the expected behaviorat the ABP would be that the trail IM aircraft is outside its slot marker in the samedirection and magnitude as the lead aircraft.
o Note: This was measured when the lead (instead of the trail) crossed the points toavoid any issues (e.g., lead landed) inside the FAF.
o Note: See Figure D-1 for relative slot marker deviation examples

© The MITRE Corporation. All rights reserved
D-4
Figure D-1. Slot Marker Deviation
Relative Slot Marker Deviation
Trial position same0 relative error
Trail ahead an equal amount0 relative error
Trail behind slot markerPositive relative spacing error
Lead in center of the slot marker Lead ahead of the center of the slot marker Lead behind the center of the slot marker
Trail ahead of slot markerNegative relative spacing error
Trail behind a different amountPositive relative spacing error
Trail behind an equal amount0 relative error
Trail ahead a different amountPositive relative spacing error
Trail ahead a different amountNegative relative spacing error
Trail not aheadPositive relative spacing error
Trail not behindNegative relative spacing error
Trail behind a different amountNegative relative spacing error

© The MITRE Corporation. All rights reserved
D-5
Spacing error
o Definition: Error in meeting the ASG (for trail IM aircraft) or the TBFM interval (fornon-IM aircraft)
o Note: This measure indicates how well a pair did relative to the planned intervalbetween aircraft, even if off the original schedule (slots irrelevant). This is a relativemeasure. For trail IM aircraft, it is a measure of how well the ASG was met. For non-IM aircraft, it is a measure of how well aircraft met the TBFM-planned interval.
o Note:
For the IM aircraft: (ATAtrail at the ABP- ATAlead at the ABP) – ASG
For non-IM aircraft: (ATAtrail at the ABP- ATAlead at the fix) - (STAtrail at the ABP -STAlead at the fix)
How well the ASG was maintained
o Definition: Difference between ASG and current spacing of the trail IM aircraft fromthe lead aircraft
Note: For capture operations, started measure once trail IM aircraft got within10 seconds
Frequency and location where aircraft pair’s spacing was below the separation standard
o Definition: Location and number of times spacing between an aircraft pair wasbelow the applicable separation standard for the aircraft pairing and location
Arrival rates / throughput (AAR – number of aircraft per hour)
o Definition: Number of aircraft landing (AAR – number of aircraft per hour)
Time aircraft remained on the RNAV arrival procedure
o Definition: Amount of time aircraft remained on their route
o Note: Indication of whether a spacing operation was working well enough to avoidaircraft being vectored off their optimized route
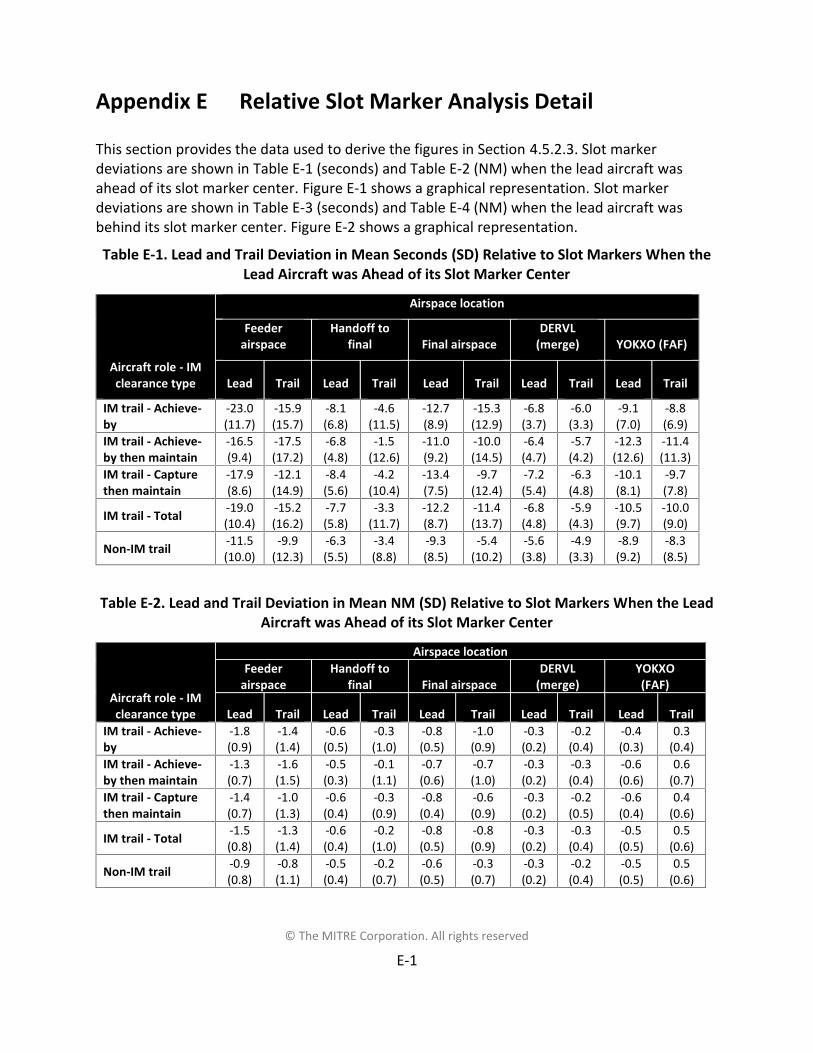
© The MITRE Corporation. All rights reserved
E-1
Appendix E Relative Slot Marker Analysis Detail
This section provides the data used to derive the figures in Section 4.5.2.3. Slot markerdeviations are shown in Table E-1 (seconds) and Table E-2 (NM) when the lead aircraft wasahead of its slot marker center. Figure E-1 shows a graphical representation. Slot markerdeviations are shown in Table E-3 (seconds) and Table E-4 (NM) when the lead aircraft wasbehind its slot marker center. Figure E-2 shows a graphical representation.
Table E-1. Lead and Trail Deviation in Mean Seconds (SD) Relative to Slot Markers When theLead Aircraft was Ahead of its Slot Marker Center
Aircraft role - IMclearance type
Airspace location
Feederairspace
Handoff tofinal Final airspace
DERVL(merge) YOKXO (FAF)
Lead Trail Lead Trail Lead Trail Lead Trail Lead Trail
IM trail - Achieve-by
-23.0(11.7)
-15.9(15.7)
-8.1(6.8)
-4.6(11.5)
-12.7(8.9)
-15.3(12.9)
-6.8(3.7)
-6.0(3.3)
-9.1(7.0)
-8.8(6.9)
IM trail - Achieve-by then maintain
-16.5(9.4)
-17.5(17.2)
-6.8(4.8)
-1.5(12.6)
-11.0(9.2)
-10.0(14.5)
-6.4(4.7)
-5.7(4.2)
-12.3(12.6)
-11.4(11.3)
IM trail - Capturethen maintain
-17.9(8.6)
-12.1(14.9)
-8.4(5.6)
-4.2(10.4)
-13.4(7.5)
-9.7(12.4)
-7.2(5.4)
-6.3(4.8)
-10.1(8.1)
-9.7(7.8)
IM trail - Total -19.0(10.4)
-15.2(16.2)
-7.7(5.8)
-3.3(11.7)
-12.2(8.7)
-11.4(13.7)
-6.8(4.8)
-5.9(4.3)
-10.5(9.7)
-10.0(9.0)
Non-IM trail -11.5(10.0)
-9.9(12.3)
-6.3(5.5)
-3.4(8.8)
-9.3(8.5)
-5.4(10.2)
-5.6(3.8)
-4.9(3.3)
-8.9(9.2)
-8.3(8.5)
Table E-2. Lead and Trail Deviation in Mean NM (SD) Relative to Slot Markers When the LeadAircraft was Ahead of its Slot Marker Center
Aircraft role - IMclearance type
Airspace locationFeeder
airspaceHandoff to
final Final airspaceDERVL
(merge)YOKXO(FAF)
Lead Trail Lead Trail Lead Trail Lead Trail Lead TrailIM trail - Achieve-by
-1.8(0.9)
-1.4(1.4)
-0.6(0.5)
-0.3(1.0)
-0.8(0.5)
-1.0(0.9)
-0.3(0.2)
-0.2(0.4)
-0.4(0.3)
0.3(0.4)
IM trail - Achieve-by then maintain
-1.3(0.7)
-1.6(1.5)
-0.5(0.3)
-0.1(1.1)
-0.7(0.6)
-0.7(1.0)
-0.3(0.2)
-0.3(0.4)
-0.6(0.6)
0.6(0.7)
IM trail - Capturethen maintain
-1.4(0.7)
-1.0(1.3)
-0.6(0.4)
-0.3(0.9)
-0.8(0.4)
-0.6(0.9)
-0.3(0.2)
-0.2(0.5)
-0.6(0.4)
0.4(0.6)
IM trail - Total -1.5(0.8)
-1.3(1.4)
-0.6(0.4)
-0.2(1.0)
-0.8(0.5)
-0.8(0.9)
-0.3(0.2)
-0.3(0.4)
-0.5(0.5)
0.5(0.6)
Non-IM trail -0.9(0.8)
-0.8(1.1)
-0.5(0.4)
-0.2(0.7)
-0.6(0.5)
-0.3(0.7)
-0.3(0.2)
-0.2(0.4)
-0.5(0.5)
0.5(0.6)

© The MITRE Corporation. All rights reserved
E-2
Figure E-1. Relative Slot Marker Deviation at Various Airspace Locations When Lead Aircraftwas Ahead of its Slot Marker Center
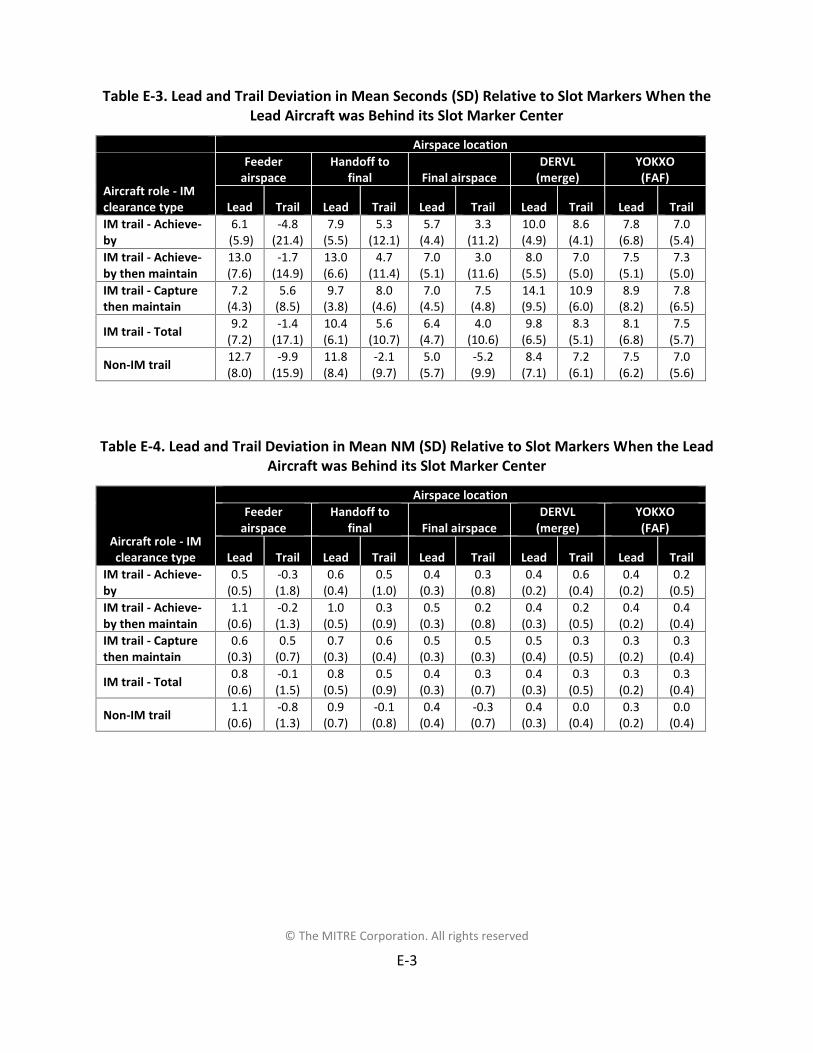
© The MITRE Corporation. All rights reserved
E-3
Table E-3. Lead and Trail Deviation in Mean Seconds (SD) Relative to Slot Markers When theLead Aircraft was Behind its Slot Marker Center
Airspace location
Aircraft role - IMclearance type
Feederairspace
Handoff tofinal Final airspace
DERVL(merge)
YOKXO(FAF)
Lead Trail Lead Trail Lead Trail Lead Trail Lead TrailIM trail - Achieve-by
6.1(5.9)
-4.8(21.4)
7.9(5.5)
5.3(12.1)
5.7(4.4)
3.3(11.2)
10.0(4.9)
8.6(4.1)
7.8(6.8)
7.0(5.4)
IM trail - Achieve-by then maintain
13.0(7.6)
-1.7(14.9)
13.0(6.6)
4.7(11.4)
7.0(5.1)
3.0(11.6)
8.0(5.5)
7.0(5.0)
7.5(5.1)
7.3(5.0)
IM trail - Capturethen maintain
7.2(4.3)
5.6(8.5)
9.7(3.8)
8.0(4.6)
7.0(4.5)
7.5(4.8)
14.1(9.5)
10.9(6.0)
8.9(8.2)
7.8(6.5)
IM trail - Total 9.2(7.2)
-1.4(17.1)
10.4(6.1)
5.6(10.7)
6.4(4.7)
4.0(10.6)
9.8(6.5)
8.3(5.1)
8.1(6.8)
7.5(5.7)
Non-IM trail 12.7(8.0)
-9.9(15.9)
11.8(8.4)
-2.1(9.7)
5.0(5.7)
-5.2(9.9)
8.4(7.1)
7.2(6.1)
7.5(6.2)
7.0(5.6)
Table E-4. Lead and Trail Deviation in Mean NM (SD) Relative to Slot Markers When the LeadAircraft was Behind its Slot Marker Center
Aircraft role - IMclearance type
Airspace locationFeeder
airspaceHandoff to
final Final airspaceDERVL
(merge)YOKXO(FAF)
Lead Trail Lead Trail Lead Trail Lead Trail Lead TrailIM trail - Achieve-by
0.5(0.5)
-0.3(1.8)
0.6(0.4)
0.5(1.0)
0.4(0.3)
0.3(0.8)
0.4(0.2)
0.6(0.4)
0.4(0.2)
0.2(0.5)
IM trail - Achieve-by then maintain
1.1(0.6)
-0.2(1.3)
1.0(0.5)
0.3(0.9)
0.5(0.3)
0.2(0.8)
0.4(0.3)
0.2(0.5)
0.4(0.2)
0.4(0.4)
IM trail - Capturethen maintain
0.6(0.3)
0.5(0.7)
0.7(0.3)
0.6(0.4)
0.5(0.3)
0.5(0.3)
0.5(0.4)
0.3(0.5)
0.3(0.2)
0.3(0.4)
IM trail - Total 0.8(0.6)
-0.1(1.5)
0.8(0.5)
0.5(0.9)
0.4(0.3)
0.3(0.7)
0.4(0.3)
0.3(0.5)
0.3(0.2)
0.3(0.4)
Non-IM trail 1.1(0.6)
-0.8(1.3)
0.9(0.7)
-0.1(0.8)
0.4(0.4)
-0.3(0.7)
0.4(0.3)
0.0(0.4)
0.3(0.2)
0.0(0.4)

© The MITRE Corporation. All rights reserved
E-4
Figure E-2. Relative Slot Marker Deviation at Various Airspace Locations When Lead Aircraftwas Behind its Slot Marker Center

© The MITRE Corporation. All rights reserved
F-1
Appendix F Acronyms and Abbreviations
Acronym DefinitionA80 Atlanta TRACON
ABP Achieve-By Point
ACSS Aviation Communication & Surveillance Systems
ADS-B Automatic Dependent Surveillance-Broadcast
ADV Advisory
AGD ADS-B Guidance Display
ANOVA Analysis of Variance
ASG Assigned Spacing Goal
ATC Air Traffic Control
ATD Air Traffic management Demonstration
ATP Air Transport Pilot
ATPA Automated Terminal Proximity Alert
CA CMS ATD
CARS Controller Acceptance Rating Scale
CDTI Cockpit Display of Traffic Information
CDU Control and Display Unit
CLT Charlotte TRACON
CMS Controller Managed Spacing
CPC Certified Professional Controller
CPDLC Controller Pilot Data Link Communications
EFB Electronic Flight Bag
EICAS Engine-Indicating and Crew-Alerting System
ETA Estimated Time of Arrival
F11 Orlando TRACON
FAA Federal Aviation Administration
FAF Final Approach Fix
FIAT Fully Integrated ATD-1 Test
© The MITRE Corporation. All rights reserved
F-2
Acronym DefinitionFIM Flight deck-based Interval Management
FMS Flight Management System
FO First Officer
HITL Human-in-the-loop
IDEA Integration, Demonstration, and Experimentation for Aeronautics
IFPI Intended Flight Path Information
GIM-S Ground-based Interval Management-Spacing
IAS Indicated Air Speed
IAT Inter-Arrival Time
IM Interval Management
IMAC Interval Management Alternative Clearances
IMPAT IM Performance Analysis Team
KATL Hartsfield–Jackson Atlanta International Airport
KORD O'Hare International Airport
KPHX Phoenix International Airport
KSFO San Francisco International Airport
kt knot
LED Light-Emitting Diode
M Mean
MANOVA Multivariate Analysis of Variance
MCDU Multifunction Control and Display Unit
MCP Mode Control Panel
MIA Miami TRACON
MOPS Minimum Operational Performance Standards
MSI Measured Spacing Interval
MTE Meet Time Error
NAS National Airspace System
NASA National Aeronautics and Space Administration
ND Navigation Display

© The MITRE Corporation. All rights reserved
F-3
Acronym DefinitionNM Nautical Miles
OIA Operational Integration Assessment
PBN Performance Based Navigation
PCT Potomac TRACON
PF Pilot Flying
PFD Primary Flight Display
PHL Philadelphia TRACON
PM Pilot Monitoring
PSI Predicted Spacing Interval
PTP Planned Termination Point
RF Radius-to-Fix
RNAV Area Navigation
RNP Required Navigation Performance
RTA Required Time of Arrival
SCX Sun Country
SD Standard Deviation
SI Spacing Interval
STA Scheduled Time of Arrival
STAR Standard Terminal Arrival Route
STARS Standard Terminal Automation Replacement System
TBFM Time Based Flow Management
TBO Trajectory Based Operations
TOAC Time of Arrival Control
TPA Tampa TRACON
TRACON Terminal Radar Approach Control
TSAS Terminal Sequencing and Spacing
TSS Terminal Sequencing and Spacing
TTG Time-To-Go

DisclaimerThe contents of this material reflect the views of the author and/or the Director of the Centerfor Advanced Aviation System Development (CAASD), and do not necessarily reflect the viewsof the Federal Aviation Administration (FAA) or the Department of Transportation (DOT).Neither the FAA nor the DOT makes any warranty or guarantee, or promise, expressed orimplied, concerning the content or accuracy of the views expressed herein.
This is the copyright work of The MITRE Corporation and was produced for the U.S.Government under Contract Number DTFAWA-10-C-00080 and is subject to Federal AviationAdministration Acquisition Management System Clause 3.5-13, Rights in Data-General, Alt. IIIand Alt. IV (Oct. 1996). No other use other than that granted to the U.S. Government, or tothose acting on behalf of the U.S. Government, under that Clause is authorized without theexpress written permission of The MITRE Corporation. For further information, please contactThe MITRE Corporation, Contract Office, 7515 Colshire Drive, McLean, VA 22102 (703) 983-6000.
©2018 The MITRE Corporation. MITRE acknowledges that this contribution was authored or co-authored by a contractor or affiliate of the Government. As such, the Government retains anonexclusive, royalty-free right to publish or reproduce this document, or to allow others to doso, for “Government Purposes Only.”