Embed Size (px)
Citation preview

1
Pike County Multi-jurisdictional Natural Hazards Mitigation Plan Barry Baylis Detroit El Dara Florence Griggsville
Hull Kinderhook Milton Nebo New Canton New Salem
Pearl Perry Pittsfield Pleasant Hill Time Valley City
November 2010

2
Pike County Multi-jurisdictional Natural Hazards Mitigation Plan
Plan Author: University of Illinois Extension
With Assistance from: Illinois State Water Survey
Contributing Staff
University of Illinois Extension:
Earl Bricker, Program Director, Community Assessment & Development Services
Jennifer Mowen, County Extension Director, Pike County
Stephanie Dehart, Extension Unit Educator, Pike County
Zachary Kennedy, Outreach Associate, Community Assessment & Development Services
Carrie McKillip, Extension Unit Educator, Knox County
James Mortland, Outreach Assistant, Community Assessment & Development Services
Illinois State Water Survey:
Kingsley Allan, GIS Manager
Lisa Graff, HAZUS-MH Projects Lead
Brad McVay, GIS Specialist
November 2010
The preparation of this report was financed through a Hazard Mitigation Grant Program Planning Grant from the Federal Emergency Management Agency and by Pike County.

3
PURPOSE STATEMENT PIKE COUNTY MULTI-JURISDICTIONAL NATURAL HAZARDS
MITIGATION PLAN TASK FORCE
The Pike County Multi-jurisdictional Natural Hazards Mitigation Plan identifies local hazard mitigation goals and objectives, and specific hazard mitigation actions to implement over the long term that will result in reduction in risk and potential for future losses associated with the occurrence of natural hazards. The Task Force worked to reduce the impact of natural hazards on citizens, infrastructure, private property, and critical facilities through a combined effort of communities, institutions, and citizenry to develop a mitigation action plan that will be adopted and implemented by each participating community.
Natural Hazards Being Considered
Drought Earthquake
Extreme Temperature Flood
Flash Flooding Severe Storm / Tornado
Severe Winter Storm
Jurisdictions Participating in NFIP Pike County
Florence Hull
Nebo New Canton
Pearl Pleasant Hill Valley City

4
PIKE COUNTY MULTI-JURISDICTIONAL NATURAL HAZARDS MITIGATION PLAN STEERING COMMITTEE
Barry Melvin Gilbert Shawn Rennecker
Barry Fire Protection District Chris Little
Baylis Raymond Anderson
East Pike Fire Protection District Mike Spann
Florence Pete Robinson
Griggsville Jesse Cawthon
Illini Community Hospital Kathy Willman
Kinderhook Bill Grimsley
Local Media Dan Long
Milton Tom Scranton
Mental Health Centers of Western Illinois Katie Wilson
New Canton Bill Hart
New Salem David Ballinger
Perry Bill Thiele
Pike County 911 Sandy Schacht
Pike County Ambulance Adam Hammitt
Pike County Board Fred Bradshaw Cleve Curry Robert Kenady Jim Sheppard
Pike County ESDA Herman Allensworth David Greenwood
Pike County Farm Bureau Blake Roderick
Pike County Health Department Robin Wainman
Pike County Highway Department Chris Johnson Gary Laux
Nebo Dustin Neese
Pike County Sheriff’s Department Steve Leahr Paul Petty
Pike County Zoning Angela Moss
LEPC Randy Ruble
Pittsfield John Hayden Bruce McKey Tom Reinhart
Pleasant Hill Bill Freesmeyer Robert Jones Wyvetta Menke
Sny Island Levee & Drainage District Mike Reed Brady Borrowman Russell Koeller Dan Lundberg
Spring Creek Fire Department Dustin Neese
Valley City Levee & Drainage District Richard Myers Lane Wiese
Technical Assistance: Illinois Soil & Water Survey Kingsley Allen Lisa Graff Brad McVay
University of Illinois Extension Stephanie Dehart Carrie McKillip Jennifer Mowen

5
TABLE OF CONTENTS SECTION PAGE Introduction
Why a Mitigation Plan? 9 Community Participation in Plan Development 9 Pike County Demographic Overview 10 Selected Data for Participating Jurisdictions 15 Pike County Land Use Development Trends 18 Pike County Major Employers 20
Chapter 1 – Planning Process
How the Plan Was Prepared 21 The Planning Team 21 Public Participation 22 Community Surveys 23 Survey Results 24 Review and Incorporation of Existing Plans, Studies, Reports, and Technical 28 State and Local Capability Assessment 30
Chapter 2 – Risk Assessment
Hazard Vulnerabilities Affecting Pike County 31 Natural Hazards – Probability and Assessing Vulnerability 32 Repetitive Loss Data 34 2007 Illinois Natural Hazard Mitigation Plan Ratings 34 Federal Disaster Declaration History 35 Severe Storms / Hail 36 Tornado 39 Winter Storm 42 Drought 45 Extreme Temperatures 46 Earthquake 48 HAZUS Earthquake Analysis 51 Flood 55 HAZUS Flood Analysis 57 Levees 64
Chapter 3 – Mitigation Strategy
Goals, Objectives, and Mitigation Actions 65 Mitigation Actions – Priorities and Implementation 66 Cost/Benefit Analysis 67 Jurisdictional Project Grid 68
Chapter 4 – Monitoring, Evaluating, Maintenance Strategy 73

6
APPENDICES PAGE A. Jurisdictional Participation
A.1 Initial Letter of Invitation 76 A.2 Sample Participation Resolution 77 A.3 Sample Contact Form 78 A.4 Sample Steering Committee Minutes 79 A.5 Sample Adoption Resolution 80
B. Media
B.1 Press Releases 81 B.2 Newspaper Articles 84
C. Public Participation
C.1 Participation Summary 87 C.2 Community Survey 88 C.3 Issue Groups: Sample Invitation Letter 92 C.4 Issue Groups: Sample Agenda 93 C.5 Issue Groups: Project Grid 94 C.6 Community Meetings: Poster 95 C.7 Community Meetings: Sample Input Form 96
D. Match Log 97
E. Sample Mutual Aid Agreement 98
F. Essential Facilities and Facilities of Local Importance 100
G. Maps of Participating Jurisdictions 107
FIGURE # PAGE 1. Criteria for Participating Communities 9
2. Long-Run Population Trend 10
3. Medium-Run Population Trend 11
4. Estimated Population Under 18 and Over 65 11
5. Population – Racial Make-up 12
6. Population – Hispanic Make-up 12
7. Poverty Status 12
8. Household Types 13
9. Occupancy Rates 14
10. Housing Units 14
11. Year Structure Built 14
12. Land Area and Population – Municipalities 15
13. Estimated Population Under 18 and Over 65 – Municipalities 16
14. Year Structure Built – Municipalities 17

7
FIGURE # PAGE 15. Pike County Map 19
16. Survey Results: Hazard Events Experienced 24
17. Survey Results: Concerned about Hazards 25
18. Survey Results: Prepared for Hazards 26
19. Survey Results: Effective Ways of Receiving Information 27
20. Existing Community Documents 28-29
21. County Vulnerability to Natural Hazards 31-32
22. Natural Hazard Probability 32
23. County Hazard Ratings (assigned by Illinois Natural Hazard Mitigation Plan) 34
24. Vulnerability Levels 34
25. Thunderstorm and High Wind Events in Pike County 37
26. Hail Events in Pike County 37
27. Pattern of Hail Days (map) 38
28. Tornados Causing Injuries or Property Damage 40
29. Tornados Causing Injuries or Property Damage (map) 40
30. Fujita Tornado Scale 41
31. Tornado F-Scale 41
32. Average Snowfall (map) 43
33. Snow and Ice Events in Pike County 44
34. Severity of Precipitation Drought 45
35. Extreme Temperatures in Pike County 47
36. Shaking Hazard Map 48
37. Earthquakes in Illinois (map) 49
38. Illinois Seismic Map 50
39. Earthquake Magnitude vs Modified Mercalli Intensity Scale 51
40. Abbreviated Modified Mercalli Intensity Scale 52
41. Expected Building Damage by Occupancy 53
42. Expected Building Damage by Type 53
43. Building Related Economic Loss 54
44. Essential Facilities List 59
45. Building Exposure by Occupancy Type 59
46. Building Exposure by Occupancy Type for the 1% Annual Chance Scenario 59
47. Expected Building Damage by Occupancy 60
48. Building-Related Economic Loss Estimates 60
49. Total Building Exposure for Sny Protected Area 62
50. Total Building Exposure for McGee Protected Area 62
51. Essential Facilities and Local Importance in Levee Protected Area 63
52. Pike County / Jurisdictional Project Grid 68

8
(THIS PAGE LEFT INTENTIONALLY BLANK.)

9
INTRODUCTION
WHY A MITIGATION PLAN?
Communities look to protect the health, safety, and welfare of their citizens. Related to natural hazard events this has traditionally meant responding to the needs of the community after an event occurs. Mitigation looks to reduce the need for response by permanently removing people and structures from harms way when a known area of impact can be identified (such as a floodplain) or significantly reducing the impact from a known risk (such as a tornado). This Plan provides an assessment of the risks to Pike County from natural hazard events and a comprehensive range of mitigation projects to lessen the impact of these hazards on our communities. With the availability of mitigation grant funding from the Federal Government, communities have the opportunity to implement mitigation projects that would not otherwise be financially possible. The preparation of this plan follows the guidelines to make participating communities eligible to apply for mitigation grant funding.
COMMUNITY PARTICIPATION IN PLAN DEVELOPMENT The criteria that would constitute satisfactory jurisdictional participation in the planning process were established at the first meeting of the Pike County Multi-jurisdictional Natural Hazards Mitigation Plan Task Force. Figure 1 shows the required participation elements established. All participating communities met these requirements.
Figure 1: Participation Guidelines for Jurisdictions
• Attend a minimum of 1 meeting
• Submit a list of relevant community documents
• Confirm hazards that affect the community
• Confirm the list of critical facilities submitted by HAZUS
• Develop goals and projects for the community
• Develop and prioritize mitigation actions for the community
• Host opportunities for public involvement
• Review and comment on draft plan

10
PIKE COUNTY DEMOGRAPHIC OVERVIEW
The following data is presented to provide an overview of Pike County. All data are benchmarked against two near neighbors, Brown and Scott counties, and when appropriate the State of Illinois and the nation.
Population Trends
Long-Run Population Trend
The population in Pike County has decreased every decade since 1900, with the exception of 1930 to 1940 which saw a slight increase. In 1900 the county had a population of 31,595, and by 2000 the county population had shrunk to 17,384 a decrease of 45 percent. In comparison, Pike’s two near neighbors Brown and Scott counties also saw similar decreases in population over this time period (see Figure 2).
Figure 2: Long-Run Population Trends
Source: U.S. Census Bureau Decennial Census 1900-2000
0
0.5
1
1.5
2
2.5
3
3.5
4
1900 1910 1920 1930 1940 1950 1960 1970 1980 1990 2000
Long-Run Population Trends, 1900 index = 1
U.S.
Illinois
Pike
Brown
Scott

11
Medium-Run Population Trend
Population in Pike County declined from 19,374 in 1969 to 16,665 in 2007, a loss of about 14 percent. The population trend over this time period was generally steady slow decline, though the rate of decline has decreased in recent years. Similarly, Pike’s nearest neighbors Brown and Scott counties both also saw shrinking populations over the same time period. The rate and percentage population lost in these neighboring counties was similar to Pike County (see Figure 3). Conversely, both the State of Illinois and the nation grew in population over this time period.
Figure 3: Medium-Run Population Trends
Source: Bureau of Economic Analysis, Regional Economic Information System
Age of the Population
Pike County has an older population than its two near neighbors, the state, and the nation. It is estimated that 21.9 percent of Pike’s population is under the age of 18. This is the lowest percentage amongst all benchmark areas with the exception of Brown County. Conversely, Pike County has the highest percentage of persons over 65 years of age amongst all benchmark areas (see Figure 4).
Figure 4: 2008 Estimated Percentage of Population Under 18 and Over 65
U.S. Illinois Pike Co. Brown Co. Scott Co.
Under 18 24.42% 24.92% 21.19% 15.58% 23.64% Over 65 12.71% 12.16% 19.36% 12.00% 17.46%
Source: Claritas 2008 Estimates
0
0.2
0.4
0.6
0.8
1
1.2
1.4
1.6
Medium Run Population Trends, 1969 Index = 1
US
IL
Pike Co.
Brown Co.
Scott Co.

12
Racial Make-up of the Population
Pike County’s population is predominantly white, and non-Hispanic. Whites comprise an estimated 97.1 percent of the population. Non-Hispanics of any race make up 99.3 percent of the total population. Pike County has a similar racial make-up as Scott County, but is less racially and ethnically diverse, than Brown County (see Figure 5).
Figure 5:2008 Estimated Racial Make-up
U.S. Illinois Pike Co. Brown Co. Scott Co.
White 72.72% 71.39% 97.11% 78.59% 99.36% Black 12.43% 14.76% 1.49% 19.21% 0.04% Other 14.85% 13.85% 1.40% 2.20% 0.60%
Figure 6: 2008 Estimated Hispanic Population
U.S. Illinois Pike Co. Brown Co. Scott Co.
Hispanic or Latino 15.24% 15.13% 0.70% 4.64% 0.24% Not Hispanic or Latino 84.76% 84.87% 99.30% 95.36% 99.76%
Source: Claritas 2008 Estimates
Income
Median Household and Per Capita Income
In 2008, the estimated median household income in Pike County was $38,790. This was lower than both Brown and Scott counties which had median household incomes of $45,742 and $42,965 respectively. The 2008 figures for the State of Illinois and the U.S. were $47,013 and $42,729 respectively. Another recent measure which is furnished by the Bureau of Economic Analysis tracks per capita income and paints a different picture. In 2007 the per capita income in Pike County was $26,788. This was higher than both Brown County at $23,486, and Scott County at $26,504.
Poverty Rate
In 2007, 13.7 percent of Pike County’s population lived below the poverty line. The poverty rate amongst children under 18 was 20.2 percent. Pike County had the second highest overall poverty rate, and the highest rate among children for all benchmark areas (see Figure 7).
Figure 7: 2007 Poverty Status
U.S. Illinois Pike Co. Brown Co. Scott Co.
Population in Poverty 13.0% 11.9% 13.7% 16.1% 10.5% Children in Poverty 18.0% 16.6% 20.2% 15.4% 15.2%
Source: U.S. Census Bureau, Small Area Income & Poverty Estimates

13
Housing and Households
Household Types
Married couple families are the largest household type group in Pike County. While this is also the largest group in all of the benchmark areas, a greater proportion of Pike County households are married couples (see Figure 8).
Figure 8:2008 Estimated Households by Type and Presence of Own Children*
The United States Illinois Pike Co. Brown Co. Scott Co.
Total Households 114,694,201
4,786,787
6,657
1,980
2,177
Single Male Householder 13,067,150 11.39% 553,697 11.57% 737 11.07% 306 15.45% 251 11.53%
Single Female Householder 16,999,226 14.82% 735,190 15.36% 1,156 17.37% 333 16.82% 349 16.03%
Married-Couple Family 60,032,267 52.34% 2,496,554 52.16% 3,900 58.58% 1,089 55.00% 1,269 58.29%
With own children 27,564,656 24.03% 1,189,297 24.85% 1,603 24.08% 445 22.47% 578 26.55% No own children 32,467,611 28.31% 1,307,257 27.31% 2,297 34.51% 644 32.53% 691 31.74%
Male Householder 4,690,889 4.09% 191,940 4.01% 216 3.24% 66 3.33% 79 3.63% With own children 2,358,947 2.06% 87,622 1.83% 126 1.89% 44 2.22% 49 2.25% No own children 2,331,942 2.03% 104,318 2.18% 90 1.35% 22 1.11% 30 1.38%
Female Householder 13,575,547 11.84% 567,244 11.85% 512 7.69% 141 7.12% 182 8.36% With own children 7,988,457 6.97% 318,719 6.66% 299 4.49% 92 4.65% 111 5.10% No own children 5,587,090 4.87% 248,525 5.19% 213 3.20% 49 2.47% 71 3.26%
Nonfamily: Male Householder 3,704,076 3.23% 143,153 2.99% 98 1.47% 35 1.77% 33 1.52%
Nonfamily: Female Householder 2,625,046 2.29% 99,009 2.07% 38 0.57% 10 0.51% 14 0.64%
Source: Claritas 2008 Estimates
*In contrast to Claritas Demographic Estimates, "smoothed" data items are Census 2000 tables made consistent with current year estimated and 5 year projected base counts.

14
Owner Occupancy Rates
Pike County has a high rate of owner occupancy. In 2008, an estimated 77.1 percent of occupied housing units were owner occupied. This owner occupancy rate was higher than all benchmark areas with the exception of Scott County (see Figure 9).
Figure 9: 2008 Owner vs Renter Occupancy Rates
U.S. Illinois Pike Co. Brown Co. Scott Co.
Owner Occupied 67.1% 68.2% 77.1% 73.1% 77.5% Renter Occupied 32.9% 31.8% 22.9% 26.9% 22.6%
Source: Claritas 2008 Estimates
Housing Type
Detached single-family homes are the predominant housing type in Pike County. In 2008, an estimated 79 percent of housing units in Pike County were detached single family homes. Pike County had a higher proportion of detached single family homes than all benchmark areas (see Figure 10).
Figure 10: 2008 Estimated Housing Units by Units in Structure
U.S. Illinois Pike Co. Brown Co. Scott Co.
1 Unit Attached 5.5% 5.1% 1.4% 0.2% 0.4% 1 Unit Detached 60.8% 58.4% 79.0% 77.4% 78.6% 2 Units 4.0% 6.6% 2.7% 1.9% 3.8% 3 to 19 Units 13.1% 16.6% 3.9% 7.7% 3.4% 20 to 49 Units 3.3% 3.9% 0.3% 0.2% 0.0% 50 or More Units 5.2% 6.2% 0.0% 0.0% 0.0% Mobile Home or Trailer 7.9% 3.2% 12.3% 12.7% 13.7% Boat, RV, Van, etc. 0.3% 0.1% 0.5% 0.0% 0.1%
Source: Claritas 2008 Estimates
Age of Structures
The median year that a structure was built in Pike County was 1955. The dominant year that structures in Pike County were built was 1939 or earlier. Pike County’s building stock is older than the U.S. and the state and similar in age to neighboring Brown and Scott counties (see Figure 11).
Figure 11: Median Year and Dominant Year Structures Built
U.S. Illinois Pike Co. Brown Co. Scott Co.
Median Year Built 1975 1966 1955 1950 1958
Dominant Year Built 1970 to 1979
1939 or Earlier
1939 or Earlier
1939 or Earlier
1939 or Earlier
Source: Claritas 2008 Estimates

15
SELECTED DATA FOR PARTICIPATING JURISDICTIONS The following data covers selected demographics for jurisdictions in Pike County which are participating in this mitigation plan.
Land Area and Population
Most of the villages and cities in Pike County lost population between 2000 and 2008 according to Claritas estimates (see Figure 12).
Figure 12: Land Area and Population – Municipalities
Land Area (Sq Miles) 2000 Population* 2008 Population **
Barry city 1.142 1,368 1,333
Baylis village 0.479 265 252
Detroit village 0.239 93 94
El Dara village 0.967 89 88
Florence village 0.203 71 71
Griggsville city 1.035 1,258 1,211
Hull village 1.836 474 431
Kinderhook village 0.884 249 262
Milton village 0.375 274 276
Nebo village 0.423 408 379
New Canton town 0.778 417 403
New Salem village 1.043 136 128
Pearl village 1.507 187 171
Perry village 0.382 437 405
Pittsfield city 3.574 4,211 4,096
Pleasant Hill village 0.763 1,047 978
Time village 0.436 29 28
Valley City village 0.196 14 13
* - 2000 population data is from the U.S. Census Bureau 2000 Decennial Census ** - 2008 population data is from Claritas 2008 estimates

16
Age of the Population
In general the villages and cities in Pike County with greater than 1,000 residents have older populations than the State of Illinois and the U.S. Most of these places have a lower proportion of the population under the age of 18, and a higher proportion of the population over the age of 65 than the state and nation. The villages with less than 1,000 residents vary in their age distributions (see Figure 13).
Figure 13: Estimated Percentage of Population Under 18 and Over 65 – Municipalities
Pct Under 18 Pct Over 65
U.S. 24.42% 12.71% Illinois 24.92% 12.16% Barry city 21.23% 24.23% Baylis village 27.78% 12.30% Detroit village 36.17% 6.38% El Dara village 28.41% 10.23% Florence village 16.90% 23.94% Griggsville city 24.86% 16.18% Hull village 22.51% 14.85% Kinderhook village 21.76% 11.07% Milton village 26.09% 19.57% Nebo village 26.65% 10.55% New Canton town 19.60% 17.87% New Salem village 25.00% 19.53% Pearl village 28.65% 15.20% Perry village 24.94% 25.93% Pittsfield city 18.75% 25.85% Pleasant Hill village 24.64% 23.42% Time village 3.57% 46.43% Valley City village 15.38% 15.38%
Source: Claritas 2008 Estimates

17
Age of Structures
Most of the villages and cities in Pike County have older building stock. All of the municipalities except for Valley City Village have structures which are generally older than state and national averages.
Figure 14: Median Year and Dominant Year Structures Built – Municipalities
Median Year Built Dominant Year Built
U.S. 1975 1970 to 1979 Illinois 1966 1939 or Earlier Barry city 1947 1939 or Earlier Baylis village 1932 1939 or Earlier Detroit village 1957 1939 or Earlier El Dara village 1930 1939 or Earlier Florence village 1956 1939 or Earlier Griggsville city 1956 1939 or Earlier Hull village 1953 1939 or Earlier Kinderhook village 1959 1939 or Earlier Milton village 1958 1939 or Earlier Nebo village 1951 1939 or Earlier New Canton town 1945 1939 or Earlier New Salem village 1936 1939 or Earlier Pearl village 1940 1939 or Earlier Perry village 1963 1939 or Earlier Pittsfield city 1958 1939 or Earlier Pleasant Hill village 1956 1939 or Earlier Time village 1960 1999 to 2008 Valley City village 1967 1960 to 1969
Source: Claritas 2008 Estimates

18
PIKE COUNTY LAND USE AND DEVELOPMENT TRENDS
Pike County, Illinois, located in West Central Illinois, is a primarily rural county encompassing 849 square miles, with 19 square miles of water area, primarily miles of Mississippi or Illinois River Bank. Sparsely populated, with a mere 21 persons per square mile, the primary land use for the county is agricultural land.
Agriculture remains a dominant force. According to the 2007 Census of Agriculture, there are 1,028 farms in the county, down from 1,103 in 2002. The average size of farms is 449 acres (up from 402 in 2002), and the average market value of agricultural products (crops and livestock) sold per farm is $177,364, a 66% increase from 2002 when the average was $106,723. Harvested agricultural land in Pike County represents nearly 461,366 acres annually. The remaining land uses in the county includes wetlands, rural residential property, lakes, ponds, streams, and recreational land.
The development trends of Pike County, like many similar rural counties, have been stagnant for the past several decades. As reported in previous sections, the population continues to both age and diminish in number. There are no major industries or employers, as you will see in a table following this section. With no significant manufacturing shipments, the county, through the Pike County Economic Development Corporation, has focused energy on recreational development and tourism. Due in large part to the sluggish regional economy, little to no development has occurred in the county over the past decade.
Tourism is a major economic booster in Pike County. Between the scenic views, ties to Abraham Lincoln and whitetail deer the county draws large numbers each year in both visitors and revenue. Pike County continues to flourish due to recreational interests of outsiders during hunting seasons. Several businesses rely heavily on the increased foot traffic during that time of the year to make it.
With Interstate 72 and the various tourism opportunities, there is potential for future development in Pike County. Focuses on housing and recreational development are planned for the region with some growing interest in entrepreneurship and “economic gardening” rather than the labor-intensive, and rarely successful, strategy of attracting a large industrial employer. In this way the shortened drive time that comes with four-lane roads is detrimental since the larger cities of Quincy and Springfield with their existing infrastructure in place will have even more appeal to such employers since the range of potential workers expands with those highway expansions.

19
Figure 15: County Map
20
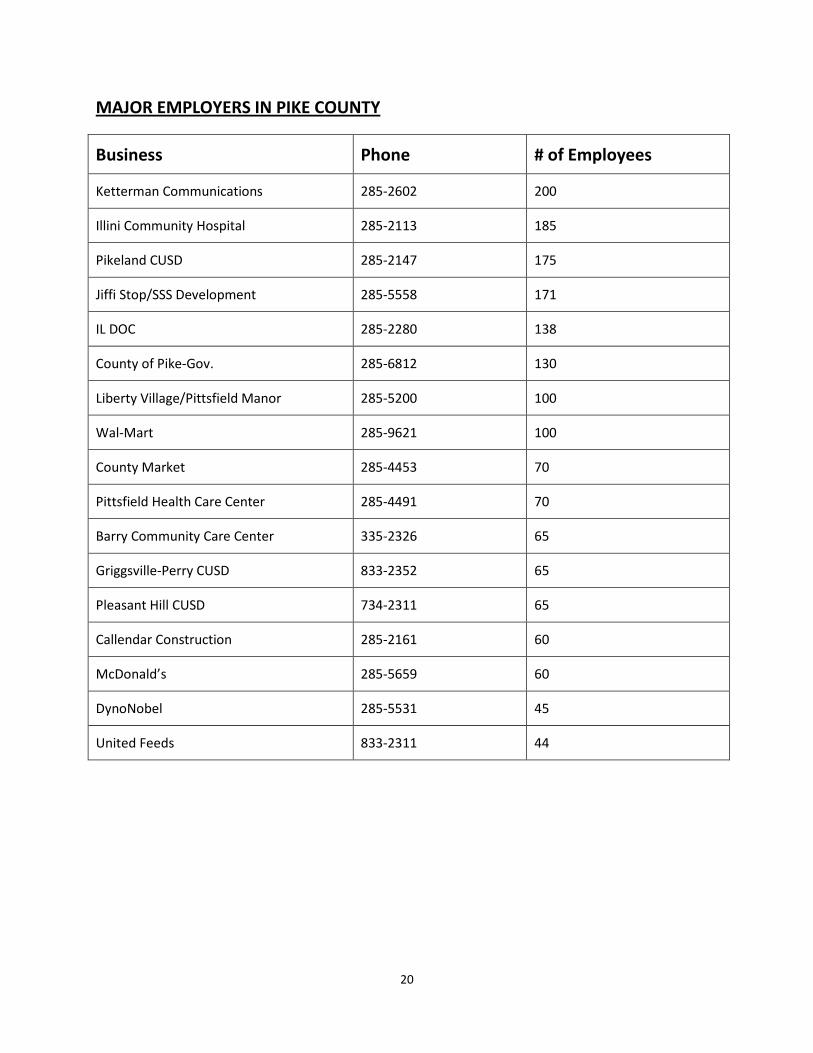
MAJOR EMPLOYERS IN PIKE COUNTY
Business Phone # of Employees
Ketterman Communications 285-2602 200
Illini Community Hospital 285-2113 185
Pikeland CUSD 285-2147 175
Jiffi Stop/SSS Development 285-5558 171
IL DOC 285-2280 138
County of Pike-Gov. 285-6812 130
Liberty Village/Pittsfield Manor 285-5200 100
Wal-Mart 285-9621 100
County Market 285-4453 70
Pittsfield Health Care Center 285-4491 70
Barry Community Care Center 335-2326 65
Griggsville-Perry CUSD 833-2352 65
Pleasant Hill CUSD 734-2311 65
Callendar Construction 285-2161 60
McDonald’s 285-5659 60
DynoNobel 285-5531 45
United Feeds 833-2311 44

21
CHAPTER 1 – PLANNING PROCESS
HOW THE PLAN WAS PREPARED
Preparation of the Pike County Multi-jurisdictional Natural Hazards Mitigation Plan was facilitated by the University of Illinois Extension CADS Program and developed through the Pike County Multi-jurisdictional Natural Hazards Mitigation Plan Steering Committee.
January- organizing to plan
This meeting dealt with the scheduling of all future meetings, determining who was missing from the table that still needed to be invited, explaining the importance of jurisdictional representation and public participation, discussions of how to promote meetings and future actions and a discussion about how the county will provide the local match (25%) required for the project.
February- Jurisdictional risk assessment and critical facilities identification
This meeting covered the significant impact of historical data based on natural hazards. The group discussed the hazards provided by the Illinois Water Survey and then ranked the hazards for each participating jurisdiction. Plans were devised for first public meeting.
March- Public Engagement Plan (i.e. meetings, either review or plan, and survey distribution) and Hazard Mitigation Goals
This meeting dealt with the public survey that needed to be distributed throughout the county. The Boy Scout clubs were selected to hand deliver the surveys to the residents in the area. Also the group discussed the goals for the Hazard Mitigation Plan as well as the format for the upcoming public meeting.
April- Existing Plan reviews and Mitigation ideas by jurisdiction
This meeting allowed the Task Force to work on creating objectives to go with their goals that had been established at a prior meeting. The group also discussed some potential projects and how they could each come up with project ideas for the different jurisdictions in the county.
May- Sept Jurisdictional Priorities and Grid development, plan maintenance strategy
The jurisdictional project grids were collected at this meeting. The group discussed the final county-wide project grid and accepted it. They also reviewed the county demographics that were provided to them.
THE PLANNING TEAM
Pike County received a planning grant through the Hazard Mitigation Grant Program to prepare this plan. Pike County contracted through the University of Illinois Extension’s CADS program to assist in the planning process and to coordinate the plan preparation and participation. Jennifer Mowen and Stephanie Dehart led development at the Staff level, assisted by Earl Bricker and Carrie McKillip.
All communities in Pike County were invited to participate in the Pike County Multi-jurisdictional Natural Hazards Mitigation Plan.
Based upon the short timeline for Hazard Mitigation Planning in Pike County, participation requirement for jurisdictional participation was kept at a minimum requirement. Each participating jurisdiction was required to attend at least one steering committee meeting.
22
PUBLIC PARTICIPATION The importance of public participation in the planning process was recognized by the Task Force. Efforts to educate the public regarding creation of the plan and to provide opportunities for the public to have input on the plan were an integral part of the planning process. These efforts are discussed below.
Representing a rural county without large media outlets, the Pike County Hazard Mitigation utilized multiple methods to engage citizens of the county in the planning process. Press releases, public meetings, issue-based focus groups, and community surveys were all used to gather opinion and suggestions. Throughout the process, steering committee members were also encouraged to explain and discuss the planning process with their friends and neighbors and encourage their input.
Throughout the planning timeframe, multiple press releases have been sent out to area newspapers and radio stations explaining the process, promoting the public meetings, and encouraging survey participation.
Four public meetings were held in different locations throughout the county which allowed interested parties to view the risk assessments, propose potential projects, and to discuss any ideas or concerns that they may have. The overall objective was to encouraging public comment as to what could be done to permanently reduce the risk to life and property from natural disasters. The schedule for the meetings was as follows from 6:00-8:00pm:
• May 3, Griggsville City Hall • May 5, Pleasant Hill Village Office • May 6, Pike County Farm Bureau Auditorium, Pittsfield • May 12, Barry Community Center (formerly Holy Redeemer Catholic Church)
The intent of scheduling four meetings at four separate locations was to enable the greatest participation from all segments of the public. While attendance was small, discussion was lively, and significant input was gathered in this manner. In addition to such discussion, those attending were asked to complete a brief form to better capture their thoughts and ideas about mitigation strategies.
To ensure that diverse groups were also included in the process, nine focus groups were held over the course of a week to gather input from the following sectors:
• Ag and Natural Resources
• Health and Human Services
• Transportation
• Utilities
• Public Safety
• Business and Development
• Education and History
• Communications
• Government
An agenda for these small groups and a copy of the form used to gather information additional to the recorded discussion can be found in the Appendix.

23
COMMUNITY SURVEYS
The Pike County Hazard Mitigation Steering Committee chose to distribute a community survey as a portion of their public participation process. Included in the survey were questions about all of the natural hazards that may have a potential affect on Pike County, and community knowledge of the proper steps to prepare for such disasters. Survey respondents were also given the opportunity to share ideas about on how to reduce the impact of natural disasters in Pike County.
The survey was distributed in multiple ways. First, paper copies of the survey were distributed to all communities via City and Village offices and through the Pike County Clerk’s office. Copies were also disseminated at meetings of service clubs and through selected churches, organizations, etc.. In addition, an electronic version of the survey was created with a link on various local websites. A press release was also sent to area media as to the locations and websites where the survey could be obtained. Steering committee members were also encouraged to send the online link to any of their contacts who resided in Pike County and encourage those contacts to do the same.
Through all sources of distribution, a total of one hundred and sixty surveys were collected and tabulated into the final survey results.

24
Survey Results
Of the 160 respondents, almost 69% indicated that they lived in a community rather than in the country. Not all respondents chose to share their age but of those who did, both the median and average age was calculated to be 54. More women (67%) responded than men. More than three-fourths (66.2%) have lived in Pike County for 20 years or more, and 78% own their home, with most (84%) of those structures identified as a single family residence. The vast majority (81%) stated they have Internet access.
A little less than half of the respondents (48.2%) said that they had personal experience with some sort of natural hazard in the last ten years to the extent that there was harm to person or property. The most frequently cited hazard was severe storms with almost 69% of those answering this question identifying it; slightly more than half identified winter storm as that experienced hazard with just over 10% citing tornadoes. Pike County was a declared disaster area due to the 2008 flooding, the reason for this planning effort, and this was demonstrated by 25% stating that they had been adversely impacted by flooding.
Figure 16: Experienced Hazards in Pike County

25
This order shifted a bit in responses to another survey question asking about the level of concern felt about particular natural hazards occurring in their community and/or county. Most concern was expressed about winter storms. Tornadoes were identified next in respect to the level of concern, followed by severe storms and then flash flooding.
Figure 17: Concern about Natural Hazards

26
Of particular interest to the Steering Committee were the responses related to community preparedness and information dissemination. Many of the project areas identified for the county refer to education, communication and public awareness. The survey results provide a picture of where county residents currently are in respect to disaster preparedness, demonstrating opportunity for increased education and awareness since more than 62% responded that they were either “not at all” or merely “somewhat” prepared. There were no respondents indicating that they felt “very well prepared,” reinforcing the need for more awareness campaigns.
Figure 18: Prepared for Natural Hazard Events
Determining the best way for such information to be disseminated will be aided by the responses to the question asking about preferred methods of receiving information. Those responses are displayed on the next page.

27
Respondents were allowed to choose as many options as they liked. Thus multiple methods of delivery received relatively high rankings. Traditional media – television, radio, newspaper – all were identified by higher percentages of responses. Note a distinction between “news” and “ads” with the latter falling short in order of preference. Internet was right in the mix; as noted in a previous section, almost 80% of respondents indicated access, suggesting that this would be a relatively low cost method of educating the public. The diversity of responses will help inform groups as to the wide array of information sources to which citizens may turn for information they trust.
Figure 19: Effective Ways of Receiving Information
Other survey questions focused on the willingness of respondents to engage in personal mitigation efforts around their own home, incentives to help make that more likely to happen, and about the risks of flood and earthquake on their own home.

28
REVIEW AND INCORPORATION OF EXISTING PLANS, STUDIES, REPORTS, AND TECHNICAL INFORMATION
All known existing plans within Pike County were gathered by Extension Staff. At the first Task Force meeting the community representatives were given a form to be completed in consultation with the leaders in their community, providing them with a list of plans and other documents that should be considered during preparation of the plan. Natural hazards mitigation can be incorporated into existing plans and ordinances during updates. If a community does not have particular regulations that would promote hazard mitigation, such as building codes, these could be considered for adoption. Other documents could provide helpful information for assessing risks or determining appropriate mitigation projects. A combined listing of community documents is below.
Figure 20: Existing Community Documents
Pike
Cou
nty
Bayl
is
Barr
y
Det
roit
El D
ara
Flor
ence
Gri
ggsv
ille
Hul
l
Kind
erho
ok
Milt
on
Neb
o
New
Can
ton
New
Sal
em
Pear
l
Perr
y
Pitt
sfie
ld
Plea
sant
Hill
Tim
e
Valle
y Ci
ty
DOCUMENT
Comprehensive Plan X
X
Subdivision Ordinance X X
Zoning Ordinance X X X X X X X X X X X X X X X X X X X
Building Codes X
Land Use Plan X
Existing Land Use Map
Flood Ordinance
X
Flood Insurance Rate Map* X
Repetitive Flood Loss List
Elevation Certificates for Bldgs
Capital Improvement Plan
Historic Preservation Ordinance
X
Storm Water Management Plan X
Hazard Mitigation Plan
Emergency Management Plan X X
X
Drainage Ordinance
X
Critical Facilities Map X X
X
Hazard Vulnerability Analysis
Infrastructure Map X X
X
X
Topographic Map X
X
Community Website X X
X
X X

29
Pike
Cou
nty
Bayl
is
Barr
y
Det
roit
El D
ara
Flor
ence
Gri
ggsv
ille
Hul
l
Kind
erho
ok
Milt
on
Neb
o
New
Can
ton
New
Sal
em
Pear
l
Perr
y
Pitt
sfie
ld
Plea
sant
Hill
Tim
e
Valle
y Ci
ty
DOCUMENT
Community Action
X
Siren X
X X X X X X
X X X
Weather Radio X
X
Storm Spotters
X
X
X
Local Weather Station X
X
Watershed Repairs
Road Treatment X X
X X
X X
* The Flood Insurance Rate Maps for Pike County, produced by the Illinois State Water Survey, were effective 10/16/2009 and the above Figure reflects that status.

30
STATE AND LOCAL CAPABILITY ASSESSMENT
This section provides details on the State and local capabilities when dealing with hazard mitigation. The State and local capabilities are referenced in order to show what plans, documents and regulations are already in place and are ready to be used in the event of a natural disaster occurring.
State Capability Assessment
The Illinois Natural Hazard Mitigation Plan (INHMP) compiled by the state and dated October 2007 looks at the State’s ability to respond in the event of a natural disaster. A selection from the “Purpose” section of the document is provided below:
“The contents of this Illinois Natural Hazard Mitigation Plan (INHMP) are intended to provide the framework for hazard mitigation not only during the recovery and reconstruction process, but on a year-round basis to identify current and proposed mitigation projects which will reduce the potential for future losses and decrease the costs to the taxpayers.”
Local Capability Assessment
The local capability assessment has an overview of existing communities and their respective plans, documents and regulations that are currently in place or being created to mitigate some of the devastating effects of natural disasters.
Mitigation measures in place or being implemented
The following are mitigation measures that communities either have in place or are currently working on for the county-wide hazard mitigation plan.
Weather Warning Systems
All but a few of the communities have a siren in town or at the fire station that signals residents when a strong storm, tornado or other hazard is present.
Emergency Warning Radios
A few households may have emergency warning radios but most village and city halls or police and fire departments in the communities do not have a weather radio.
Severe Weather Spotters
Most communities have volunteer firemen from a department or district. Often these are the people who will be assigned to look out for inclement weather and report back to the police. Many of the smaller communities with populations under 200 do not have an official “storm-spotter.”
Local Media Outreach
There are radio stations in Pittsfield, Jacksonville OR Quincy, IL and Hannibal OR Louisiana, MO. The only community with their own radio station in Pike County for weather alerts and local news is in Pittsfield, IL.

31
CHAPTER 2 – RISK ASSESSMENT
HAZARD VULNERABILITIES AFFECTING PIKE COUNTY
The Pike County Hazard Mitigation Steering Committee met on February 16, to determine the risk by natural hazard for each jurisdiction in Pike County with additional meetings on March 18 and April 15 to continue working in this area. Steering Committee members reviewed the 2007 Illinois State Hazard Mitigation Plan, both for methodology and risk assessment for Pike County. Additionally, historical data for weather related events in Pike County were reviewed by the jurisdictions.
The steering committee initially opted to follow the approach used by the Illinois Natural Hazard Mitigation Planning Committee (Severe-High-Elevated-Guarded-Low) but subsequently opted to simplify by merging into three categories (High-Moderate-Low) when assessing risk for each natural hazard. Scale of each risk by jurisdiction was done by consensus of the committee after reviewing historical data, potential magnitude of loss to both property and life, and local knowledge of the topography of the jurisdiction. During the discussion, the representative from the jurisdiction reflected specific knowledge to which the group deferred, especially in the categories of drought and flood. Specifically mentioned by several jurisdictions was the water supply in a drought situation, and well as the rural areas that are dependent upon their own wells. The ratings determined by the committee are listed below.
Figure 21: Overall Summary of Pike County’s Vulnerability to Natural Hazards
Jurisdiction Severe Storm Flooding Winter Storm Drought Extreme
Temperatures Earthquake Tornado
Pike County Moderate Moderate Moderate Low Moderate Low Moderate
Barry Moderate Low Moderate Low Moderate Low Moderate
Baylis Moderate Low Moderate Low Moderate Low Moderate
Detroit Moderate Low Moderate Low Moderate Low Moderate
El Dara Moderate Low Moderate Low Moderate Low Moderate
Florence Moderate High Moderate Low Moderate Low Moderate
Griggsville Moderate Low Moderate Low Moderate Low Moderate
Hull Moderate Low Moderate Low Moderate Low Moderate
Kinderhook Moderate Low Moderate Low Moderate Low Moderate
Milton Moderate Low Moderate Low Moderate Low Moderate
Nebo Moderate Moderate Moderate Low Moderate Low Moderate
New Canton Moderate Low Moderate Low Moderate Low Moderate
New Salem Moderate Low Moderate Low Moderate Low Moderate
Pearl Moderate High Moderate Low Moderate Low Moderate
Perry Moderate Low Moderate Low Moderate Low Moderate
Pittsfield Moderate Low Moderate Low Moderate Low Moderate

32
Jurisdiction Severe Storm Flooding Winter Storm Drought Extreme
Temperatures Earthquake Tornado
Pleasant Hill Moderate Moderate Moderate Low Moderate Low Moderate
Time Moderate Low Moderate Low Moderate Low Moderate
Valley City Moderate High Moderate Low Moderate Low Moderate
Illinois Hazard Rating By County Based on Criteria and Methodology. Established at the Illinois Natural Hazard Mitigation Planning Committee Meeting on March 10, 2004.
Community ratings provided by Steering Committee and/or community members on February 16, March 18 and April 15, 2010.
NATURAL HAZARDS –PROBABILITY AND ASSESSING VULNERABILITY
Pike County, Illinois is a risk for multiple types of natural hazards, including floods, severe storms, tornados, severe winter storms, extreme temperature days, earthquake and drought. While natural hazards are unpredictable by nature, an analysis of historical data can provide insight as to the likelihood of those events occurring in the future. In addition, assessing the damage to building related to those events in a critical part of the planning process. The probability and vulnerability for both earthquake and flooding are included in the HAZUS analyses which follow.
The remaining natural hazards are assessed for probability below. Methodology for the probability analysis is tabulating the number of past events and dividing by the number of years the data covers. Data are available for different types of natural hazards over a varying number of years so for each type of natural hazard, a separate analysis is required.
Figure 22: Pike County Natural Hazard Probability
288 event(s) were reported in Pike County, Illinois between 01/01/1950 and 10/31/2010.*
Hazard Extreme
Temperature Severe
Storm / Hail Drought Earthquake
Winter Storm / Ice
Tornados Flooding
# of Events* 24 188 3 0 26 27 19
Years of Data 50 50 50 50 50 50 50
Annual Probability
48% 100%+ 6% 0%+ 52% 54% 38%
*Source: National Climate Data Center –Storm Events Database
As can be seen from the table, while earthquakes remain a low (but possible) risk for Pike County, nearly every other natural hazard that affects the area has a relatively high likelihood of occurrence. While these events are almost guaranteed to occur, their magnitude directly relates to the severity of vulnerability. While all extreme temperature days pose risk to life (either heat or cold), a small percentage of snow and ice events pose a widespread threat to life and property.
Drought, while common on a short term basis, varies in its impact. All of the 3 events cited above occurred in 2005. While the economic impacts of drought events can be significant, there was no financial impact calculated and recorded in the NCDC database.

33
The number of severe storms/tornados/hail that has directly caused risk to life and property is more difficult to totally assess, since many small damages go unreported. There have been 27 documented tornados in Pike County since 1950 that have had property damage estimates ranging from $1,000 to $2,500,000 in property damage. Because of the added risk to life presented by tornados, the vulnerability should be considered high.
Pike County has had no documented experience with earthquakes, but there always exists a possibility, however remote, that significant damage could be experienced from earthquakes.
Potential Loss Estimates
Two of the above natural hazards, extreme temperature and drought, have little to no impact on buildings in the county. Comprehensive analyses of the potential losses from earthquake and flooding are included in the HAZUS summary reports in following sections. To maintain consistency, total property exposure in the county is retrieved from the HAZUS data, which estimates there are 10,669 buildings in Pike County, which represents a replacement cost of $1,091,000,000. With these figures as a base, below are calculated loss estimates by type of event.
Severe Storms/Tornado
Severe storms present a risk to life and property from the presence of strong winds, lightening and hail. Additionally, in severe wind situations, damage to real property (i.e., buildings) can occur directly from the wind and flying debris. For estimation purposes, if one third of the county was affected by a severe storm event, and 2% of the buildings sustained damage, a loss estimate could be calculated as follows:
$1,091,000,000 (replace value of buildings) X .33 (33% of the county) X .02 (2% of buildings affected) = $7,200,600 (replacement value of buildings exposed to damage)
The potential loss from tornados is often more severe in damage, but on a smaller scale geographically. If a tornado affected 10% of the land area of the county( assuming equal dispersion of buildings on land), and in that 10% area 50% of the buildings were damaged at 75% of value, a potential loss could be estimated as follows:
$1,091,000,000 (replace value of buildings) X .1 (10% of County) X .5 (50% of Buildings) X .75 (75% damage to buildings) = $40,912,500 (damage estimate).
Regardless of building damage, the potential of damage to the electrical supply infrastructure is a primary concern during a severe storm event. In addition to potential damage from wind, lightening and falling trees, lives and businesses can be disrupted for significant periods of time due to storm damage.
Winter Storms
Severe winter storms have the potential to paralyze a community, from power outages, immobilization, and potential vehicle accidents. Pike County has experienced ice/winter storms in recent years that have left portions of the county without power. Additional expenses for winter storms include snow removal, road treatment, labor hours and other public expenditures related to severe winter storms.

34
REPETITIVE LOSS DATA In accordance with FEMA Requirements, repetitive loss history within Pike County was reviewed during the March 18th committee meeting. The information, proved by the Illinois Emergency Management Agency, included all of the repetitive loss data as of April 30, 2009.
Of the forty-one (41) repetitive loss properties identified in Pike County, all but three (3) are located in unincorporated areas. All but five (5) are single family dwellings.
One (1) of these properties, a single family dwelling, is located within the jurisdiction of Pearl, and two (2) within Valley City, one single-family dwelling and one non-residential property. All of the remaining properties are located in unincorporated areas of Pike County. All these properties will remain vulnerable until they are mitigated to protect against the natural hazards that caused the losses. This is predominantly flooding, and elevation or buyout would be the most effective mitigation efforts.
2007 ILLINOIS NATURAL HAZARD MITIGATION PLAN RATINGS
The historical occurrence of natural hazards is one of four main criteria that were used in the Illinois Natural Hazard Mitigation Plan to create hazard ratings for each county in the state. Based upon Historical frequency and probability, vulnerability, severity of impact, and a population criterion, the plan includes a rating for each type of natural hazard for each county. Ratings (from low to high) of low, guarded, elevated, high and severe were assigned based upon the aforementioned criteria. Pike County was given the following ratings:
Figure 23: Hazard Ratings for Pike County Assigned in the 2007 Illinois Natural Hazard Mitigation Plan
Severe Storms Floods Severe Winter Storms Drought Extreme Heat Earthquake Tornado
High High High Guarded High Elevated Elevated Source: 2007 Illinois Natural Hazard Mitigation Plan
Figure 24: Vulnerability Levels (percentage of people)
Factors: 1) The relationship of where people live in or near the hazard area. 2) The percentage of people that will be adversely affected should the hazard occur.
Low (6) Less than 10% of the total population of the jurisdiction
Medium (12) 10% to 25% of the total population of the jurisdiction
High (18) More than 25% of the total population of the jurisdiction

35
FEDERAL DISASTER DECLARATION HISTORY
Most of the federally declared disasters that Pike County has been a part of since 1981 have been flood events.
FEMA DR#674 – In December of 1982 a federal disaster was declared for several Illinois counties including Pike. This disaster declaration was the result of a series of severe storm, flooding, and tornado events which hit the area.
FEMA DR#735 – Pike County was one of several counties that were a part of this 1985 disaster which was the result of flooding, severe storms and ice jams. This disaster also affected counties along the Kankakee, Wabash, and Illinois rivers.
FEMA DR #997 – This 1993 known as the Great Flood of 1993 prompted a disaster declaration encompassing thirty-nine Illinois counties.
FEMA DR#1053 – Pike County along with several other counties along the Illinois river were part of this May 1995 declaration. A series of severe storms caused several counties along the Illinois river to flood.
FEMA DR #1368 – In April of 2001 heavy flooding devastated ten Illinois counties. In May a federal disaster was declared for the ten counties affected, including Pike County. In all over $1.2 million in federal and state disaster assistance was extended to residents of the ten counties. Disaster housing grants accounted for $506,000 while the Small Business Administration (SBA) made $711,000 in low-interest in disaster loans.
FEMA DR#1416 – This May 2002 disaster declaration was the result of several tornadoes, severe storms and flooding. Nearly two thirds of the state’s counties were a part of this declaration which encompassed all of central and southern Illinois, including Pike County.
FEMA DR#1771 – The flooding of June 2008 caused massive damage across the state. In total eighteen Illinois counties, including Pike, were part of this disaster declaration. Individual assistance extended in this disaster to all affected counties was in excess of $15 million. However, data for individual assistance received in Pike County is not yet available.

36
SEVERE STORMS/HAIL (Source: Federal Emergency Management Agency)
All thunderstorms are dangerous. Every thunderstorm produces lightning. In the United States an average of 300 people are injured and 80 people are killed each year by lightning. Although most lightning victims survive, people struck by lightning often report a variety of long-term, debilitating symptoms.
Facts about thunderstorms:
• Thunderstorms may occur singly, in clusters, or in lines. • Some of the most severe occur when a single thunderstorm affects one location for an extended
time. • Thunderstorms typically produce heavy rain for a brief period, anywhere from 30 minutes to an
hour. • Warm, humid conditions are highly favorable for thunderstorm development. • About 10% of thunderstorms are classified as severe – one that produces hail at least ¾ of an inch in
diameter, has winds of 58 miles per hour or higher, or produces a tornado.
Facts about lightning:
• Lightning’s unpredictability increases the risk to individuals and property. • Lightning often strikes outside of heavy rain and may occur as far as 10 miles away from any rainfall. • “Heat lightning” is actually lightning from a thunderstorm too far away for thunder to be heard. • Most lightning deaths and injuries occur when people are caught outdoors in the summer months
during the afternoon and evening.
Facts about hail:
• As a thunderstorm grows, updrafts will push water droplets into a region of the atmosphere which is below the freezing temperature. These water droplets collide with other droplets just before freezing, which is why some hailstones can grow to several inches in diameter. The stronger the updraft associated with a thunderstorm, the larger the hail associated with the storm will be.
The National Oceanic and Atmospheric Administration’s (NOAA) National Climatic Data Center keeps a database of all severe weather events. With regard to severe storms the database keeps records of thunderstorm and high wind events, hail events, and tornados. According to the NCDC the Storm Events database keeps record of all thunderstorm and wind events, as well as hail events from 1955 forward. However, the lack of damage inducing thunderstorm and high wind events before 1997 and the lack of any events before 1970 call into question the completeness of this data. The tornado events are reportedly tracked back to 1950.

37
The following table displays all of the damage or injury inducing thunderstorm and high wind events in Pike County that are listed in the NCDC Storm Events Database.
Figure 25: Thunderstorm and High Wind Events Causing Damage or Injury in Pike County 1955-Present
Location or County Date Time Recorded Windspeed Deaths Injuries Property Damage
Crop Damage
Fishhook 9/2/1993 12:00 AM Thunderstorm Wind 0 0 1K 0
PIKE (1) 4/18/1995 12:00 AM High Winds 0 0 400K 0
PIKE (1) 12/16/2000 8:00 PM Extreme Windchill 1 0 0 0
Barry 7/8/2003 9:00 PM Tstm Wind 0 0 5K 0
Pleasant Hill 10/29/2004 4:55 PM Tstm Wind 0 0 30K 0
PIKE (1) 5/11/2008 2:00 AM Strong Wind 0 0 0K 2K
New Salem 5/30/2008 15:25 PM Thunderstorm Wind 0 0 5K 0K
Source: National Climatic Data Center Notes:
(1) denotes that this storm event affected an area larger than, but including Pike County. Not all of the damage displayed in the records with (1) occurred in Pike County.
The following table displays the number of hail events in Pike County that are listed in the NCDC
Storm Events Database.
Figure 26: Number of Hail Events by Jurisdiction 1955-Present
Jurisdiction Number of Hail Events
Unspecified Pike County 13
Barry 8
Chambersburg 1
Detroit 3
East Hannibal 1
Griggsville 8
Hadley 1
Hull 1
Kinderhook 1
Milton 1
Nebo 3
New Canton 1
Perry 3
Pittsfield 9
Pleasant Hill 3
Source: National Climatic Data Center

38
Figure 27: Pattern of Hail Days

39
TORNADOS (Source: Federal Emergency Management Agency)
Tornadoes are nature’s most violent storms. Spawned from powerful thunderstorms, tornadoes can cause fatalities and devastate a neighborhood in seconds. A tornado appears as a rotating, funnel-shaped cloud that extends from a thunderstorm to the ground with whirling winds that can reach 300 miles per hour. Damage paths can be in excess of one mile wide and 50 miles long. Every state is at some risk from this hazard.
Some tornadoes are clearly visible, while rain or nearby low-hanging clouds obscure others. Occasionally, tornadoes develop so rapidly that little, if any, advance warning is possible. Before a tornado hits, the wind may die down and the air may become very still. A cloud of debris can mark the location of a tornado even if a funnel is not visible. Tornadoes generally occur near the trailing edge of a thunderstorm. It is not uncommon to see clear, sunlit skies behind a tornado.
Facts about tornadoes:
• They may strike quickly, with little or no warning. • They may appear nearly transparent until dust and debris are picked up or a cloud forms in the
funnel. • The average tornado moves southwest to northeast, but tornados have been known to move in any
direction. • The average forward speed of a tornado is 30 MPH, but may vary from stationary to 70 MPH. • Waterspouts are tornadoes that form over water. • Tornadoes are most frequently reported east of the Rocky Mountains during spring and summer
months. • Peak tornado season in the southern states is March through May; in the northern states, it is late
spring through early summer. • Tornadoes are most likely to occur between 3 p.m. and 9 p.m., but can occur at any time.
The National Oceanic and Atmospheric Administration’s (NOAA) National Climatic Data Center keeps a database of all severe weather events. With regard to severe storms the database keeps records of thunderstorm and high wind events, hail events, and tornados. According to the NCDC the Storm Events database keeps record of all thunderstorm and wind events, as well as hail events from 1955 forward. However, the lack of damage inducing thunderstorm and high wind events before 1997 and the lack of any recorded events before 1970 call into question the completeness of this data. The tornado events are reportedly tracked back to 1950.

40
The following table displays all of the damage or injury inducing tornado events in Pike County that are listed in the NCDC Storm Events Database.
Figure 28: Tornados Causing Injuries or Property Damage 1950-Present
Location or County Date Time Magnitude Deaths Injuries Property Damage
Crop Damage
PIKE 6/19/1956 12:00 AM Tornado F2 0 0 25K 0
PIKE 6/10/1957 12:00 AM Tornado F2 0 0 25K 0
PIKE 6/14/1957 12:00 AM Tornado F2 0 1 250K 0
PIKE 4/24/1961 12:00 AM Tornado F3 0 0 250K 0
PIKE 5/14/1961 12:00 AM Tornado F3 0 0 2.5M 0
Beecreek 2/11/1999 2:12 PM Tornado F1 0 0 200K 0
Perry 9/30/2007 8:15 PM Tornado F0 0 2 0K 0K
New Salem 5/30/2008 3:25 PM Tornado F1 0 0 5K 0K
Note: 1 - "PIKE" in all capital letters refers to an unspecified location within Pike County
Figure 29: Tornados Causing Injuries or Property Damage 1950-Present
Information about tornado activity in Illinois is posted at the Illinois State Climatologist Web site http://www.isws.illinois.edu/atmos/statecli/. Information posted includes tornado climatology; tornado maps, statistics, research and links to other sites. Below are excerpts from the Illinois State Climatologist web site.
Fujita Tornado Scale

41
Tornadoes were typically classified using the Fujita or F-scale, the higher the number the worse the damage. In recent years, the F-scale was changed to the EF-scale or "Enhanced Fujita"-scale. This was based on refinements to the original scale and is described in more detail by the NWS here and here. Below is the original scale.
Figure 30: Fujita Tornado Scale
F-0 40-72 mph Light damage: some damage to chimneys; tree branches broken; sign boards damaged.
F-1 73-112 mph Moderate damage: peels off some roofing; mobile homes pushed off foundation; moving cars blown off road.
F-2 113-157 mph Considerable damage: roofs torn off houses; mobile home demolished; large trees snapped or uprooted; cars lifted off ground.
F-3 158-205 mph Severe damage: roofs and walls blown down; trains overturned; most trees uprooted; cars lifted and tossed.
F-4 207-260 mph Devastating damage: well-constructed buildings leveled; cars tossed some distance;
F-5 261-318 mph Incredible damage: massive destruction; car-size objects thrown as far as 100 meters; most buildings leveled and swept away; incredible phenomena will occur.
Historically, most tornadoes in Illinois have occurred in April through June.
Figure 31: Tornado F-Scale versus Month by F scale in Illinois

42
WINTER STORMS Winter storms in Pike County consist of snow and ice and at times result in blizzard conditions. Winter storms can produce flooding, storm surge, closed highways, blocked roads, downed power lines and hypothermia.
Snowfalls are generally measured in inches but at times have reached over one foot. Blowing snow reduces visibility and is the cause of many vehicle accidents.
A heavy snowstorm is one that produces at least 6” of snow within 48 hours.
A blizzard is a winter storm with sustained winds or frequent gusts of 35 mph or greater and considerable falling or blowing snow reducing visibility to less than ¼ mile for three hours or longer. Drifting is a major concern with roadways being blocked and buildings and driveways becoming inaccessible.
Freezing rain and sleet create slippery roadways and sidewalks causing dangerous conditions and can weigh down tree limbs and power lines causing damage and power outages.
Freezing rain is rain that freezes when it hits the ground, trees, power lines and buildings, creating a coating of ice.
Sleet is rain that turns to ice pellets before reaching the ground and creates slippery conditions.
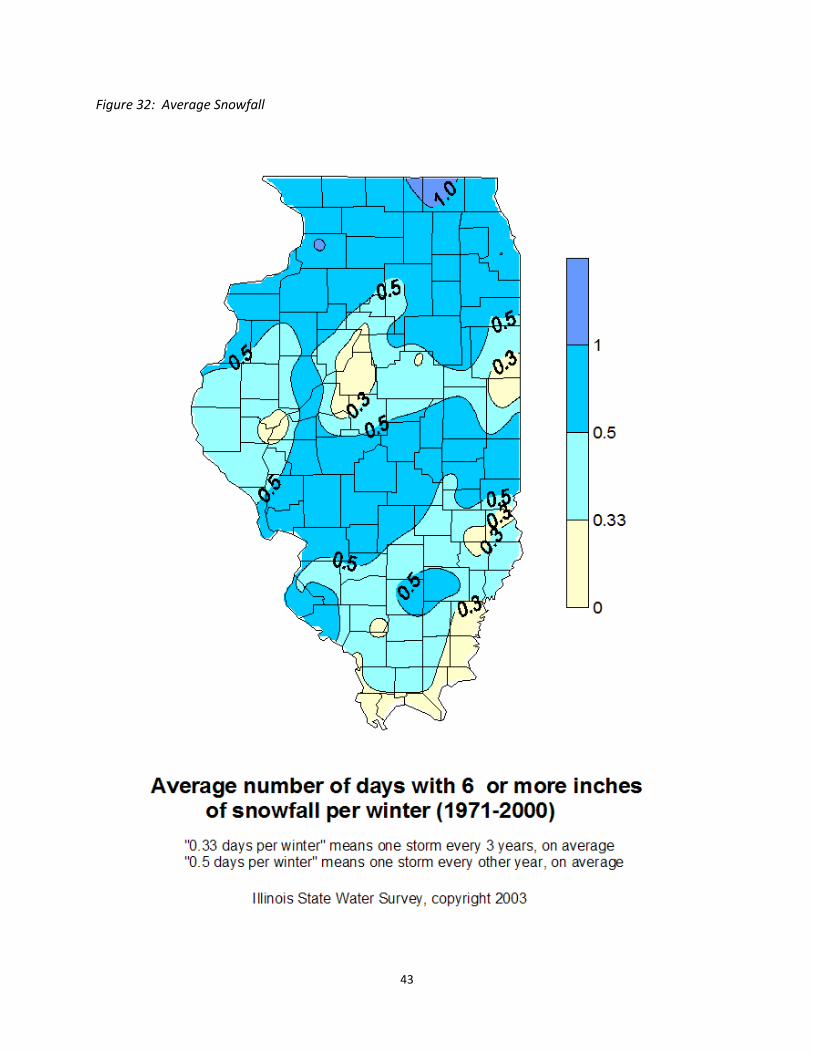
Winter storms in Illinois can be severe and cause extensive damage. Information about winter storms in Illinois can be found at the Illinois State Climatologist web site http://www.isws.illinois.edu/atmos/statecli/Winter/winter.htm. Figure is a graphic from the web site showing the historical snowfall data.
43
Figure 32: Average Snowfall

44
Severe Winter Storms From 1995 through 2008 there were 27 snow or ice events in Pike County or 1.9 per year. The following table displays the number of winter storms that have occurred in Pike County since 1995.
Figure 33: Snow and Ice Events in Pike County 1995 - Present
Date Time Type Deaths Injuries Property Damage Crop Damage
1/6/1995 3:00 AM Ice Storm 0 0 0 0
1/18/1995 6:00 PM Heavy Snow 0 0 4K 0K
12/19/1995 1:00 AM Winter Storm 0 0 0 0
1/2/1996 2:00 AM Winter Storm 0 0 0 0
1/8/1997 6:00 PM Winter Storm 0 0 0 0
1/15/1997 11:00 PM Winter Storm 0 0 0 0
4/10/1997 8:00 AM Winter Storm 0 0 0 0
12/9/1997 2:00 PM Winter Storm 0 0 0 0
1/8/1998 8:00 AM Winter Storm 0 0 0 0
1/12/1998 2:00 AM Winter Storm 0 0 0 0
3/8/1998 11:00 PM Winter Storm 0 0 0 0
12/21/1998 12:00 AM Winter Storm 0 0 0 0
1/1/1999 8:00 PM Heavy Snow 0 0 0 0
3/8/1999 6:00 AM Winter Storm 0 0 0 0
1/28/2000 6:00 PM Winter Storm 0 0 0 0
12/10/2000 4:00 AM Ice Storm 0 0 0 0
12/13/2000 6:00 AM Heavy Snow 0 0 0 0
2/25/2002 8:00 PM Winter Storm 0 0 0 0
3/2/2002 10:00 AM Winter Storm 0 0 0 0
1/1/2003 8:00 PM Winter Storm 0 0 0 0
2/15/2003 1:00 AM Winter Storm 0 0 0 0
12/13/2003 12:00 PM Winter Storm 0 0 0 0
1/25/2004 6:00 AM Winter Storm 0 0 0 0
11/24/2004 6:00 AM Winter Storm 0 0 0 0
12/8/2005 10:00 AM Winter Storm 0 0 0 0
2/13/2007 12:00 AM Heavy Snow 0 0 0 0
12/1/2007 6:00 AM Winter Weather 0 0 0 0
Source: National Climatic Data Center

45
DROUGHT (Source: Illinois State Climatologist Office)
Drought is a complex physical and social phenomenon of widespread significance, and despite all the problems droughts have caused, drought has been difficult to define. There is no universally accepted definition because: 1) drought, unlike flood, is not a distinct event, and 2) drought is often the result of many complex factors acting on and interacting within the environment. Complicating the problem of drought is the fact that drought often has neither a distinct start nor end. It is usually recognizable only after a period of time and, because a drought may be interrupted by short spells of one or more wet months, its termination is difficult to recognize.
Drought is also a temporary feature of the climate of Illinois, and we know it occurs only when less than adequate precipitation exists for an extended period of time. Because of the complex nature of droughts, there are many definitions, often reflecting a specific area of concern of an individual, a city, or a region.
The most commonly used drought definitions are:
1. Meteorological or Climatological Drought – a period of well-below-average precipitation that spans from a few months to a few years.
2. Agricultural Drought – a period when soil moisture is inadequate to meet the demands for crops to initiate and sustain plant growth.
3. Hydrological Drought – a period of below-average stream flow and/or depleted reservoir storage.
How are droughts measured? The Illinois State Climatologist Office website shows a method for estimating drought conditions on a state-wide basis.
Figure 34: Severity of Precipitation Drought Expressed as Percent of the Statewide Average Precipitation
Drought Duration Moderate Drought Severe Drought
3 months 45 to 60% less than 45%
6 months 56 to 70% less than 56%
12 months 70 to 80% less than 70%
24 months 78 to 90% less than 78%
According to the National Drought Mitigation Center there have been 83 reported impacts from droughts affecting Pike County from 1970 to the present. These impacts fall into several categories. There were 37 agricultural impacts, 15 water/energy impacts, 5 environmental impacts, 5 social impacts, and 21 other impacts. It should be noted that a single drought event can have multiple impacts which fall into different impact categories. Pike County was affected in many ways including crop damage, drinking water issues, and barge traffic congestion.

46
EXTREME TEMPERATURES (Source: Illinois Climatologist Office-Illinois State Water Survey)
Extreme heat is a combination of high temperatures and high humidity. Conditions of extreme heat are dangerous and can cause injury and death. The Heat Index is apparent temperature or a measure of how it feels when temperature and humidity are combined. It is the result of biometeorological studies and takes into account body size, core and body surface temperatures, clothing, the skin’s resistance to heat and moisture transfer away from the body. The Heat Index assumes an average-sized adult with clothing in the shade with a 5-mph wind. Being in the full sun or in an area with little air movement can increase the apparent temperature.
What makes extreme heat dangerous? The body cools itself by sweating because the evaporation of moisture has a cooling effect. High humidity reduces this evaporation and hinders the body’s effort to cool itself. The dew point temperature is a useful measure of the moisture content of the atmosphere. During summer in Illinois, dew point temperatures in the 50s are generally comfortable. Most people begin to feel the humidity when dew point temperatures are in the 60s. Dew point temperatures in the 70s are rare and cause significant discomfort.
Effects of extreme heat:
• Heat cramps: muscular pains and spasms due to heavy exertion. They usually involve the abdominal muscles or legs. It is thought that the loss of water from heavy sweating causes the cramps.
• Heat exhaustion: occurs when people exercise heavily or work in a warm, humid place where body fluids are lost through heavy sweating. Blood flow to the skin increases, causing blood flow to decrease to vital organs. This results in mild shock.
• Heatstroke/Sunstroke: LIFE THREATENING. The victim’s temperature control system stops working as the body quits producing sweat. The body temperature can rise so high that brain damage and death may result if the body is not cooled quickly.
47
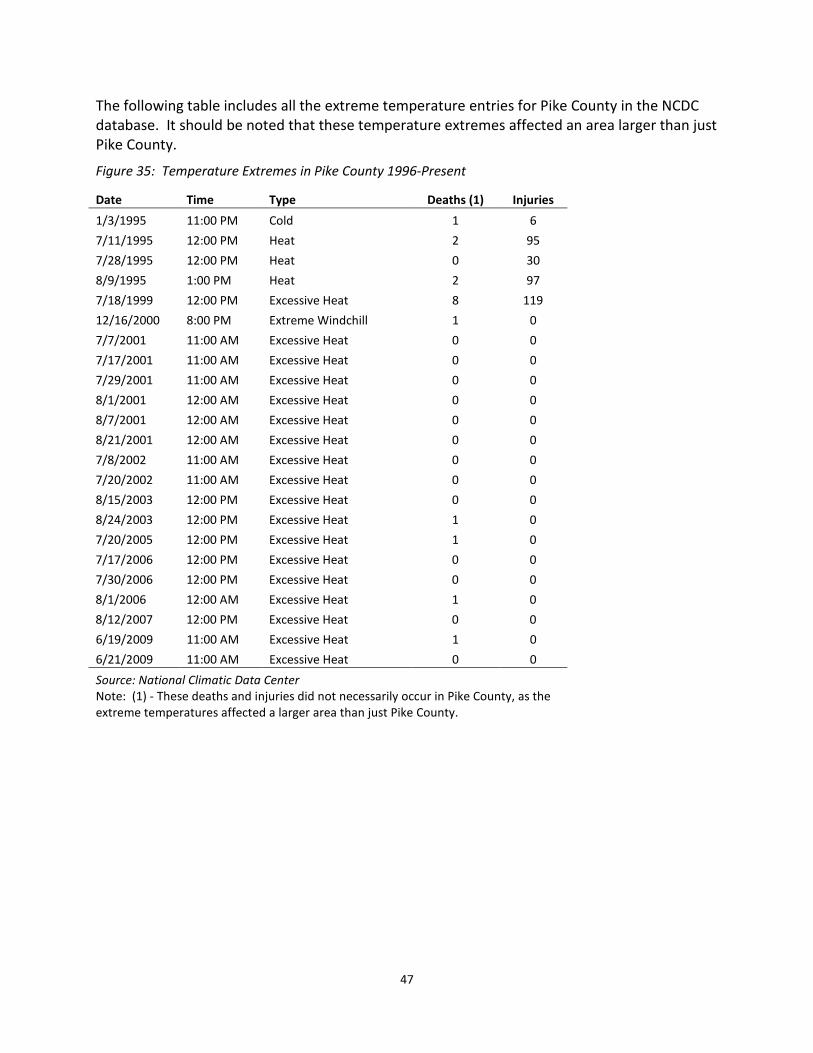
The following table includes all the extreme temperature entries for Pike County in the NCDC database. It should be noted that these temperature extremes affected an area larger than just Pike County.
Figure 35: Temperature Extremes in Pike County 1996-Present
Date Time Type Deaths (1) Injuries
1/3/1995 11:00 PM Cold 1 6
7/11/1995 12:00 PM Heat 2 95
7/28/1995 12:00 PM Heat 0 30
8/9/1995 1:00 PM Heat 2 97
7/18/1999 12:00 PM Excessive Heat 8 119
12/16/2000 8:00 PM Extreme Windchill 1 0
7/7/2001 11:00 AM Excessive Heat 0 0
7/17/2001 11:00 AM Excessive Heat 0 0
7/29/2001 11:00 AM Excessive Heat 0 0
8/1/2001 12:00 AM Excessive Heat 0 0
8/7/2001 12:00 AM Excessive Heat 0 0
8/21/2001 12:00 AM Excessive Heat 0 0
7/8/2002 11:00 AM Excessive Heat 0 0
7/20/2002 11:00 AM Excessive Heat 0 0
8/15/2003 12:00 PM Excessive Heat 0 0
8/24/2003 12:00 PM Excessive Heat 1 0
7/20/2005 12:00 PM Excessive Heat 1 0
7/17/2006 12:00 PM Excessive Heat 0 0
7/30/2006 12:00 PM Excessive Heat 0 0
8/1/2006 12:00 AM Excessive Heat 1 0
8/12/2007 12:00 PM Excessive Heat 0 0
6/19/2009 11:00 AM Excessive Heat 1 0
6/21/2009 11:00 AM Excessive Heat 0 0
Source: National Climatic Data Center Note: (1) - These deaths and injuries did not necessarily occur in Pike County, as the
extreme temperatures affected a larger area than just Pike County.
48
EARTHQUAKES (Source: 2007 Illinois Natural Hazard Mitigation Plan)
Earthquakes occur when rocks forming the earth’s crust slip past each other along a fault. This slippage occurs when the buildup of stresses gets to the point that they are greater than the strength of the locked up section of rocks along the fault plane. When faulting takes place, the sudden release of energy produces vibrations or seismic (shock) waves that radiate from the main fault movements. These waves cause the shaking or ”quaking” that lasts tens of seconds to a few minutes, depending on the magnitude of the event (energy released) and what kinds of rocks they travel through and the stiffness or lack of stiffness of the soils at a site. Where the faulting starts, at some depth below the Earth’s surface, is the hypocenter (focus) of an earthquake. The point on the surface directly above the focus is the epicenter.
There are two ways to measure earthquakes.
The magnitude is a calculation of the seismic energy released and is measured through ground vibrations with a seismograph. The familiar Richter Scale is one way of reporting magnitude. The increments of magnitude are logarithmic. An increase of 0.2 on the Richter Scale indicates a doubling of the amount of energy released. For example, a magnitude 7 earthquake releases about 32 times more energy than a magnitude 6 earthquake. A single magnitude number is calculated for each earthquake event.
The intensity relates to the effects of an earthquake and is based on descriptions provided by people experiencing the event rather than readings from an instrument. The intensity decreases when moving away from the epicenter. The type of soil influences intensity which will be stronger through the thick, loose, saturated soils found along river valleys. The Modified Mercalli Intensity Scale is used in the United States to report earthquake intensities. Many intensities are indicated for each earthquake event based on distance from the epicenter and soil type.
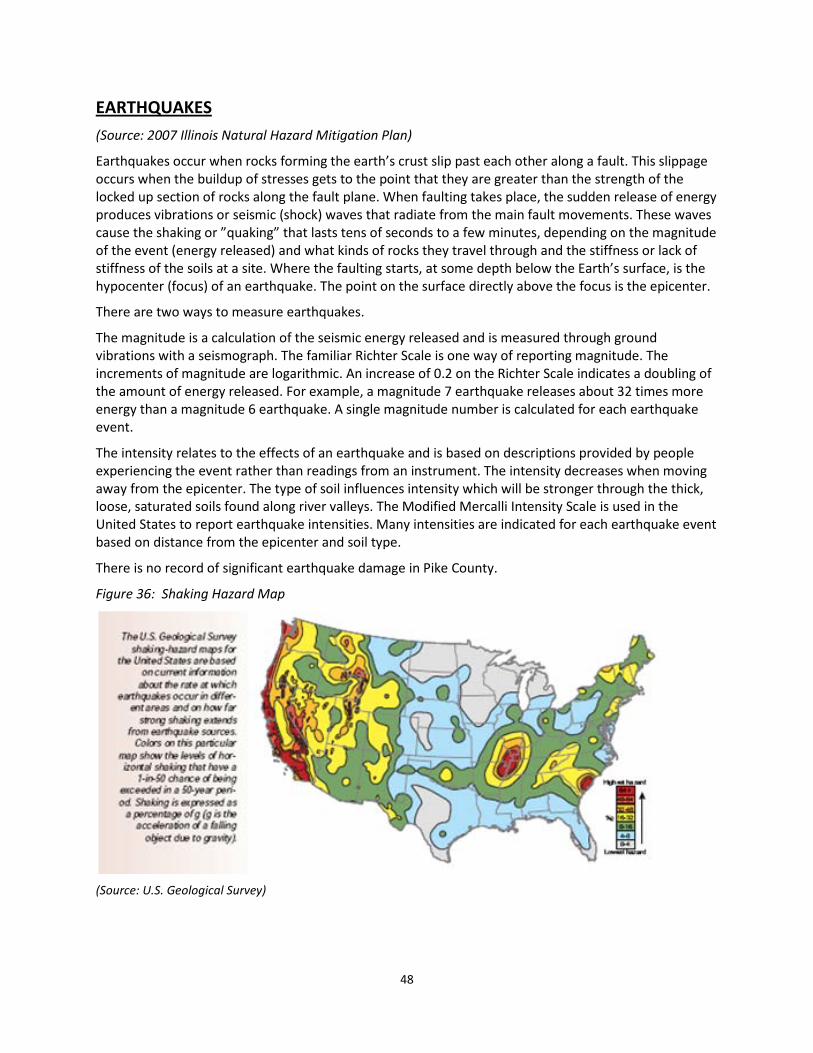
There is no record of significant earthquake damage in Pike County.
Figure 36: Shaking Hazard Map
(Source: U.S. Geological Survey)

49
Figure 37: Earthquakes in Illinois Over The Past 200 Years

50
Figure 38: Illinois Seismic Map

51
HAZUS EARTHQUAKE ANALYSIS Earthquake occurrence is not common within the state of Illinois. “However, a recent study of earthquakes around the world within stable interior parts of continents shows that earthquakes with magnitudes up to 6.8 can occur anywhere in these settings. A magnitude 6.8 earthquake would produce intensities of VII to IX (refer to Table XI.1).” (IEMA, p. 112)
Probabilities of Future Earthquakes
The likelihood of an earthquake of magnitude 6.3 or greater occurring somewhere in the Central U.S. within the next 15 years is 40% to 63% and 86% to 97% within the next 50 years. An earthquake of this size would damage older structures, especially those of masonry construction. Serious damage could also occur to many schools in the region (ISGS, 1995).
Earthquake Occurrence in Vicinity
According to the USGS/NEIC database of earthquakes in 1973-present and significant U.S. earthquakes in 1568–1989, there have been 19 recorded earthquakes in a 160 kilometer radius of the approximate center of Pike County. Nine of those earthquakes have been under magnitude 3, four events were between magnitude 3 and 4, and the remaining six events were between magnitude 4 and 5. The strongest earthquake within this 160 km radius was a magnitude 4.8 event that occurred on July 19, 1909, approximately 99 km from the center of the county. At approximately 87 km from the center of the county, the closest earthquake was a magnitude 2.9 event, which occurred on February 2, 2004.
Figure 38: Earthquake Magnitude vs. Modified Mercalli Intensity Scale
Magnitude Typical Maximum Modified Mercalli Intensity
1.0 – 3.0 I
3.0 – 3.9 II – III
4.0 – 4.9 IV – V
5.0 – 5.9 VI – VII
6.0 – 6.9 VII – IX
7.0 and higher VIII or higher
http://earthquake.usgs.gov/learn/topics/mag_vs_int.php

52
Figure 40: Abbreviated Modified Mercalli Intensity Scale
I. Not felt except by a very few under especially favorable conditions.
II. Felt only by a few persons at rest, especially on upper floors of buildings.
III. Felt quite noticeably by persons indoors, especially on upper floors of buildings. Many people do not recognize it as an earthquake. Standing motor cars may rock slightly. Vibrations similar to the passing of a truck. Duration estimated.
IV. Felt indoors by many, outdoors by few during the day. At night, some awakened. Dishes, windows, doors disturbed; walls make cracking sound. Sensation like heavy truck striking building. Standing motor cars rocked noticeably.
V. Felt by nearly everyone; many awakened. Some dishes, windows broken. Unstable objects overturned. Pendulum clocks may stop.
VI. Felt by all, many frightened. Some heavy furniture moved; a few instances of fallen plaster. Damage slight.
VII. Damage negligible in buildings of good design and construction; slight to moderate in well-built ordinary structures; considerable damage in poorly built or badly designed structures; some chimneys broken.
VIII. Damage slight in specially designed structures; considerable damage in ordinary substantial buildings with partial collapse. Damage great in poorly built structures. Fall of chimneys, factory stacks, columns, monuments, walls. Heavy furniture overturned.
IX. Damage considerable in specially designed structures; well-designed frame structures thrown out of plumb. Damage great in substantial buildings, with partial collapse. Buildings shifted off foundations.
X. Some well-built wooden structures destroyed; most masonry and frame structures destroyed with foundations. Rails bent.
XI. Few, if any (masonry) structures remain standing. Bridges destroyed. Rails bent greatly.
XII. Damage total. Lines of sight and level are distorted. Objects thrown into the air.
http://earthquake.usgs.gov/learn/topics/mag_vs_int.php
Description of Earthquake Scenario
For planning purposes, this scenario involves a theoretical moment magnitude 6 earthquake with an epicenter located in Pike County at latitude 39° 36’ 21.243” N, and longitude 90° 52’ 25.904” W. This locates the epicenter within Section 24, Township 5 South, Range 4 West, or approximately 1.5 miles west of the City of Pittsfield. Depth of origin used in the analysis was 10 kilometers below the surface.
Building Damage
HAZUS estimates that about 3,640 buildings will be at least moderately damaged. This is over 34.00% of the total number of buildings in the region. There are an estimated 401 buildings that will be damaged beyond repair. Table XI.3 below summaries the expected damage by general occupancy for the buildings in the region. Table XI.4 summaries the expected damage by general building type.

53
Figure 41: Expected Building Damage by Occupancy
None Slight Moderate Extensive Complete
Count (%) Count (%) Count (%) Count (%) Count (%)
Agriculture 16 0.39 12 0.40 19 0.82 13 1.41 6 1.54
Commercial 74 1.81 60 2.07 93 4.08 63 6.55 34 8.36
Education 5 0.13 4 0.13 6 0.26 4 0.41 2 0.53
Government 8 .20 6 0.19 8 0.36 5 0.49 2 0.56
Industrial 16 0.40 12 0.41 18 0.81 12 1.30 6 1.47
Other Residential 1,320 32.15 928 31.76 824 36.07 393 41.15 148 37.02
Religion 10 0.23 7 0.22 8 0.33 5 0.51 3 0.64
Single Family 2,655 64.69 1,895 64.82 1,309 57.27 460 48.18 200 49.88
Total 4,104 2,924 2,285 955 401
Figure 42: Expected Building Damage by Building Type (All Design Levels)
None Slight Moderate Extensive Complete
Count (%) Count (%) Count (%) Count (%) Count (%)
Wood 3,372 82.17 2,274 77.72 1,274 55.78 245 25.70 27 6.68
Steel 35 0.85 20 0.70 45 1.96 39 4.08 20 4.93
Concrete 27 0.66 19 0.66 33 1.45 24 2.51 8 1.98
Precast 10 0.23 5 0.19 12 0.53 12 1.28 5 1.21
Reinforced Masonry 19 0.46 8 0.27 17 0.73 15 1.56 4 0.98
Unreinforced Masonry 492 11.99 438 14.99 608 26.60 420 43.94 272 67.98
Manufactured Housing 149 3.64 160 5.47 296 12.95 200 20.93 65 16.24
Total 4,104 2,924 2,285 955 401
Loss Economic Loss
The total economic loss estimated for the earthquake is $498.36 million, which includes building and lifeline-related losses based on the region's available inventory. The following three sections provide more detailed information about these losses.
Building-Related Losses
Building losses are broken into two categories: direct building losses and business interruption losses. Direct building losses are the estimated costs to repair or replace the damage caused to the building and its contents. Business-interruption losses are those associated with the inability to operate a business because of the damage sustained during the earthquake. Business-interruption losses also include temporary living expenses for those people displaced from their homes because of the earthquake.
Total building-related losses were $229.63 million; 20% of the estimated losses were related to the business interruption of the region. By far, the largest loss was sustained by the residential occupancies which made up over 58% of the total loss. Table XI.5 below provides a summary of the losses associated with building damage.

54
Figure 43: Building-Related Economic Loss Estimates (Millions of Dollars)
Category Area Single Family
Other Residential
Commercial Industrial Others Total
Income Losses
Wage 0.00 0.87 7.72 0.14 0.85 9.58
Capital-Related
0.00 0.36 6.32 0.09 0.24 7.01
Rental 3.13 1.78 3.16 0.05 0.29 8.41
Relocation 11.33 1.93 5.53 0.31 2.86 21.96
Subtotal 14.46 4.94 22.73 0.59 4.24 46.96
Capital Stock Loses
Structural 14.74 4.04 7.46 0.93 4.60 31.77
Non-
Structural 55.39 16.53 22.13 3.25 9.53 106.83
Content 19.22 4.23 11.87 2.17 5.51 43.00
Inventory 0.00 0.00 0.40 0.41 0.26 1.07
Subtotal 89.35 24.80 41.86 6.76 19.90 182.67
Total 103.81 29.74 64.59 7.35 24.14 229.63
Bibliography
American Society of Civil Engineers, 2010. So, You Live Behind a Levee! American Society of Civil Engineers. http://content.asce.org/ASCELeveeGuide.html , accessed 09 July, 2010.
Illinois State Geological Survey. 1995. Earthquake Occurrence in Illinois. Illinois State Geological Survey, Champaign, IL. http://www.isgs.illinois.edu/research/earthquake-hazards/pdf-files/qk-fct-occur.pdf, accessed 25 June, 2010.
State of Illinois. Office of the Governor. 2007. Illinois Natural Hazard Mitigation Plan. Illinois Emergency Management Agency, Springfield, IL. http://www.state.il.us/iema/planning/MitigationPlanning.asp, accessed 08 April, 2010.
U.S. Army Corps of Engineers. 2004. Upper Mississippi River System Flow Frequency Study Final Report. U.S. Army Corps of Engineers, Rock Island, IL.

55
FLOOD (Source: Illinois Natural Hazard Mitigation Plan.)
Except for fire, the most common hazard in the United States is flooding with thousands occurring each year from oceans, rivers, lakes, small stream, gullies, creeks, culverts, dry streambeds or low-0lying ground. The standard definition of a flood is “A general and temporary condition of partial of complete inundation of normally dry land areas from (1) the overflow of inland or tidal waters, (2) the unusual and rapid accumulation or runoff of surface waters from any source, or (3) mudflows or the sudden collapse of shoreline land.” A simpler definition is too much water in the wrong place. Since water circulates from clouds to the soil to streams to rivers to the oceans and returns to the clouds, a scientific definition of a flood is an imbalance in the “hydrological system” with more water flowing through the system than the system can draw off.
Floods are not all alike:
Riverine Floods: Develop slowly, sometimes over a period of days or weeks.
Flash Floods: Develop quickly, sometimes in just a few minutes. Usually flash floods are the result of intense storms dropping large amounts of rain within a brief period.
Overland Floods: Occurs outside a defined river or stream (e.g., ponding in a low lying area).
Aquifer Flood: Water is expelled from a subterranean geologic formation to the surface causing flooding in the immediate area.
Subterranean Flood: Water floods into tunnels that are normally dry.
Snow melt filling rivers too quickly, heavy rainfall associated with slow-moving, low-pressure or frontal storm systems or storm surge create excess water. This water accumulates and overflows onto adjacent lands not normally covered by water. These floods can occur any time of the year, any time of the day or night and in any part of the country. Flooding can be local, impacting a neighborhood or community, or very large, affecting entire river basins and multiple states. The severity of floods is determined by the amount of rainfall or other water source, duration, typography, ground cover, frozen soil, wet or saturated soil that can’t hold any more water, full reservoirs, high rivers or stream levels, ice-covered rivers or urbanizations (lots of buildings, parking lots and roads). The majority of scientists believe that global warming causes extremes in weather that have increased flooding. Human activity influences the frequency and severity of floods.
(The following is an excerpt from the 2009 Long Term Recovery Council Final Report Aftermath of the Floods of June 2008 & Recommendations for Long –term Economic Recovery, Prepared by the Office of Sustainability University of Illinois.)
Heavy rains in 2008 produced widespread flooding across the Midwest. According to statewide average precipitation totals, the period of March–June 2008 was the wettest in Iowa’s recorded history and ranked as the 4th and 8th wettest in Indiana and Wisconsin, respectively. Total precipitation in June alone exceeded 14 inches in areas of southern Wisconsin, southwestern Iowa, and southeastern Indiana. These heavy rains contributed to record flooding in Illinois and along its border rivers. As a result of the June 2008 flooding, 25 Illinois counties were declared federal disaster areas per FEMA-1771-DR.
The 2008 flood peaks were either the highest or second highest on record at 12 of the 24 stations on the Mississippi River.

56
Although the flood heights experienced in 2008 for select locations along the Mississippi River were nearly as high or higher than those reached in 1993, the period of time above flood stage was much shorter. For example, the flood crest reached at Burlington in 2008 was over 0.5 feet higher than the 1993 flood crest of 25.10 feet, the previous record peak. The spring flooding that occurred (April-May) in both 1993 and 2008 were of similar duration at this location. However, the Burlington gage was above flood stage for only one month in June-September of 2008 as compared to over three months during the same time period in 1993 (Figure 4-1). In Quincy, the 2008 flood crest was 1.3 feet lower than the 1993 flood crest of 32.13 feet, the record peak at that location. The length of time above flood stage in 2008 was also shorter than in 1993.
Overall, the 1993 flood on the Mississippi River was more severe in terms of its magnitude, duration, spatial extent, and its impact on the region.

57
HAZUS FLOOD HAZARD ANALYSIS The Federal Emergency Management Agency (FEMA) has developed and supports the use of HAZUS-MH methodology (http://www.fema.gov/plan/prevent/hazus), which uses geographic information systems (GIS) tools and fiscal data to assess risk in terms of potential losses for a given flood event or other natural disaster scenario. This analysis helps to identify potential impacts of natural hazards for planning and mitigation. Flood Insurance Rate Maps (FIRMs) show the expected extent of flooding inundation. However, risk exposure combines the extent and depth of flooding with social and economic impacts. The HAZUS analyses conducted for Pike County uses the computational power of HAZUS-MH with updated information on essential facilities and flood hazards to provide a solid, consistent framework to quantify the county’s risk. The information generated can be used for planning mitigation efforts in order to reduce risk and for planning emergency response. Furthermore, the objective HAZUS-MH output will provide a baseline for evaluating success in reducing natural hazard risk exposure when conducting future assessments.
The HAZUS-MH assessment is highly data dependent; the accuracy of the analyses depends on a number of important datasets, including essential facilities and general building stock inventories. Use of the national datasets is considered a Level 1 HAZUS-MH analysis. The Pike County HAZUS work included an update of the essential facilities database and use of updated flood data for the Mississippi and Illinois Rivers. The HAZUS analysis was performed to investigate the impact of the 1% annual chance flood (a.k.a. the 100-year flood).
Flooding Hazards Used for Analysis
Pike County has two major sources of flooding with the Mississippi River along the western border and the Illinois River along the eastern border. Flood elevations for both the Mississippi and Illinois Rivers were determined by the January 2004 Upper Mississippi River System Flow Frequency Study (UMRSFFS) (USACE, 2004). The UMRSFFS was developed by five Corps of Engineer Districts (St. Paul, Rock Island, Omaha, Kansas City, St. Louis) and coordinated through representatives from seven federal agencies in seven states. In the HAZUS analyses for flooding from the Mississippi and Illinois Rivers, a flood depth grid was manually generated and then input to HAZUS-MH. The grid was created using 1% annual chance flood elevations at cross sections from the 2004 U.S. Army Corps of Engineers (USACE) UMRSFFS. The elevations were made into a grid, and ground elevations were subtracted, creating a flood depth grid. Ground elevations along the Mississippi River were derived from topographic information supplied by the USACE. Along the Illinois River the United States Geological Survey (USGS) 1/3 ArcSecond National Elevation Dataset (NED) was used for ground elevations.
Three levee systems located within Pike County are currently provisionally accredited with providing protection from the 1% annual chance flood. These systems include the Sny Island Levee System along the Mississippi River, the McGee Creek Levee on the Illinois River and the Valley City Drainage District. Modeling used in the UMRSFFS considered the rivers’ interaction with levees for determining flood elevations. No model data is available representing levee failure scenarios.
Within the area protected by the Sny Island Levee system, there are many areas that are still subject to the 1% annual chance flood due to interior drainage issues. In 2001 the Sny Island Levee and Drainage District Interior Drainage Study was completed by Klingner and Associates to determine flood elevations within the area protected by the Sny Island Levee system; this study was adopted in 2004 by FEMA as regulatory. Data from this study were used to create grids of static 1% annual chance flood elevations, and ground elevations were subtracted, creating a flood depth grid. Ground elevations were derived from topographic information supplied by the USACE.

58
For areas outside of the Mississippi and Illinois River floodplains, and the Sny Island Levee interior drainage areas, HAZUS-MH generated a flood depth grid for the 1% annual chance flood for streams draining 10 square miles or more, based on the USGS 1/3 ArcSecond NED or the 10-meter Digital Elevation Model (DEM).
Building Stock and Inventory Data
Essential facility data are an example of site-specific information used in HAZUS-MH for analysis. Essential facilities include schools, medical care facilities, emergency operation centers, police stations, and fire stations. The HAZUS-MH MR4 (Maintenance Release 4, August 2009) database was modified using community feedback from meetings and the National Geospatial-Intelligence Agency dataset. Locations of these facilities were confirmed using community feedback and Internet mapping services such as Google Maps.
The default HAZUS-MH MR4 General Building Stock (GBS) database used in the analysis includes residential, commercial, industrial, agricultural, religious, government, and educational buildings. Default databases in HAZUS include square footage by occupancy, building count by occupancy, and general occupancy mapping. These data for residential structures are derived from the Census 2000. Data for non-residential structures are derived from Dun & Bradstreet (D&B). Information in the default HAZUS-MH database was adjusted for regional differences using information from three reports from the Department of Energy (DOE). Residential structure characteristics, such as number and size of garages, type of foundation, and number of stories, are modified by region. U.S. Census Bureau data that are publically distributed do not include specific housing information; rather, the data provided are aggregated to the census tract (which has about 4000 people), thus reducing the scale and resolution of flood damage estimates that are building specific.
Loss estimates from HAZUS-MH are based on both site-specific analysis and aggregate analysis. Aggregate loss estimates, including general building stock analysis, are based on the assumption that structures are evenly distributed across census blocks. It is possible to have underestimates of damage in some areas as well as overestimates of damage in other areas. These damage estimates are more reliable over larger areas than at the census-block level. This analysis is meant to assess the risk of flood hazard at the county level in order to serve as a planning aid. Performing a flood analysis at the census-block level with small numbers of buildings makes damage analysis estimates sensitive to rounding errors.
Damages to aggregate building stock are based upon regional models that categorize each building into a structural class. It is assumed that each structural class will respond in a similar way to specific flooding depths. Loss estimates for aggregate structural losses need to be viewed as averages for a group of similar buildings rather than as exact estimates for individual structures.
The estimates of social and economic impacts contained in this report were produced using HAZUS loss estimation methodology software, which is based on current scientific and engineering knowledge. There are uncertainties inherent in any loss-estimation technique. Therefore there may be significant differences between the modeled results contained in this report and the actual social and economic losses following a specific flood.
Essential Facilities List
Table 43 identifies the essential facilities that were used for the analysis. A complete list of the essential facilities is included as Appendix F. A map of all the essential facilities is included as Appendix F.

59
Figure 44: Essential Facilities List
Facility Number of Facilities
Medical Care Facilities 8
Emergency Centers 1
Fire Stations 12
Police Stations 4
Schools 12
General Building Stock
HAZUS estimates that there are 10,669 buildings located within Pike County, which have an aggregate total replacement value of 1,091 million dollars (2006 dollars). Tables 44 and 45 present the relative distribution of the replacement value by general occupancies for all buildings within Pike County and by buildings located in census blocks exposed to the 1% annual chance flood scenario, respectively.
Figure 45: Total Building Exposure for Pike County by Occupancy Type
Occupancy Exposure ($1000) Percent of Total
Residential 815,713 74.80%
Commercial 162,281 14.90%
Industrial 26,619 2.40%
Agricultural 27,370 2.50%
Religion 21,779 2.00%
Government 9,201 0.90%
Education 27,697 2.50%
Total 1,090,660 100.00%
Figure 46: Building Exposure by Occupancy Type for 1% Annual Chance Scenario
Occupancy Exposure ($1000) Percent of Total
Residential 149,661 81.60%
Commercial 13,545 7.40%
Industrial 1,654 0.90%
Agricultural 8,333 4.50%
Religion 4,567 2.50%
Government 2,792 1.50%
Education 2,888 1.60%
Total 183,440 100.00%
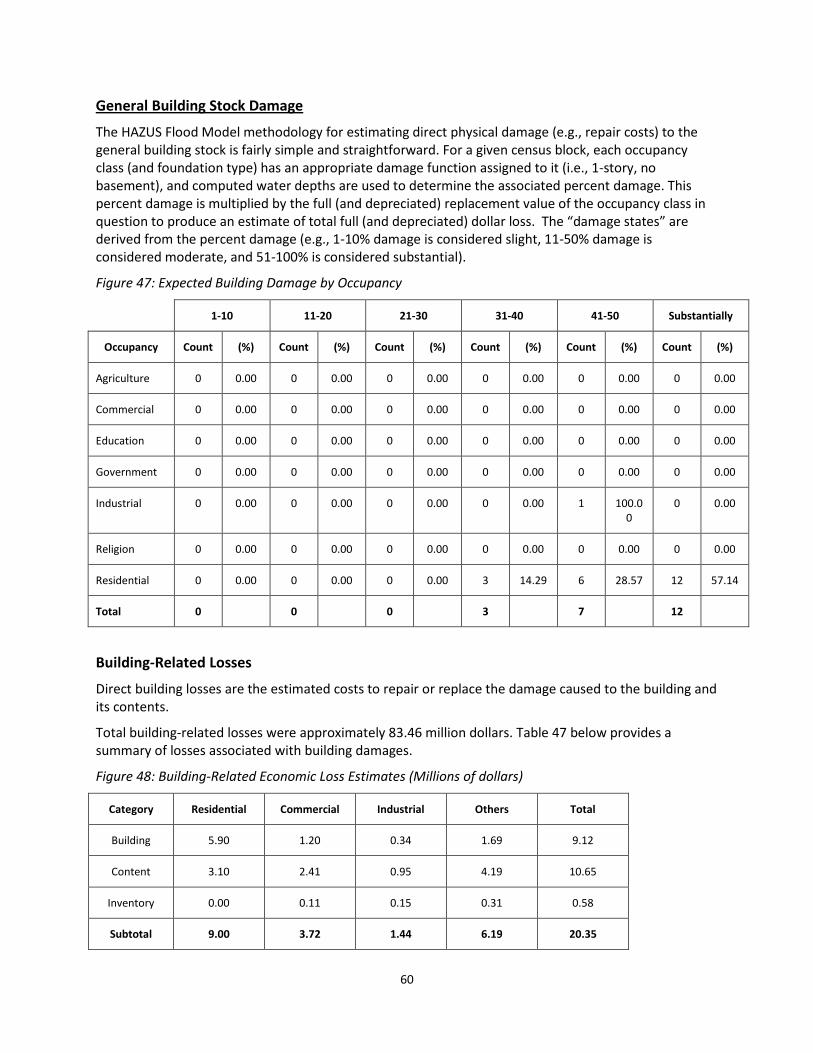
60
General Building Stock Damage
The HAZUS Flood Model methodology for estimating direct physical damage (e.g., repair costs) to the general building stock is fairly simple and straightforward. For a given census block, each occupancy class (and foundation type) has an appropriate damage function assigned to it (i.e., 1-story, no basement), and computed water depths are used to determine the associated percent damage. This percent damage is multiplied by the full (and depreciated) replacement value of the occupancy class in question to produce an estimate of total full (and depreciated) dollar loss. The “damage states” are derived from the percent damage (e.g., 1-10% damage is considered slight, 11-50% damage is considered moderate, and 51-100% is considered substantial).
Figure 47: Expected Building Damage by Occupancy
1-10 11-20 21-30 31-40 41-50 Substantially
Occupancy Count (%) Count (%) Count (%) Count (%) Count (%) Count (%)
Agriculture 0 0.00 0 0.00 0 0.00 0 0.00 0 0.00 0 0.00
Commercial 0 0.00 0 0.00 0 0.00 0 0.00 0 0.00 0 0.00
Education 0 0.00 0 0.00 0 0.00 0 0.00 0 0.00 0 0.00
Government 0 0.00 0 0.00 0 0.00 0 0.00 0 0.00 0 0.00
Industrial 0 0.00 0 0.00 0 0.00 0 0.00 1 100.00
0 0.00
Religion 0 0.00 0 0.00 0 0.00 0 0.00 0 0.00 0 0.00
Residential 0 0.00 0 0.00 0 0.00 3 14.29 6 28.57 12 57.14
Total 0 0 0 3 7 12
Building-Related Losses
Direct building losses are the estimated costs to repair or replace the damage caused to the building and its contents.
Total building-related losses were approximately 83.46 million dollars. Table 47 below provides a summary of losses associated with building damages.
Figure 48: Building-Related Economic Loss Estimates (Millions of dollars)
Category Residential Commercial Industrial Others Total
Building 5.90 1.20 0.34 1.69 9.12
Content 3.10 2.41 0.95 4.19 10.65
Inventory 0.00 0.11 0.15 0.31 0.58
Subtotal 9.00 3.72 1.44 6.19 20.35

61
Shelter Requirements
HAZUS estimates the number of households that are expected to be displaced from their homes due to the flood and the associated potential evacuation. HAZUS also estimates the number of displaced people that will require accommodations in temporary public shelters.
The model estimates 166 households will be displaced due to the flood. Displacement includes households evacuated from within or very near to the inundated area. Of these, 87 people (out of a total population of 17,384) will seek temporary shelter in public shelters.
Debris Generation
HAZUS estimates the amount of debris that will be generated by the flood. The model breaks debris into three general categories: 1) finishes (dry wall, insulation, etc.); 2) structural (wood, brick, etc.); and 3) foundations (concrete slab, concrete block, rebar, etc.). This distinction is made because of the different types of material-handling equipment required to handle the debris.
The model estimates that 2,786 tons of debris will be generated. Finishes compose 39% of the total, and structures compose 33% of the total. If the debris tonnage is converted into an estimated number of truckloads, it will require 111 truckloads (@ 25 tons/truck) to remove the debris generated by the flood.
Levee Risk Consideration
Levees reduce the risk of flooding, but no levee system can eliminate all flood risk. There is always the chance that a flood will occur that exceeds the design capacity of a levee. Levees do not always perform as intended and may fail during a smaller event than its design. (ASCE 2010)
In order to provide a reasonable basis for planning in the event of levee overtopping or failure, the estimated value of buildings protected by each levee system were calculated (see Tables 48 and 49). Essential facilities and facilities of local importance located in protected areas were also identified to be at risk in case of levee overtopping or failure (Table 50). A map showing the location of the essential facilities at risk in case of levee failure or overtopping is also included in Appendix F.
To determine the value of buildings protected by these levee systems, numbers were derived from the aggregate building replacement value (2006 dollars) found in the HAZUS General Building Stock Inventory.
Methodology for deriving the values is as follows:

62
Figure 49: Total Building Exposure for Sny Island Levee System Protected Area by Occupancy Type
Occupancy Exposure ($1000) Percent of Total
Residential 79,029 83.95%
Commercial 6,861 7.30%
Industrial 321 0.34%
Agricultural 2,516 2.67%
Religion 2,636 2.80%
Government 915 0.97%
Education 1,859 1.97%
Total 94,137 100.00%
Figure 50: Total Building Exposure for McGee Creek Levee Protected Area by Occupancy Type
Occupancy Exposure ($1000) Percent of Total
Residential 182 34.54%
Commercial 72 13.66%
Industrial 0 0.00%
Agricultural 207 39.28%
Religion 62 11.76%
Government 4 0.76%
Education 0 0.00%
Total 527 100.00%

63
Figure 51: Essential Facilities and Facilities of Local Importance Located in a Levee Protected Area
EMERGENCY OPERATIONS CENTER POTABLE WATER FACILITIES
Community Name of Facility Community Name of Facility
New Canton Pike County Emergency Operations Center Hull Hull Water Treatment Plant
Hull Hull Well No. 4
FIRE FACILITIES Hull Hull Well No. 5
Community Name of Facility New Canton New Canton Well No. 1
Hull Hull-Kinderhook Fire Protection Dist. New Canton New Canton Well No. 3
New Canton New Canton Fire Protection District Pleasant Hill Pleasant Hill Community Well
New Canton Pike Co Volunteer Emergency Corps Pleasant Hill Pleasant Hill Water Treatment Plant
Pleasant Hill Pleasant Hill Fire Protection District Pleasant Hill Pleasant Hill Well No. 2
Pleasant Hill Pleasant Hill Well No. 3
SCHOOL FACILITIES Pleasant Hill Pleasant Hill Well No. 4
Community Name of Facility
Hull
Pleasant Hill
Elementary School
Pleasant Hill Elementary School
WASTE WATER FACILITIES
Community Name of Facility
PLACES OF LARGE ASSEMBLY Hull Hull Sewage Treatment Plant
Community Name of Facility New Canton New Canton Water Treatment Plant
Pleasant Hill Pike County Fairgrounds Pleasant Hill Pleasant Hill Sewage Treatment Plant
Maps of identified facilities can be found in Appendix F.

64
More than 100 levees are located along the Mississippi River from Dubuque, Iowa to Cairo, Illinois. Most of these levees were built to protect agricultural land; notable exceptions include those in the St. Louis metro and Quad Cities areas, which were built to protect urban areas.
LEVEES
During the 2008 June floods, a number of levees overtopped or breached. It is important to note that overtopping is not considered a failure. Levees are designed and built for a certain level of protection. When flood conditions exceed that level, the levee has provided the intended level of protection and may then be overtopped per its design. Typically levees that protect primarily agricultural areas are designed for more frequent floods than those protecting urban or more highly populated areas.
In total, 26 levees overtopped or breached along the Mississippi River between Rock Island, Illinois and St. Louis, Missouri. Six of the 26 overtopped or breached levee systems are located in Illinois. Breached or overtopped levees along the Mississippi River impacted river levels at nearby locations, as well as downstream. On June 17 across the river from Burlington, Iowa, two levees near the Illinois community of Gulfport were overtopped. This caused a sudden drop in river levels near Henderson County and further downstream. The Des Moines River flows into the Mississippi River less than 3 miles downstream from the Keokuk gage. There were multiple levee over-toppings and breaches on both sides of the Mississippi River downstream of this location.

65
CHAPTER 3 – MITIGATION STRATEGY
PIKE COUNTY LOCAL HAZARD MITIGATION GOALS AND OBJECTIVES
After having reviewed the risk assessments for each hazard and the results of the citizen survey, documented existing plans and ordinances, identified critical facilities, and confirmed socioeconomic data the Task Force met to formulate goals and objectives for the plan.
Goal 1: Protecting Life and Property
Protect the lives, health and property of the citizens of Pike County from the effects of natural hazards.
Objective 1.a. Implement procedures and actions that will protect life and property in the event of a natural hazard. This includes making homes, businesses, infrastructure, and other types of property less prone to natural hazard damage.
Objective 1.b. Identify areas that have been repeatedly damaged in natural hazards and suggest alternative locations or other actions that might limit that susceptibility.
Objective 1.c. Increase awareness about insurance availability for catastrophic hazards.
Objective 1.d. Encourage procedures designed to minimize risk by supporting development plans that take natural hazards into account.
Goal 2: Awareness and Education
Increase public awareness and education of the resources available to minimize the impact of natural hazards on life, property, and livelihood.
Objective 2.a. Design and implement natural hazard education programs for the citizens of Pike County
Objective 2.b. Create natural hazard mitigation resources (brochures, websites, etc.) for the public
Goal 3: Cooperation and Communication
Develop and promoted improved cooperation and communication between citizens, local government, and agencies to streamline response activities in the event of a natural hazard.
Objective 3.a. Develop communication and coordination systems for the various agencies potentially involved in natural hazard mitigation.
Objective 3.b. Maintain and improve communication and cooperation between residents, government, and the private sector
Objective 3.c. Incorporate natural hazard mitigation into community plans and regulations
Goal 4: Protect Future Development
Incorporate natural hazard mitigation into future development and community planning to minimize the potential damage from natural hazards.

66
Goal 5: Protect Infrastructure
Protect existing infrastructure including public facilities and utilities from the effects of natural hazards.
Objective 5.a. Insure that all infrastructures are safe and up to current code.
Objective 5.b. Insure a safe and adequate water supply throughout the county.
Objective 5.c. Insure the safety of all small bridges and township roads.
Objective 5.d. Establish and evaluate watershed management issues.
Objective 5.e. Investigate and incorporate alternative power sources throughout the county.
MITIGATION ACTIONS – PRIORITIES AND IMPLEMENTATION The list of project samples were presented to the Steering Committee. It was suggested to the community representatives that the list be used as a basis for discussion with community leaders on projects that would be appropriate for their village or city. The project ideas came from people who had spent several months considering the subject of natural hazards. Of course, communities were not limited to the projects on the list.
The projects were prioritized within the county by using the following method. It is important to recognize that the implementation of all actions is desirable regardless of prioritized order. Actions assigned to Priority A have a permanent or more far-reaching affect than actions under Priority B, although both address the most significant natural hazards in the County. Priority C actions all address the less significant natural hazards. Priority J actions are ready for implementation within the next year and can be accomplished within existing budgets. All actions will aid in the mitigation effort and should be implemented as opportunities arise.
Project Prioritization Method
Priority A projects permanently eliminate property damages and/or eliminate or reduce injuries and deaths in a specific area OR have a high probability to systematically reduce property damages, injuries and deaths across a wide area. Priority A projects address the most significant natural hazards – extreme heat, flood, severe storm, tornado, and winter storm.
Priority B projects reduce property damages in a specific area OR have the potential to reduce property damages, injuries and deaths across a wide area OR educate the public on disaster preparedness and mitigation. Priority B projects address the most significant natural hazards – extreme heat, flood, severe storm, tornado, and winter storm.
Priority C projects eliminate or reduce property damages, injuries and deaths from the less significant natural hazards OR educate the public on disaster preparedness and mitigation related to the less significant natural hazards – dam failure, drought, earthquake and mine subsidence.
Priority J projects can “just be done” without requiring outside funding and are able to be implemented within one year of Plan adoption. These can be one-time projects or ongoing projects and may address any hazard.

67
COST/BENEFIT ANALYSIS A cost/benefit analysis will be needed for any of these projects to be implemented. A cost/benefit analysis will be performed at the time of project selection. The committee assigned preliminary cost/benefit assessments to each identified project, using general terms of high, medium, and low related to both the cost and benefit. A high rating on cost means it is unlikely the jurisdiction could accomplish the project without outside funding, while a high rating on benefit relates to how well the project would mitigate the situation. A low cost rating, conversely, means that is likely the jurisdiction can accomplish the project without outside funding.

68
JURISDICTIONAL PROJECT GRID In the project grid below, whenever Pike County is listed alone, the implication is that the project would apply to unincorporated areas. Specific municipalities are listed if their representatives identified the project as needed in their respective communities. Whenever ‘ALL’ is included under community it signifies value for that project to all incorporated municipalities in the county.
In the following Project Grid, the codes under Hazard are: F = Flood; FF -= Flash Flooding; T = Tornado; SS = Severe Storms; ET = Extreme Temperatures; E = Earthquake; and D = Drought. The codes under Benefit / Cost are: H = High; M = Medium; and L = Low. Whenever ESDA Director is cited under Lead / Contact, the implication is that person will be assisted by the municipal employees assigned that role as well who meet regularly with the County ESDA Director.
Figure52: Pike County / Jurisdictional Project Grid
Goal Community Project Type
Hazard Possible Funding
Project Priority Lead / Contact Proposed Schedule
Benefit / Cost
4 Pike County Coordination All Local Establish Multi-Jurisdictional Long Term Recovery / Mitigation Committee to coordinate and guide long term recovery efforts and mitigation activities within the county. Responsibilities will include, but are will not be limited to: 1) Host annual Mitigation Plan Meeting as required by FEMA; 2) Meet semi-annually to review progress, identify new funding streams and projects being initiated within the county; 3) coordinate and lead the long term economic recovery of the county from the floods of 2008.
J County Board Chair
2010 H/L
3b Pike County; ALL
Emergency Management
T / SS Funding Search
Establish a county wide early warning system for natural hazards.
B ESDA Director 2010-2011 H/H
2a
2b
Pike County; ALL
Education All Local Develop and conduct a citizen awareness campaign regarding protection from natural hazards
B ESDA Director / Public Health Dept / Extension / Red Cross
2010-2015 H/L
3a Pike County; ALL
Emergency Management
All Funding Search
Identify and implement an improved emergency response communication system
B ESDA Director / Emergency Responders
2010-2012 H/H
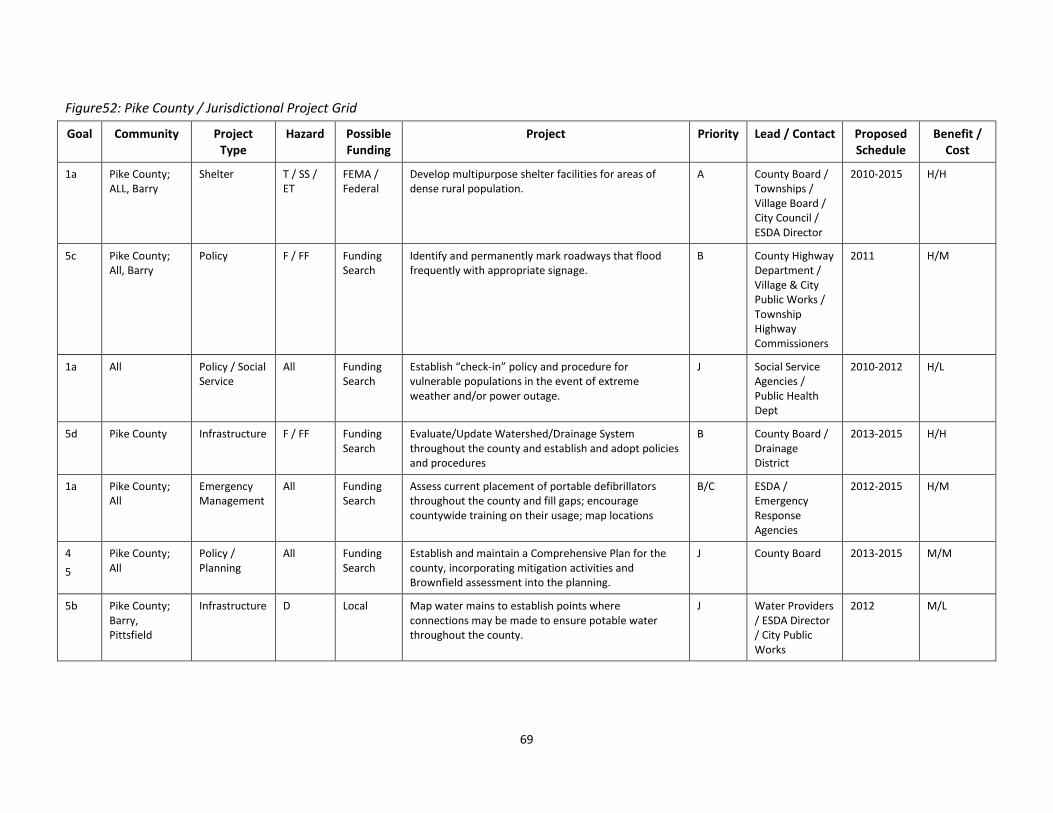
69
Figure52: Pike County / Jurisdictional Project Grid
Goal Community Project Type
Hazard Possible Funding
Project Priority Lead / Contact Proposed Schedule
Benefit / Cost
1a Pike County; ALL, Barry
Shelter T / SS / ET
FEMA / Federal
Develop multipurpose shelter facilities for areas of dense rural population.
A County Board / Townships / Village Board / City Council / ESDA Director
2010-2015 H/H
5c Pike County; All, Barry
Policy F / FF Funding Search
Identify and permanently mark roadways that flood frequently with appropriate signage.
B County Highway Department / Village & City Public Works / Township Highway Commissioners
2011 H/M
1a All Policy / Social Service
All Funding Search
Establish “check-in” policy and procedure for vulnerable populations in the event of extreme weather and/or power outage.
J Social Service Agencies / Public Health Dept
2010-2012 H/L
5d Pike County Infrastructure F / FF Funding Search
Evaluate/Update Watershed/Drainage System throughout the county and establish and adopt policies and procedures
B County Board / Drainage District
2013-2015 H/H
1a Pike County; All
Emergency Management
All Funding Search
Assess current placement of portable defibrillators throughout the county and fill gaps; encourage countywide training on their usage; map locations
B/C ESDA / Emergency Response Agencies
2012-2015 H/M
4
5
Pike County; All
Policy / Planning
All Funding Search
Establish and maintain a Comprehensive Plan for the county, incorporating mitigation activities and Brownfield assessment into the planning.
J County Board 2013-2015 M/M
5b Pike County; Barry, Pittsfield
Infrastructure D Local Map water mains to establish points where connections may be made to ensure potable water throughout the county.
J Water Providers / ESDA Director / City Public Works
2012 M/L

70
Figure52: Pike County / Jurisdictional Project Grid
Goal Community Project Type
Hazard Possible Funding
Project Priority Lead / Contact Proposed Schedule
Benefit / Cost
3b Pike County; All
Emergency Management
All Local Establish an enhanced Mutual Aid Agreement throughout the county.
J ESDA Director / Emergency Response Agencies
2010 M/L
3a Pike County; All
Policy / Emergency Management
All Local Update NIMS Training for elected and appointed officials.
J ESDA Director / County Officials
2010 H/L
3b Pike County; All
Policy All Local Establish policies and procedures for documenting volunteer hours in disaster response.
J ESDA Director 2010-2011 H/L
5 Pike County; All
Policy F Local Maintain NFIP Participation Status; adopt or amend floodplain management regulations to comply with NFIP requirements and review periodically
J County Board / City Councils / Village Boards
Ongoing H/L
5a Pike County; Policy All Local Review and update Building Codes to ensure that newly constructed dwellings, infrastructure, and public facilities are designed and built to be disaster resistant.
B/C County Board / City Councils / Village Boards
2010-2015 H/L
1a Pike County; All, Barry, Pittsfield
Infrastructure T / SS Local Tree Program – removal of old trees, pruning / topping B County Board / City Councils / Village Boards
Ongoing M/M
1a Pike County; All, Barry, Griggsville, Pittsfield, Pleasant Hill
Infrastructure All Funding Search
Backup generator: inventory existing stock, determine both new and replacement needs and cost
B County Board 2011-2015 H/H
3b Pike County; All
Infrastructure All Funding Search
Reverse 911 contact system for public notification by Sheriff’s Department
B County Board 2013 H/H
5d Pike County; Infrastructure FF Local Dredging of small streams J County Board / City Councils / Village Boards / Public Works Dept
Ongoing M/M

71
Figure52: Pike County / Jurisdictional Project Grid
Goal Community Project Type
Hazard Possible Funding
Project Priority Lead / Contact Proposed Schedule
Benefit / Cost
1a
4
Pike County; Policy / Infrastructure
T / SS Funding Search
Require the construction of storm shelters in existing and new mobile home developments
A County Board / City Councils / Village Boards
2012 H/H
1a
4
Pike County; All
Policy All Local Establish animal management system J County Board / City Councils / Village Boards / Humane Society
2011-2012 H/L
2a
2b
Pike County; All
Education All Local Educate public and disseminate information regarding all hazards to population through town hall meetings, presentations to groups, and displays
B/C ESDA Director Ongoing H/L
3b Pike County; All
Emergency Management
All Local Encourage the use of NOAA all-hazard radios in residences and business throughout unincorporated area
B ESDA Director Ongoing H/L
3b Pike County; All
Education All Local Provide information to local cable and public radio and television stations regarding emergency warning and public service announcements
B/C ESDA Director Ongoing H/L
2b Pike County; All
Education All Local Distribute information regarding hazards and safety procedures to all school districts annually
B/C ESDA Director Ongoing H/L
5c Pike County Infrastructure SS / FF Local Identify and prioritize needed improvements to county maintained roads that flood in heavy rainstorms, blocking or impairing road use and through access by vehicular traffic
J County Highway Dept
2011 H/L
5d Pike County Policy F / FF Local Research potential funding sources to acquire information regarding boundaries of the floodway and floodplain throughout unincorporated areas of the county
J ESDA Director Ongoing H/L
5a Pike County; All
Policy T / SS / E Local Adopt building regulations that require wind-resistant and earthquake-resistant construction measures for critical facilities that house vulnerable populations or that house volatile liquids or hazardous waste
B/C County Board / City Council / Village Board
2012-2014 H/L
3a Pike County Education T / SS Local Maintain and educate Storm Spotter program volunteers
B ESDA Director Ongoing H/L

72
Figure52: Pike County / Jurisdictional Project Grid
Goal Community Project Type
Hazard Possible Funding
Project Priority Lead / Contact Proposed Schedule
Benefit / Cost
1a Pike County; All
Infrastructure T / SS / ET
Local Identify existing buildings as heating / cooling / storm shelters for vulnerable populations; create map(s) and make available to public
B ESDA Director / City Council / Village Board
2011 H/L
3a Pike County; All
Emergency Management
All Local Adopt policies and procedures delineating chain of command for emergency situations.
B/C ESDA / Village Board
2010 H/L
3a
3b
Pike County; All
Education All Local Educate employees, officials and community volunteers on the protocol developed for emergency situations.
J ESDA / County Health Dept / Extension
2010 H/L
3b Pike County; All
Education All Local Develop public education campaign to inform residents on what to do and where to go in the event of an emergency.
J ESDA / County Health Dept / Extension
2010-2015 H/L
3a Pike County; All
Emergency Management
All Local Participate in county-wide Mutual Aid Agreement and Multi-jurisdictional Hazard Mitigation Implementation Committee.
J Village Board / ESDA
2010 on M/L
2b Pike County; All
Education All Local Develop comprehensive list of resources from within and outside of the county that can be used for emergency situations.
J County Board/City Council/Village Board/ESDA Director
2010-2011 H/L
5c Barry Infrastructure All Funding Search/ Local
Replace older culverts in the community B City Council Ongoing M/M
5b Barry Infrastructure All Funding Search
Develop new lift station to accommodate new waste stream and groundwater infiltration.
B City Council 2012-2015 H/H
73
CHAPTER 4 – MONITORING, EVALUATING, MAINTENANCE STRATEGY
A crucial element of the Pike County Hazard Mitigation Plan is the maintenance and implementation of the plan. The Pike County Emergency Services Director will be responsible for the record keeping and maintenance of the plan. This responsibility will include calling and facilitating the annual plan meeting, surveying the participating jurisdictions for progress on jurisdictional goals, and maintaining detailed records for plan updates.
There are currently regular meetings held with all municipal ESDA Coordinators attending, and maintenance will become a regular agenda item. One such meeting will be designated as the annual meeting of the planning committee. At that time the Pike County ESDA Director will facilitate discussion surrounding the progress of established goals from the FEMA approved plan, assist with the identification of new and emerging project ideas from each of the communities, and facilitate discussion of new issues that may have arisen of the past year that affect the plan. Additional municipal representatives will be encouraged to attend, especially members of the respective governing boards, so that communication can be eased.
Records of these annual meetings will be maintained within the Pike County ESDA office, and compiled for plan updates within the five year update time frame. In addition to maintaining records for the plan updates, the ESDA Director will also serve as a resource for the participating jurisdictions to identify potential funding streams for identified projects within the plan, and referring communities to resources and assistance to moving projects from plan to completion.
Under the current Flood Map, the communities of Florence, Hull, Nebo, New Canton, Pearl, Pleasant Hill, Valley City and Pike County, participate in the National Flood Insurance Program (NFIP). Maintaining active status in NFIP will be a portion of the plan maintenance strategy. Jurisdictions adopting the plan are required to maintain active status to continue to be covered by the plan. This continued participation will be monitored by the ESDA Director.
The ESDA Director will also provide assistance and guidance to each jurisdiction in additional planning processes, ensuring that the components of newly developed plans and ordinances are consistent with the components of the Multi-Jurisdictional Hazard Mitigation Plan. This will provide a resource for jurisdictions in planning activities such as comprehensive planning, strategic planning, or other plans that may be developed by participating jurisdictions.

74
(THIS PAGE LEFT INTENTIONALLY BLANK.)

75
APPENDIX
DOCUMENTS PAGES
A - Jurisdictional Participation 76
B - Media 81
C - Public Participation 87
D - Match Log 97
E - Sample Mutual Aid Agreement 98
F - Essential Facilities and Facilities of Local Importance 100
G - Maps of Participating Jurisdictions 108

76
APPENDIX A: JURISDICTIONAL PARTICIPATION
A.1 INITIAL LETTER OF INVITATION
Dear Mayor / Village President:
Pike County is currently in the process of compiling a Multi-jurisdictional Hazard Mitigation Plan. It is critical for municipalities to participate in the planning meetings in order to be included in the plan. Municipalities must have a mitigation plan in place in order to apply for future disaster mitigation grants should a federally declared disaster impact the community according to the Disaster Mitigation Act of 2000 (DM2K). The finished plan will allow communities to have potential projects listed with FEMA should funding become available. Projects vary but could include a multi-purpose building which could serve as tornado/severe storm shelter and/or heating and cooling stations, culvert clean-up, or storm water management. These are common projects resulting from disaster mitigation grants.
The Hazard Mitigation Steering Committee is meeting monthly to work through the information needed for the plan. A form is included to officially designate representatives for your community. The meetings are at noon at the Pike County Farm Bureau Building on April 15 and May 20. There will be Public Forums held throughout the county during this process, as well as focus group meetings which will be held in June. The plan will be completed by September.
In order for a jurisdiction to sign off on the final plan, a representative from each municipality must at least attend one committee meeting and a public forum. Although the required participation is low, it is strongly recommended that municipalities take a more active role in order to make sure their local needs and concerns are being addressed.
The county received FEMA grant funds to complete this plan therefore there is no out-of-pocket expense, however a local match is required. This local match is being provided through in-kind of County staff, local officials, and the community at large.
Please plan to designate a representative to participate on the Pike County Local Hazard Mitigation Planning Committee to help guide this process as the plan is developed. This involvement will be counted toward the required participation on behalf of your municipality as well as to help contribute to the in-kind local match.
If you would like more information about the planning process, please contact Stephanie Dehart ([email protected]) or Jennifer Mowen ([email protected]) at 285-5543.
Sincerely,
Scott Syrcle, Chairman Pike County Board

77
A.2 SAMPLE PARTICIPATION RESOLUTION
WHEREAS, adopting a natural hazards mitigation plan would benefit the City/Village of ____________________ by identifying activities that could mitigate the impact of hazards events on the citizens of the City/Village and provide eligibility for the City/Village to receive federal hazard mitigation grant funding; and
WHEREAS, the City/Village of ____________________ has limited resources to undertake the preparation of a hazards mitigation plan; and
WHEREAS, Pike County has received a grant from the Federal Emergency Management Agency to prepare a multi-jurisdictional hazards mitigation plan for Hancock County; and
WHEREAS, University of Illinois Extension is preparing a multi-jurisdictional hazards mitigation plan in accordance with 44 FEMA requirements at 44.C.F.R. 201.6; and
WHEREAS, University of Illinois Extension will provide opportunities for public participation and comment during the planning process and prior to adoption;
NOW THEREFORE, the ____________________ City Council / Village Board authorizes Pike County on behalf of the City/Village of ____________________ to prepare the Pike County Multi-jurisdictional Local Hazards Mitigation Plan which shall be reviewed and considered for adoption by the ____________________ City Council / Village Board upon completion. A representative from the City/Village of ____________________ will be appointed by the Mayor/Village President to participate in meetings, provide information needed for the plan, facilitate opportunities for public involvement, and act as a liaison between the multi-jurisdictional hazards mitigation planning steering committees and the City Council / Village Board.
ADOPTED this __________ day of __________, 2010 at the meeting of the __________ City Council / Village Board.
(Signature)
Mayor/Village President, City/Village of ______________________________

78
A.3 SAMPLE CONTACT FORM
PIKE COUNTY MULTI-JURISDICTIONAL LOCAL HAZARD MITIGATION PLANNING STEERING COMMITTEE
CONTACT INFORMATION – CITY / VILLAGE OF
, Mayor / Village President
(print name)
Address:
Phone: Email:
REPRESENTATIVE(S) APPOINTED TO MULTI-JURISDICTIONAL HAZARDS MITIGATION PLANNING STEERING COMMITTEE:
Primary:
Name:
Address:
Phone: Email:
Additional:
Name:
Address:
Phone: Email:
The above names person(s) is/are authorized to represent the City/Village of on the Pike County Multi-Jurisdictional Local Hazard Mitigation Planning Steering Committee and will participate in all activities associated with development of the Plan.
(signature)
__________, Mayor/Village President

79
A.4 SAMPLE STEERING COMMITTEE MINUTES
Pike County Hazard Mitigation Steering Committee Tuesday, February 16, 2010
12:00 p.m. MINUTES
• Chair Jim Sheppard welcomed everyone and led the group in introductions. Stephanie Dehart and
Jennifer Mowen reviewed why the Hazard Mitigation Plan is being developed and an overview of the process thus far.
• Jennifer Mowen distributed additional match cards and reviewed that we are required to show a 25% match for Pike County. We will do so by tracking volunteer time either at each committee member’s salary rate or at the allowed $10 per hour rate for volunteers. Each jurisdiction is expected to attend at least one planning meeting, participate with the focus groups meeting in their area of interest, and attend at least one of the public meetings. The committee was reminded thought that this plan will be based on what comes out of the meetings therefore participation is crucial despite the participation requirements.
• The documentation to be collected for each jurisdiction was discussed. Stephanie and Jennifer requested that they be provided with a copy of these planning and zoning documents as applicable for each jurisdiction. A list of plans will be distributed.
• Stephanie and Jennifer reviewed the meeting schedule for the planning process. The committee will meet on the third Thursday of the month at noon at the Pike County Farm Bureau building. Four public meetings will be held in April (each from 6-8 p.m.) and focus groups will meet in May and/or June before an additional round of public meetings, likely in August, to review the draft plan. Both rounds of public meetings will be held throughout the county with one in each school district. Focus group topics will include Ag and Natural Resources, Health and Human Services, Transportation, Utilities, Public Safety, Government, Business Development, Education and History, and Communications.
• The public survey goal is 750. The survey has been modified based on suggestions from the January meeting and is now online at https://www.surveymonkey.com/s/JRZNXR9 . Distribution of the surveys, especially paper copies, will be concurrent with the first series of public meetings in April.
• Copies of the critical facilities list as available from HAZUS were distributed. Committee members discussed additional facilities that needed to be added including potable water facilities, waste treatment facilities, police facilities, fire departments, schools, emergency centers, vulnerable population centers, public housing, places of interest for historical or economic value, emergency shelters, and places of large assembly. Several adjustments were made to the list immediately. Committee members were asked to consider the list of critical facilities over the next month within their jurisdictions. The list will be updated at the next meeting.
• Either a link to other plans or pdf files of other plans will be provided to committee members prior to the March meeting. A request was made to add fire departments/districts to the committee list.
• The committee will meet again at noon on March 18 for the Risk Assessment meeting with Illinois Water Survey staff in attendance.
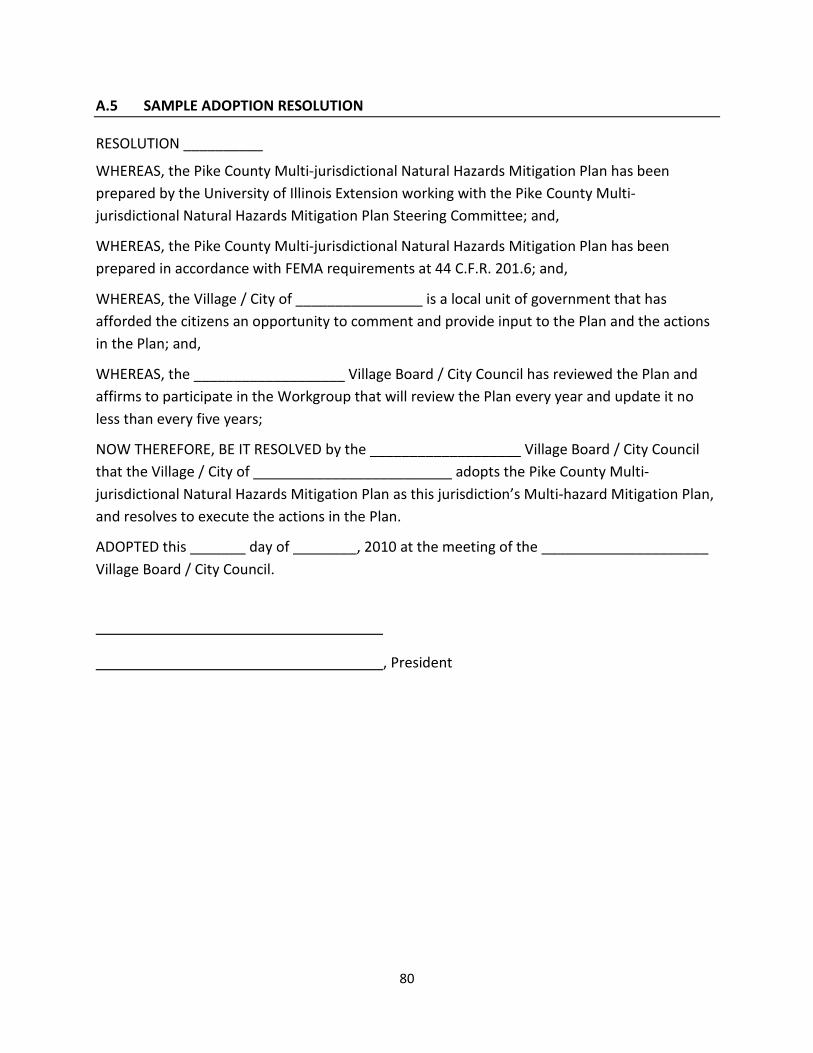
80
A.5 SAMPLE ADOPTION RESOLUTION
RESOLUTION __________
WHEREAS, the Pike County Multi-jurisdictional Natural Hazards Mitigation Plan has been prepared by the University of Illinois Extension working with the Pike County Multi-jurisdictional Natural Hazards Mitigation Plan Steering Committee; and,
WHEREAS, the Pike County Multi-jurisdictional Natural Hazards Mitigation Plan has been prepared in accordance with FEMA requirements at 44 C.F.R. 201.6; and,
WHEREAS, the Village / City of ________________ is a local unit of government that has afforded the citizens an opportunity to comment and provide input to the Plan and the actions in the Plan; and,
WHEREAS, the ___________________ Village Board / City Council has reviewed the Plan and affirms to participate in the Workgroup that will review the Plan every year and update it no less than every five years;
NOW THEREFORE, BE IT RESOLVED by the ___________________ Village Board / City Council that the Village / City of _________________________ adopts the Pike County Multi-jurisdictional Natural Hazards Mitigation Plan as this jurisdiction’s Multi-hazard Mitigation Plan, and resolves to execute the actions in the Plan.
ADOPTED this _______ day of ________, 2010 at the meeting of the _____________________ Village Board / City Council.
, President

81
APPENDIX B: MEDIA
B.1 PRESS RELEASES
For Immediate Release Contact: Jennifer Mowen [email protected] 217-285-5543
County Disaster Planning Group Needs Input
Public Forums Scheduled
Pike County was recently awarded a Hazard Mitigation Planning grant from the Federal Emergency Management Agency (FEMA). A Planning Committee composed of representatives from participating municipalities and agencies has been meeting for several months, guiding the process of collecting information about various needs and potential projects to include in the final report.
Hazard mitigation refers to long-term or permanent measures to reduce disaster damages to people or property through avoiding the hazard risk or reducing the vulnerability. By reducing potential damages, communities increase their safety and economic stability. The purpose of this plan for the county and participating communities is to reduce the loss of life and property due to natural disasters by identifying mitigation measures that can be implemented prior to a disaster. Who should get involved with hazard mitigation planning? Local Officials; Community Planners; Emergency Managers; Floodplain Administrators; Building Departments and Housing Offices; General Public; Businesses; Nonprofit Organizations; Schools and Universities. And you.
FEMA places a great deal of importance on public participation in the development of these plans. There have been community meetings held around the county, as well as a series of focus groups targeted at specific populations. Now there will be an opportunity for anyone living in Pike County to provide information by attending one of four public forums.
The forums will be held as follows: • May 3, Griggsville City Hall • May 5, Pleasant Hill Village Office • May 6, Pike County Farm Bureau Auditorium, Pittsfield • May 12, Barry Community Center (formerly Holy Redeemer Catholic Church)

82
All public forums will be held from 6-8 p.m. with an open house format allowing residents to walk through and view maps, ask questions, and provide suggestions and comments at any point within the two hour timeframe. For more information contact Jennifer Mowen at (217) 285-5543 or email [email protected].
###

83
For Immediate Release Contact: Jennifer Mowen [email protected] (217-285-5543)
Hazard Mitigation Plan Ready for Review Public Hearing Scheduled for Thursday, October 21
The draft version of the local hazard mitigation plan for Pike County will be available for public viewing starting Wednesday, October 20. Copies will be provided to the participating municipalities for citizens to view at the various Village Offices and City Halls. In addition, there will be a copy available for viewing or download from the website of University of Illinois Extension – Pike County (http://www.extension.uiuc.edu/Pike by October 25.
On Thursday, October 21 there will be a public hearing for comments on the draft plan which will be followed by a meeting of the Planning Steering Committee for additional comments and adoption of the draft so that it can be transmitted to the Federal Emergency Management Administration (FEMA) for their review and approval. The public hearing will start at 11:00 am and the Steering Committee at 12:00 pm. Both meetings will take place at the University of Illinois Extension Office in Pittsfield. For more information call Jennifer Mowen at (217) 284-5543 or email [email protected].
Hazard mitigation refers to long-term or permanent measures to reduce disaster damages to people or property through avoiding the hazard risk or reducing the vulnerability. By reducing potential damages, communities increase their safety and economic stability.
The advantages of having a hazard mitigation plan include protecting citizens and property from the effects of hazards such as tornadoes, flooding and winter storms. Any community that has a hazard mitigation plan that is compliant with the Disaster Mitigation Act of 2000 will be eligible for hazard mitigation grant money from FEMA. The purpose of this plan is to reduce the loss of life and property due to natural disasters by identifying mitigation measures that can be implemented prior to a disaster.
Facilitated by University of Illinois Extension, this process has taken the better part of a year. The Illinois State Water Survey has also contributed a significant piece of the plan by identifying the level of risk for the identified hazards.
FEMA places a great deal of importance on public participation in the development of these plans. In addition to the steering committee, with representatives from each participating community in the county that chooses to participate, participation has come through surveys, attending focus groups, and community meetings. County Emergency Services and Disaster Assistance (ESDA) Director Herman Allensworth and others designated by county municipalities as the local ESDA coordinator have provided great levels of assistance and commitment to this planning effort.

84
B.2 NEWSPAPER ARTICLES
Hearings next step in developing hazard mitigation plan Published: 10/17/2010 | Updated: 10/16/2010
By DEBORAH GERTZ HUSAR Herald-Whig Staff Writer
PITTSFIELD, Ill. -- A series of public hearings is the next step in finalizing Pike County's hazard mitigation plan.
A draft of the plan will be available at the hearings set for Wednesday and Thursday in Pleasant Hill, Barry, Griggsville and Pittsfield.
"We're still looking for overall comments and any changes folks would like to see incorporated in the plan," said Stephanie Dehart, University of Illinois Extension community and economic development educator in Pike County.
The open house-style hearings will allow people to ask questions, review the draft plan and stay just a few minutes or the full hour.
The hearings are one of the final steps in developing the plan targeting long-term or permanent measures to reduce disaster damages to people or property through avoiding the hazard risk or reducing the vulnerability.
A hazard mitigation planning grant from the Federal Emergency Management Agency covers the cost of developing the plan. A steering committee composed of representatives from participating municipalities and agencies has been meeting since January to guide the process of collecting information about various needs and potential projects to include in the final report.
Top priorities in the planning process involved looking at critical facilities, such as water plants, and endangered populations, such as nursing homes, which will need additional help in the event of an emergency relocation.
The county and incorporated communities must sign off on the emergency preparedness plan to be able to access any FEMA funding.
Extension works with counties to develop the mitigation plans.
Dehart wrote the Pike County plan, while Jennifer Mowen, Extension county director in Pike, works with the hazard mitigation steering committee.
The plan will be updated with changes suggested at the hearings, then submitted to the Illinois Emergency Management Agency for review and FEMA.
"Once we have their approval, it will come back to the county. The jurisdictions will have to individually sign off on them," Dehart said. "Once that is in place, there will be one more overall review by FEMA, and we'll be good to go."
Officials will discuss updates to the plan on an annual basis.
"Each jurisdiction had to devise projects for the plan -- everything from what they could do on their own without additional funding to those big projects that take funding to do down the road," Dehart said.
"Each year, we'll update whether any of those have been completed and determine if any new projects should be added to those listed."

85

86
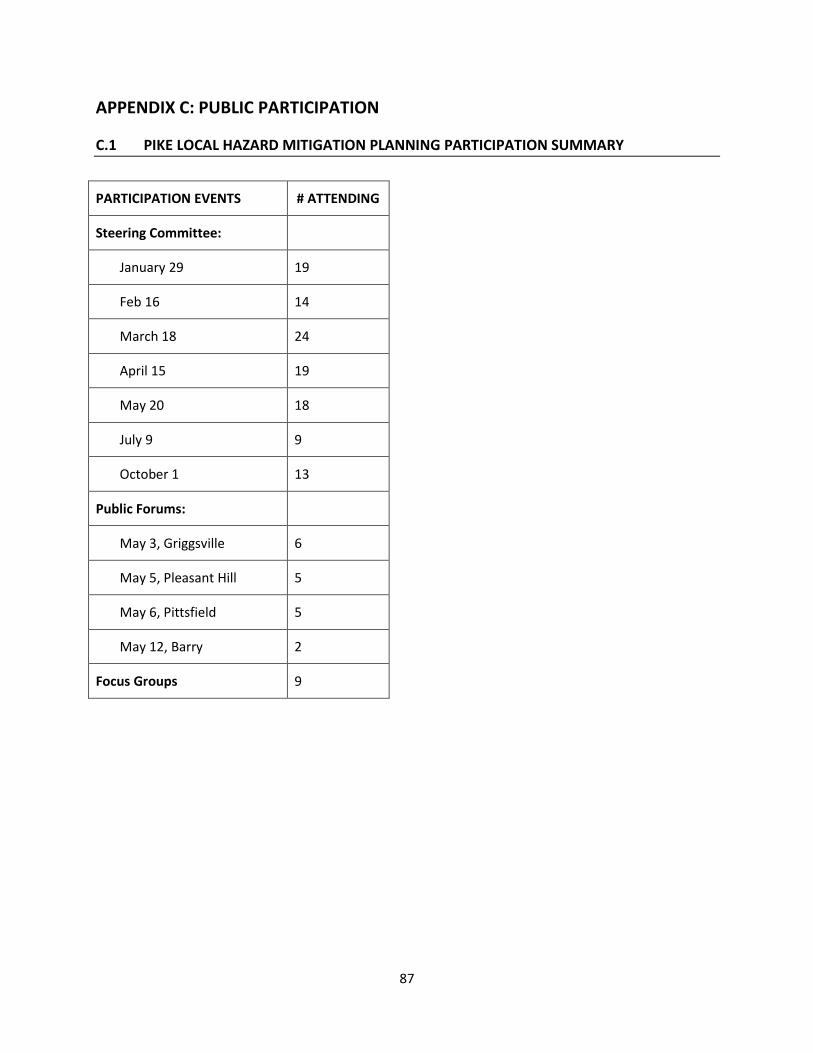
87
APPENDIX C: PUBLIC PARTICIPATION
C.1 PIKE LOCAL HAZARD MITIGATION PLANNING PARTICIPATION SUMMARY
PARTICIPATION EVENTS # ATTENDING
Steering Committee:
January 29 19
Feb 16 14
March 18 24
April 15 19
May 20 18
July 9 9
October 1 13
Public Forums:
May 3, Griggsville 6
May 5, Pleasant Hill 5
May 6, Pittsfield 5
May 12, Barry 2
Focus Groups 9

88
C.2 COMMUNITY SURVEY
Citizens of Pike County –
Tornados, severe storms, floods, and other natural hazards in Pike County have caused death, injuries, and millions of dollars in property damage in the last 60 years. Mitigation of natural hazards means reducing the damage to property and hardship to people that can result from them occurring.
Your input is needed in the development of a plan to lessen the impact of natural hazard events on residents and communities of Pike County. The information gathered from this survey will assist the Steering Committee working on this plan to determine activities that should be implemented to protect lives and property in the event of a natural hazard event. Your experiences and ideas are a very important part of this effort.
Please complete this survey and either leave it where you got it (library, city/village office) or return it to: University of Illinois Extension, 1301 E Washington St, Pittsfield, IL 62363. You can mail it or drop it off in person during regular business hours (8 am–12 pm; 1–4:30 pm, M-F). Or if you prefer, you can complete this survey online by going to http://cads.extension.uiuc.edu/ and look for the link to Surveys. Please complete either a paper survey or the online version, but not both, so that we’ll have the most reliable information.
Thanks in advance for your time in completing and returning this survey. But don’t stop there – encourage your friends, family, neighbors and co-workers to do the same. That is, of course, as long as they are also Pike County residents.
If you have any questions about the survey, the process, or the reasons behind this project, do not hesitate to contact Stephanie Dehart ([email protected]) or Jennifer Mowen ([email protected]) , University of Illinois Extension staff members working with us to develop this plan 217-285-5543.
Best wishes for a great fall,
Scott Syrcle
Pike County Board Chairman

89
COMMUNITY SURVEY
1. What is your zip code?
2. Do you live in a community with others (in town) or in the country? ___ town ___ country
3. In the past 10 years, have you or someone in your household experienced a natural disaster within Pike County such as severe storms, floods, winter storms, extreme temperatures, tornado, drought, earthquake, mine subsidence, or other natural disasters TO THE EXTENT THERE WAS HARM TO PEOPLE (YOU, A FAMILY MEMBER) OR YOUR PROPERTY?
1 Yes (go to question #4) 2 No (go to question #5)
4. Which of the following types of natural hazards events have you or someone in your household experienced TO THE EXTENT THERE WAS HARM TO YOU, A FAMILY MEMBER OR YOUR PROPERTY? (please check all that apply)
1 Severe storm (wind, lightning) 2 Flood 3 Winter storm (ice, hail, etc.)
4 Extreme temperatures (heat, cold) 5 Tornado 6 Drought
7 Earthquake 8 Mine Subsidence (sinking) 9 Flash flooding
10 Other (please specify):
5. On a scale of 1 to 5, how prepared do you feel you and your household are for the potential impacts of natural hazard events likely to occur within Pike County?
1 Not at all prepared
2 Somewhat prepared
3 Adequately
prepared
4 Well
prepared
5 Very well prepared
1 2 3 4 5
6. How concerned are you about the following natural hazards impacting your community and/or Pike County? (please check the corresponding box for each hazard)
Natural Hazard Not concerned Somewhat concerned
Concerned Very
concerned Extremely concerned
a. Severe storm (wind, lightning) 1 2 3 4 5 b. Flood 1 2 3 4 5 c. Winter storm (ice, hail. etc.) 1 2 3 4 5 d. Extreme temperatures 1 2 3 4 5 e. Tornado 1 2 3 4 5 f. Drought 1 2 3 4 5 g. Earthquake 1 2 3 4 5 h. Mine subsidence (sinking) 1 2 3 4 5 i. Flash flooding 1 2 3 4 5 j. Other (please specify): 1 2 3 4 5
7. What are the most effective ways for you to receive information about how to make your household and home safer from natural disasters? (please check all that apply)
1 newspaper stories 2 newspaper ads 3 television news
4 television ads 5 radio news 6 radio ads 7 schools
8 books 9 fact sheet/brochure 10 magazine 11 mail
12 fire department 13 Internet 14 government
15 Other (please specify):
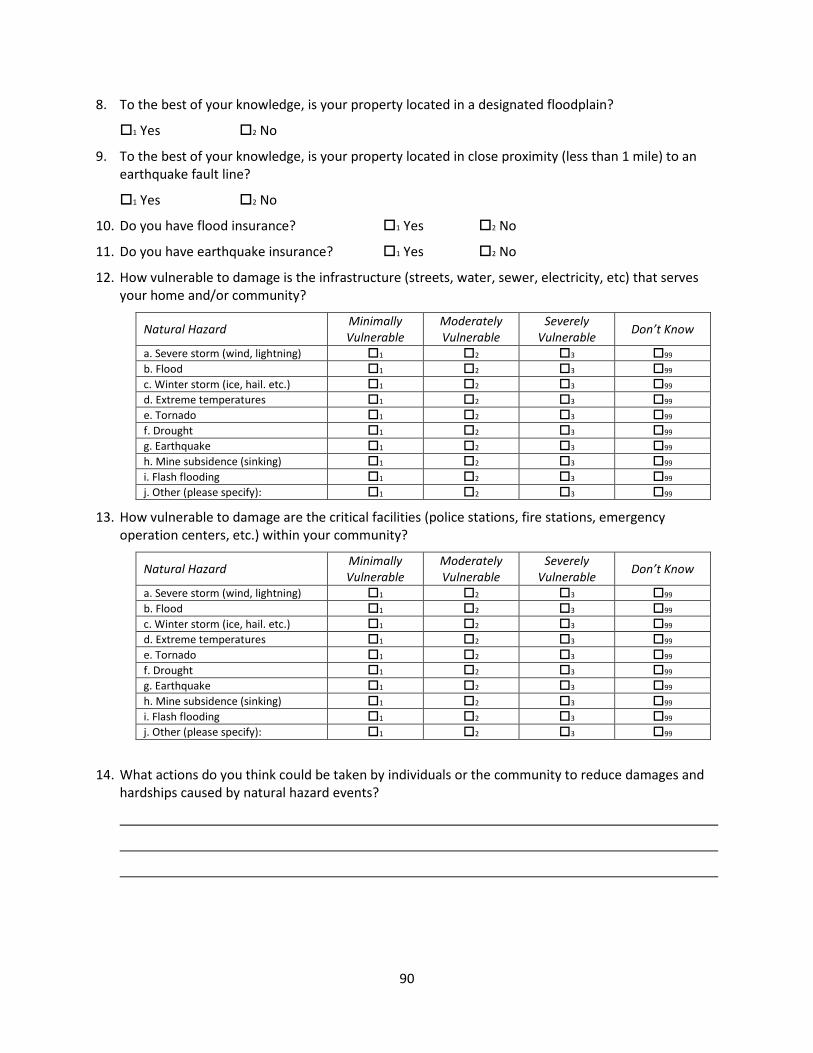
90
8. To the best of your knowledge, is your property located in a designated floodplain?
1 Yes 2 No
9. To the best of your knowledge, is your property located in close proximity (less than 1 mile) to an earthquake fault line?
1 Yes 2 No
10. Do you have flood insurance? 1 Yes 2 No
11. Do you have earthquake insurance? 1 Yes 2 No
12. How vulnerable to damage is the infrastructure (streets, water, sewer, electricity, etc) that serves your home and/or community?
Natural Hazard Minimally Vulnerable
Moderately Vulnerable
Severely Vulnerable
Don’t Know
a. Severe storm (wind, lightning) 1 2 3 99 b. Flood 1 2 3 99 c. Winter storm (ice, hail. etc.) 1 2 3 99 d. Extreme temperatures 1 2 3 99 e. Tornado 1 2 3 99 f. Drought 1 2 3 99 g. Earthquake 1 2 3 99 h. Mine subsidence (sinking) 1 2 3 99 i. Flash flooding 1 2 3 99 j. Other (please specify): 1 2 3 99
13. How vulnerable to damage are the critical facilities (police stations, fire stations, emergency operation centers, etc.) within your community?
Natural Hazard Minimally Vulnerable
Moderately Vulnerable
Severely Vulnerable
Don’t Know
a. Severe storm (wind, lightning) 1 2 3 99 b. Flood 1 2 3 99 c. Winter storm (ice, hail. etc.) 1 2 3 99 d. Extreme temperatures 1 2 3 99 e. Tornado 1 2 3 99 f. Drought 1 2 3 99 g. Earthquake 1 2 3 99 h. Mine subsidence (sinking) 1 2 3 99 i. Flash flooding 1 2 3 99 j. Other (please specify): 1 2 3 99
14. What actions do you think could be taken by individuals or the community to reduce damages and
hardships caused by natural hazard events?

91
15. Did you consider the impact that the possible occurrence of a natural disaster would have on your home before you purchased or moved in?
1 Yes 2 No 3 Don’t recall
16. Was the presence of a natural hazard risk zone (flood zone, fault zone, etc.) disclosed to you by a real estate agent, seller, or landlord before you purchased or moved into your home?
1 Yes 2 No 3 Don’t recall
17. Would the disclosure of this type of information influence your decision to purchase or move into a home?
1 Yes 2 No 3 Maybe
18. Would you be willing to spend money to modify or retrofit your current home from the impacts of future natural disasters? (Examples of retrofitting are: elevating a flood prone home; bolting a foundation for seismic impacts; improving home exteriors to withstand higher winds; and so on)?
1 Yes 2 No 3 Maybe
19. Which of the following incentives would help to encourage you to spend money to retrofit your home for the possible impacts of natural disasters? (please check all that apply)
1 low interest rate loan 2 insurance premium discount 3 mortgage discount 4 property tax break 5 grant funding (with cost share) 6 none 7 Other (please specify):
20. If your property were located in a designated high hazard area or had received repetitive damages from a natural event, would you consider a buyout or relocation offered by a public agency?
1 Yes 2 No 3 Maybe
GENERAL INFORMATION
21. How old are you?
22. Are you…? 1 Male 2 Female
23. How long have you lived in Pike County?
1 Less than 1 year 2 1 – 4 years 3 5 – 9 years 4 10 – 19 years 5 20 years or more
24. Do you have access to the Internet? 1 Yes 2 No
25. Do you own or rent your home? 1 Own 2 Rent
26. What type of structure do you live in?
1 single family home 2 duplex 3 apartment (3-4 units in structure)
4 apartment (5 or more units in structure) 5 condominium / townhouse
6 manufactured home 7 trailer
8 Other (please specify):

92
C.3 ISSUE GROUPS: SAMPLE INVITATION LETTER
Pike County 1301 E. Washington St., Pittsfield, IL 62363 Phone: 217-285-5543 Fax: 217-285-5735 Web: http://www.extension.uiuc.edu/pike August 14, 2009 Name Address Address CityState Dear Name, Pike County has started a process to develop strategies that will positively affect the impact of various natural hazards on our citizens and communities. Funded by a grant from the Federal Emergency Management Agency (FEMA), we have begun an aggressive schedule of meetings. We want to be finished by the end of the September. FEMA emphasizes the need for as much public participation as possible in the creation of these hazard mitigation planning projects. In addition to a Steering Committee composed of representatives from participating communities and a survey and community meetings, we think it is important to bring together groups of people connected to specific issue areas to make sure we are addressing all potential risks and accompanying strategies. We would like to invite you to join others on Tuesday, August 25, from 9:00 - 10:30 am at the Pike County Farm Bureau Building in Pittsfield. This group will focus on issues relating to health and human services, how various natural hazards (flooding, tornados, drought, ice storm and so on) impact this area and some ideas for projects that might help alleviate that impact if implemented. We are enclosing a list of those people we are inviting to this particular gathering; if you see anyone missing, please let us know as soon as possible. Also enclosed are the questions we’ll be posing to the group so you’ll get a sense of what we’re looking for. Another important reason for a good attendance at this group and others like it is that your participation will count toward the matching funds that FEMA requires recipient groups to gather. Please let us know if you’ll join us on Tuesday, August 25. You can call the Pike County Extension office at 217-285-5543 or if email is an option, send a message to [email protected]. In closing, we truly hope you can find the time to assist in this effort. Having a mitigation plan in place will allow the county and participating communities to better compete for grants down the road that will fund identified projects. Your contribution will help immensely to develop the best, most thorough local hazard mitigation plan for us to submit and implement. Sincerely, Stephanie Dehart Jennifer Mowen Community & Economic Development Educator Pike County Extension Director

93
C.4 ISSUE GROUPS: SAMPLE AGENDA
Pike County Local Hazard Mitigation Plan Issue Group Agenda 1. What is the impact of the following hazards on this issue area?
a. Flooding b. Severe storms c. Tornado d. Winter storm (snow, ice, etc.) e. Drought f. Extreme heat g. Earthquake
2. What can be done to reduce (mitigate) the impact of those natural hazards on this issue area?
For example, a siren in a community would help reduce the impact of a tornado on people and property. Think both specifically and generally and anything goes.
a. Flooding b. Severe storms c. Tornado d. Winter storm (snow, ice, etc.) e. Drought f. Extreme heat g. Earthquake
3. What other groups of people should we be speaking with?

94
C.5 ISSUE GROUPS: PROJECT GRID
(designed to both collect information and prompt discussion)
HEALTH & HUMAN SERVICES ISSUE GROUP
Name: Date:
Natural Hazard Effects on people/property Possible mitigation strategies
Severe storms (thunder, wind, hail)
Flooding
Drought
Extreme temperatures
Earthquake
Tornado
Winter storm (snow, ice)
Flash flooding
Additional comments:

95
C.6 COMMUNITY MEETINGS: PROMOTIONAL POSTER
Pike County Hazard Mitigation
Community Meetings
PLANNING FOR THE FUTURE
IN THE EVENT OF A DISASTER
Griggsville City Hall
Monday, May 3 6:00-8:00 pm
Pleasant Hill Village Office
Wednesday, May 5 6:00-8:00 pm
Pike County Farm Bureau Building
Thursday, May 6 6:00-8:00 pm
Barry Community Center (formerly Holy Redeemer Church) Wednesday, May 12 6:00-8:00 pm
All sessions are walk-through ‘open house’ formats. Please attend at any point during the two hour event to provide your comments.
WE NEED YOUR INPUT AND IDEAS Please try to attend one of the following meetings in a community near you and share your
ideas about weather related incidents, natural hazards, and community preparedness.
Pike County Hazard Mitigation
Community Meetings

96
C.7 COMMUNITY MEETINGS: INPUT FORM
Pike County Local Hazard Mitigation Planning
Community Meeting – Tuesday, October 6, 2009 – Dallas City Senior Center
IDEAS FOR HAZARD MITIGATION Will this idea affect a specific community? ___ Yes ___ No
If yes, which one(s)?
What hazard will the idea mitigate?
___ Flood ___ Flash Flood ___ Severe Storms ___ Winter Storms
___ Earthquake ___ Tornado ___ Extreme Temperatures
Please describe your idea for mitigation:
(Optional) If the Steering Committee has questions about your idea, how can they contact you?
Name Phone
If you would prefer to take this home to think it over and mail later, please send it to: Jennifer Mowen, U of I Extension-Pike, 1301 E Washington, Pittsfield, IL 62363.

97
APPENDIX D: MATCH LOG
Date Event # Attending Volunteer Time $ Travel $ Event Total
Sum of Time X Duration
Sum of Miles Traveled X $0.55 .
29-Jan-10 Steering Committee 1 19 758.65 164.45 923.1 16-Feb-10 Steering Committee 2 14 323.54 101.75 425.29 18-Mar-10 Steering Committee 3 24 520.47 218.9 739.37 15-Apr-10 Steering Committee 4 19 606.92 157.85 764.77 20-May-10 Steering Committee 5 18 394.38 209.55 603.93 9-Jul-10 Steering Committee 6 9 134.49 107.25 241.74 1-Oct-10 Steering Committee 7 13 251.16 139.15 390.31 21-Oct-10 Steering Committee 8 25 656.38 315.15 971.53
3-May-10 Griggsville Public Meeting 1 6 135 42.9 177.9 5-May-10 Pleasant Hill Public Meeting 1 5 75 3.3 78.3 6-May-10 Pittsfield Public Meeting 1 5 122.75 11 133.75 12-May-10 Barry Public Meeting 1 2 45.68 1.1 46.78
20-Oct-10 Pleasant Hill Public Meeting 2 7 77 8.8 85.8 20-Oct-10 Barry Public Meeting 2 7 87.41 6.6 94.01 20-Oct-10 Griggsville Public Meeting 2 3 15 0 15 21-Oct-10 Pittsfield Public Meeting 2 23 292.42 294.8 587.22
29-Jun-10 Focus Group 3 62.78 26.4 89.18 30-Jun-10
5 122.56 16.5 139.06
1-Jul-10
9 307.7 111.1 418.8 TOTAL MEETINGS $4,989.29 $1,936.55 $6,925.84
Other Match
Individual Time
$1,034.55
Copies 6500 sides at $0.10 per side
$650.00
Mileage 207 miles at $0.55 per mile
$113.85
TOTAL OTHER $1,798.40
Donated Space
Steering Committee 8 Meetings at Pike County Farm Bureau $800 Public Meetings 1 Meeting at Barry City Hall $50 1 Meeting at Barry Community Center $50 2 Meetings at Griggsville City Hall $100 2 Meetings at Pleasaant Hill Village Office $100 2 Meetings at Pike County Farm Bureau $200 Focus Groups 3 Full Day Focus Groups at Pike County Farm Bureau $300 TOTAL SPACE $1,600.00
MEETINGS $6,925.84
OTHER MATCH $1,798.40
SPACE $1,600.00
$10,324.24

98
APPENDIX E: SAMPLE MUTUAL AID AGREEMENT
Mutual Aid Agreement
THIS AGREEMENT is entered into and among the various governmental and non governmental entities
whose officials have subscribed hereto on the _ _ day of ______________ , 20 10.
In consideration of the mutual commitments given herein, each of the Signatories to this Mutual Aid Agreement agree to render aid during a disaster to any of the other Signatories as follows:
1. The below signed parties will, upon request and whenever possible, furnish assistance with equipment, supplies, and/or personnel within the territorial limits of the other entities who are party to this agreement.
2. It is understood by the parties hereto that the primary responsibility of each is to protect its own territory and that each party hereto may maintain standby equipment within its own territory and, in the event of a call within its own territory, refuse to respond to a request for aid from the other parties.
3. Equipment and personnel at the site of an emergency/disaster shall be under the sole control and direction of the officer in command of the responding party furnishing such equipment and personnel, and such officer shall have the absolute right to remove such equipment and personnel at such time as he/she shall decides to do so. However, the chain of command of the requesting party shall be in overall command of all parties’ personnel and equipment responding to such emergency/disaster, and shall direct the activities of all parties and equipment for the incident.
4. Each party hereto waives any and all claims against the other parties for loss, damage, personal injury, or death that may arise in consequences of the performance of the terms of this agreement, and no party or person shall under any circumstance, be held liable for any loss or damage by reason of any failure to effectively perform at any emergency/disaster in the territory of another party.
5. The rendering of assistance under the terms of this Agreement shall not be mandatory if local conditions of the responding units prohibit response. It is the responsibility of the responding units to immediately notify the requesting party of the inability to respond; however, failure to immediately notify the requesting party of such inability to respond shall not constitute evidence of noncompliance with the terms of this section and no liability may be assigned. No liability of any kind or nature shall be attributed to or be assumed, whether expressly or implied, by a party hereto, its duly authorized agent and personnel, for failure or refusal to render aid. Nor shall there be any liability of a party for withdrawal of aid once provided pursuant to the terms of this Agreement.
6. It is hereby understood that the responding party will be treated as contract labor / equipment and will be reimbursed (e.g. regular and overtime labor, equipment, materials and other related expenses as applicable, including loss or damage to equipment) at the adopted usual and customary rates.

99
7. This Agreement shall become effective when all parties have executed the agreement by signatures, and shall remain in full force and effect thereafter for the period of 10 years. Either party hereto may withdraw from this agreement by giving written notice to the other parties of its withdrawal upon a date not less than thirty (30) days prior to the date of withdrawal.

100
APPENDIX F: ESSENTIAL FACILITIES AND FACILITIES OF LOCAL IMPORTANCE
Essential Facilities EMERGENCY OPERATIONS CENTER Community Name of Facility New Canton
Pike County Emergency Operations Center
FIRE FACILITIES Community Name of Facility Barry Barry Fire Protection District Baylis Baylis Fire Department Griggsville Griggsville Fire Department Hull Hull-Kinderhook Fire Protection Dist Kinderhook Hull-Kinderhook Fire Protection Dist Milton East Pike Fire Protection District Nebo Spring Creek Fire Protection District New Canton New Canton Fire Protection District
Pike Co Volunteer Emergency Corps Perry North Pike Fire Protection District Pittsfield Pittsfield Fire Department Pleasant Hill Pleasant Hill Fire Protection District
MEDICAL FACILITIES Community Name of Facility Barry Quincy Medical Group - Barry Pittsfield Ansari MD Ltd.
Illini Community Hospital Illini Community Hospital - Rural Health Clinic Pike County Health Department Quincy Medical Group - Pike County Family Practice Quincy Medical Group - Pittsfield
Pleasant Hill Quincy Medical Group - Pleasant Hill
POLICE FACILITIES Community Name of Facility Barry Barry Police Department Pittsfield Pike County Sheriff’s Office
Pittsfield Police Department Pleasant Hill Pleasant Hill Police Department
SCHOOL FACILITIES Community Name of Facility Barry Western Barry Elementary School Western High School Griggsville Griggsville-Perry High School Griggsville-Perry Primary School Kinderhook Western Jr. High School Perry Griggsville-Perry Middle School Pittsfield Pikeland Community School Pittsfield High School Pittsfield South Elementary School Pleasant Hill Pleasant Hill Elementary School Pleasant Hill High School

101
FACILITIES OF LOCAL IMPORTANCE AMBULANCE SERVICE Community Name of Facility Pittsfield Pike County EMS
EMERGENCY SHELTER FACILITIES Community Name of Facility Nebo Community Building
PLACES OF LARGE ASSEMBLY Community Name of Facility Barry Community Center Baylis Old Baylis School - Gymnasium Detroit Village Hall / Community Center Griggsville Western Illinois Fairgrounds Griggsville American Legion Nebo Nebo Village Hall New Salem New Salem Town Hall Pearl Community Center Pittsfield American Legion Pittsfield Crossroads Center Pittsfield Farm Bureau Auditorium Pleasant Hill Pike County Fairgrounds School gyms See list on previous page
POTABLE WATER FACILITIES
Community Name of Facility Barry Water Plant Baylis Water Treatment Plant Baylis Well No. 1 Barry Water Plant Griggsville Griggsville Water Treatment Plant Hull Hull Water Treatment Plant Hull Well No. 4 Hull Well No. 5 Kinderhook Kinderhook Well No. 3 Kinderhook Well No. 4 Milton Milton Water Treatment Plant Milton Well No. 5
Nebo Nebo Water Works Nebo Well No. 2 Nebo Well No. 3 New Canton New Canton Well No. 1 New Canton Well No. 3 Pike County PWD No. 1 Pike County PWD No. 2 Pike County PWD No. 3 New Salem Water District Main Tap Pearl Pearl Well No. 3 Pearl Well No. 4 Perry Perry Well No. 1 Perry Well No. 2 Perry Well No. 3 Pittsfield Pittsfield Water Treatment Plant Pleasant Hill Pleasant Hill Community Well
Pleasant Hill Water Treatment Plant Pleasant Hill Well No. 2 Pleasant Hill Well No. 3 Pleasant Hill Well No. 4
Unincorporated Areas
Barry Well No. 4 Barry Well No. 5
Griggsville Water Treatment Plant Griggsville Well No. 1 Griggsville Well No. 2 Griggsville Well No. 4 Griggsville Well No. 5 Griggsville Well No. 6 Pike County PWD No. 1 Pike County PWD No. 1 Pike County PWD No. 1 Pittsfield Community Well Valley City Drainage & Pump Station

102
VULNERABLE POPULATIONS Community Name of Facility Barry Barry Community Care Center Griggsville Griggsville Estates New Salem Royal Manor Pittsfield Eastside Health & Rehabilitation Center Kepley House Liberty Village
WASTE WATER FACILITIES Community Name of Facility Barry Barry Sewage Treatment Plant Griggsville Griggsville Sewage Treatment Plant Hull Hull Sewage Treatment Plant Kinderhook Kinderhook Sewage Treatment Plant Milton Milton Sewage Treatment Plant Nebo Nebo Sewage Treatment Plant New Canton New Canton Water Treatment Plant Perry Perry Sewage Treatment Plant Pittsfield Pittsfield Main Sewage Treatment Plant Pittsfield Sewage Treatment Pond Pleasant Hill Pleasant Hill Sewage Treatment Plant
OTHER COMMUNITY IDENTIFIED STRUCTURES Community Name of Facility Nebo Ameren CIPS Gas Railroad Bridge New Salem Royal Manor Boarding Home Pearl Railroad Bridge Pittsfield Pittsfield Work Camp Unincorporated Areas
Railroad Bridge Railroad Bridge

103
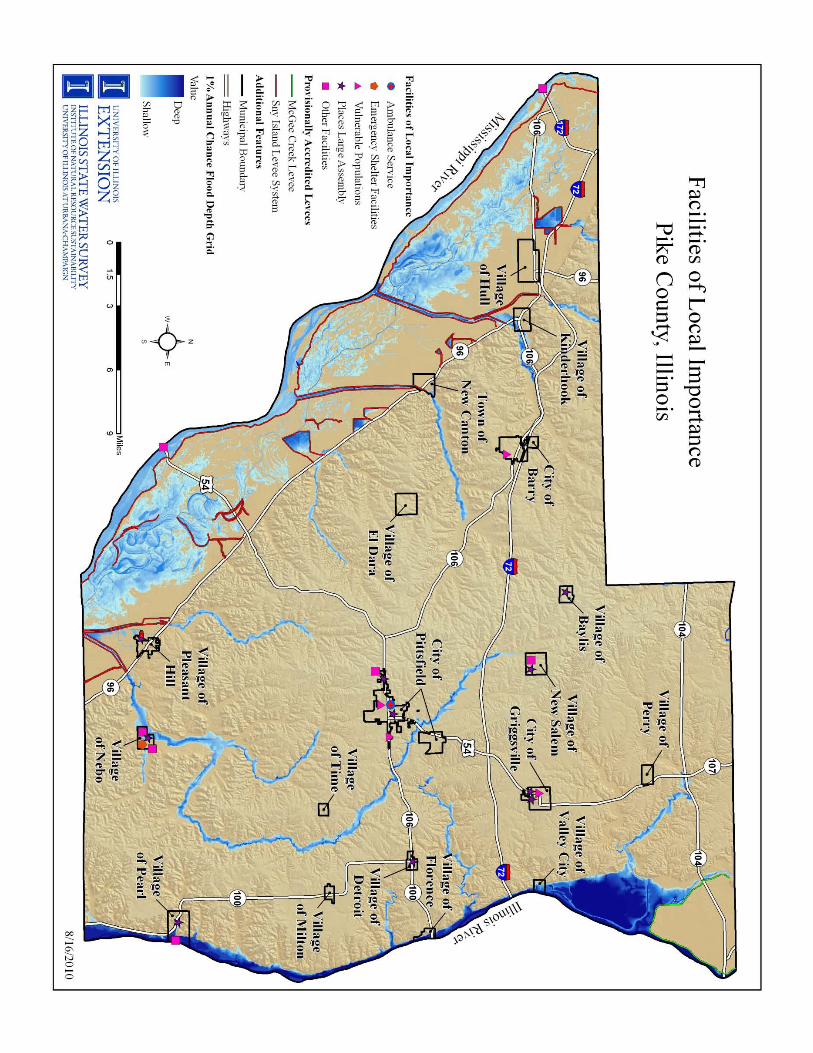
104

105

106

107
APPENDIX G: AERIAL MAPS OF PARTICIPATING JURISDICTIONS
APPENDIX H: MAPS OF PARTICIPATING JURISDICTIONS

108

109

110

111
Florence

112

113

114

115

116
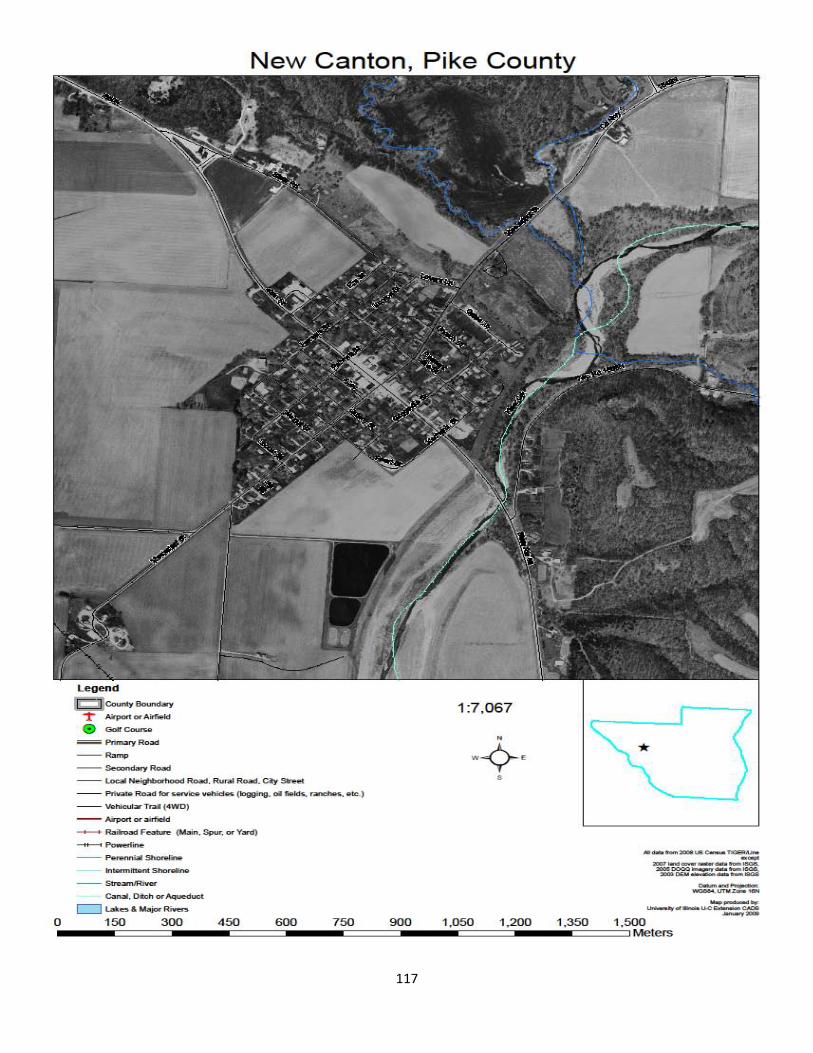
117

118

119

120

121

122

123

124

125
(THIS PAGE LEFT INTENTIONALLY BLANK.)