Embed Size (px)
Citation preview

Date: May 18, 2017 PEG JOB#: 2016-219 Prepared for: Robert Green Associates, LLC 6 Old Waterbury Road Terryville, CT 06786 Project Location: Proposed Solar Project, Candlewood Mountain Road (163+/- property) & transmission line
connection to Rocky River Station, New Milford, CT Report Site Maps: U.S.G.S. Map, Town of New Milford GIS Maps, CT Environmental Conditions Online Maps Inspection Dates: December 9 thru 11, 2016 and May 4, 2017
Weather Conditions: December 9-11, 2016: cloudy to mostly sunny, 20’s & 30’s and no frost. May 4, 107: sunny, 50’s & 60’s.
Soil moisture conditions: Moist to saturated DEFINITIONS OF REGULATED RESOURCES Federal Wetlands are defined as "those areas that are inundated or saturated by surface or ground water at a frequency and duration sufficient to support, and that under normal circumstances do support, a prevalence of vegetation typically adapted for life in saturated soil conditions. Wetlands generally include swamps, marshes, bogs, and similar areas" (33CFR Part 328.3(b)). State of CT Regulated Wetlands and Watercourses (General Statutes, Chptr 440, Sec. 22a-28 to 22a-45) Tidal Wetlands are defined as “those areas which border on or lie beneath tidal waters, such as, but not limited to banks, connected to tidal waters, and whose surface is at or below an elevation of one foot above local extreme high water; and which may grow or be capable of growing some, but not necessarily all of the following:” (includes plant list) sec. 22a-29(2). Inland Wetlands “means land, including submerged land, not regulated pursuant to sections 22a-28 to 22a-35, inclusive,
which consists of any of the soil types designated as poorly drained, very poorly drained, alluvial, and floodplain by the National Cooperative Soils Survey, as may be amended from time to time, of the Natural Resources Conservation Service. Watercourses “means rivers, streams, brooks, waterways, lakes, ponds, marshes, swamps, bogs and all other bodies of water, natural or artificial, vernal or intermittent, public or private which area contained within, flow through or border upon this state or any portion thereof, not regulated pursuant to sections 22a-28 to 22a-35, inclusive. Intermittent watercourses shall be delineated by a defined permanent channel and bank and the occurrence of two or more of the following characteristics: (A) Evidence of scour or deposits of recent alluvium or detritus, (B) the presence of standing or flowing water for a duration longer than a particular storm incident, and (C) the presence of hydrophytic vegetation” section 22a-38(16). Regulated Wetlands and Watercourses Identified in Project Areas: Federal Wetlands: yes Federal Wetland Classification: PFO, PSS Inland Wetlands: yes Watercourses: yes river: XX brook: XX lake: XX intermittent watercourse: XX Wetland boundary flag #’s: The wetland boundaries were delineated with numbered, survey tapes. The
approximate locations of the delineated Federal Wetlands and CT Inland Wetlands are portrayed on the wetland sketch maps which are included in this report. Local Regulated Upland Review Area: From Wetlands: 100 feet From Watercourses: 100 to 200 feet All established wetlands boundary lines are subject to change until officially adopted by local, state and federal agencies.
15 Briarwood Lane Wallingford, CT 06492 203-314-6636
[email protected] WEB SITE pietrasenvironmentalgroup.com
PIETRAS ENVIRONMENTAL GROUP, LLC
WETLANDS & WATERCOURSES INVESIGATION REPORT

Wetlands & Watercourses Investigation Report: Proposed Solar Project on Candlewood Mountain Road Property & proposed transmission line to Rocky River Station, New Milford, CT page 2 of 5
METHODOLOGY FOR IDENTIFICATION OF SOILS, WETLANDS & WATERCOURSES
1) Federal Wetlands: The 1987 U.S. Corps of Engineers Delineation Manual and the Regional Supplement to the
Corps of Engineers Wetland Delineation Manual: Northcentral and Northeast Region (January 2012) provide
information and procedures for conducting Federal Wetland delineation. The methodology established by the Federal Government uses a three parameter approach utilizing hydrologic indicators, hydrophytic vegetation and
hydric soils for identifying Federal Wetlands.
2) Soil Types: Soils are investigated by digging test holes with a spade and auger. Test holes are typically dug to
depths of between 15 and 40 inches. Based on soil features, including coloration patterns, texture and depths to restrictive layers, the soils are identified by soil series name utilizing the classification system of the National
Cooperative Soil Survey. Soil series map numbers correspond with the State Soil Map Legend established by USDA, NRCS in the State of Connecticut Soil Survey. For further soils information, refer to the NRCS website for
CT: www.ct.nrcs.usda.gov
3) Inland Wetlands: Soil test holes and borings are made in selected areas in order to determine the lateral
extent of any Inland Wetlands. The boundaries of the Inland Wetlands are identified in the field and delineated with consecutively numbered survey tapes. The approximate locations of the wetland boundaries are hand
drawn onto a map and are included with the wetlands report.
4) Watercourses: The lateral limits of U.S. Army Corps jurisdiction for non-tidal rivers, streams and water bodies
extends to the ordinary high water mark (OHWM), in the absence of adjacent wetlands. The Corps defines the term “ordinary high water mark” as the following: “means the line on the shore established by the fluctuations of
water and indicated by physical characteristics such as a clear, natural line impressed on the bank, shelving, changes in the character of soil, destruction of terrestrial vegetation, the presence of litter and debris, or other
appropriate means that consider the characteristics of the surrounding areas.” 33 CFR 328.3(e). The Corps recommends that whenever possible the investigator should consider the former indicators along with a number
of others, that include: wracking; vegetation matted down, bent or absent; sediment sorting; leaf litter disturbed
or washed away; scour; deposition; multiple observed flow events; beds and banks; water staining; and change in plant community.
RESULTS OF INVESTIGATION FOR WETLANDS AND WATERCOURSES
Thomas W. Pietras, Professional Wetland and Soil Scientist, conducted site inspections to the 163+/- acre Candlewood Mountain Road property on December 9, 10 and 11, 2016. The parcel is located on a ridge which
lies to the north of Candlewood Lake (refer to USGS Project Location Map). Most of the property is wooded. Grassed fields are present in the southern portion of the property. A horse paddock is located in the
southwestern portion and fronts onto Candlewood Mountain Road. The slopes on the property range from very
steep to gently sloping. Grades generally fall both to the east and west. On May 4, 2017 Mr. Pietras conducted investigations for wetlands along the proposed transmission line route which will extend from eastern side of the
Candlewood Mountain Road Property through First Light Hydro Generating Company land to the Rocky River Station. The proposed transmission route will extend to the north of Candlewood Lake.
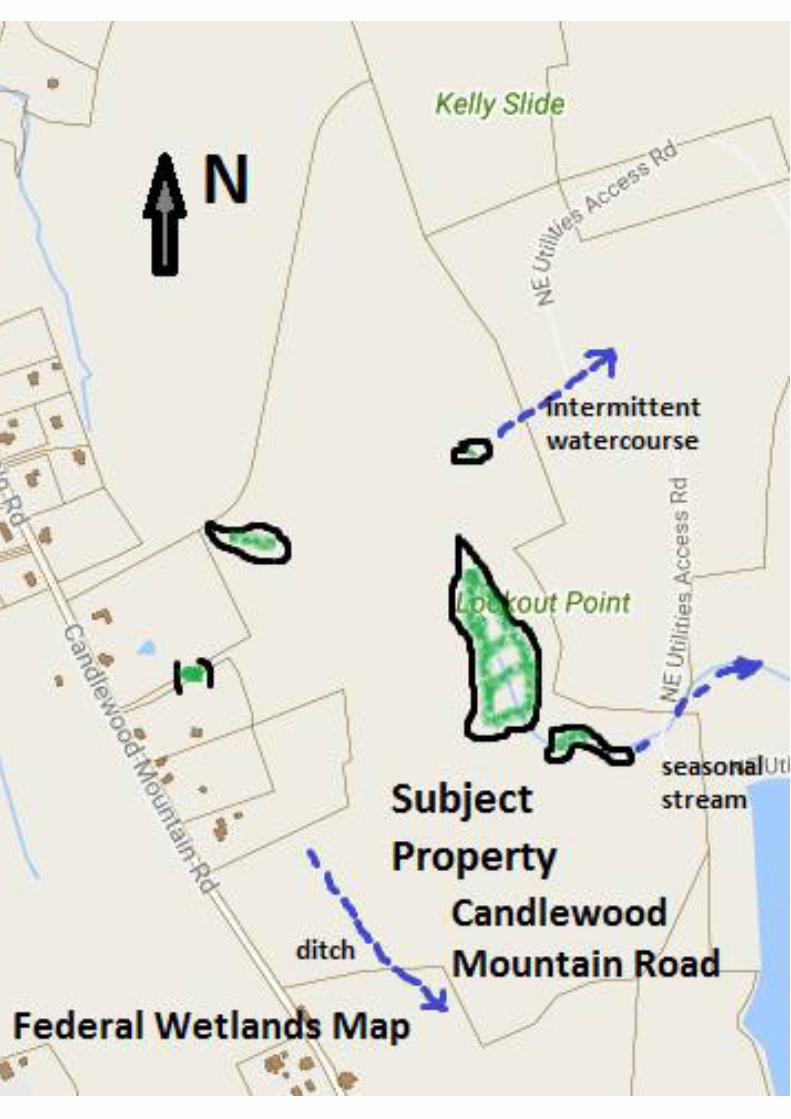
Several intermittent watercourses, brooks and the Rocky River are present in the project area. The locations of
these watercourses are shown on the CT Inland Wetland and Federal Wetland sketch maps. The far
northeastern portion of Candlewood Lake and the dam are located on First Hydro Generating Company Land. A vernal pool is located in the northeastern portion of the Candlewood Mountain Road property (wetland boundary
flags 124 thru 132). On 12/10/2016 the pool was found to contain up to four feet of water. On 5/4/2017 the water level in the pool has receded by 3 to 6 inches. However, there was still at least two feet of water in
portions of the pool. Excess drainage from the vernal pool passes into an intermittent watercourse which flows
off-site in a northeasterly direction. In addition, there was shallow inundation (less than 12 inches) within the more level portions of the large wooded swamp (delineated by wetland flags 1 thru 59).

Wetlands & Watercourses Investigation Report: Proposed Solar Project on Candlewood Mountain Road Property & proposed transmission line to Rocky River Station, New Milford, CT page 3 of 5
Both CT Inland Wetlands and Federal Wetlands are present on the Candlewood Mountain Road property and on
First Light Hydro Generating Company land. The majority of the established wetland boundary flags serve to delineate both Federal Wetlands and CT Inland Wetlands. A small area of CT Inland Wetland (delineated by
wetland flags CT 501 to 508 & CT 520 to 524) was identified to the south of the large wooded swamp which does
not qualify as Federal Wetlands (not dominated by hydrophytes). Several small pockets of CT Wetlands were identified on the eastern side of a deep drainage ditch (CT 530 to 535, CT 540 to 546, CT 550 to 560 & CT 570 to
575). The ditch runs north-south between woodlands and the horse paddock. The ditch has partially drained the CT Inland Wetland soils which do not qualify as Federal Wetlands (absence of wetland hydrology & mix of
hydrophytic & non-hydrophtic vegetation).
CT Inland Wetlands include Ridgebury fine sandy loam (2), Ridgebury, Leicester & Whitman soils (3), Timakwa
and Natchaug soils (17), Catden and Freetown soils (18) and Fluvaquents-Udifluvents (109). The Ridgebury is a poorly drained glacial till soil which developed in friable loamy till underlain by dense, compact lodgement till
(hardpan). Ridgebury, Leicester and Whitman are poorly drained and very poorly drained, very stony, glacial till soils. Timakwa and Natchaug are very poorly drained, moderately deep (16 to 51 inches) peats and mucks
(organic soils). Catden and Freetown are very poorly drained, organic soils containing greater than 51 inches of
peats and mucks. Fluvaquents-Udifluvents are recently formed, alluvial floodplain soils which contain variable soil drainage classes and soil textures.
The Federal Wetlands in the project area include forested swamp (PFO) and scrub-shrub swamp (PSS).
Palustrine (P) wetlands are non-tidal wetlands dominated by trees, shrubs, persistent emergent and emergent
mosses or lichens. Palustrine forested swamp (PFO) is characterized by hydrophytic woody vegetation that is 6 meters (20 feet) or taller. They normally include an overstory of trees, understory of young trees or shrubs, and
herbaceous layer. Palustrine scrub-shrub wetlands (PSS) are wetlands dominated by woody vegetation less than 6 meters tall (20 feet). They are commonly referred to as shrub swamp or shrub/sapling swamp.
Ten Federal Wetland data plot transects with two data plots per transect were established to document the
vegetation, hydrologic indicators and soils along the delineated Federal Wetland boundaries. Approximate
locations of the data plots are shown on the Federal Wetland sketch maps. The completed data forms are included with this report.
An eroded drainage channel is located on the steeply sloping hillside which is situated in the northwestern portion
of the property (south of the wetland delineated by wetland flag #“’s 103 thru 123). There was no flow in the
channel during the December site investigations. The drainage channel was labeled as an “eroded channel.” The channel was re-inspected on May 4, 2017 which occurred following a 6 week period with rainfall was well above
normal. There was no flow in the channel on 5/4/2017. It is likely that periodically, the channel carries storm flow associated with especially large storm events. However, the channel does not qualify as an intermittent
watercourse.
A seasonally flowing, brook runs down a very steeply sloping hillside containing a large boulder train on the
eastern side of the Candlewood Mountain Road property towards First Light Hydro Generating Company land (to the east of wetland flag #’s 60-83). For 100 to 200 feet the brook channel disappears as the flowage goes
underground through the boulder train. The brook re-appears downhill at the base of the boulder train.
Respectfully submitted,
PIETRAS ENVIRONMENTAL GROUP, LLC
Thomas W. Pietras Professional Wetland and Soil Scientist

Wetlands & Watercourses Investigation Report: Proposed Solar Project on Candlewood Mountain Road Property & proposed transmission line to Rocky River Station, New Milford, CT page 4 of 5
BRIEF DESCRIPTIONS OF SOIL MAP UNITS IDENTIFIED WETLAND SOILS 2 Ridgebury fine sandy loam (Aeric Epiaquepts) - This is a deep, poorly drained, glacial till soil that developed in a friable, coarse-loamy textured solum overlying dense, basil till (hardpan). The till was derived from schist, gneiss and granite. Ridgebury soils occur on glaciated plains, hills and ridges. The hardpan is within 20 to 30 inches of the soil surface and it has very slow permeability. A seasonal, perched ground water table is typically present within a foot of the surface from late fall through mid-spring. 3 Ridgebury, Leicester & Whitman soils (Aquepts) – These are poorly drained and very poorly drained, coarse-loamy textured, glacial till soils. The till was derived from schist, gneiss and granite. These soils occur on glaciated plains, hills and ridges. Ridgebury and Whitman soils contain dense basal till (hardpan) in the subsoil within 20 to 30 inches of the soil surface. A water table is typically present within a foot of the surface from late fall through mid-spring. 17 Timakwa and Natchaug soils (Terric Haplosaprists) – These are deep, very poorly drained, peats and mucks, organic soils
overlying either sandy or loamy subsoil. Depth of the peats and mucks ranges from 16 to 51 inches. Timakwa and Natchaug soils developed within depressions subject to ponding. These soils are subject to up to twelve inches of seasonal ponding. The seasonal water table typically remains within six inches of the surface. These soils were formerly mapped in Connecticut as Peat and Muck, shallow. 18 Catden and Freetown soils (Typic Haplosaprists) - These are deep, very poorly drained, peats and mucks, organic soils. Depth of the peats and mucks is over 51 inches. Catden and Freetown soils developed within depressions subject to ponding. These soils are subject to up to twelve inches of seasonal ponding. The seasonal water table typically remains within six inches of the surface. These soils were formerly mapped in Connecticut as Peat and Muck. 109 Fluvaquents-Udifluvents This soil map unit consists of well drained to very poorly drained, nearly level soils that formed in very recent alluvium deposited by rivers and streams. These soils are found in floodplains and along side brooks and rivers. The soils are occasionally to frequently flooded, which often results in stream scouring, lateral erosion and shifting of soil from place to place. Soil characteristics, such as texture and stoniness, are usually highly variable within short distances. NON-WETLAND SOILS 45 Woodbridge fine sandy loam (Aquic Dystrudepts) - This is a deep, moderately well drained, glacial till soil that developed in a friable, coarse-loamy textured solum overlying dense, basal till (hardpan). The till was derived from schist, gneiss and granite. The hardpan is within 20 to 40 inches of the soil surface. A seasonal water table is present between 18 and 30 inches of the surface. 50 Sutton fine sandy loam (Aquic Dystrudepts) - This is a deep, moderately well drained, friable, coarse-loamy textured, glacial till soil derived from schist, gneiss and granite. A seasonal water table is present between 18 and 30 inches of the surface. 73 Charlton-Chatfield complex (Typic Dystrudepts) - These are deep and moderately deep, well drained, friable, coarse-loamy textured, glacial till soils derived from schist, gneiss and granite. Depth to bedrock ranges from 20 inches to over 5 feet. About 50% of the soils in this complex are greater than 5 feet to bedrock. The water table is generally greater than five feet below the surface. 75 Hollis-Chatfield-rock outcrop complex (Typic & Lithic Dystrudepts) - These are shallow to moderately deep to bedrock,
well drained to somewhat excessively drained, friable, coarse-loamy textured, glacial till soils derived from schist, gneiss and granite. Depths to bedrock range from 0 to over 5 feet. Roughly 1/3 of the soils in this complex are shallow (10-20 inches) to bedrock, while another 1/3 are moderately deep (20-40 inches) to bedrock. 76 Rock outcrop-Hollis complex (Lithic Dystrudepts) - This map unit consists mainly of exposed bedrock and shallow to bedrock soils that are 10-20 inches deep. The soils are somewhat excessively drained, friable, coarse-loamy textured, glacial till soils derived from schist, gneiss and granite.

Wetlands & Watercourses Investigation Report: Proposed Solar Project on Candlewood Mountain Road Property & proposed transmission line to Rocky River Station, New Milford, CT page 5 of 5 BRIEF DESCRIPTIONS OF SOIL MAP UNITS IDENTIFIED – Non-wetland Soils continued 84 Paxton and Montauk fine sandy loams (Oxyaquic Dystrudepts) - These are deep, well drained, glacial till soils that developed in a friable, coarse-loamy textured solum overlying dense, coarse-loamy to loamy sand textured, basal till (hardpan). The till was derived from schist, gneiss and granite. Typical depth to hardpan is 30-40 inches. An occasional perched, seasonal water table is present between 24 and 36 inches of the surface. 308 Udorthents, smoothed - This is a well drained to moderately well drained, disturbed soil area that has had two or more feet of the original soil surface altered by filling, excavation or grading activities. Udorthents, smoothed soils commonly occur on leveled land and fill landforms.

May 21, 2017 Robert Green Associates, LLC 6 Old Waterbury Road Terryville, CT 06786 Re: Proposed Solar Project, Candlewood Mountain Road (163+/- property) & transmission line connection to Rocky River Station, New Milford, CT PEG Job #: 2016-219A
, The following are brief descriptions of the wetlands and watercourses identified in the project area: Wetlands I thru V are located on the Candlewood Mountain Road Property Wetland I (wetland flag #’s 1 thru 59 & 60 thru 83) Wetland I is a moderately large wetland (6+/- acres) that mainly supports forested swamp with some areas of shrub swamp. The terrain includes a mix of slight depressional, level, gently sloping and moderately sloping. Soils include poorly drained and very poorly drained, glacial till and very poorly drained organic soils. Some of the organic soils contain more than 4 feet of peats and mucks. Portions of the very poorly drained organic soils are characterized by shallow (less than 12 inches), seasonal inundation. The wetland forms the headwaters for a seasonally flowing watercourse which flows southeasterly to easterly from the wetlands. Wetland II (wetland flag #’s 95 thru 98 and 99 thru 102) Wetland II is a narrow section of a wetland corridor extending in a south to north direction. A small pond is located off-site to the south of the subject property. Drainage from the pond flows into a culvert that extends underground through the western portion of Wetland II. The wetland contains poorly drained, glacial till soils and supports a mix of forested swamp, shrub swamp and wet meadow. Wetland III (wetland flag #’s 103 thru 123) The wetland is a small (0.75+/- acre) forested swamp on a sloping hillside. The wetland contains poorly drained Ridgebury fine sandy loam and is characterized by minor side-slope seepage with seasonally saturated soils. The seasonal ground water table is perched over the compact, lodgement till subsoil (hardpan). Wetland IV (CT wetland flag #’s 530 thru 535, 540 thru 546, 550 thru 560 & 570 thru 575) Several small pockets of poorly drained Ridgebury fine sandy loam (CT Wetlands) are located in the southwestern portion of the subject property and lie to the east of horse paddocks. A deep drainage ditch was excavated at the eastern edge of the horse paddocks. As a result of the excavated ditch the Ridgebury soils have been artificially drained and no longer possess wetland hydrology. The Ridgebury soils support a mix of hyrophytic and non-hydrophytic forest plants. These wetlands qualify as CT Inland Wetlands, but do not qualify as Federal Wetlands.
15 Briarwood Lane Wallingford, CT 06492 203-314-6636
[email protected] WEB SITE pietrasenvironmetalgroup.com
PIETRAS ENVIRONMENTAL GROUP, LLC
WETLANDS REPORT

Wetlands Report - Proposed Solar Project, Candlewood Mountain Road (163+/- property) & transmission line connection to Rocky River Station, New Milford, CT page 2 of 2 Wetland V (wetland flag #’s 124 thru 132) Wetland V consists of a small (0.1+/- acre) vernal pool. The vernal pool wetland is located in a minor valley between two ridges where seasonally water is trapped in a shallow basin. The pool holds up to three feet of water during the wettest periods of the year. Excess drainage from the wetland passes to the northeast into an intermittent watercourse. The pool is located within a forested area. Vegetation is absent from the majority of the vernal pool due to the prolonged inundation. Wetlands VI thru IX are located on the First Light Hydro Generating Company Land Wetland VI (wetland flag #’s 201 thru 245) The wetland includes a stream valley and a portion of a hillside characterized by side-slope seepage. A brook exits from a culvert located at the northern side of the Candlewood Lake dam and flows northerly through the stream valley. The watercourse is locally referred to as the Rocky River. A seasonally flowing brook passes easterly from a boulder train on the Candlewood Mountain Road property and merges with the Rocky River. The wetlands contain poorly drained and very poorly drained, glacial till soils and support forested swamp vegetation. Wetland VII (wetland flag #’s 246 thru 251, 252 thru 278, 279 thru 306 & 307 thru 314) The wetlands are characterized as hillslope, seasonally wet forested swamp (several acres or more in size). The soils are poorly drained glacial till soils containing compact, lodgement till (hardpan). The seasonal groundwater table is perched over the hardpan subsoil. A minor brook develops within the wetland and flows in a northeasterly direction and discharges into the Rocky River. Wetland VIII (wetland flag #’s 315 thru 332) Wetland VIII is on a side slope located downslope from Candlewood Lake. The wetland contains poorly drained glacial till soils with a hardpan which are subject to seasonal seepage. A small watercourse exits from a culvert that outlets into the wetlands. The watercourse flows in a northerly direction for several hundred feet along the eastern side of an access road. These wetlands have been historically altered from some excavation which may be related to the construction of the access road. The wetlands support young forested swamp vegetation. Wetland IX (flag #’s S2-101 thru 108 & S2-201 thru 208) The wetland contains a small, seasonally flowing watercourse with a broad channel. On May 4, 2017 there was moderate flow within the channel. It is likely that the stream is dry for extended portions of the year. The stream is located on a sloping, forested hillside.


US Army Corps of Engineers Northcentral and Northeast Region – Interim Version
WETLAND DETERMINATION DATA FORM – Northcentral and Northeast Region Project/Site: City/County: Sampling Date:
Applicant/Owner: State: Sampling Point:
Investigator(s): Section, Township, Range:
Landform (hillslope, terrace, etc.): Local relief (concave, convex, none):
Slope (%): Lat: Long: Datum:
Soil Map Unit Name: NWI classification:
Are climatic / hydrologic conditions on the site typical for this time of year? Yes No (If no, explain in Remarks.)
Are Vegetation , Soil , or Hydrology significantly disturbed? Are “Normal Circumstances” present? Yes No
Are Vegetation , Soil , or Hydrology naturally problematic? (If needed, explain any answers in Remarks.)
SUMMARY OF FINDINGS – Attach site map showing sampling point locations, transects, important features, etc.
Hydrophytic Vegetation Present? Yes No Hydric Soil Present? Yes No Wetland Hydrology Present? Yes No
Is the Sampled Area within a Wetland? Yes No
If yes, optional Wetland Site ID: Remarks: (Explain alternative procedures here or in a separate report.)
HYDROLOGY Wetland Hydrology Indicators: Secondary Indicators (minimum of two required) Primary Indicators (minimum of one is required; check all that apply) Surface Soil Cracks (B6) Surface Water (A1) Water-Stained Leaves (B9) Drainage Patterns (B10) High Water Table (A2) Aquatic Fauna (B13) Moss Trim Lines (B16) Saturation (A3) Marl Deposits (B15) Dry-Season Water Table (C2) Water Marks (B1) Hydrogen Sulfide Odor (C1) Crayfish Burrows (C8) Sediment Deposits (B2) Oxidized Rhizospheres on Living Roots (C3) Saturation Visible on Aerial Imagery (C9) Drift Deposits (B3) Presence of Reduced Iron (C4) Stunted or Stressed Plants (D1) Algal Mat or Crust (B4) Recent Iron Reduction in Tilled Soils (C6) Geomorphic Position (D2) Iron Deposits (B5) Thin Muck Surface (C7) Shallow Aquitard (D3) Inundation Visible on Aerial Imagery (B7) Other (Explain in Remarks) Microtopographic Relief (D4) Sparsely Vegetated Concave Surface (B8) FAC-Neutral Test (D5) Field Observations: Surface Water Present? Yes No Depth (inches): Water Table Present? Yes No Depth (inches): Saturation Present? Yes No Depth (inches): (includes capillary fringe)
Wetland Hydrology Present? Yes No
Describe Recorded Data (stream gauge, monitoring well, aerial photos, previous inspections), if available:
Remarks:
Proposed solar project transmission line route New Milford/Litchfield May 4, 2017Amec Foster Wheeler Environment & Infrastructure, Inc. CT 227-W
Thomas W. Pietras, PEG, LLCstream valley concave
1-3% 41.573955 -73.445049 320 ftFluvaquents PFO
Xno no no XXno no no
XXXX XX
XX
XX
XX 3X
X
0 X

US Army Corps of Engineers Northcentral and Northeast Region – Interim Version
VEGETATION – Use scientific names of plants. Sampling Point:
Dominance Test worksheet: Number of Dominant Species That Are OBL, FACW, or FAC: (A) Total Number of Dominant Species Across All Strata: (B) Percent of Dominant Species That Are OBL, FACW, or FAC: (A/B)
Prevalence Index worksheet: Total % Cover of: Multiply by: OBL species x 1 = FACW species x 2 = FAC species x 3 = FACU species x 4 = UPL species x 5 = Column Totals: (A) (B)
Prevalence Index = B/A =
Hydrophytic Vegetation Indicators: Rapid Test for Hydrophytic Vegetation Dominance Test is >50% Prevalence Index is 3.01 Morphological Adaptations1 (Provide supporting data in Remarks or on a separate sheet) Problematic Hydrophytic Vegetation1 (Explain) 1Indicators of hydric soil and wetland hydrology must be present, unless disturbed or problematic.
Definitions of Vegetation Strata: Tree – Woody plants 3 in. (7.6 cm) or more in diameter at breast height (DBH), regardless of height. Sapling/shrub – Woody plants less than 3 in. DBH and greater than 3.28 ft (1 m) tall. Herb – All herbaceous (non-woody) plants, regardless of size, and woody plants less than 3.28 ft tall. Woody vines – All woody vines greater than 3.28 ft in height.
Absolute Dominant Indicator Tree Stratum (Plot size: ) % Cover Species? Status
1.
2.
3.
4.
5.
6.
7.
= Total Cover
Sapling/Shrub Stratum (Plot size: )
1.
2.
3.
4.
5.
6.
7.
= Total Cover
Herb Stratum (Plot size: )
1.
2.
3.
4.
5.
6.
7.
8.
9.
10.
11.
12.
= Total Cover
Woody Vine Stratum (Plot size: )
1.
2.
3.
4.
= Total Cover
Hydrophytic Vegetation Present? Yes No
Remarks: (Include photo numbers here or on a separate sheet.)
227-W
30 ftAcer saccharumUlmus americana
4035
YY
FACUFACW
5
8
63
15 ft75
Betula lentaCarpinus caroliniana
1555
YYY
FACWFACUFAC
Ulmus americana
5 ft25
Carex strictaErythronium americanumSymplocarpus foetidusGeum canadenseArisaema triphyllumPersicaria amphibia
1210105555
YYYNNNN
FACUOBLFACOBLFACFACOBL
Dryopteris marginalis
30 ft52
XX0
X

US Army Corps of Engineers Northcentral and Northeast Region – Interim Version
SOIL Sampling Point:
Profile Description: (Describe to the depth needed to document the indicator or confirm the absence of indicators.) Depth Matrix Redox Features (inches) Color (moist) % Color (moist) % Type1 Loc2 Texture Remarks
1Type: C=Concentration, D=Depletion, RM=Reduced Matrix, CS=Covered or Coated Sand Grains. 2Location: PL=Pore Lining, M=Matrix. Hydric Soil Indicators: Indicators for Problematic Hydric Soils3: Histosol (A1) Polyvalue Below Surface (S8) (LRR R, 2 cm Muck (A10) (LRR K, L, MLRA 149B) Histic Epipedon (A2) MLRA 149B) Coast Prairie Redox (A16) (LRR K, L, R) Black Histic (A3) Thin Dark Surface (S9) (LRR R, MLRA 149B) 5 cm Mucky Peat or Peat (S3) (LRR K, L, R) Hydrogen Sulfide (A4) Loamy Mucky Mineral (F1) (LRR K, L) Dark Surface (S7) (LRR K, L) Stratified Layers (A5) Loamy Gleyed Matrix (F2) Polyvalue Below Surface (S8) (LRR K, L) Depleted Below Dark Surface (A11) Depleted Matrix (F3) Thin Dark Surface (S9) (LRR K, L) Thick Dark Surface (A12) Redox Dark Surface (F6) Iron-Manganese Masses (F12) (LRR K, L, R) Sandy Mucky Mineral (S1) Depleted Dark Surface (F7) Piedmont Floodplain Soils (F19) (MLRA 149B) Sandy Gleyed Matrix (S4) Redox Depressions (F8) Mesic Spodic (TA6) (MLRA 144A, 145, 149B) Sandy Redox (S5) Red Parent Material (TF2) Stripped Matrix (S6) Very Shallow Dark Surface (TF12) Dark Surface (S7) (LRR R, MLRA 149B) Other (Explain in Remarks) 3Indicators of hydrophytic vegetation and wetland hydrology must be present, unless disturbed or problematic. Restrictive Layer (if observed): Type:
Depth (inches):
Hydric Soil Present? Yes No
Remarks:
227-W
0-6
6-14
14+
10YR 2/2
10YR 4/2
95
93
5YR 4/6
5YR 4/6
5
7
C
C
M
M
si l
ls & lfs
mucky
large stone
x
x
XX
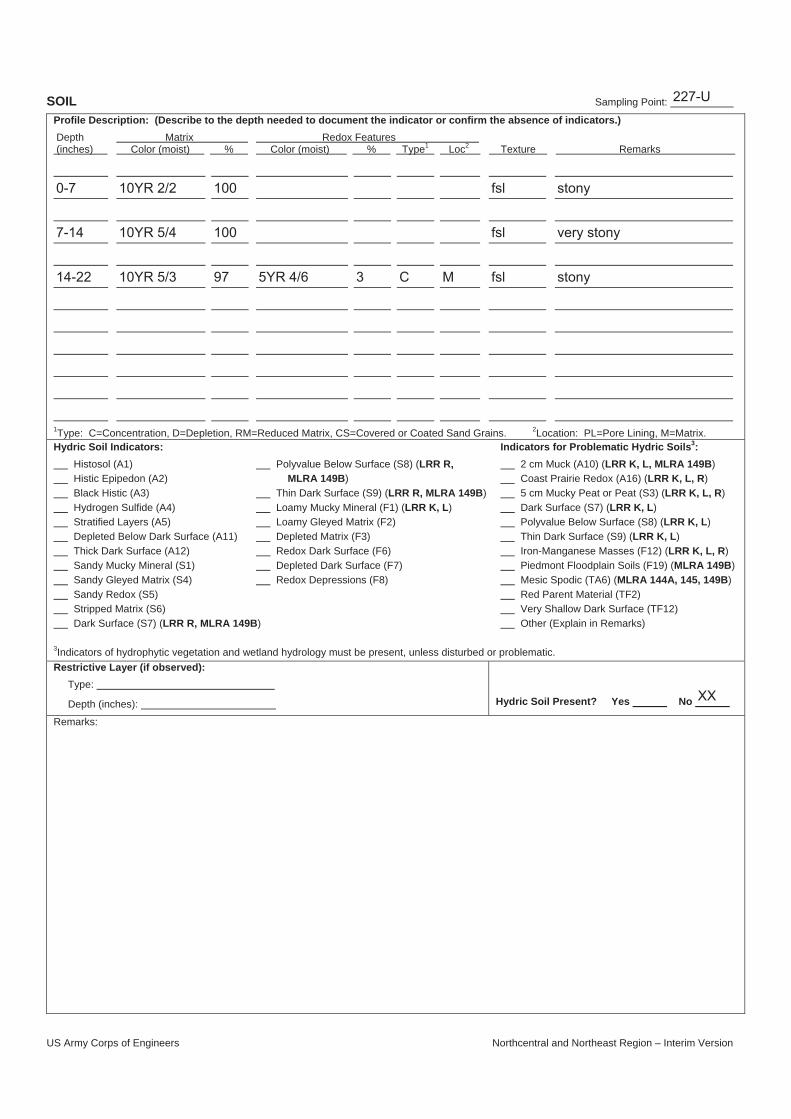
Data Plot 227-W is located 6 feet west of WF# 227.Data Plot 227-U is located 8 feet east of WF# 227.The approximate difference in elevation from Data Plot 227-W to 227-U is 1.5 to 2 feet.

US Army Corps of Engineers Northcentral and Northeast Region – Interim Version
WETLAND DETERMINATION DATA FORM – Northcentral and Northeast Region Project/Site: City/County: Sampling Date:
Applicant/Owner: State: Sampling Point:
Investigator(s): Section, Township, Range:
Landform (hillslope, terrace, etc.): Local relief (concave, convex, none):
Slope (%): Lat: Long: Datum:
Soil Map Unit Name: NWI classification:
Are climatic / hydrologic conditions on the site typical for this time of year? Yes No (If no, explain in Remarks.)
Are Vegetation , Soil , or Hydrology significantly disturbed? Are “Normal Circumstances” present? Yes No
Are Vegetation , Soil , or Hydrology naturally problematic? (If needed, explain any answers in Remarks.)
SUMMARY OF FINDINGS – Attach site map showing sampling point locations, transects, important features, etc.
Hydrophytic Vegetation Present? Yes No Hydric Soil Present? Yes No Wetland Hydrology Present? Yes No
Is the Sampled Area within a Wetland? Yes No
If yes, optional Wetland Site ID: Remarks: (Explain alternative procedures here or in a separate report.)
HYDROLOGY Wetland Hydrology Indicators: Secondary Indicators (minimum of two required) Primary Indicators (minimum of one is required; check all that apply) Surface Soil Cracks (B6) Surface Water (A1) Water-Stained Leaves (B9) Drainage Patterns (B10) High Water Table (A2) Aquatic Fauna (B13) Moss Trim Lines (B16) Saturation (A3) Marl Deposits (B15) Dry-Season Water Table (C2) Water Marks (B1) Hydrogen Sulfide Odor (C1) Crayfish Burrows (C8) Sediment Deposits (B2) Oxidized Rhizospheres on Living Roots (C3) Saturation Visible on Aerial Imagery (C9) Drift Deposits (B3) Presence of Reduced Iron (C4) Stunted or Stressed Plants (D1) Algal Mat or Crust (B4) Recent Iron Reduction in Tilled Soils (C6) Geomorphic Position (D2) Iron Deposits (B5) Thin Muck Surface (C7) Shallow Aquitard (D3) Inundation Visible on Aerial Imagery (B7) Other (Explain in Remarks) Microtopographic Relief (D4) Sparsely Vegetated Concave Surface (B8) FAC-Neutral Test (D5) Field Observations: Surface Water Present? Yes No Depth (inches): Water Table Present? Yes No Depth (inches): Saturation Present? Yes No Depth (inches): (includes capillary fringe)
Wetland Hydrology Present? Yes No
Describe Recorded Data (stream gauge, monitoring well, aerial photos, previous inspections), if available:
Remarks:
Proposed solar project transmission line route New Milford/Litchfield May 4, 2017Amec Foster Wheeler Environment & Infrastructure, Inc. CT 227-U
Thomas W. Pietras, PEG, LLClower hillside convex
25% 41.573959 -73.445006 347 ftWoodbridge fine sandy loam (Aquic Udorthents)
Xno no no XXno no no
XX XX
X
XX
X 17 X

US Army Corps of Engineers Northcentral and Northeast Region – Interim Version
VEGETATION – Use scientific names of plants. Sampling Point:
Dominance Test worksheet: Number of Dominant Species That Are OBL, FACW, or FAC: (A) Total Number of Dominant Species Across All Strata: (B) Percent of Dominant Species That Are OBL, FACW, or FAC: (A/B)
Prevalence Index worksheet: Total % Cover of: Multiply by: OBL species x 1 = FACW species x 2 = FAC species x 3 = FACU species x 4 = UPL species x 5 = Column Totals: (A) (B)
Prevalence Index = B/A =
Hydrophytic Vegetation Indicators: Rapid Test for Hydrophytic Vegetation Dominance Test is >50% Prevalence Index is 3.01 Morphological Adaptations1 (Provide supporting data in Remarks or on a separate sheet) Problematic Hydrophytic Vegetation1 (Explain) 1Indicators of hydric soil and wetland hydrology must be present, unless disturbed or problematic.
Definitions of Vegetation Strata: Tree – Woody plants 3 in. (7.6 cm) or more in diameter at breast height (DBH), regardless of height. Sapling/shrub – Woody plants less than 3 in. DBH and greater than 3.28 ft (1 m) tall. Herb – All herbaceous (non-woody) plants, regardless of size, and woody plants less than 3.28 ft tall. Woody vines – All woody vines greater than 3.28 ft in height.
Absolute Dominant Indicator Tree Stratum (Plot size: ) % Cover Species? Status
1.
2.
3.
4.
5.
6.
7.
= Total Cover
Sapling/Shrub Stratum (Plot size: )
1.
2.
3.
4.
5.
6.
7.
= Total Cover
Herb Stratum (Plot size: )
1.
2.
3.
4.
5.
6.
7.
8.
9.
10.
11.
12.
= Total Cover
Woody Vine Stratum (Plot size: )
1.
2.
3.
4.
= Total Cover
Hydrophytic Vegetation Present? Yes No
Remarks: (Include photo numbers here or on a separate sheet.)
227-U
30 ftAcer saccharumLiriodendron tulipiferaFraxinus americanaUlmus americana
4515108
YNNN
FACUFACUFACUFACW
1
6
17
15 ft78
Acer saccharumUlmus americanaHamamelis virginana
1510108
YYYN
FACUFACUFACWFACU
Tsuga canadensis
5 ft43
Dryopteris marginalisGeum canadenseSymplocarpus foetidus
15822
YYNN
FACUFACUFACOBL
Polystichum acrostichoides
30 ft27
XX0
US Army Corps of Engineers Northcentral and Northeast Region – Interim Version
SOIL Sampling Point:
Profile Description: (Describe to the depth needed to document the indicator or confirm the absence of indicators.) Depth Matrix Redox Features (inches) Color (moist) % Color (moist) % Type1 Loc2 Texture Remarks
1Type: C=Concentration, D=Depletion, RM=Reduced Matrix, CS=Covered or Coated Sand Grains. 2Location: PL=Pore Lining, M=Matrix. Hydric Soil Indicators: Indicators for Problematic Hydric Soils3: Histosol (A1) Polyvalue Below Surface (S8) (LRR R, 2 cm Muck (A10) (LRR K, L, MLRA 149B) Histic Epipedon (A2) MLRA 149B) Coast Prairie Redox (A16) (LRR K, L, R) Black Histic (A3) Thin Dark Surface (S9) (LRR R, MLRA 149B) 5 cm Mucky Peat or Peat (S3) (LRR K, L, R) Hydrogen Sulfide (A4) Loamy Mucky Mineral (F1) (LRR K, L) Dark Surface (S7) (LRR K, L) Stratified Layers (A5) Loamy Gleyed Matrix (F2) Polyvalue Below Surface (S8) (LRR K, L) Depleted Below Dark Surface (A11) Depleted Matrix (F3) Thin Dark Surface (S9) (LRR K, L) Thick Dark Surface (A12) Redox Dark Surface (F6) Iron-Manganese Masses (F12) (LRR K, L, R) Sandy Mucky Mineral (S1) Depleted Dark Surface (F7) Piedmont Floodplain Soils (F19) (MLRA 149B) Sandy Gleyed Matrix (S4) Redox Depressions (F8) Mesic Spodic (TA6) (MLRA 144A, 145, 149B) Sandy Redox (S5) Red Parent Material (TF2) Stripped Matrix (S6) Very Shallow Dark Surface (TF12) Dark Surface (S7) (LRR R, MLRA 149B) Other (Explain in Remarks) 3Indicators of hydrophytic vegetation and wetland hydrology must be present, unless disturbed or problematic. Restrictive Layer (if observed): Type:
Depth (inches):
Hydric Soil Present? Yes No
Remarks:
227-U
0-7
7-14
14-22
10YR 2/2
10YR 5/4
10YR 5/3
100
100
97 5YR 4/6 3 C M
fsl
fsl
fsl
stony
very stony
stony
XX

US Army Corps of Engineers Northcentral and Northeast Region – Interim Version
WETLAND DETERMINATION DATA FORM – Northcentral and Northeast Region Project/Site: City/County: Sampling Date:
Applicant/Owner: State: Sampling Point:
Investigator(s): Section, Township, Range:
Landform (hillslope, terrace, etc.): Local relief (concave, convex, none):
Slope (%): Lat: Long: Datum:
Soil Map Unit Name: NWI classification:
Are climatic / hydrologic conditions on the site typical for this time of year? Yes No (If no, explain in Remarks.)
Are Vegetation , Soil , or Hydrology significantly disturbed? Are “Normal Circumstances” present? Yes No
Are Vegetation , Soil , or Hydrology naturally problematic? (If needed, explain any answers in Remarks.)
SUMMARY OF FINDINGS – Attach site map showing sampling point locations, transects, important features, etc.
Hydrophytic Vegetation Present? Yes No Hydric Soil Present? Yes No Wetland Hydrology Present? Yes No
Is the Sampled Area within a Wetland? Yes No
If yes, optional Wetland Site ID: Remarks: (Explain alternative procedures here or in a separate report.)
HYDROLOGY Wetland Hydrology Indicators: Secondary Indicators (minimum of two required) Primary Indicators (minimum of one is required; check all that apply) Surface Soil Cracks (B6) Surface Water (A1) Water-Stained Leaves (B9) Drainage Patterns (B10) High Water Table (A2) Aquatic Fauna (B13) Moss Trim Lines (B16) Saturation (A3) Marl Deposits (B15) Dry-Season Water Table (C2) Water Marks (B1) Hydrogen Sulfide Odor (C1) Crayfish Burrows (C8) Sediment Deposits (B2) Oxidized Rhizospheres on Living Roots (C3) Saturation Visible on Aerial Imagery (C9) Drift Deposits (B3) Presence of Reduced Iron (C4) Stunted or Stressed Plants (D1) Algal Mat or Crust (B4) Recent Iron Reduction in Tilled Soils (C6) Geomorphic Position (D2) Iron Deposits (B5) Thin Muck Surface (C7) Shallow Aquitard (D3) Inundation Visible on Aerial Imagery (B7) Other (Explain in Remarks) Microtopographic Relief (D4) Sparsely Vegetated Concave Surface (B8) FAC-Neutral Test (D5) Field Observations: Surface Water Present? Yes No Depth (inches): Water Table Present? Yes No Depth (inches): Saturation Present? Yes No Depth (inches): (includes capillary fringe)
Wetland Hydrology Present? Yes No
Describe Recorded Data (stream gauge, monitoring well, aerial photos, previous inspections), if available:
Remarks:
Proposed solar project transmission line route New Milford/Litchfield May 4, 2017Amec Foster Wheeler Environment & Infrastructure, Inc. CT 242-W
Thomas W. Pietras, PEG, LLChillside seep concave
5% 41.574023 -73.44405 373 ftRidgebury fine sandy loam (Epiaquepts) PFO
Xno no no XXno no no
XXXX XX
XX
XX
XX 6X
XX
0 X
US Army Corps of Engineers Northcentral and Northeast Region – Interim Version
VEGETATION – Use scientific names of plants. Sampling Point:
Dominance Test worksheet: Number of Dominant Species That Are OBL, FACW, or FAC: (A) Total Number of Dominant Species Across All Strata: (B) Percent of Dominant Species That Are OBL, FACW, or FAC: (A/B)
Prevalence Index worksheet: Total % Cover of: Multiply by: OBL species x 1 = FACW species x 2 = FAC species x 3 = FACU species x 4 = UPL species x 5 = Column Totals: (A) (B)
Prevalence Index = B/A =
Hydrophytic Vegetation Indicators: Rapid Test for Hydrophytic Vegetation Dominance Test is >50% Prevalence Index is 3.01 Morphological Adaptations1 (Provide supporting data in Remarks or on a separate sheet) Problematic Hydrophytic Vegetation1 (Explain) 1Indicators of hydric soil and wetland hydrology must be present, unless disturbed or problematic.
Definitions of Vegetation Strata: Tree – Woody plants 3 in. (7.6 cm) or more in diameter at breast height (DBH), regardless of height. Sapling/shrub – Woody plants less than 3 in. DBH and greater than 3.28 ft (1 m) tall. Herb – All herbaceous (non-woody) plants, regardless of size, and woody plants less than 3.28 ft tall. Woody vines – All woody vines greater than 3.28 ft in height.
Absolute Dominant Indicator Tree Stratum (Plot size: ) % Cover Species? Status
1.
2.
3.
4.
5.
6.
7.
= Total Cover
Sapling/Shrub Stratum (Plot size: )
1.
2.
3.
4.
5.
6.
7.
= Total Cover
Herb Stratum (Plot size: )
1.
2.
3.
4.
5.
6.
7.
8.
9.
10.
11.
12.
= Total Cover
Woody Vine Stratum (Plot size: )
1.
2.
3.
4.
= Total Cover
Hydrophytic Vegetation Present? Yes No
Remarks: (Include photo numbers here or on a separate sheet.)
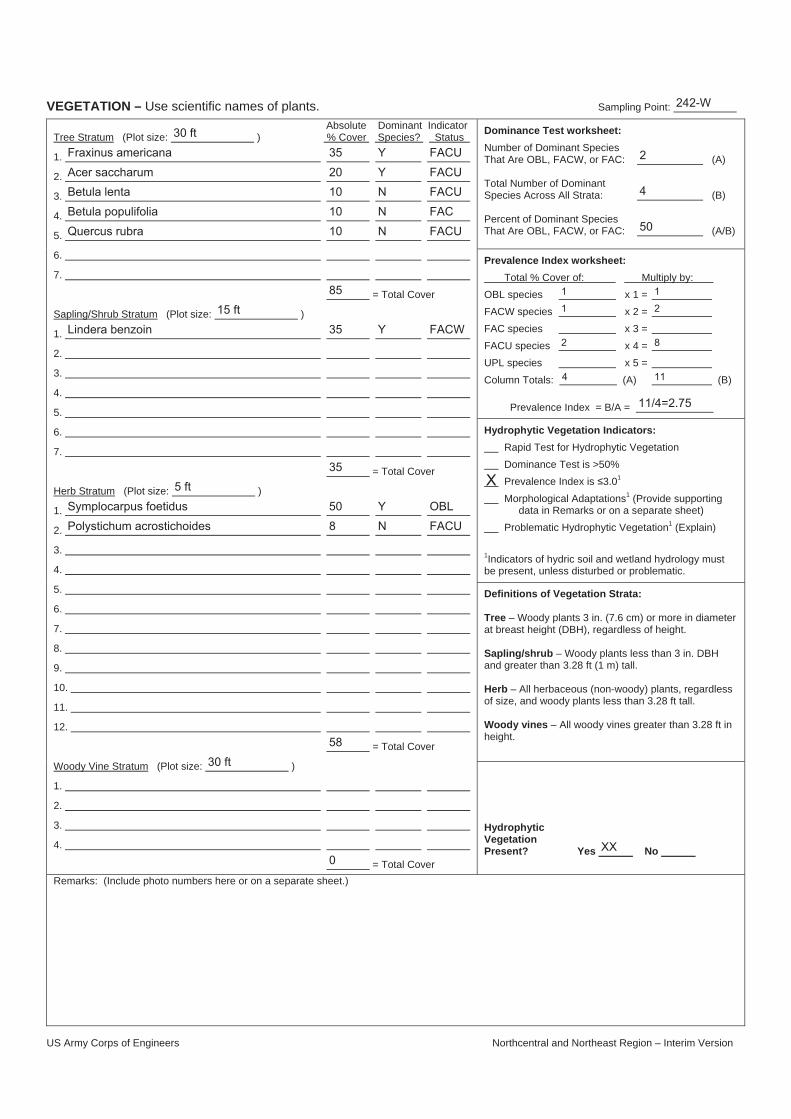
242-W
30 ftFraxinus americanaAcer saccharumBetula lentaBetula populifoliaQuercus rubra
3520101010
YYNNN
FACUFACUFACUFACFACU
2
4
50
15 ft85 1 1
35 Y FACW
1 2
Lindera benzoin2 8
4 11
11/4=2.75
5 ft35
Polystichum acrostichoides508
YN
OBLFACU
Symplocarpus foetidus
30 ft58
XX0
X

US Army Corps of Engineers Northcentral and Northeast Region – Interim Version
SOIL Sampling Point:
Profile Description: (Describe to the depth needed to document the indicator or confirm the absence of indicators.) Depth Matrix Redox Features (inches) Color (moist) % Color (moist) % Type1 Loc2 Texture Remarks
1Type: C=Concentration, D=Depletion, RM=Reduced Matrix, CS=Covered or Coated Sand Grains. 2Location: PL=Pore Lining, M=Matrix. Hydric Soil Indicators: Indicators for Problematic Hydric Soils3: Histosol (A1) Polyvalue Below Surface (S8) (LRR R, 2 cm Muck (A10) (LRR K, L, MLRA 149B) Histic Epipedon (A2) MLRA 149B) Coast Prairie Redox (A16) (LRR K, L, R) Black Histic (A3) Thin Dark Surface (S9) (LRR R, MLRA 149B) 5 cm Mucky Peat or Peat (S3) (LRR K, L, R) Hydrogen Sulfide (A4) Loamy Mucky Mineral (F1) (LRR K, L) Dark Surface (S7) (LRR K, L) Stratified Layers (A5) Loamy Gleyed Matrix (F2) Polyvalue Below Surface (S8) (LRR K, L) Depleted Below Dark Surface (A11) Depleted Matrix (F3) Thin Dark Surface (S9) (LRR K, L) Thick Dark Surface (A12) Redox Dark Surface (F6) Iron-Manganese Masses (F12) (LRR K, L, R) Sandy Mucky Mineral (S1) Depleted Dark Surface (F7) Piedmont Floodplain Soils (F19) (MLRA 149B) Sandy Gleyed Matrix (S4) Redox Depressions (F8) Mesic Spodic (TA6) (MLRA 144A, 145, 149B) Sandy Redox (S5) Red Parent Material (TF2) Stripped Matrix (S6) Very Shallow Dark Surface (TF12) Dark Surface (S7) (LRR R, MLRA 149B) Other (Explain in Remarks) 3Indicators of hydrophytic vegetation and wetland hydrology must be present, unless disturbed or problematic. Restrictive Layer (if observed): Type:
Depth (inches):
Hydric Soil Present? Yes No
Remarks:
242-W
0-8
8-15
15-24
10YR 2/1
2.5Y 4/2
2.5Y 5/3
100
95
85
5YR 4/6
5YR 4/610YR 5/2
5
105
C
CD
M
MM
si l
vfsl
fsl
mucky
firm
x
x
lodgement till
15 XX
Data Plot 242-W is located 8 feet west of WF# 242.Data Plot 242-U is located 8 feet east of WF# 242.The approximate difference in elevation from Plot 242-W to 242-U is two feet.

US Army Corps of Engineers Northcentral and Northeast Region – Interim Version
WETLAND DETERMINATION DATA FORM – Northcentral and Northeast Region Project/Site: City/County: Sampling Date:
Applicant/Owner: State: Sampling Point:
Investigator(s): Section, Township, Range:
Landform (hillslope, terrace, etc.): Local relief (concave, convex, none):
Slope (%): Lat: Long: Datum:
Soil Map Unit Name: NWI classification:
Are climatic / hydrologic conditions on the site typical for this time of year? Yes No (If no, explain in Remarks.)
Are Vegetation , Soil , or Hydrology significantly disturbed? Are “Normal Circumstances” present? Yes No
Are Vegetation , Soil , or Hydrology naturally problematic? (If needed, explain any answers in Remarks.)
SUMMARY OF FINDINGS – Attach site map showing sampling point locations, transects, important features, etc.
Hydrophytic Vegetation Present? Yes No Hydric Soil Present? Yes No Wetland Hydrology Present? Yes No
Is the Sampled Area within a Wetland? Yes No
If yes, optional Wetland Site ID: Remarks: (Explain alternative procedures here or in a separate report.)
HYDROLOGY Wetland Hydrology Indicators: Secondary Indicators (minimum of two required) Primary Indicators (minimum of one is required; check all that apply) Surface Soil Cracks (B6) Surface Water (A1) Water-Stained Leaves (B9) Drainage Patterns (B10) High Water Table (A2) Aquatic Fauna (B13) Moss Trim Lines (B16) Saturation (A3) Marl Deposits (B15) Dry-Season Water Table (C2) Water Marks (B1) Hydrogen Sulfide Odor (C1) Crayfish Burrows (C8) Sediment Deposits (B2) Oxidized Rhizospheres on Living Roots (C3) Saturation Visible on Aerial Imagery (C9) Drift Deposits (B3) Presence of Reduced Iron (C4) Stunted or Stressed Plants (D1) Algal Mat or Crust (B4) Recent Iron Reduction in Tilled Soils (C6) Geomorphic Position (D2) Iron Deposits (B5) Thin Muck Surface (C7) Shallow Aquitard (D3) Inundation Visible on Aerial Imagery (B7) Other (Explain in Remarks) Microtopographic Relief (D4) Sparsely Vegetated Concave Surface (B8) FAC-Neutral Test (D5) Field Observations: Surface Water Present? Yes No Depth (inches): Water Table Present? Yes No Depth (inches): Saturation Present? Yes No Depth (inches): (includes capillary fringe)
Wetland Hydrology Present? Yes No
Describe Recorded Data (stream gauge, monitoring well, aerial photos, previous inspections), if available:
Remarks:
Proposed solar project transmission line route New Milford/Litchfield May 4, 2017Amec Foster Wheeler Environment & Infrastructure, Inc. CT 242-U
Thomas W. Pietras, PEG, LLChillside convex
25% 41.574019 -73.444019 375 ftWoodbridge fine sandy loam (Aquic Udorthents)
Xno no no XXno no no
XX XX
X
XXX X

US Army Corps of Engineers Northcentral and Northeast Region – Interim Version
VEGETATION – Use scientific names of plants. Sampling Point:
Dominance Test worksheet: Number of Dominant Species That Are OBL, FACW, or FAC: (A) Total Number of Dominant Species Across All Strata: (B) Percent of Dominant Species That Are OBL, FACW, or FAC: (A/B)
Prevalence Index worksheet: Total % Cover of: Multiply by: OBL species x 1 = FACW species x 2 = FAC species x 3 = FACU species x 4 = UPL species x 5 = Column Totals: (A) (B)
Prevalence Index = B/A =
Hydrophytic Vegetation Indicators: Rapid Test for Hydrophytic Vegetation Dominance Test is >50% Prevalence Index is 3.01 Morphological Adaptations1 (Provide supporting data in Remarks or on a separate sheet) Problematic Hydrophytic Vegetation1 (Explain) 1Indicators of hydric soil and wetland hydrology must be present, unless disturbed or problematic.
Definitions of Vegetation Strata: Tree – Woody plants 3 in. (7.6 cm) or more in diameter at breast height (DBH), regardless of height. Sapling/shrub – Woody plants less than 3 in. DBH and greater than 3.28 ft (1 m) tall. Herb – All herbaceous (non-woody) plants, regardless of size, and woody plants less than 3.28 ft tall. Woody vines – All woody vines greater than 3.28 ft in height.
Absolute Dominant Indicator Tree Stratum (Plot size: ) % Cover Species? Status
1.
2.
3.
4.
5.
6.
7.
= Total Cover
Sapling/Shrub Stratum (Plot size: )
1.
2.
3.
4.
5.
6.
7.
= Total Cover
Herb Stratum (Plot size: )
1.
2.
3.
4.
5.
6.
7.
8.
9.
10.
11.
12.
= Total Cover
Woody Vine Stratum (Plot size: )
1.
2.
3.
4.
= Total Cover
Hydrophytic Vegetation Present? Yes No
Remarks: (Include photo numbers here or on a separate sheet.)
242-U
30 ftFraxinum americanaQuercus rubraAcer saccharumBetula lentaBetula populifolia
25252085
YYYNN
FACUFACUFACUFACUFAC
0
5
0
15 ft83
15 Y FACUFagus grandifolia
5 ft15
Polystichum acrostichoidesMaianthemum canadense
1532
YNN
FACUFACUFACU
Dryopteris marginalis
30 ft20
XX0

US Army Corps of Engineers Northcentral and Northeast Region – Interim Version
SOIL Sampling Point:
Profile Description: (Describe to the depth needed to document the indicator or confirm the absence of indicators.) Depth Matrix Redox Features (inches) Color (moist) % Color (moist) % Type1 Loc2 Texture Remarks
1Type: C=Concentration, D=Depletion, RM=Reduced Matrix, CS=Covered or Coated Sand Grains. 2Location: PL=Pore Lining, M=Matrix. Hydric Soil Indicators: Indicators for Problematic Hydric Soils3: Histosol (A1) Polyvalue Below Surface (S8) (LRR R, 2 cm Muck (A10) (LRR K, L, MLRA 149B) Histic Epipedon (A2) MLRA 149B) Coast Prairie Redox (A16) (LRR K, L, R) Black Histic (A3) Thin Dark Surface (S9) (LRR R, MLRA 149B) 5 cm Mucky Peat or Peat (S3) (LRR K, L, R) Hydrogen Sulfide (A4) Loamy Mucky Mineral (F1) (LRR K, L) Dark Surface (S7) (LRR K, L) Stratified Layers (A5) Loamy Gleyed Matrix (F2) Polyvalue Below Surface (S8) (LRR K, L) Depleted Below Dark Surface (A11) Depleted Matrix (F3) Thin Dark Surface (S9) (LRR K, L) Thick Dark Surface (A12) Redox Dark Surface (F6) Iron-Manganese Masses (F12) (LRR K, L, R) Sandy Mucky Mineral (S1) Depleted Dark Surface (F7) Piedmont Floodplain Soils (F19) (MLRA 149B) Sandy Gleyed Matrix (S4) Redox Depressions (F8) Mesic Spodic (TA6) (MLRA 144A, 145, 149B) Sandy Redox (S5) Red Parent Material (TF2) Stripped Matrix (S6) Very Shallow Dark Surface (TF12) Dark Surface (S7) (LRR R, MLRA 149B) Other (Explain in Remarks) 3Indicators of hydrophytic vegetation and wetland hydrology must be present, unless disturbed or problematic. Restrictive Layer (if observed): Type:
Depth (inches):
Hydric Soil Present? Yes No
Remarks:
242-U
1/2 to 00-4
4-9
9-16
16-22
10YR 3/2
10YR 4/4
10YR 5/4
10YR 5/3
100
100
100
100
vfsl
fsl
fsl
fsl
leaf litterstony
very stony
stony
stony
XX

US Army Corps of Engineers Northcentral and Northeast Region – Interim Version
WETLAND DETERMINATION DATA FORM – Northcentral and Northeast Region Project/Site: City/County: Sampling Date:
Applicant/Owner: State: Sampling Point:
Investigator(s): Section, Township, Range:
Landform (hillslope, terrace, etc.): Local relief (concave, convex, none):
Slope (%): Lat: Long: Datum:
Soil Map Unit Name: NWI classification:
Are climatic / hydrologic conditions on the site typical for this time of year? Yes No (If no, explain in Remarks.)
Are Vegetation , Soil , or Hydrology significantly disturbed? Are “Normal Circumstances” present? Yes No
Are Vegetation , Soil , or Hydrology naturally problematic? (If needed, explain any answers in Remarks.)
SUMMARY OF FINDINGS – Attach site map showing sampling point locations, transects, important features, etc.
Hydrophytic Vegetation Present? Yes No Hydric Soil Present? Yes No Wetland Hydrology Present? Yes No
Is the Sampled Area within a Wetland? Yes No
If yes, optional Wetland Site ID: Remarks: (Explain alternative procedures here or in a separate report.)
HYDROLOGY Wetland Hydrology Indicators: Secondary Indicators (minimum of two required) Primary Indicators (minimum of one is required; check all that apply) Surface Soil Cracks (B6) Surface Water (A1) Water-Stained Leaves (B9) Drainage Patterns (B10) High Water Table (A2) Aquatic Fauna (B13) Moss Trim Lines (B16) Saturation (A3) Marl Deposits (B15) Dry-Season Water Table (C2) Water Marks (B1) Hydrogen Sulfide Odor (C1) Crayfish Burrows (C8) Sediment Deposits (B2) Oxidized Rhizospheres on Living Roots (C3) Saturation Visible on Aerial Imagery (C9) Drift Deposits (B3) Presence of Reduced Iron (C4) Stunted or Stressed Plants (D1) Algal Mat or Crust (B4) Recent Iron Reduction in Tilled Soils (C6) Geomorphic Position (D2) Iron Deposits (B5) Thin Muck Surface (C7) Shallow Aquitard (D3) Inundation Visible on Aerial Imagery (B7) Other (Explain in Remarks) Microtopographic Relief (D4) Sparsely Vegetated Concave Surface (B8) FAC-Neutral Test (D5) Field Observations: Surface Water Present? Yes No Depth (inches): Water Table Present? Yes No Depth (inches): Saturation Present? Yes No Depth (inches): (includes capillary fringe)
Wetland Hydrology Present? Yes No
Describe Recorded Data (stream gauge, monitoring well, aerial photos, previous inspections), if available:
Remarks:
Proposed solar project transmission line route New Milford/Litchfield May 4, 2017Amec Foster Wheeler Environment & Infrastructure, Inc. CT 272-W
Thomas W. Pietras, PEG, LLChillside seep concave
5% 41.575873 -73.440146 365 ftRidgebury fine sandy loam (Epiaquepts) PFO
Xno no no XXno no no
XXXX XX
XX
XX
XX 1X
XX
0 X

US Army Corps of Engineers Northcentral and Northeast Region – Interim Version
VEGETATION – Use scientific names of plants. Sampling Point:
Dominance Test worksheet: Number of Dominant Species That Are OBL, FACW, or FAC: (A) Total Number of Dominant Species Across All Strata: (B) Percent of Dominant Species That Are OBL, FACW, or FAC: (A/B)
Prevalence Index worksheet: Total % Cover of: Multiply by: OBL species x 1 = FACW species x 2 = FAC species x 3 = FACU species x 4 = UPL species x 5 = Column Totals: (A) (B)
Prevalence Index = B/A =
Hydrophytic Vegetation Indicators: Rapid Test for Hydrophytic Vegetation Dominance Test is >50% Prevalence Index is 3.01 Morphological Adaptations1 (Provide supporting data in Remarks or on a separate sheet) Problematic Hydrophytic Vegetation1 (Explain) 1Indicators of hydric soil and wetland hydrology must be present, unless disturbed or problematic.
Definitions of Vegetation Strata: Tree – Woody plants 3 in. (7.6 cm) or more in diameter at breast height (DBH), regardless of height. Sapling/shrub – Woody plants less than 3 in. DBH and greater than 3.28 ft (1 m) tall. Herb – All herbaceous (non-woody) plants, regardless of size, and woody plants less than 3.28 ft tall. Woody vines – All woody vines greater than 3.28 ft in height.
Absolute Dominant Indicator Tree Stratum (Plot size: ) % Cover Species? Status
1.
2.
3.
4.
5.
6.
7.
= Total Cover
Sapling/Shrub Stratum (Plot size: )
1.
2.
3.
4.
5.
6.
7.
= Total Cover
Herb Stratum (Plot size: )
1.
2.
3.
4.
5.
6.
7.
8.
9.
10.
11.
12.
= Total Cover
Woody Vine Stratum (Plot size: )
1.
2.
3.
4.
= Total Cover
Hydrophytic Vegetation Present? Yes No
Remarks: (Include photo numbers here or on a separate sheet.)
272-W
30 ftPicea rubensFraxinus americana
4020
YY
FACUFACU
4
7
57
15 ft60
Ulmus americanaViburnum sp.
15158
YYN
FACWFACW-
Lindera benzoin
5 ft38
Impatiens capensisPersicaria amphibiaPoa palustrisSolidago sp.Allium canadense
301510853
YYNNNN
OBLFACWOBLFACW-FACU
Symplocarpus foetidus
30 ft71
Celastrus orbiculata 5 Y UPL
XX5
X
US Army Corps of Engineers Northcentral and Northeast Region – Interim Version
SOIL Sampling Point:
Profile Description: (Describe to the depth needed to document the indicator or confirm the absence of indicators.) Depth Matrix Redox Features (inches) Color (moist) % Color (moist) % Type1 Loc2 Texture Remarks
1Type: C=Concentration, D=Depletion, RM=Reduced Matrix, CS=Covered or Coated Sand Grains. 2Location: PL=Pore Lining, M=Matrix. Hydric Soil Indicators: Indicators for Problematic Hydric Soils3: Histosol (A1) Polyvalue Below Surface (S8) (LRR R, 2 cm Muck (A10) (LRR K, L, MLRA 149B) Histic Epipedon (A2) MLRA 149B) Coast Prairie Redox (A16) (LRR K, L, R) Black Histic (A3) Thin Dark Surface (S9) (LRR R, MLRA 149B) 5 cm Mucky Peat or Peat (S3) (LRR K, L, R) Hydrogen Sulfide (A4) Loamy Mucky Mineral (F1) (LRR K, L) Dark Surface (S7) (LRR K, L) Stratified Layers (A5) Loamy Gleyed Matrix (F2) Polyvalue Below Surface (S8) (LRR K, L) Depleted Below Dark Surface (A11) Depleted Matrix (F3) Thin Dark Surface (S9) (LRR K, L) Thick Dark Surface (A12) Redox Dark Surface (F6) Iron-Manganese Masses (F12) (LRR K, L, R) Sandy Mucky Mineral (S1) Depleted Dark Surface (F7) Piedmont Floodplain Soils (F19) (MLRA 149B) Sandy Gleyed Matrix (S4) Redox Depressions (F8) Mesic Spodic (TA6) (MLRA 144A, 145, 149B) Sandy Redox (S5) Red Parent Material (TF2) Stripped Matrix (S6) Very Shallow Dark Surface (TF12) Dark Surface (S7) (LRR R, MLRA 149B) Other (Explain in Remarks) 3Indicators of hydrophytic vegetation and wetland hydrology must be present, unless disturbed or problematic. Restrictive Layer (if observed): Type:
Depth (inches):
Hydric Soil Present? Yes No
Remarks:
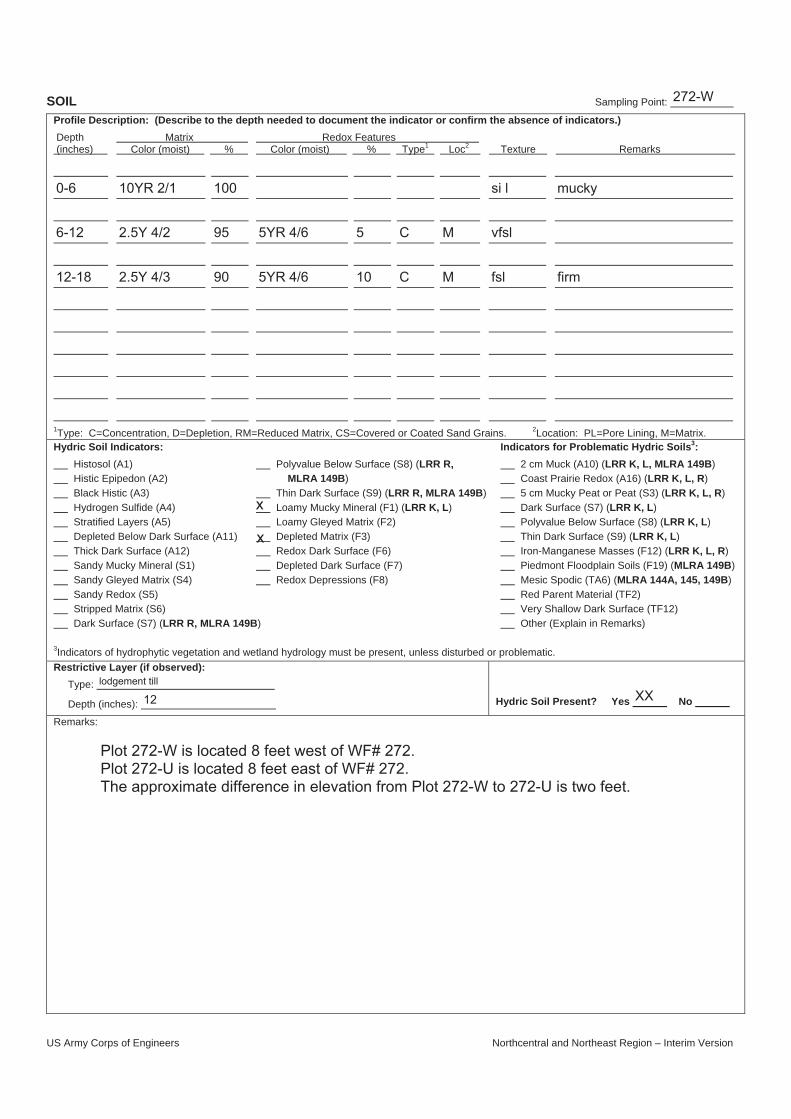
272-W
0-6
6-12
12-18
10YR 2/1
2.5Y 4/2
2.5Y 4/3
100
95
90
5YR 4/6
5YR 4/6
5
10
C
C
M
M
si l
vfsl
fsl
mucky
firm
x
x
lodgement till
12 XX
Plot 272-W is located 8 feet west of WF# 272.Plot 272-U is located 8 feet east of WF# 272.The approximate difference in elevation from Plot 272-W to 272-U is two feet.

US Army Corps of Engineers Northcentral and Northeast Region – Interim Version
WETLAND DETERMINATION DATA FORM – Northcentral and Northeast Region Project/Site: City/County: Sampling Date:
Applicant/Owner: State: Sampling Point:
Investigator(s): Section, Township, Range:
Landform (hillslope, terrace, etc.): Local relief (concave, convex, none):
Slope (%): Lat: Long: Datum:
Soil Map Unit Name: NWI classification:
Are climatic / hydrologic conditions on the site typical for this time of year? Yes No (If no, explain in Remarks.)
Are Vegetation , Soil , or Hydrology significantly disturbed? Are “Normal Circumstances” present? Yes No
Are Vegetation , Soil , or Hydrology naturally problematic? (If needed, explain any answers in Remarks.)
SUMMARY OF FINDINGS – Attach site map showing sampling point locations, transects, important features, etc.
Hydrophytic Vegetation Present? Yes No Hydric Soil Present? Yes No Wetland Hydrology Present? Yes No
Is the Sampled Area within a Wetland? Yes No
If yes, optional Wetland Site ID: Remarks: (Explain alternative procedures here or in a separate report.)
HYDROLOGY Wetland Hydrology Indicators: Secondary Indicators (minimum of two required) Primary Indicators (minimum of one is required; check all that apply) Surface Soil Cracks (B6) Surface Water (A1) Water-Stained Leaves (B9) Drainage Patterns (B10) High Water Table (A2) Aquatic Fauna (B13) Moss Trim Lines (B16) Saturation (A3) Marl Deposits (B15) Dry-Season Water Table (C2) Water Marks (B1) Hydrogen Sulfide Odor (C1) Crayfish Burrows (C8) Sediment Deposits (B2) Oxidized Rhizospheres on Living Roots (C3) Saturation Visible on Aerial Imagery (C9) Drift Deposits (B3) Presence of Reduced Iron (C4) Stunted or Stressed Plants (D1) Algal Mat or Crust (B4) Recent Iron Reduction in Tilled Soils (C6) Geomorphic Position (D2) Iron Deposits (B5) Thin Muck Surface (C7) Shallow Aquitard (D3) Inundation Visible on Aerial Imagery (B7) Other (Explain in Remarks) Microtopographic Relief (D4) Sparsely Vegetated Concave Surface (B8) FAC-Neutral Test (D5) Field Observations: Surface Water Present? Yes No Depth (inches): Water Table Present? Yes No Depth (inches): Saturation Present? Yes No Depth (inches): (includes capillary fringe)
Wetland Hydrology Present? Yes No
Describe Recorded Data (stream gauge, monitoring well, aerial photos, previous inspections), if available:
Remarks:
Proposed solar project transmission line route New Milford/Litchfield May 4, 2017Amec Foster Wheeler Environment & Infrastructure, Inc. CT 272-U
Thomas W. Pietras, PEG, LLChillside convex
25% 41.575870 -73.440114 367 ftWoodbridge fine sandy loam (Aquic Udorthents)
Xno no no XXno no no
XX XX
X
XXX X

US Army Corps of Engineers Northcentral and Northeast Region – Interim Version
VEGETATION – Use scientific names of plants. Sampling Point:
Dominance Test worksheet: Number of Dominant Species That Are OBL, FACW, or FAC: (A) Total Number of Dominant Species Across All Strata: (B) Percent of Dominant Species That Are OBL, FACW, or FAC: (A/B)
Prevalence Index worksheet: Total % Cover of: Multiply by: OBL species x 1 = FACW species x 2 = FAC species x 3 = FACU species x 4 = UPL species x 5 = Column Totals: (A) (B)
Prevalence Index = B/A =
Hydrophytic Vegetation Indicators: Rapid Test for Hydrophytic Vegetation Dominance Test is >50% Prevalence Index is 3.01 Morphological Adaptations1 (Provide supporting data in Remarks or on a separate sheet) Problematic Hydrophytic Vegetation1 (Explain) 1Indicators of hydric soil and wetland hydrology must be present, unless disturbed or problematic.
Definitions of Vegetation Strata: Tree – Woody plants 3 in. (7.6 cm) or more in diameter at breast height (DBH), regardless of height. Sapling/shrub – Woody plants less than 3 in. DBH and greater than 3.28 ft (1 m) tall. Herb – All herbaceous (non-woody) plants, regardless of size, and woody plants less than 3.28 ft tall. Woody vines – All woody vines greater than 3.28 ft in height.
Absolute Dominant Indicator Tree Stratum (Plot size: ) % Cover Species? Status
1.
2.
3.
4.
5.
6.
7.
= Total Cover
Sapling/Shrub Stratum (Plot size: )
1.
2.
3.
4.
5.
6.
7.
= Total Cover
Herb Stratum (Plot size: )
1.
2.
3.
4.
5.
6.
7.
8.
9.
10.
11.
12.
= Total Cover
Woody Vine Stratum (Plot size: )
1.
2.
3.
4.
= Total Cover
Hydrophytic Vegetation Present? Yes No
Remarks: (Include photo numbers here or on a separate sheet.)
272-U
30 ftPicea rubensFraxinus americana
5025
YY
FACUFACU
3
9
33
15 ft75
Ulmus americanaLindera benzoin
553
YYY
FACWFACWFACW
Viburnum recognitum
5 ft13
Polystichum acrostichoidesDryopteris marginalis
853
YYY
UPLFACUFACU
Celastrus orbiculata
30 ft16
Celastrus orbiculata 8 Y UPL
XX8

US Army Corps of Engineers Northcentral and Northeast Region – Interim Version
SOIL Sampling Point:
Profile Description: (Describe to the depth needed to document the indicator or confirm the absence of indicators.) Depth Matrix Redox Features (inches) Color (moist) % Color (moist) % Type1 Loc2 Texture Remarks
1Type: C=Concentration, D=Depletion, RM=Reduced Matrix, CS=Covered or Coated Sand Grains. 2Location: PL=Pore Lining, M=Matrix. Hydric Soil Indicators: Indicators for Problematic Hydric Soils3: Histosol (A1) Polyvalue Below Surface (S8) (LRR R, 2 cm Muck (A10) (LRR K, L, MLRA 149B) Histic Epipedon (A2) MLRA 149B) Coast Prairie Redox (A16) (LRR K, L, R) Black Histic (A3) Thin Dark Surface (S9) (LRR R, MLRA 149B) 5 cm Mucky Peat or Peat (S3) (LRR K, L, R) Hydrogen Sulfide (A4) Loamy Mucky Mineral (F1) (LRR K, L) Dark Surface (S7) (LRR K, L) Stratified Layers (A5) Loamy Gleyed Matrix (F2) Polyvalue Below Surface (S8) (LRR K, L) Depleted Below Dark Surface (A11) Depleted Matrix (F3) Thin Dark Surface (S9) (LRR K, L) Thick Dark Surface (A12) Redox Dark Surface (F6) Iron-Manganese Masses (F12) (LRR K, L, R) Sandy Mucky Mineral (S1) Depleted Dark Surface (F7) Piedmont Floodplain Soils (F19) (MLRA 149B) Sandy Gleyed Matrix (S4) Redox Depressions (F8) Mesic Spodic (TA6) (MLRA 144A, 145, 149B) Sandy Redox (S5) Red Parent Material (TF2) Stripped Matrix (S6) Very Shallow Dark Surface (TF12) Dark Surface (S7) (LRR R, MLRA 149B) Other (Explain in Remarks) 3Indicators of hydrophytic vegetation and wetland hydrology must be present, unless disturbed or problematic. Restrictive Layer (if observed): Type:
Depth (inches):
Hydric Soil Present? Yes No
Remarks:
272-U
1/2 to 00-4
4-16
16-20
10YR 3/3
10YR 4/4 & 10YR 5/3
10YR 5/3
100
mixed
100
fsl
fsl
fsl
leaf litter
very stony
stony
XX

US Army Corps of Engineers Northcentral and Northeast Region – Interim Version
WETLAND DETERMINATION DATA FORM – Northcentral and Northeast Region Project/Site: City/County: Sampling Date:
Applicant/Owner: State: Sampling Point:
Investigator(s): Section, Township, Range:
Landform (hillslope, terrace, etc.): Local relief (concave, convex, none):
Slope (%): Lat: Long: Datum:
Soil Map Unit Name: NWI classification:
Are climatic / hydrologic conditions on the site typical for this time of year? Yes No (If no, explain in Remarks.)
Are Vegetation , Soil , or Hydrology significantly disturbed? Are “Normal Circumstances” present? Yes No
Are Vegetation , Soil , or Hydrology naturally problematic? (If needed, explain any answers in Remarks.)
SUMMARY OF FINDINGS – Attach site map showing sampling point locations, transects, important features, etc.
Hydrophytic Vegetation Present? Yes No Hydric Soil Present? Yes No Wetland Hydrology Present? Yes No
Is the Sampled Area within a Wetland? Yes No
If yes, optional Wetland Site ID: Remarks: (Explain alternative procedures here or in a separate report.)
HYDROLOGY Wetland Hydrology Indicators: Secondary Indicators (minimum of two required) Primary Indicators (minimum of one is required; check all that apply) Surface Soil Cracks (B6) Surface Water (A1) Water-Stained Leaves (B9) Drainage Patterns (B10) High Water Table (A2) Aquatic Fauna (B13) Moss Trim Lines (B16) Saturation (A3) Marl Deposits (B15) Dry-Season Water Table (C2) Water Marks (B1) Hydrogen Sulfide Odor (C1) Crayfish Burrows (C8) Sediment Deposits (B2) Oxidized Rhizospheres on Living Roots (C3) Saturation Visible on Aerial Imagery (C9) Drift Deposits (B3) Presence of Reduced Iron (C4) Stunted or Stressed Plants (D1) Algal Mat or Crust (B4) Recent Iron Reduction in Tilled Soils (C6) Geomorphic Position (D2) Iron Deposits (B5) Thin Muck Surface (C7) Shallow Aquitard (D3) Inundation Visible on Aerial Imagery (B7) Other (Explain in Remarks) Microtopographic Relief (D4) Sparsely Vegetated Concave Surface (B8) FAC-Neutral Test (D5) Field Observations: Surface Water Present? Yes No Depth (inches): Water Table Present? Yes No Depth (inches): Saturation Present? Yes No Depth (inches): (includes capillary fringe)
Wetland Hydrology Present? Yes No
Describe Recorded Data (stream gauge, monitoring well, aerial photos, previous inspections), if available:
Remarks:
Proposed solar project transmission line route New Milford/Litchfield May 4, 2017Amec Foster Wheeler Environment & Infrastructure, Inc. CT 326-W
Thomas W. Pietras, PEG, LLChillside seep concave
5% 41.578156 -73.439631 345 ftRidgebury fine sandy loam (Epiaquepts) PFO
Xno no no XXno no no
XXXX XX
XX
XX
XX 1X
XX
0 X

US Army Corps of Engineers Northcentral and Northeast Region – Interim Version
VEGETATION – Use scientific names of plants. Sampling Point:
Dominance Test worksheet: Number of Dominant Species That Are OBL, FACW, or FAC: (A) Total Number of Dominant Species Across All Strata: (B) Percent of Dominant Species That Are OBL, FACW, or FAC: (A/B)
Prevalence Index worksheet: Total % Cover of: Multiply by: OBL species x 1 = FACW species x 2 = FAC species x 3 = FACU species x 4 = UPL species x 5 = Column Totals: (A) (B)
Prevalence Index = B/A =
Hydrophytic Vegetation Indicators: Rapid Test for Hydrophytic Vegetation Dominance Test is >50% Prevalence Index is 3.01 Morphological Adaptations1 (Provide supporting data in Remarks or on a separate sheet) Problematic Hydrophytic Vegetation1 (Explain) 1Indicators of hydric soil and wetland hydrology must be present, unless disturbed or problematic.
Definitions of Vegetation Strata: Tree – Woody plants 3 in. (7.6 cm) or more in diameter at breast height (DBH), regardless of height. Sapling/shrub – Woody plants less than 3 in. DBH and greater than 3.28 ft (1 m) tall. Herb – All herbaceous (non-woody) plants, regardless of size, and woody plants less than 3.28 ft tall. Woody vines – All woody vines greater than 3.28 ft in height.
Absolute Dominant Indicator Tree Stratum (Plot size: ) % Cover Species? Status
1.
2.
3.
4.
5.
6.
7.
= Total Cover
Sapling/Shrub Stratum (Plot size: )
1.
2.
3.
4.
5.
6.
7.
= Total Cover
Herb Stratum (Plot size: )
1.
2.
3.
4.
5.
6.
7.
8.
9.
10.
11.
12.
= Total Cover
Woody Vine Stratum (Plot size: )
1.
2.
3.
4.
= Total Cover
Hydrophytic Vegetation Present? Yes No
Remarks: (Include photo numbers here or on a separate sheet.)
326-W
30 ftAcer rubrumFraxinus americana
158
YY
FACFACU
3
4
75
15 ft45
20 Y FACWLindera benzoin
5 ft20
Symplocarpus foetidusSolidago sp.Berberis thunbergiiEquisetum hyemaleAllium canadense
5088553
YNNNNN
FACWOBL-FACUFACFACU
Impatiens capensis
30 ft79
XX0
X

US Army Corps of Engineers Northcentral and Northeast Region – Interim Version
SOIL Sampling Point:
Profile Description: (Describe to the depth needed to document the indicator or confirm the absence of indicators.) Depth Matrix Redox Features (inches) Color (moist) % Color (moist) % Type1 Loc2 Texture Remarks
1Type: C=Concentration, D=Depletion, RM=Reduced Matrix, CS=Covered or Coated Sand Grains. 2Location: PL=Pore Lining, M=Matrix. Hydric Soil Indicators: Indicators for Problematic Hydric Soils3: Histosol (A1) Polyvalue Below Surface (S8) (LRR R, 2 cm Muck (A10) (LRR K, L, MLRA 149B) Histic Epipedon (A2) MLRA 149B) Coast Prairie Redox (A16) (LRR K, L, R) Black Histic (A3) Thin Dark Surface (S9) (LRR R, MLRA 149B) 5 cm Mucky Peat or Peat (S3) (LRR K, L, R) Hydrogen Sulfide (A4) Loamy Mucky Mineral (F1) (LRR K, L) Dark Surface (S7) (LRR K, L) Stratified Layers (A5) Loamy Gleyed Matrix (F2) Polyvalue Below Surface (S8) (LRR K, L) Depleted Below Dark Surface (A11) Depleted Matrix (F3) Thin Dark Surface (S9) (LRR K, L) Thick Dark Surface (A12) Redox Dark Surface (F6) Iron-Manganese Masses (F12) (LRR K, L, R) Sandy Mucky Mineral (S1) Depleted Dark Surface (F7) Piedmont Floodplain Soils (F19) (MLRA 149B) Sandy Gleyed Matrix (S4) Redox Depressions (F8) Mesic Spodic (TA6) (MLRA 144A, 145, 149B) Sandy Redox (S5) Red Parent Material (TF2) Stripped Matrix (S6) Very Shallow Dark Surface (TF12) Dark Surface (S7) (LRR R, MLRA 149B) Other (Explain in Remarks) 3Indicators of hydrophytic vegetation and wetland hydrology must be present, unless disturbed or problematic. Restrictive Layer (if observed): Type:
Depth (inches):
Hydric Soil Present? Yes No
Remarks:
326-W
0-4
4-10
10-18
10YR 2/2
2.5Y 5/2
2.5Y 4/2
100
95
90
5YR 4/6
5YR 4/6
5
10
C
C
M
M
si l
vfsl
vfsl
mucky
firm
x
x
lodgement till
10 XX
Plot 326-W is located 6 feet west of WF# 326.Plot 326-U is located 6 feet east of WF# 326.The approximate difference in elevation from Plot 326-W to 326-U is two feet.

US Army Corps of Engineers Northcentral and Northeast Region – Interim Version
WETLAND DETERMINATION DATA FORM – Northcentral and Northeast Region Project/Site: City/County: Sampling Date:
Applicant/Owner: State: Sampling Point:
Investigator(s): Section, Township, Range:
Landform (hillslope, terrace, etc.): Local relief (concave, convex, none):
Slope (%): Lat: Long: Datum:
Soil Map Unit Name: NWI classification:
Are climatic / hydrologic conditions on the site typical for this time of year? Yes No (If no, explain in Remarks.)
Are Vegetation , Soil , or Hydrology significantly disturbed? Are “Normal Circumstances” present? Yes No
Are Vegetation , Soil , or Hydrology naturally problematic? (If needed, explain any answers in Remarks.)
SUMMARY OF FINDINGS – Attach site map showing sampling point locations, transects, important features, etc.
Hydrophytic Vegetation Present? Yes No Hydric Soil Present? Yes No Wetland Hydrology Present? Yes No
Is the Sampled Area within a Wetland? Yes No
If yes, optional Wetland Site ID: Remarks: (Explain alternative procedures here or in a separate report.)
HYDROLOGY Wetland Hydrology Indicators: Secondary Indicators (minimum of two required) Primary Indicators (minimum of one is required; check all that apply) Surface Soil Cracks (B6) Surface Water (A1) Water-Stained Leaves (B9) Drainage Patterns (B10) High Water Table (A2) Aquatic Fauna (B13) Moss Trim Lines (B16) Saturation (A3) Marl Deposits (B15) Dry-Season Water Table (C2) Water Marks (B1) Hydrogen Sulfide Odor (C1) Crayfish Burrows (C8) Sediment Deposits (B2) Oxidized Rhizospheres on Living Roots (C3) Saturation Visible on Aerial Imagery (C9) Drift Deposits (B3) Presence of Reduced Iron (C4) Stunted or Stressed Plants (D1) Algal Mat or Crust (B4) Recent Iron Reduction in Tilled Soils (C6) Geomorphic Position (D2) Iron Deposits (B5) Thin Muck Surface (C7) Shallow Aquitard (D3) Inundation Visible on Aerial Imagery (B7) Other (Explain in Remarks) Microtopographic Relief (D4) Sparsely Vegetated Concave Surface (B8) FAC-Neutral Test (D5) Field Observations: Surface Water Present? Yes No Depth (inches): Water Table Present? Yes No Depth (inches): Saturation Present? Yes No Depth (inches): (includes capillary fringe)
Wetland Hydrology Present? Yes No
Describe Recorded Data (stream gauge, monitoring well, aerial photos, previous inspections), if available:
Remarks:
Proposed solar project transmission line route New Milford/Litchfield May 4, 2017Amec Foster Wheeler Environment & Infrastructure, Inc. CT 326-U
Thomas W. Pietras, PEG, LLChillside convex
30% 41.578148 -73.439575 347 ftWoodbridge fine sandy loam (Aquic Udorthents)
Xno no no XXno no no
XX XX
X
XX 20X 14 X

US Army Corps of Engineers Northcentral and Northeast Region – Interim Version
VEGETATION – Use scientific names of plants. Sampling Point:
Dominance Test worksheet: Number of Dominant Species That Are OBL, FACW, or FAC: (A) Total Number of Dominant Species Across All Strata: (B) Percent of Dominant Species That Are OBL, FACW, or FAC: (A/B)
Prevalence Index worksheet: Total % Cover of: Multiply by: OBL species x 1 = FACW species x 2 = FAC species x 3 = FACU species x 4 = UPL species x 5 = Column Totals: (A) (B)
Prevalence Index = B/A =
Hydrophytic Vegetation Indicators: Rapid Test for Hydrophytic Vegetation Dominance Test is >50% Prevalence Index is 3.01 Morphological Adaptations1 (Provide supporting data in Remarks or on a separate sheet) Problematic Hydrophytic Vegetation1 (Explain) 1Indicators of hydric soil and wetland hydrology must be present, unless disturbed or problematic.
Definitions of Vegetation Strata: Tree – Woody plants 3 in. (7.6 cm) or more in diameter at breast height (DBH), regardless of height. Sapling/shrub – Woody plants less than 3 in. DBH and greater than 3.28 ft (1 m) tall. Herb – All herbaceous (non-woody) plants, regardless of size, and woody plants less than 3.28 ft tall. Woody vines – All woody vines greater than 3.28 ft in height.
Absolute Dominant Indicator Tree Stratum (Plot size: ) % Cover Species? Status
1.
2.
3.
4.
5.
6.
7.
= Total Cover
Sapling/Shrub Stratum (Plot size: )
1.
2.
3.
4.
5.
6.
7.
= Total Cover
Herb Stratum (Plot size: )
1.
2.
3.
4.
5.
6.
7.
8.
9.
10.
11.
12.
= Total Cover
Woody Vine Stratum (Plot size: )
1.
2.
3.
4.
= Total Cover
Hydrophytic Vegetation Present? Yes No
Remarks: (Include photo numbers here or on a separate sheet.)
326-U
30 ftFraxinus americanaAcer rubrum
2520
YY
FACUFAC
3
6
50
15 ft45
Carpinus carolinanaLindera benzoinBerberis thunbergii
10855
YYNN
FACFACFACWFACU
Acer rubrum
5 ft28
Allium canadenseMaianthemum canadenseArisaema triphyllum
10532
YYNN
FACUFACUFACUFAC
Polystichum acrostichoides
30 ft20
XX0

US Army Corps of Engineers Northcentral and Northeast Region – Interim Version
SOIL Sampling Point:
Profile Description: (Describe to the depth needed to document the indicator or confirm the absence of indicators.) Depth Matrix Redox Features (inches) Color (moist) % Color (moist) % Type1 Loc2 Texture Remarks
1Type: C=Concentration, D=Depletion, RM=Reduced Matrix, CS=Covered or Coated Sand Grains. 2Location: PL=Pore Lining, M=Matrix. Hydric Soil Indicators: Indicators for Problematic Hydric Soils3: Histosol (A1) Polyvalue Below Surface (S8) (LRR R, 2 cm Muck (A10) (LRR K, L, MLRA 149B) Histic Epipedon (A2) MLRA 149B) Coast Prairie Redox (A16) (LRR K, L, R) Black Histic (A3) Thin Dark Surface (S9) (LRR R, MLRA 149B) 5 cm Mucky Peat or Peat (S3) (LRR K, L, R) Hydrogen Sulfide (A4) Loamy Mucky Mineral (F1) (LRR K, L) Dark Surface (S7) (LRR K, L) Stratified Layers (A5) Loamy Gleyed Matrix (F2) Polyvalue Below Surface (S8) (LRR K, L) Depleted Below Dark Surface (A11) Depleted Matrix (F3) Thin Dark Surface (S9) (LRR K, L) Thick Dark Surface (A12) Redox Dark Surface (F6) Iron-Manganese Masses (F12) (LRR K, L, R) Sandy Mucky Mineral (S1) Depleted Dark Surface (F7) Piedmont Floodplain Soils (F19) (MLRA 149B) Sandy Gleyed Matrix (S4) Redox Depressions (F8) Mesic Spodic (TA6) (MLRA 144A, 145, 149B) Sandy Redox (S5) Red Parent Material (TF2) Stripped Matrix (S6) Very Shallow Dark Surface (TF12) Dark Surface (S7) (LRR R, MLRA 149B) Other (Explain in Remarks) 3Indicators of hydrophytic vegetation and wetland hydrology must be present, unless disturbed or problematic. Restrictive Layer (if observed): Type:
Depth (inches):
Hydric Soil Present? Yes No
Remarks:
326-U
1/2 to 00-5
5-14
14-22
10YR 3/2
110YR 5/3
10YR 5/3
100
100
98 5YR 4/6 2 C M
fsl
fsl
fsl
leaf litter
very stony
stony, firm to slight firm
XX

US Army Corps of Engineers Northcentral and Northeast Region – Interim Version
WETLAND DETERMINATION DATA FORM – Northcentral and Northeast Region Project/Site: City/County: Sampling Date:
Applicant/Owner: State: Sampling Point:
Investigator(s): Section, Township, Range:
Landform (hillslope, terrace, etc.): Local relief (concave, convex, none):
Slope (%): Lat: Long: Datum:
Soil Map Unit Name: NWI classification:
Are climatic / hydrologic conditions on the site typical for this time of year? Yes No (If no, explain in Remarks.)
Are Vegetation , Soil , or Hydrology significantly disturbed? Are “Normal Circumstances” present? Yes No
Are Vegetation , Soil , or Hydrology naturally problematic? (If needed, explain any answers in Remarks.)
SUMMARY OF FINDINGS – Attach site map showing sampling point locations, transects, important features, etc.
Hydrophytic Vegetation Present? Yes No Hydric Soil Present? Yes No Wetland Hydrology Present? Yes No
Is the Sampled Area within a Wetland? Yes No
If yes, optional Wetland Site ID: Remarks: (Explain alternative procedures here or in a separate report.)
HYDROLOGY Wetland Hydrology Indicators: Secondary Indicators (minimum of two required) Primary Indicators (minimum of one is required; check all that apply) Surface Soil Cracks (B6) Surface Water (A1) Water-Stained Leaves (B9) Drainage Patterns (B10) High Water Table (A2) Aquatic Fauna (B13) Moss Trim Lines (B16) Saturation (A3) Marl Deposits (B15) Dry-Season Water Table (C2) Water Marks (B1) Hydrogen Sulfide Odor (C1) Crayfish Burrows (C8) Sediment Deposits (B2) Oxidized Rhizospheres on Living Roots (C3) Saturation Visible on Aerial Imagery (C9) Drift Deposits (B3) Presence of Reduced Iron (C4) Stunted or Stressed Plants (D1) Algal Mat or Crust (B4) Recent Iron Reduction in Tilled Soils (C6) Geomorphic Position (D2) Iron Deposits (B5) Thin Muck Surface (C7) Shallow Aquitard (D3) Inundation Visible on Aerial Imagery (B7) Other (Explain in Remarks) Microtopographic Relief (D4) Sparsely Vegetated Concave Surface (B8) FAC-Neutral Test (D5) Field Observations: Surface Water Present? Yes No Depth (inches): Water Table Present? Yes No Depth (inches): Saturation Present? Yes No Depth (inches): (includes capillary fringe)
Wetland Hydrology Present? Yes No
Describe Recorded Data (stream gauge, monitoring well, aerial photos, previous inspections), if available:
Remarks:
Proposed Solar, Candlewood Mountain Road New Milford/Litchfield Co. 12-10-2016Amec Foster Wheeler Environment & Infrastructure, Inc. CT 32-W
Thomas W. Pietras, PEG, LLClower hill slope nearly level
1-3% 41.57567 -73.45152 805 ftLeicester loam (Aeric Endoaquepts) PFO
Xno no no XXno no no
XXXX XX
XX
XXX
X
X
X

US Army Corps of Engineers Northcentral and Northeast Region – Interim Version
VEGETATION – Use scientific names of plants. Sampling Point:
Dominance Test worksheet: Number of Dominant Species That Are OBL, FACW, or FAC: (A) Total Number of Dominant Species Across All Strata: (B) Percent of Dominant Species That Are OBL, FACW, or FAC: (A/B)
Prevalence Index worksheet: Total % Cover of: Multiply by: OBL species x 1 = FACW species x 2 = FAC species x 3 = FACU species x 4 = UPL species x 5 = Column Totals: (A) (B)
Prevalence Index = B/A =
Hydrophytic Vegetation Indicators: Rapid Test for Hydrophytic Vegetation Dominance Test is >50% Prevalence Index is 3.01 Morphological Adaptations1 (Provide supporting data in Remarks or on a separate sheet) Problematic Hydrophytic Vegetation1 (Explain) 1Indicators of hydric soil and wetland hydrology must be present, unless disturbed or problematic.
Definitions of Vegetation Strata: Tree – Woody plants 3 in. (7.6 cm) or more in diameter at breast height (DBH), regardless of height. Sapling/shrub – Woody plants less than 3 in. DBH and greater than 3.28 ft (1 m) tall. Herb – All herbaceous (non-woody) plants, regardless of size, and woody plants less than 3.28 ft tall. Woody vines – All woody vines greater than 3.28 ft in height.
Absolute Dominant Indicator Tree Stratum (Plot size: ) % Cover Species? Status
1.
2.
3.
4.
5.
6.
7.
= Total Cover
Sapling/Shrub Stratum (Plot size: )
1.
2.
3.
4.
5.
6.
7.
= Total Cover
Herb Stratum (Plot size: )
1.
2.
3.
4.
5.
6.
7.
8.
9.
10.
11.
12.
= Total Cover
Woody Vine Stratum (Plot size: )
1.
2.
3.
4.
= Total Cover
Hydrophytic Vegetation Present? Yes No
Remarks: (Include photo numbers here or on a separate sheet.)
32-W
30 ftAcer rubrumLiridodendron tulipiferaBetula alleghaniensisQuercus rubra
25251510
YYYN
FACFACUFACFACU
5
6
83%
15 ft75
Euonymus purpureus203
YN
FACFACU
Carpinus caroliniana
5 ft23
Osmunda cinnamomeaDennstaedtia punctilobula
10103
YYN
OBLFACWFACU
Symplocarpus foetidus
30 ft23
XX0
X

US Army Corps of Engineers Northcentral and Northeast Region – Interim Version
SOIL Sampling Point:
Profile Description: (Describe to the depth needed to document the indicator or confirm the absence of indicators.) Depth Matrix Redox Features (inches) Color (moist) % Color (moist) % Type1 Loc2 Texture Remarks
1Type: C=Concentration, D=Depletion, RM=Reduced Matrix, CS=Covered or Coated Sand Grains. 2Location: PL=Pore Lining, M=Matrix. Hydric Soil Indicators: Indicators for Problematic Hydric Soils3: Histosol (A1) Polyvalue Below Surface (S8) (LRR R, 2 cm Muck (A10) (LRR K, L, MLRA 149B) Histic Epipedon (A2) MLRA 149B) Coast Prairie Redox (A16) (LRR K, L, R) Black Histic (A3) Thin Dark Surface (S9) (LRR R, MLRA 149B) 5 cm Mucky Peat or Peat (S3) (LRR K, L, R) Hydrogen Sulfide (A4) Loamy Mucky Mineral (F1) (LRR K, L) Dark Surface (S7) (LRR K, L) Stratified Layers (A5) Loamy Gleyed Matrix (F2) Polyvalue Below Surface (S8) (LRR K, L) Depleted Below Dark Surface (A11) Depleted Matrix (F3) Thin Dark Surface (S9) (LRR K, L) Thick Dark Surface (A12) Redox Dark Surface (F6) Iron-Manganese Masses (F12) (LRR K, L, R) Sandy Mucky Mineral (S1) Depleted Dark Surface (F7) Piedmont Floodplain Soils (F19) (MLRA 149B) Sandy Gleyed Matrix (S4) Redox Depressions (F8) Mesic Spodic (TA6) (MLRA 144A, 145, 149B) Sandy Redox (S5) Red Parent Material (TF2) Stripped Matrix (S6) Very Shallow Dark Surface (TF12) Dark Surface (S7) (LRR R, MLRA 149B) Other (Explain in Remarks) 3Indicators of hydrophytic vegetation and wetland hydrology must be present, unless disturbed or problematic. Restrictive Layer (if observed): Type:
Depth (inches):
Hydric Soil Present? Yes No
Remarks:
32-W
1/2 to 0
0-10
10-16
16-22
10YR 2/1
10YR 4/2
10YR 5/2
100
90
85
5YR 4/6
5YR 4/610YR 6/1
10
105
C
CD
M
MM
si l
si l
l
leaf litter
Mn stains
slight firm
X
X
Plot 32-W is located 10 feet east of WF # 32.Plot 32-U is located 10 feet west of WF #32.The approximate difference in elevation from Plot 32-U to Plot 32-W is 2 feet.

US Army Corps of Engineers Northcentral and Northeast Region – Interim Version
WETLAND DETERMINATION DATA FORM – Northcentral and Northeast Region Project/Site: City/County: Sampling Date:
Applicant/Owner: State: Sampling Point:
Investigator(s): Section, Township, Range:
Landform (hillslope, terrace, etc.): Local relief (concave, convex, none):
Slope (%): Lat: Long: Datum:
Soil Map Unit Name: NWI classification:
Are climatic / hydrologic conditions on the site typical for this time of year? Yes No (If no, explain in Remarks.)
Are Vegetation , Soil , or Hydrology significantly disturbed? Are “Normal Circumstances” present? Yes No
Are Vegetation , Soil , or Hydrology naturally problematic? (If needed, explain any answers in Remarks.)
SUMMARY OF FINDINGS – Attach site map showing sampling point locations, transects, important features, etc.
Hydrophytic Vegetation Present? Yes No Hydric Soil Present? Yes No Wetland Hydrology Present? Yes No
Is the Sampled Area within a Wetland? Yes No
If yes, optional Wetland Site ID: Remarks: (Explain alternative procedures here or in a separate report.)
HYDROLOGY Wetland Hydrology Indicators: Secondary Indicators (minimum of two required) Primary Indicators (minimum of one is required; check all that apply) Surface Soil Cracks (B6) Surface Water (A1) Water-Stained Leaves (B9) Drainage Patterns (B10) High Water Table (A2) Aquatic Fauna (B13) Moss Trim Lines (B16) Saturation (A3) Marl Deposits (B15) Dry-Season Water Table (C2) Water Marks (B1) Hydrogen Sulfide Odor (C1) Crayfish Burrows (C8) Sediment Deposits (B2) Oxidized Rhizospheres on Living Roots (C3) Saturation Visible on Aerial Imagery (C9) Drift Deposits (B3) Presence of Reduced Iron (C4) Stunted or Stressed Plants (D1) Algal Mat or Crust (B4) Recent Iron Reduction in Tilled Soils (C6) Geomorphic Position (D2) Iron Deposits (B5) Thin Muck Surface (C7) Shallow Aquitard (D3) Inundation Visible on Aerial Imagery (B7) Other (Explain in Remarks) Microtopographic Relief (D4) Sparsely Vegetated Concave Surface (B8) FAC-Neutral Test (D5) Field Observations: Surface Water Present? Yes No Depth (inches): Water Table Present? Yes No Depth (inches): Saturation Present? Yes No Depth (inches): (includes capillary fringe)
Wetland Hydrology Present? Yes No
Describe Recorded Data (stream gauge, monitoring well, aerial photos, previous inspections), if available:
Remarks:
Proposed Solar, Candlewood Mountain Road New Milford/Litchfield Co. 12-10-2016Amec Foster Wheeler Environment & Infrastructure, Inc. CT 32-U
Thomas W. Pietras, PEG, LLClower hill slope convex
3-5% 41.57568 -73.45159 807 ftSutton very fine sandy loam (Aquic Dystrudepts)
Xno no no XXno no no
XXXX XX
XX
XXX X

US Army Corps of Engineers Northcentral and Northeast Region – Interim Version
VEGETATION – Use scientific names of plants. Sampling Point:
Dominance Test worksheet: Number of Dominant Species That Are OBL, FACW, or FAC: (A) Total Number of Dominant Species Across All Strata: (B) Percent of Dominant Species That Are OBL, FACW, or FAC: (A/B)
Prevalence Index worksheet: Total % Cover of: Multiply by: OBL species x 1 = FACW species x 2 = FAC species x 3 = FACU species x 4 = UPL species x 5 = Column Totals: (A) (B)
Prevalence Index = B/A =
Hydrophytic Vegetation Indicators: Rapid Test for Hydrophytic Vegetation Dominance Test is >50% Prevalence Index is 3.01 Morphological Adaptations1 (Provide supporting data in Remarks or on a separate sheet) Problematic Hydrophytic Vegetation1 (Explain) 1Indicators of hydric soil and wetland hydrology must be present, unless disturbed or problematic.
Definitions of Vegetation Strata: Tree – Woody plants 3 in. (7.6 cm) or more in diameter at breast height (DBH), regardless of height. Sapling/shrub – Woody plants less than 3 in. DBH and greater than 3.28 ft (1 m) tall. Herb – All herbaceous (non-woody) plants, regardless of size, and woody plants less than 3.28 ft tall. Woody vines – All woody vines greater than 3.28 ft in height.
Absolute Dominant Indicator Tree Stratum (Plot size: ) % Cover Species? Status
1.
2.
3.
4.
5.
6.
7.
= Total Cover
Sapling/Shrub Stratum (Plot size: )
1.
2.
3.
4.
5.
6.
7.
= Total Cover
Herb Stratum (Plot size: )
1.
2.
3.
4.
5.
6.
7.
8.
9.
10.
11.
12.
= Total Cover
Woody Vine Stratum (Plot size: )
1.
2.
3.
4.
= Total Cover
Hydrophytic Vegetation Present? Yes No
Remarks: (Include photo numbers here or on a separate sheet.)
32-U
30 ftQuercus rubraAcer rubrumFraxinus americana
453510
YYN
FACUFACFACU
2
6
33%
15 ft90
Lindera benzoin53
YY
FACUFACW
Euonymus purpureus
5 ft8
Polystichum acrostichoides53
YY
FACUFACU
Dennstaedtia punctilobula
30 ft8
XX0

US Army Corps of Engineers Northcentral and Northeast Region – Interim Version
SOIL Sampling Point:
Profile Description: (Describe to the depth needed to document the indicator or confirm the absence of indicators.) Depth Matrix Redox Features (inches) Color (moist) % Color (moist) % Type1 Loc2 Texture Remarks
1Type: C=Concentration, D=Depletion, RM=Reduced Matrix, CS=Covered or Coated Sand Grains. 2Location: PL=Pore Lining, M=Matrix. Hydric Soil Indicators: Indicators for Problematic Hydric Soils3: Histosol (A1) Polyvalue Below Surface (S8) (LRR R, 2 cm Muck (A10) (LRR K, L, MLRA 149B) Histic Epipedon (A2) MLRA 149B) Coast Prairie Redox (A16) (LRR K, L, R) Black Histic (A3) Thin Dark Surface (S9) (LRR R, MLRA 149B) 5 cm Mucky Peat or Peat (S3) (LRR K, L, R) Hydrogen Sulfide (A4) Loamy Mucky Mineral (F1) (LRR K, L) Dark Surface (S7) (LRR K, L) Stratified Layers (A5) Loamy Gleyed Matrix (F2) Polyvalue Below Surface (S8) (LRR K, L) Depleted Below Dark Surface (A11) Depleted Matrix (F3) Thin Dark Surface (S9) (LRR K, L) Thick Dark Surface (A12) Redox Dark Surface (F6) Iron-Manganese Masses (F12) (LRR K, L, R) Sandy Mucky Mineral (S1) Depleted Dark Surface (F7) Piedmont Floodplain Soils (F19) (MLRA 149B) Sandy Gleyed Matrix (S4) Redox Depressions (F8) Mesic Spodic (TA6) (MLRA 144A, 145, 149B) Sandy Redox (S5) Red Parent Material (TF2) Stripped Matrix (S6) Very Shallow Dark Surface (TF12) Dark Surface (S7) (LRR R, MLRA 149B) Other (Explain in Remarks) 3Indicators of hydrophytic vegetation and wetland hydrology must be present, unless disturbed or problematic. Restrictive Layer (if observed): Type:
Depth (inches):
Hydric Soil Present? Yes No
Remarks:
32-U
1/2 to 0
0-2
2-4
4-14
14-20
10YR 2/1
10YR 2/2
10YR 5/4
10YR 5/3
100
100
100
97 5YR 4/6 3 C M
vfsl
vfsl
vfsl
leaf litter
sapric
XX

US Army Corps of Engineers Northcentral and Northeast Region – Interim Version
WETLAND DETERMINATION DATA FORM – Northcentral and Northeast Region Project/Site: City/County: Sampling Date:
Applicant/Owner: State: Sampling Point:
Investigator(s): Section, Township, Range:
Landform (hillslope, terrace, etc.): Local relief (concave, convex, none):
Slope (%): Lat: Long: Datum:
Soil Map Unit Name: NWI classification:
Are climatic / hydrologic conditions on the site typical for this time of year? Yes No (If no, explain in Remarks.)
Are Vegetation , Soil , or Hydrology significantly disturbed? Are “Normal Circumstances” present? Yes No
Are Vegetation , Soil , or Hydrology naturally problematic? (If needed, explain any answers in Remarks.)
SUMMARY OF FINDINGS – Attach site map showing sampling point locations, transects, important features, etc.
Hydrophytic Vegetation Present? Yes No Hydric Soil Present? Yes No Wetland Hydrology Present? Yes No
Is the Sampled Area within a Wetland? Yes No
If yes, optional Wetland Site ID: Remarks: (Explain alternative procedures here or in a separate report.)
HYDROLOGY Wetland Hydrology Indicators: Secondary Indicators (minimum of two required) Primary Indicators (minimum of one is required; check all that apply) Surface Soil Cracks (B6) Surface Water (A1) Water-Stained Leaves (B9) Drainage Patterns (B10) High Water Table (A2) Aquatic Fauna (B13) Moss Trim Lines (B16) Saturation (A3) Marl Deposits (B15) Dry-Season Water Table (C2) Water Marks (B1) Hydrogen Sulfide Odor (C1) Crayfish Burrows (C8) Sediment Deposits (B2) Oxidized Rhizospheres on Living Roots (C3) Saturation Visible on Aerial Imagery (C9) Drift Deposits (B3) Presence of Reduced Iron (C4) Stunted or Stressed Plants (D1) Algal Mat or Crust (B4) Recent Iron Reduction in Tilled Soils (C6) Geomorphic Position (D2) Iron Deposits (B5) Thin Muck Surface (C7) Shallow Aquitard (D3) Inundation Visible on Aerial Imagery (B7) Other (Explain in Remarks) Microtopographic Relief (D4) Sparsely Vegetated Concave Surface (B8) FAC-Neutral Test (D5) Field Observations: Surface Water Present? Yes No Depth (inches): Water Table Present? Yes No Depth (inches): Saturation Present? Yes No Depth (inches): (includes capillary fringe)
Wetland Hydrology Present? Yes No
Describe Recorded Data (stream gauge, monitoring well, aerial photos, previous inspections), if available:
Remarks:
Proposed Solar, Candlewood Mountain Road New Milford/Litchfield Co. 12-10-2016Amec Foster Wheeler Environment & Infrastructure, Inc. CT 40-W
Thomas W. Pietras, PEG, LLCbroad level swamp on a ridgetop nearly level
0-1% 41.57477 -73.45126 800 ftTimakwa & Natchaug muck (Terric Haplosaprists) PFO
Xno no no XXno no no
XXXX XX
XX
XX
XX 1X
X
X
0 X

US Army Corps of Engineers Northcentral and Northeast Region – Interim Version
VEGETATION – Use scientific names of plants. Sampling Point:
Dominance Test worksheet: Number of Dominant Species That Are OBL, FACW, or FAC: (A) Total Number of Dominant Species Across All Strata: (B) Percent of Dominant Species That Are OBL, FACW, or FAC: (A/B)
Prevalence Index worksheet: Total % Cover of: Multiply by: OBL species x 1 = FACW species x 2 = FAC species x 3 = FACU species x 4 = UPL species x 5 = Column Totals: (A) (B)
Prevalence Index = B/A =
Hydrophytic Vegetation Indicators: Rapid Test for Hydrophytic Vegetation Dominance Test is >50% Prevalence Index is 3.01 Morphological Adaptations1 (Provide supporting data in Remarks or on a separate sheet) Problematic Hydrophytic Vegetation1 (Explain) 1Indicators of hydric soil and wetland hydrology must be present, unless disturbed or problematic.
Definitions of Vegetation Strata: Tree – Woody plants 3 in. (7.6 cm) or more in diameter at breast height (DBH), regardless of height. Sapling/shrub – Woody plants less than 3 in. DBH and greater than 3.28 ft (1 m) tall. Herb – All herbaceous (non-woody) plants, regardless of size, and woody plants less than 3.28 ft tall. Woody vines – All woody vines greater than 3.28 ft in height.
Absolute Dominant Indicator Tree Stratum (Plot size: ) % Cover Species? Status
1.
2.
3.
4.
5.
6.
7.
= Total Cover
Sapling/Shrub Stratum (Plot size: )
1.
2.
3.
4.
5.
6.
7.
= Total Cover
Herb Stratum (Plot size: )
1.
2.
3.
4.
5.
6.
7.
8.
9.
10.
11.
12.
= Total Cover
Woody Vine Stratum (Plot size: )
1.
2.
3.
4.
= Total Cover
Hydrophytic Vegetation Present? Yes No
Remarks: (Include photo numbers here or on a separate sheet.)
40-W
30 ftAcer rubrumQuercus rubraFraxinus americana
252510
YYY
FACFACUFACU
7
10
70%
15 ft60
Vaccinium corybosumHamamelis virginiana
201010
YYY
FACWFACWFACU
Lindera benzoin
5 ft50
Osmunda cinnamomeaSymplocarpus foetidusOnoclea sensibilis
1010108
YYYY
OBLFACWOBLFACW
Carex stricta
30 ft38
XX0
X

US Army Corps of Engineers Northcentral and Northeast Region – Interim Version
SOIL Sampling Point:
Profile Description: (Describe to the depth needed to document the indicator or confirm the absence of indicators.) Depth Matrix Redox Features (inches) Color (moist) % Color (moist) % Type1 Loc2 Texture Remarks
1Type: C=Concentration, D=Depletion, RM=Reduced Matrix, CS=Covered or Coated Sand Grains. 2Location: PL=Pore Lining, M=Matrix. Hydric Soil Indicators: Indicators for Problematic Hydric Soils3: Histosol (A1) Polyvalue Below Surface (S8) (LRR R, 2 cm Muck (A10) (LRR K, L, MLRA 149B) Histic Epipedon (A2) MLRA 149B) Coast Prairie Redox (A16) (LRR K, L, R) Black Histic (A3) Thin Dark Surface (S9) (LRR R, MLRA 149B) 5 cm Mucky Peat or Peat (S3) (LRR K, L, R) Hydrogen Sulfide (A4) Loamy Mucky Mineral (F1) (LRR K, L) Dark Surface (S7) (LRR K, L) Stratified Layers (A5) Loamy Gleyed Matrix (F2) Polyvalue Below Surface (S8) (LRR K, L) Depleted Below Dark Surface (A11) Depleted Matrix (F3) Thin Dark Surface (S9) (LRR K, L) Thick Dark Surface (A12) Redox Dark Surface (F6) Iron-Manganese Masses (F12) (LRR K, L, R) Sandy Mucky Mineral (S1) Depleted Dark Surface (F7) Piedmont Floodplain Soils (F19) (MLRA 149B) Sandy Gleyed Matrix (S4) Redox Depressions (F8) Mesic Spodic (TA6) (MLRA 144A, 145, 149B) Sandy Redox (S5) Red Parent Material (TF2) Stripped Matrix (S6) Very Shallow Dark Surface (TF12) Dark Surface (S7) (LRR R, MLRA 149B) Other (Explain in Remarks) 3Indicators of hydrophytic vegetation and wetland hydrology must be present, unless disturbed or problematic. Restrictive Layer (if observed): Type:
Depth (inches):
Hydric Soil Present? Yes No
Remarks:
40-W
1 to 0
0-18+ 10YR 2/1 100 muck
leaf litter
X
X
Plot 40-W is located 10 feet east of WF # 40.Plot 40-U is located 10 feet west of WF #40.The approximate difference in elevation from Plot 40-U to Plot 40-W is 2 feet.

US Army Corps of Engineers Northcentral and Northeast Region – Interim Version
WETLAND DETERMINATION DATA FORM – Northcentral and Northeast Region Project/Site: City/County: Sampling Date:
Applicant/Owner: State: Sampling Point:
Investigator(s): Section, Township, Range:
Landform (hillslope, terrace, etc.): Local relief (concave, convex, none):
Slope (%): Lat: Long: Datum:
Soil Map Unit Name: NWI classification:
Are climatic / hydrologic conditions on the site typical for this time of year? Yes No (If no, explain in Remarks.)
Are Vegetation , Soil , or Hydrology significantly disturbed? Are “Normal Circumstances” present? Yes No
Are Vegetation , Soil , or Hydrology naturally problematic? (If needed, explain any answers in Remarks.)
SUMMARY OF FINDINGS – Attach site map showing sampling point locations, transects, important features, etc.
Hydrophytic Vegetation Present? Yes No Hydric Soil Present? Yes No Wetland Hydrology Present? Yes No
Is the Sampled Area within a Wetland? Yes No
If yes, optional Wetland Site ID: Remarks: (Explain alternative procedures here or in a separate report.)
HYDROLOGY Wetland Hydrology Indicators: Secondary Indicators (minimum of two required) Primary Indicators (minimum of one is required; check all that apply) Surface Soil Cracks (B6) Surface Water (A1) Water-Stained Leaves (B9) Drainage Patterns (B10) High Water Table (A2) Aquatic Fauna (B13) Moss Trim Lines (B16) Saturation (A3) Marl Deposits (B15) Dry-Season Water Table (C2) Water Marks (B1) Hydrogen Sulfide Odor (C1) Crayfish Burrows (C8) Sediment Deposits (B2) Oxidized Rhizospheres on Living Roots (C3) Saturation Visible on Aerial Imagery (C9) Drift Deposits (B3) Presence of Reduced Iron (C4) Stunted or Stressed Plants (D1) Algal Mat or Crust (B4) Recent Iron Reduction in Tilled Soils (C6) Geomorphic Position (D2) Iron Deposits (B5) Thin Muck Surface (C7) Shallow Aquitard (D3) Inundation Visible on Aerial Imagery (B7) Other (Explain in Remarks) Microtopographic Relief (D4) Sparsely Vegetated Concave Surface (B8) FAC-Neutral Test (D5) Field Observations: Surface Water Present? Yes No Depth (inches): Water Table Present? Yes No Depth (inches): Saturation Present? Yes No Depth (inches): (includes capillary fringe)
Wetland Hydrology Present? Yes No
Describe Recorded Data (stream gauge, monitoring well, aerial photos, previous inspections), if available:
Remarks:
Proposed Solar, Candlewood Mountain Road New Milford/Litchfield Co. 12-10-2016Amec Foster Wheeler Environment & Infrastructure, Inc. CT 40-U
Thomas W. Pietras, PEG, LLC hill slope convex
5-8% 41.57478 -73.45133 802 ftSutton very fine sandy loam (Aquic Dystrudepts)
Xno no no XXno no no
XXXX XX
XX
XXX X

US Army Corps of Engineers Northcentral and Northeast Region – Interim Version
VEGETATION – Use scientific names of plants. Sampling Point:
Dominance Test worksheet: Number of Dominant Species That Are OBL, FACW, or FAC: (A) Total Number of Dominant Species Across All Strata: (B) Percent of Dominant Species That Are OBL, FACW, or FAC: (A/B)
Prevalence Index worksheet: Total % Cover of: Multiply by: OBL species x 1 = FACW species x 2 = FAC species x 3 = FACU species x 4 = UPL species x 5 = Column Totals: (A) (B)
Prevalence Index = B/A =
Hydrophytic Vegetation Indicators: Rapid Test for Hydrophytic Vegetation Dominance Test is >50% Prevalence Index is 3.01 Morphological Adaptations1 (Provide supporting data in Remarks or on a separate sheet) Problematic Hydrophytic Vegetation1 (Explain) 1Indicators of hydric soil and wetland hydrology must be present, unless disturbed or problematic.
Definitions of Vegetation Strata: Tree – Woody plants 3 in. (7.6 cm) or more in diameter at breast height (DBH), regardless of height. Sapling/shrub – Woody plants less than 3 in. DBH and greater than 3.28 ft (1 m) tall. Herb – All herbaceous (non-woody) plants, regardless of size, and woody plants less than 3.28 ft tall. Woody vines – All woody vines greater than 3.28 ft in height.
Absolute Dominant Indicator Tree Stratum (Plot size: ) % Cover Species? Status
1.
2.
3.
4.
5.
6.
7.
= Total Cover
Sapling/Shrub Stratum (Plot size: )
1.
2.
3.
4.
5.
6.
7.
= Total Cover
Herb Stratum (Plot size: )
1.
2.
3.
4.
5.
6.
7.
8.
9.
10.
11.
12.
= Total Cover
Woody Vine Stratum (Plot size: )
1.
2.
3.
4.
= Total Cover
Hydrophytic Vegetation Present? Yes No
Remarks: (Include photo numbers here or on a separate sheet.)
40-U
30 ftQuercus rubraAcer rubrumFraxinus americanaQuercus prinus
35202015
YYYN
FACUFACFACUNI
1
6
17%
15 ft90
Acer pensylvanicaBetula lenta
2085
YYN
FACUFACUFACU
Hamamelis virginiana
5 ft33
3 Y NI-UPLCarex pensylvanica
30 ft3
XX0

US Army Corps of Engineers Northcentral and Northeast Region – Interim Version
SOIL Sampling Point:
Profile Description: (Describe to the depth needed to document the indicator or confirm the absence of indicators.) Depth Matrix Redox Features (inches) Color (moist) % Color (moist) % Type1 Loc2 Texture Remarks
1Type: C=Concentration, D=Depletion, RM=Reduced Matrix, CS=Covered or Coated Sand Grains. 2Location: PL=Pore Lining, M=Matrix. Hydric Soil Indicators: Indicators for Problematic Hydric Soils3: Histosol (A1) Polyvalue Below Surface (S8) (LRR R, 2 cm Muck (A10) (LRR K, L, MLRA 149B) Histic Epipedon (A2) MLRA 149B) Coast Prairie Redox (A16) (LRR K, L, R) Black Histic (A3) Thin Dark Surface (S9) (LRR R, MLRA 149B) 5 cm Mucky Peat or Peat (S3) (LRR K, L, R) Hydrogen Sulfide (A4) Loamy Mucky Mineral (F1) (LRR K, L) Dark Surface (S7) (LRR K, L) Stratified Layers (A5) Loamy Gleyed Matrix (F2) Polyvalue Below Surface (S8) (LRR K, L) Depleted Below Dark Surface (A11) Depleted Matrix (F3) Thin Dark Surface (S9) (LRR K, L) Thick Dark Surface (A12) Redox Dark Surface (F6) Iron-Manganese Masses (F12) (LRR K, L, R) Sandy Mucky Mineral (S1) Depleted Dark Surface (F7) Piedmont Floodplain Soils (F19) (MLRA 149B) Sandy Gleyed Matrix (S4) Redox Depressions (F8) Mesic Spodic (TA6) (MLRA 144A, 145, 149B) Sandy Redox (S5) Red Parent Material (TF2) Stripped Matrix (S6) Very Shallow Dark Surface (TF12) Dark Surface (S7) (LRR R, MLRA 149B) Other (Explain in Remarks) 3Indicators of hydrophytic vegetation and wetland hydrology must be present, unless disturbed or problematic. Restrictive Layer (if observed): Type:
Depth (inches):
Hydric Soil Present? Yes No
Remarks:
40-U
1 to 0
0-3
3-6
6-14
14+
10YR 2/1
10YR 2/2
10YR 5/4
100
100
100
vfsl
vfsl
leaf litter
sapric
rock
XX

US Army Corps of Engineers Northcentral and Northeast Region – Interim Version
WETLAND DETERMINATION DATA FORM – Northcentral and Northeast Region Project/Site: City/County: Sampling Date:
Applicant/Owner: State: Sampling Point:
Investigator(s): Section, Township, Range:
Landform (hillslope, terrace, etc.): Local relief (concave, convex, none):
Slope (%): Lat: Long: Datum:
Soil Map Unit Name: NWI classification:
Are climatic / hydrologic conditions on the site typical for this time of year? Yes No (If no, explain in Remarks.)
Are Vegetation , Soil , or Hydrology significantly disturbed? Are “Normal Circumstances” present? Yes No
Are Vegetation , Soil , or Hydrology naturally problematic? (If needed, explain any answers in Remarks.)
SUMMARY OF FINDINGS – Attach site map showing sampling point locations, transects, important features, etc.
Hydrophytic Vegetation Present? Yes No Hydric Soil Present? Yes No Wetland Hydrology Present? Yes No
Is the Sampled Area within a Wetland? Yes No
If yes, optional Wetland Site ID: Remarks: (Explain alternative procedures here or in a separate report.)
HYDROLOGY Wetland Hydrology Indicators: Secondary Indicators (minimum of two required) Primary Indicators (minimum of one is required; check all that apply) Surface Soil Cracks (B6) Surface Water (A1) Water-Stained Leaves (B9) Drainage Patterns (B10) High Water Table (A2) Aquatic Fauna (B13) Moss Trim Lines (B16) Saturation (A3) Marl Deposits (B15) Dry-Season Water Table (C2) Water Marks (B1) Hydrogen Sulfide Odor (C1) Crayfish Burrows (C8) Sediment Deposits (B2) Oxidized Rhizospheres on Living Roots (C3) Saturation Visible on Aerial Imagery (C9) Drift Deposits (B3) Presence of Reduced Iron (C4) Stunted or Stressed Plants (D1) Algal Mat or Crust (B4) Recent Iron Reduction in Tilled Soils (C6) Geomorphic Position (D2) Iron Deposits (B5) Thin Muck Surface (C7) Shallow Aquitard (D3) Inundation Visible on Aerial Imagery (B7) Other (Explain in Remarks) Microtopographic Relief (D4) Sparsely Vegetated Concave Surface (B8) FAC-Neutral Test (D5) Field Observations: Surface Water Present? Yes No Depth (inches): Water Table Present? Yes No Depth (inches): Saturation Present? Yes No Depth (inches): (includes capillary fringe)
Wetland Hydrology Present? Yes No
Describe Recorded Data (stream gauge, monitoring well, aerial photos, previous inspections), if available:
Remarks:
Proposed Solar, Candlewood Mountain Road New Milford/Litchfield Co. 12-10-2016Amec Foster Wheeler Environment & Infrastructure, Inc. CT 50-W
Thomas W. Pietras, PEG, LLChill slope convex
3-5% 41.57322 -73.45071 810 ftRidgebury loam (Aeric Epiaquepts) PFO
Xno no no XXno no no
XXXX XX
XX
XXX
XX
X
X

US Army Corps of Engineers Northcentral and Northeast Region – Interim Version
VEGETATION – Use scientific names of plants. Sampling Point:
Dominance Test worksheet: Number of Dominant Species That Are OBL, FACW, or FAC: (A) Total Number of Dominant Species Across All Strata: (B) Percent of Dominant Species That Are OBL, FACW, or FAC: (A/B)
Prevalence Index worksheet: Total % Cover of: Multiply by: OBL species x 1 = FACW species x 2 = FAC species x 3 = FACU species x 4 = UPL species x 5 = Column Totals: (A) (B)
Prevalence Index = B/A =
Hydrophytic Vegetation Indicators: Rapid Test for Hydrophytic Vegetation Dominance Test is >50% Prevalence Index is 3.01 Morphological Adaptations1 (Provide supporting data in Remarks or on a separate sheet) Problematic Hydrophytic Vegetation1 (Explain) 1Indicators of hydric soil and wetland hydrology must be present, unless disturbed or problematic.
Definitions of Vegetation Strata: Tree – Woody plants 3 in. (7.6 cm) or more in diameter at breast height (DBH), regardless of height. Sapling/shrub – Woody plants less than 3 in. DBH and greater than 3.28 ft (1 m) tall. Herb – All herbaceous (non-woody) plants, regardless of size, and woody plants less than 3.28 ft tall. Woody vines – All woody vines greater than 3.28 ft in height.
Absolute Dominant Indicator Tree Stratum (Plot size: ) % Cover Species? Status
1.
2.
3.
4.
5.
6.
7.
= Total Cover
Sapling/Shrub Stratum (Plot size: )
1.
2.
3.
4.
5.
6.
7.
= Total Cover
Herb Stratum (Plot size: )
1.
2.
3.
4.
5.
6.
7.
8.
9.
10.
11.
12.
= Total Cover
Woody Vine Stratum (Plot size: )
1.
2.
3.
4.
= Total Cover
Hydrophytic Vegetation Present? Yes No
Remarks: (Include photo numbers here or on a separate sheet.)
50-W
30 ftBetula lentaAcer rubraUlmus americanaFraxinus americana
30202010
YYYN
FACUFACFACWFACU
4
5
80%
15 ft80
25 Y FACWLindera benzoin
5 ft25
Sphagnum sp.Polystichium acrostichoides
30103
Y-N
FAC-FACU
Microstegium vimineum
30 ft43
XX0
X

US Army Corps of Engineers Northcentral and Northeast Region – Interim Version
SOIL Sampling Point:
Profile Description: (Describe to the depth needed to document the indicator or confirm the absence of indicators.) Depth Matrix Redox Features (inches) Color (moist) % Color (moist) % Type1 Loc2 Texture Remarks
1Type: C=Concentration, D=Depletion, RM=Reduced Matrix, CS=Covered or Coated Sand Grains. 2Location: PL=Pore Lining, M=Matrix. Hydric Soil Indicators: Indicators for Problematic Hydric Soils3: Histosol (A1) Polyvalue Below Surface (S8) (LRR R, 2 cm Muck (A10) (LRR K, L, MLRA 149B) Histic Epipedon (A2) MLRA 149B) Coast Prairie Redox (A16) (LRR K, L, R) Black Histic (A3) Thin Dark Surface (S9) (LRR R, MLRA 149B) 5 cm Mucky Peat or Peat (S3) (LRR K, L, R) Hydrogen Sulfide (A4) Loamy Mucky Mineral (F1) (LRR K, L) Dark Surface (S7) (LRR K, L) Stratified Layers (A5) Loamy Gleyed Matrix (F2) Polyvalue Below Surface (S8) (LRR K, L) Depleted Below Dark Surface (A11) Depleted Matrix (F3) Thin Dark Surface (S9) (LRR K, L) Thick Dark Surface (A12) Redox Dark Surface (F6) Iron-Manganese Masses (F12) (LRR K, L, R) Sandy Mucky Mineral (S1) Depleted Dark Surface (F7) Piedmont Floodplain Soils (F19) (MLRA 149B) Sandy Gleyed Matrix (S4) Redox Depressions (F8) Mesic Spodic (TA6) (MLRA 144A, 145, 149B) Sandy Redox (S5) Red Parent Material (TF2) Stripped Matrix (S6) Very Shallow Dark Surface (TF12) Dark Surface (S7) (LRR R, MLRA 149B) Other (Explain in Remarks) 3Indicators of hydrophytic vegetation and wetland hydrology must be present, unless disturbed or problematic. Restrictive Layer (if observed): Type:
Depth (inches):
Hydric Soil Present? Yes No
Remarks:
50-W
1 to 0
0-4
4-14
14-22+
10YR 2/2
2.5 Y 5/2
2.5Y 6/2
100
90
85
5YR 4/6
5YR 4/6
10
15
C
C
M
M
si l
si l
l
leaf litter
Mn stains
firm
X
compact lodgement till
14 X
Plot 50-W is located 12 feet east of WF # 50.Plot 50-U is located 12 feet west of WF #50.The approximate difference in elevation from Plot 50-U to Plot 50-W is 1.5 feet

US Army Corps of Engineers Northcentral and Northeast Region – Interim Version
WETLAND DETERMINATION DATA FORM – Northcentral and Northeast Region Project/Site: City/County: Sampling Date:
Applicant/Owner: State: Sampling Point:
Investigator(s): Section, Township, Range:
Landform (hillslope, terrace, etc.): Local relief (concave, convex, none):
Slope (%): Lat: Long: Datum:
Soil Map Unit Name: NWI classification:
Are climatic / hydrologic conditions on the site typical for this time of year? Yes No (If no, explain in Remarks.)
Are Vegetation , Soil , or Hydrology significantly disturbed? Are “Normal Circumstances” present? Yes No
Are Vegetation , Soil , or Hydrology naturally problematic? (If needed, explain any answers in Remarks.)
SUMMARY OF FINDINGS – Attach site map showing sampling point locations, transects, important features, etc.
Hydrophytic Vegetation Present? Yes No Hydric Soil Present? Yes No Wetland Hydrology Present? Yes No
Is the Sampled Area within a Wetland? Yes No
If yes, optional Wetland Site ID: Remarks: (Explain alternative procedures here or in a separate report.)
HYDROLOGY Wetland Hydrology Indicators: Secondary Indicators (minimum of two required) Primary Indicators (minimum of one is required; check all that apply) Surface Soil Cracks (B6) Surface Water (A1) Water-Stained Leaves (B9) Drainage Patterns (B10) High Water Table (A2) Aquatic Fauna (B13) Moss Trim Lines (B16) Saturation (A3) Marl Deposits (B15) Dry-Season Water Table (C2) Water Marks (B1) Hydrogen Sulfide Odor (C1) Crayfish Burrows (C8) Sediment Deposits (B2) Oxidized Rhizospheres on Living Roots (C3) Saturation Visible on Aerial Imagery (C9) Drift Deposits (B3) Presence of Reduced Iron (C4) Stunted or Stressed Plants (D1) Algal Mat or Crust (B4) Recent Iron Reduction in Tilled Soils (C6) Geomorphic Position (D2) Iron Deposits (B5) Thin Muck Surface (C7) Shallow Aquitard (D3) Inundation Visible on Aerial Imagery (B7) Other (Explain in Remarks) Microtopographic Relief (D4) Sparsely Vegetated Concave Surface (B8) FAC-Neutral Test (D5) Field Observations: Surface Water Present? Yes No Depth (inches): Water Table Present? Yes No Depth (inches): Saturation Present? Yes No Depth (inches): (includes capillary fringe)
Wetland Hydrology Present? Yes No
Describe Recorded Data (stream gauge, monitoring well, aerial photos, previous inspections), if available:
Remarks:
Proposed Solar, Candlewood Mountain Road New Milford/Litchfield Co. 12-10-2016Amec Foster Wheeler Environment & Infrastructure, Inc. CT 50-U
Thomas W. Pietras, PEG, LLC hill slope convex
5-8% 41.57322 -73.45075 812 ftWoodbridge loam (Aquic Dystrudepts)
Xno no no XXno no no
XXXX XX
XX
XXX X

US Army Corps of Engineers Northcentral and Northeast Region – Interim Version
VEGETATION – Use scientific names of plants. Sampling Point:
Dominance Test worksheet: Number of Dominant Species That Are OBL, FACW, or FAC: (A) Total Number of Dominant Species Across All Strata: (B) Percent of Dominant Species That Are OBL, FACW, or FAC: (A/B)
Prevalence Index worksheet: Total % Cover of: Multiply by: OBL species x 1 = FACW species x 2 = FAC species x 3 = FACU species x 4 = UPL species x 5 = Column Totals: (A) (B)
Prevalence Index = B/A =
Hydrophytic Vegetation Indicators: Rapid Test for Hydrophytic Vegetation Dominance Test is >50% Prevalence Index is 3.01 Morphological Adaptations1 (Provide supporting data in Remarks or on a separate sheet) Problematic Hydrophytic Vegetation1 (Explain) 1Indicators of hydric soil and wetland hydrology must be present, unless disturbed or problematic.
Definitions of Vegetation Strata: Tree – Woody plants 3 in. (7.6 cm) or more in diameter at breast height (DBH), regardless of height. Sapling/shrub – Woody plants less than 3 in. DBH and greater than 3.28 ft (1 m) tall. Herb – All herbaceous (non-woody) plants, regardless of size, and woody plants less than 3.28 ft tall. Woody vines – All woody vines greater than 3.28 ft in height.
Absolute Dominant Indicator Tree Stratum (Plot size: ) % Cover Species? Status
1.
2.
3.
4.
5.
6.
7.
= Total Cover
Sapling/Shrub Stratum (Plot size: )
1.
2.
3.
4.
5.
6.
7.
= Total Cover
Herb Stratum (Plot size: )
1.
2.
3.
4.
5.
6.
7.
8.
9.
10.
11.
12.
= Total Cover
Woody Vine Stratum (Plot size: )
1.
2.
3.
4.
= Total Cover
Hydrophytic Vegetation Present? Yes No
Remarks: (Include photo numbers here or on a separate sheet.)
50-U
30 ftAcer rubrumBetula lentaUlmus americana
501510
YYN
FACFACUFACW
2
5
40%
15 ft75
Lindera benzoin1515
YY
FACUFACW
Betula lenta
5 ft30
Polystichum acrostichoidesDryopteris marginalisCarex pensylvanica
10333
YNNN
FACUFACUFACUNI
Dennstaedtia punctilobula
30 ft19
XX0

US Army Corps of Engineers Northcentral and Northeast Region – Interim Version
SOIL Sampling Point:
Profile Description: (Describe to the depth needed to document the indicator or confirm the absence of indicators.) Depth Matrix Redox Features (inches) Color (moist) % Color (moist) % Type1 Loc2 Texture Remarks
1Type: C=Concentration, D=Depletion, RM=Reduced Matrix, CS=Covered or Coated Sand Grains. 2Location: PL=Pore Lining, M=Matrix. Hydric Soil Indicators: Indicators for Problematic Hydric Soils3: Histosol (A1) Polyvalue Below Surface (S8) (LRR R, 2 cm Muck (A10) (LRR K, L, MLRA 149B) Histic Epipedon (A2) MLRA 149B) Coast Prairie Redox (A16) (LRR K, L, R) Black Histic (A3) Thin Dark Surface (S9) (LRR R, MLRA 149B) 5 cm Mucky Peat or Peat (S3) (LRR K, L, R) Hydrogen Sulfide (A4) Loamy Mucky Mineral (F1) (LRR K, L) Dark Surface (S7) (LRR K, L) Stratified Layers (A5) Loamy Gleyed Matrix (F2) Polyvalue Below Surface (S8) (LRR K, L) Depleted Below Dark Surface (A11) Depleted Matrix (F3) Thin Dark Surface (S9) (LRR K, L) Thick Dark Surface (A12) Redox Dark Surface (F6) Iron-Manganese Masses (F12) (LRR K, L, R) Sandy Mucky Mineral (S1) Depleted Dark Surface (F7) Piedmont Floodplain Soils (F19) (MLRA 149B) Sandy Gleyed Matrix (S4) Redox Depressions (F8) Mesic Spodic (TA6) (MLRA 144A, 145, 149B) Sandy Redox (S5) Red Parent Material (TF2) Stripped Matrix (S6) Very Shallow Dark Surface (TF12) Dark Surface (S7) (LRR R, MLRA 149B) Other (Explain in Remarks) 3Indicators of hydrophytic vegetation and wetland hydrology must be present, unless disturbed or problematic. Restrictive Layer (if observed): Type:
Depth (inches):
Hydric Soil Present? Yes No
Remarks:
50-U
1 to 0
0-5
5-12
12-19+
10YR 3/2
10YR 5/3
10YR 5/3
100
100
95 5YR 4/6 5 C M
l
l
l
leaf litter
XX

US Army Corps of Engineers Northcentral and Northeast Region – Interim Version
WETLAND DETERMINATION DATA FORM – Northcentral and Northeast Region Project/Site: City/County: Sampling Date:
Applicant/Owner: State: Sampling Point:
Investigator(s): Section, Township, Range:
Landform (hillslope, terrace, etc.): Local relief (concave, convex, none):
Slope (%): Lat: Long: Datum:
Soil Map Unit Name: NWI classification:
Are climatic / hydrologic conditions on the site typical for this time of year? Yes No (If no, explain in Remarks.)
Are Vegetation , Soil , or Hydrology significantly disturbed? Are “Normal Circumstances” present? Yes No
Are Vegetation , Soil , or Hydrology naturally problematic? (If needed, explain any answers in Remarks.)
SUMMARY OF FINDINGS – Attach site map showing sampling point locations, transects, important features, etc.
Hydrophytic Vegetation Present? Yes No Hydric Soil Present? Yes No Wetland Hydrology Present? Yes No
Is the Sampled Area within a Wetland? Yes No
If yes, optional Wetland Site ID: Remarks: (Explain alternative procedures here or in a separate report.)
HYDROLOGY Wetland Hydrology Indicators: Secondary Indicators (minimum of two required) Primary Indicators (minimum of one is required; check all that apply) Surface Soil Cracks (B6) Surface Water (A1) Water-Stained Leaves (B9) Drainage Patterns (B10) High Water Table (A2) Aquatic Fauna (B13) Moss Trim Lines (B16) Saturation (A3) Marl Deposits (B15) Dry-Season Water Table (C2) Water Marks (B1) Hydrogen Sulfide Odor (C1) Crayfish Burrows (C8) Sediment Deposits (B2) Oxidized Rhizospheres on Living Roots (C3) Saturation Visible on Aerial Imagery (C9) Drift Deposits (B3) Presence of Reduced Iron (C4) Stunted or Stressed Plants (D1) Algal Mat or Crust (B4) Recent Iron Reduction in Tilled Soils (C6) Geomorphic Position (D2) Iron Deposits (B5) Thin Muck Surface (C7) Shallow Aquitard (D3) Inundation Visible on Aerial Imagery (B7) Other (Explain in Remarks) Microtopographic Relief (D4) Sparsely Vegetated Concave Surface (B8) FAC-Neutral Test (D5) Field Observations: Surface Water Present? Yes No Depth (inches): Water Table Present? Yes No Depth (inches): Saturation Present? Yes No Depth (inches): (includes capillary fringe)
Wetland Hydrology Present? Yes No
Describe Recorded Data (stream gauge, monitoring well, aerial photos, previous inspections), if available:
Remarks:
Proposed Solar, Candlewood Mountain Road New Milford/Litchfield Co. 12-10-2016Amec Foster Wheeler Environment & Infrastructure, Inc. CT 70-W
Thomas W. Pietras, PEG, LLChill slope convex
5% 41.57279 -73.44953 745 ftLeicester loam (Aeric Endoaquepts) PFO
Xno no no XXno no no
XXXX XX
XX
XX
XX 8X
X
X
2 X

US Army Corps of Engineers Northcentral and Northeast Region – Interim Version
VEGETATION – Use scientific names of plants. Sampling Point:
Dominance Test worksheet: Number of Dominant Species That Are OBL, FACW, or FAC: (A) Total Number of Dominant Species Across All Strata: (B) Percent of Dominant Species That Are OBL, FACW, or FAC: (A/B)
Prevalence Index worksheet: Total % Cover of: Multiply by: OBL species x 1 = FACW species x 2 = FAC species x 3 = FACU species x 4 = UPL species x 5 = Column Totals: (A) (B)
Prevalence Index = B/A =
Hydrophytic Vegetation Indicators: Rapid Test for Hydrophytic Vegetation Dominance Test is >50% Prevalence Index is 3.01 Morphological Adaptations1 (Provide supporting data in Remarks or on a separate sheet) Problematic Hydrophytic Vegetation1 (Explain) 1Indicators of hydric soil and wetland hydrology must be present, unless disturbed or problematic.
Definitions of Vegetation Strata: Tree – Woody plants 3 in. (7.6 cm) or more in diameter at breast height (DBH), regardless of height. Sapling/shrub – Woody plants less than 3 in. DBH and greater than 3.28 ft (1 m) tall. Herb – All herbaceous (non-woody) plants, regardless of size, and woody plants less than 3.28 ft tall. Woody vines – All woody vines greater than 3.28 ft in height.
Absolute Dominant Indicator Tree Stratum (Plot size: ) % Cover Species? Status
1.
2.
3.
4.
5.
6.
7.
= Total Cover
Sapling/Shrub Stratum (Plot size: )
1.
2.
3.
4.
5.
6.
7.
= Total Cover
Herb Stratum (Plot size: )
1.
2.
3.
4.
5.
6.
7.
8.
9.
10.
11.
12.
= Total Cover
Woody Vine Stratum (Plot size: )
1.
2.
3.
4.
= Total Cover
Hydrophytic Vegetation Present? Yes No
Remarks: (Include photo numbers here or on a separate sheet.)
70-W
30 ftBetula lentaCarya ovataBetula alleghaniensisAcer rubrum
2510105
YYYN
FACUFACUFACFAC
4
7
57%
15 ft50
Acer saccharum105
YY
FACWFACU
Lindera benzoin
5 ft25
Carex stricta53
YY
FACWOBL
Lindera benzoin
30 ft8
XX0
X

US Army Corps of Engineers Northcentral and Northeast Region – Interim Version
SOIL Sampling Point:
Profile Description: (Describe to the depth needed to document the indicator or confirm the absence of indicators.) Depth Matrix Redox Features (inches) Color (moist) % Color (moist) % Type1 Loc2 Texture Remarks
1Type: C=Concentration, D=Depletion, RM=Reduced Matrix, CS=Covered or Coated Sand Grains. 2Location: PL=Pore Lining, M=Matrix. Hydric Soil Indicators: Indicators for Problematic Hydric Soils3: Histosol (A1) Polyvalue Below Surface (S8) (LRR R, 2 cm Muck (A10) (LRR K, L, MLRA 149B) Histic Epipedon (A2) MLRA 149B) Coast Prairie Redox (A16) (LRR K, L, R) Black Histic (A3) Thin Dark Surface (S9) (LRR R, MLRA 149B) 5 cm Mucky Peat or Peat (S3) (LRR K, L, R) Hydrogen Sulfide (A4) Loamy Mucky Mineral (F1) (LRR K, L) Dark Surface (S7) (LRR K, L) Stratified Layers (A5) Loamy Gleyed Matrix (F2) Polyvalue Below Surface (S8) (LRR K, L) Depleted Below Dark Surface (A11) Depleted Matrix (F3) Thin Dark Surface (S9) (LRR K, L) Thick Dark Surface (A12) Redox Dark Surface (F6) Iron-Manganese Masses (F12) (LRR K, L, R) Sandy Mucky Mineral (S1) Depleted Dark Surface (F7) Piedmont Floodplain Soils (F19) (MLRA 149B) Sandy Gleyed Matrix (S4) Redox Depressions (F8) Mesic Spodic (TA6) (MLRA 144A, 145, 149B) Sandy Redox (S5) Red Parent Material (TF2) Stripped Matrix (S6) Very Shallow Dark Surface (TF12) Dark Surface (S7) (LRR R, MLRA 149B) Other (Explain in Remarks) 3Indicators of hydrophytic vegetation and wetland hydrology must be present, unless disturbed or problematic. Restrictive Layer (if observed): Type:
Depth (inches):
Hydric Soil Present? Yes No
Remarks:
70-W
1 to 0
0-4
4-9
16-22+
10YR 2/1
2.5 Y 4/2
2.5Y 5/2
100
85
90
5YR 4/6
5YR 4/6
15
10
C
C
M
M
mucky si l
l
l
leaf litter
Mn stains
slight firm
X
X
Plot 70-W is located 10 feet north of WF # 70.Plot 70-U is located 12 feet south of WF #70.The approximate difference in elevation from Plot 70-U to Plot 70-W is 1.5 feet

US Army Corps of Engineers Northcentral and Northeast Region – Interim Version
WETLAND DETERMINATION DATA FORM – Northcentral and Northeast Region Project/Site: City/County: Sampling Date:
Applicant/Owner: State: Sampling Point:
Investigator(s): Section, Township, Range:
Landform (hillslope, terrace, etc.): Local relief (concave, convex, none):
Slope (%): Lat: Long: Datum:
Soil Map Unit Name: NWI classification:
Are climatic / hydrologic conditions on the site typical for this time of year? Yes No (If no, explain in Remarks.)
Are Vegetation , Soil , or Hydrology significantly disturbed? Are “Normal Circumstances” present? Yes No
Are Vegetation , Soil , or Hydrology naturally problematic? (If needed, explain any answers in Remarks.)
SUMMARY OF FINDINGS – Attach site map showing sampling point locations, transects, important features, etc.
Hydrophytic Vegetation Present? Yes No Hydric Soil Present? Yes No Wetland Hydrology Present? Yes No
Is the Sampled Area within a Wetland? Yes No
If yes, optional Wetland Site ID: Remarks: (Explain alternative procedures here or in a separate report.)
HYDROLOGY Wetland Hydrology Indicators: Secondary Indicators (minimum of two required) Primary Indicators (minimum of one is required; check all that apply) Surface Soil Cracks (B6) Surface Water (A1) Water-Stained Leaves (B9) Drainage Patterns (B10) High Water Table (A2) Aquatic Fauna (B13) Moss Trim Lines (B16) Saturation (A3) Marl Deposits (B15) Dry-Season Water Table (C2) Water Marks (B1) Hydrogen Sulfide Odor (C1) Crayfish Burrows (C8) Sediment Deposits (B2) Oxidized Rhizospheres on Living Roots (C3) Saturation Visible on Aerial Imagery (C9) Drift Deposits (B3) Presence of Reduced Iron (C4) Stunted or Stressed Plants (D1) Algal Mat or Crust (B4) Recent Iron Reduction in Tilled Soils (C6) Geomorphic Position (D2) Iron Deposits (B5) Thin Muck Surface (C7) Shallow Aquitard (D3) Inundation Visible on Aerial Imagery (B7) Other (Explain in Remarks) Microtopographic Relief (D4) Sparsely Vegetated Concave Surface (B8) FAC-Neutral Test (D5) Field Observations: Surface Water Present? Yes No Depth (inches): Water Table Present? Yes No Depth (inches): Saturation Present? Yes No Depth (inches): (includes capillary fringe)
Wetland Hydrology Present? Yes No
Describe Recorded Data (stream gauge, monitoring well, aerial photos, previous inspections), if available:
Remarks:
Proposed Solar, Candlewood Mountain Road New Milford/Litchfield Co. 12-10-2016Amec Foster Wheeler Environment & Infrastructure, Inc. CT 70-U
Thomas W. Pietras, PEG, LLC hill slope convex
5-8% 41.57275 -73.44954 747 ftSutton very fine sandy loam (Aquic Dystrudepts)
Xno no no XXno no no
XXXX XX
XX
XXX X

US Army Corps of Engineers Northcentral and Northeast Region – Interim Version
VEGETATION – Use scientific names of plants. Sampling Point:
Dominance Test worksheet: Number of Dominant Species That Are OBL, FACW, or FAC: (A) Total Number of Dominant Species Across All Strata: (B) Percent of Dominant Species That Are OBL, FACW, or FAC: (A/B)
Prevalence Index worksheet: Total % Cover of: Multiply by: OBL species x 1 = FACW species x 2 = FAC species x 3 = FACU species x 4 = UPL species x 5 = Column Totals: (A) (B)
Prevalence Index = B/A =
Hydrophytic Vegetation Indicators: Rapid Test for Hydrophytic Vegetation Dominance Test is >50% Prevalence Index is 3.01 Morphological Adaptations1 (Provide supporting data in Remarks or on a separate sheet) Problematic Hydrophytic Vegetation1 (Explain) 1Indicators of hydric soil and wetland hydrology must be present, unless disturbed or problematic.
Definitions of Vegetation Strata: Tree – Woody plants 3 in. (7.6 cm) or more in diameter at breast height (DBH), regardless of height. Sapling/shrub – Woody plants less than 3 in. DBH and greater than 3.28 ft (1 m) tall. Herb – All herbaceous (non-woody) plants, regardless of size, and woody plants less than 3.28 ft tall. Woody vines – All woody vines greater than 3.28 ft in height.
Absolute Dominant Indicator Tree Stratum (Plot size: ) % Cover Species? Status
1.
2.
3.
4.
5.
6.
7.
= Total Cover
Sapling/Shrub Stratum (Plot size: )
1.
2.
3.
4.
5.
6.
7.
= Total Cover
Herb Stratum (Plot size: )
1.
2.
3.
4.
5.
6.
7.
8.
9.
10.
11.
12.
= Total Cover
Woody Vine Stratum (Plot size: )
1.
2.
3.
4.
= Total Cover
Hydrophytic Vegetation Present? Yes No
Remarks: (Include photo numbers here or on a separate sheet.)
70-U
30 ftBetula lentaQuercus rubraCarya ovata
55205
YYN
FACUFACUFACU
0
6
0%
15 ft80
10 Y FACUAcer saccharum
5 ft30
Polystichum acrostichoidesDryopteris marginalis
533
YYY
FACUFACUFACU
Berberis thunbergii
30 ft11
XX0

US Army Corps of Engineers Northcentral and Northeast Region – Interim Version
SOIL Sampling Point:
Profile Description: (Describe to the depth needed to document the indicator or confirm the absence of indicators.) Depth Matrix Redox Features (inches) Color (moist) % Color (moist) % Type1 Loc2 Texture Remarks
1Type: C=Concentration, D=Depletion, RM=Reduced Matrix, CS=Covered or Coated Sand Grains. 2Location: PL=Pore Lining, M=Matrix. Hydric Soil Indicators: Indicators for Problematic Hydric Soils3: Histosol (A1) Polyvalue Below Surface (S8) (LRR R, 2 cm Muck (A10) (LRR K, L, MLRA 149B) Histic Epipedon (A2) MLRA 149B) Coast Prairie Redox (A16) (LRR K, L, R) Black Histic (A3) Thin Dark Surface (S9) (LRR R, MLRA 149B) 5 cm Mucky Peat or Peat (S3) (LRR K, L, R) Hydrogen Sulfide (A4) Loamy Mucky Mineral (F1) (LRR K, L) Dark Surface (S7) (LRR K, L) Stratified Layers (A5) Loamy Gleyed Matrix (F2) Polyvalue Below Surface (S8) (LRR K, L) Depleted Below Dark Surface (A11) Depleted Matrix (F3) Thin Dark Surface (S9) (LRR K, L) Thick Dark Surface (A12) Redox Dark Surface (F6) Iron-Manganese Masses (F12) (LRR K, L, R) Sandy Mucky Mineral (S1) Depleted Dark Surface (F7) Piedmont Floodplain Soils (F19) (MLRA 149B) Sandy Gleyed Matrix (S4) Redox Depressions (F8) Mesic Spodic (TA6) (MLRA 144A, 145, 149B) Sandy Redox (S5) Red Parent Material (TF2) Stripped Matrix (S6) Very Shallow Dark Surface (TF12) Dark Surface (S7) (LRR R, MLRA 149B) Other (Explain in Remarks) 3Indicators of hydrophytic vegetation and wetland hydrology must be present, unless disturbed or problematic. Restrictive Layer (if observed): Type:
Depth (inches):
Hydric Soil Present? Yes No
Remarks:
70-U
1 to 0
0-2
2-7
7-12
12-19+
10YR 2/2
10YR 3/2
10YR 4/4
10YR 5/4
100
100
100
100
vfsl
vfsl
vfsl
fsl
leaf litter
stony
stony
XX

US Army Corps of Engineers Northcentral and Northeast Region – Interim Version
WETLAND DETERMINATION DATA FORM – Northcentral and Northeast Region Project/Site: City/County: Sampling Date:
Applicant/Owner: State: Sampling Point:
Investigator(s): Section, Township, Range:
Landform (hillslope, terrace, etc.): Local relief (concave, convex, none):
Slope (%): Lat: Long: Datum:
Soil Map Unit Name: NWI classification:
Are climatic / hydrologic conditions on the site typical for this time of year? Yes No (If no, explain in Remarks.)
Are Vegetation , Soil , or Hydrology significantly disturbed? Are “Normal Circumstances” present? Yes No
Are Vegetation , Soil , or Hydrology naturally problematic? (If needed, explain any answers in Remarks.)
SUMMARY OF FINDINGS – Attach site map showing sampling point locations, transects, important features, etc.
Hydrophytic Vegetation Present? Yes No Hydric Soil Present? Yes No Wetland Hydrology Present? Yes No
Is the Sampled Area within a Wetland? Yes No
If yes, optional Wetland Site ID: Remarks: (Explain alternative procedures here or in a separate report.)
HYDROLOGY Wetland Hydrology Indicators: Secondary Indicators (minimum of two required) Primary Indicators (minimum of one is required; check all that apply) Surface Soil Cracks (B6) Surface Water (A1) Water-Stained Leaves (B9) Drainage Patterns (B10) High Water Table (A2) Aquatic Fauna (B13) Moss Trim Lines (B16) Saturation (A3) Marl Deposits (B15) Dry-Season Water Table (C2) Water Marks (B1) Hydrogen Sulfide Odor (C1) Crayfish Burrows (C8) Sediment Deposits (B2) Oxidized Rhizospheres on Living Roots (C3) Saturation Visible on Aerial Imagery (C9) Drift Deposits (B3) Presence of Reduced Iron (C4) Stunted or Stressed Plants (D1) Algal Mat or Crust (B4) Recent Iron Reduction in Tilled Soils (C6) Geomorphic Position (D2) Iron Deposits (B5) Thin Muck Surface (C7) Shallow Aquitard (D3) Inundation Visible on Aerial Imagery (B7) Other (Explain in Remarks) Microtopographic Relief (D4) Sparsely Vegetated Concave Surface (B8) FAC-Neutral Test (D5) Field Observations: Surface Water Present? Yes No Depth (inches): Water Table Present? Yes No Depth (inches): Saturation Present? Yes No Depth (inches): (includes capillary fringe)
Wetland Hydrology Present? Yes No
Describe Recorded Data (stream gauge, monitoring well, aerial photos, previous inspections), if available:
Remarks:
Proposed Solar, Candlewood Mountain Road New Milford/Litchfield Co. 12-11-2016Amec Foster Wheeler Environment & Infrastructure, Inc. CT 101-W
Thomas W. Pietras, PEG, LLClower hill slope nearly level
1-2% 41.57399 -73.45708 690 ftAquepts PSS
Xno yes no XXno no no
XXXX XX
XX
The soils near data plot 101-W have been historically altered from the installation of a culvert thatcarries outflow from the pond which is located to the south of the data plot.
X
XXX
X
X
X

US Army Corps of Engineers Northcentral and Northeast Region – Interim Version
VEGETATION – Use scientific names of plants. Sampling Point:
Dominance Test worksheet: Number of Dominant Species That Are OBL, FACW, or FAC: (A) Total Number of Dominant Species Across All Strata: (B) Percent of Dominant Species That Are OBL, FACW, or FAC: (A/B)
Prevalence Index worksheet: Total % Cover of: Multiply by: OBL species x 1 = FACW species x 2 = FAC species x 3 = FACU species x 4 = UPL species x 5 = Column Totals: (A) (B)
Prevalence Index = B/A =
Hydrophytic Vegetation Indicators: Rapid Test for Hydrophytic Vegetation Dominance Test is >50% Prevalence Index is 3.01 Morphological Adaptations1 (Provide supporting data in Remarks or on a separate sheet) Problematic Hydrophytic Vegetation1 (Explain) 1Indicators of hydric soil and wetland hydrology must be present, unless disturbed or problematic.
Definitions of Vegetation Strata: Tree – Woody plants 3 in. (7.6 cm) or more in diameter at breast height (DBH), regardless of height. Sapling/shrub – Woody plants less than 3 in. DBH and greater than 3.28 ft (1 m) tall. Herb – All herbaceous (non-woody) plants, regardless of size, and woody plants less than 3.28 ft tall. Woody vines – All woody vines greater than 3.28 ft in height.
Absolute Dominant Indicator Tree Stratum (Plot size: ) % Cover Species? Status
1.
2.
3.
4.
5.
6.
7.
= Total Cover
Sapling/Shrub Stratum (Plot size: )
1.
2.
3.
4.
5.
6.
7.
= Total Cover
Herb Stratum (Plot size: )
1.
2.
3.
4.
5.
6.
7.
8.
9.
10.
11.
12.
= Total Cover
Woody Vine Stratum (Plot size: )
1.
2.
3.
4.
= Total Cover
Hydrophytic Vegetation Present? Yes No
Remarks: (Include photo numbers here or on a separate sheet.)
101-W
30 ftPinus strobusAcer rubrum
1510
YY
FACUFAC
5
6
83%
15 ft25
Salix discolorAcer rubrumRosa multiflora
1515105
YYNN
FACWFACWFACFACU
Alnus incana
5 ft55
Carex strictaSolidago sp.
251510
YY-
FACWOBL-
Onoclea sensibilis
30 ft50
XX0
X

US Army Corps of Engineers Northcentral and Northeast Region – Interim Version
SOIL Sampling Point:
Profile Description: (Describe to the depth needed to document the indicator or confirm the absence of indicators.) Depth Matrix Redox Features (inches) Color (moist) % Color (moist) % Type1 Loc2 Texture Remarks
1Type: C=Concentration, D=Depletion, RM=Reduced Matrix, CS=Covered or Coated Sand Grains. 2Location: PL=Pore Lining, M=Matrix. Hydric Soil Indicators: Indicators for Problematic Hydric Soils3: Histosol (A1) Polyvalue Below Surface (S8) (LRR R, 2 cm Muck (A10) (LRR K, L, MLRA 149B) Histic Epipedon (A2) MLRA 149B) Coast Prairie Redox (A16) (LRR K, L, R) Black Histic (A3) Thin Dark Surface (S9) (LRR R, MLRA 149B) 5 cm Mucky Peat or Peat (S3) (LRR K, L, R) Hydrogen Sulfide (A4) Loamy Mucky Mineral (F1) (LRR K, L) Dark Surface (S7) (LRR K, L) Stratified Layers (A5) Loamy Gleyed Matrix (F2) Polyvalue Below Surface (S8) (LRR K, L) Depleted Below Dark Surface (A11) Depleted Matrix (F3) Thin Dark Surface (S9) (LRR K, L) Thick Dark Surface (A12) Redox Dark Surface (F6) Iron-Manganese Masses (F12) (LRR K, L, R) Sandy Mucky Mineral (S1) Depleted Dark Surface (F7) Piedmont Floodplain Soils (F19) (MLRA 149B) Sandy Gleyed Matrix (S4) Redox Depressions (F8) Mesic Spodic (TA6) (MLRA 144A, 145, 149B) Sandy Redox (S5) Red Parent Material (TF2) Stripped Matrix (S6) Very Shallow Dark Surface (TF12) Dark Surface (S7) (LRR R, MLRA 149B) Other (Explain in Remarks) 3Indicators of hydrophytic vegetation and wetland hydrology must be present, unless disturbed or problematic. Restrictive Layer (if observed): Type:
Depth (inches):
Hydric Soil Present? Yes No
Remarks:
101-W
0-6
6-16
10YR 2/2
10YR 5/2 & 5/3 80 5YR 4/610YR 5/1
155
CD
MM
l
l
oxidized rhizosphere
X
X
Plot 101- is located 10 east of WF # 101.Plot 101-U is located 10 feet west of WF #101.The approximate difference in elevation from Plot 101-U to Plot 101-W is 1 feet.

US Army Corps of Engineers Northcentral and Northeast Region – Interim Version
WETLAND DETERMINATION DATA FORM – Northcentral and Northeast Region Project/Site: City/County: Sampling Date:
Applicant/Owner: State: Sampling Point:
Investigator(s): Section, Township, Range:
Landform (hillslope, terrace, etc.): Local relief (concave, convex, none):
Slope (%): Lat: Long: Datum:
Soil Map Unit Name: NWI classification:
Are climatic / hydrologic conditions on the site typical for this time of year? Yes No (If no, explain in Remarks.)
Are Vegetation , Soil , or Hydrology significantly disturbed? Are “Normal Circumstances” present? Yes No
Are Vegetation , Soil , or Hydrology naturally problematic? (If needed, explain any answers in Remarks.)
SUMMARY OF FINDINGS – Attach site map showing sampling point locations, transects, important features, etc.
Hydrophytic Vegetation Present? Yes No Hydric Soil Present? Yes No Wetland Hydrology Present? Yes No
Is the Sampled Area within a Wetland? Yes No
If yes, optional Wetland Site ID: Remarks: (Explain alternative procedures here or in a separate report.)
HYDROLOGY Wetland Hydrology Indicators: Secondary Indicators (minimum of two required) Primary Indicators (minimum of one is required; check all that apply) Surface Soil Cracks (B6) Surface Water (A1) Water-Stained Leaves (B9) Drainage Patterns (B10) High Water Table (A2) Aquatic Fauna (B13) Moss Trim Lines (B16) Saturation (A3) Marl Deposits (B15) Dry-Season Water Table (C2) Water Marks (B1) Hydrogen Sulfide Odor (C1) Crayfish Burrows (C8) Sediment Deposits (B2) Oxidized Rhizospheres on Living Roots (C3) Saturation Visible on Aerial Imagery (C9) Drift Deposits (B3) Presence of Reduced Iron (C4) Stunted or Stressed Plants (D1) Algal Mat or Crust (B4) Recent Iron Reduction in Tilled Soils (C6) Geomorphic Position (D2) Iron Deposits (B5) Thin Muck Surface (C7) Shallow Aquitard (D3) Inundation Visible on Aerial Imagery (B7) Other (Explain in Remarks) Microtopographic Relief (D4) Sparsely Vegetated Concave Surface (B8) FAC-Neutral Test (D5) Field Observations: Surface Water Present? Yes No Depth (inches): Water Table Present? Yes No Depth (inches): Saturation Present? Yes No Depth (inches): (includes capillary fringe)
Wetland Hydrology Present? Yes No
Describe Recorded Data (stream gauge, monitoring well, aerial photos, previous inspections), if available:
Remarks:
Proposed Solar, Candlewood Mountain Road New Milford/Litchfield Co. 12-11-2016Amec Foster Wheeler Environment & Infrastructure, Inc. CT 101-U
Thomas W. Pietras, PEG, LLC lower hill slope convex
3-5% 41.57399 -73.45112 691 ftSutton very fine sandy loam (Aquic Dystrudepts)
Xno no no XXno no no
XXXX XX
XX
XXX X

US Army Corps of Engineers Northcentral and Northeast Region – Interim Version
VEGETATION – Use scientific names of plants. Sampling Point:
Dominance Test worksheet: Number of Dominant Species That Are OBL, FACW, or FAC: (A) Total Number of Dominant Species Across All Strata: (B) Percent of Dominant Species That Are OBL, FACW, or FAC: (A/B)
Prevalence Index worksheet: Total % Cover of: Multiply by: OBL species x 1 = FACW species x 2 = FAC species x 3 = FACU species x 4 = UPL species x 5 = Column Totals: (A) (B)
Prevalence Index = B/A =
Hydrophytic Vegetation Indicators: Rapid Test for Hydrophytic Vegetation Dominance Test is >50% Prevalence Index is 3.01 Morphological Adaptations1 (Provide supporting data in Remarks or on a separate sheet) Problematic Hydrophytic Vegetation1 (Explain) 1Indicators of hydric soil and wetland hydrology must be present, unless disturbed or problematic.
Definitions of Vegetation Strata: Tree – Woody plants 3 in. (7.6 cm) or more in diameter at breast height (DBH), regardless of height. Sapling/shrub – Woody plants less than 3 in. DBH and greater than 3.28 ft (1 m) tall. Herb – All herbaceous (non-woody) plants, regardless of size, and woody plants less than 3.28 ft tall. Woody vines – All woody vines greater than 3.28 ft in height.
Absolute Dominant Indicator Tree Stratum (Plot size: ) % Cover Species? Status
1.
2.
3.
4.
5.
6.
7.
= Total Cover
Sapling/Shrub Stratum (Plot size: )
1.
2.
3.
4.
5.
6.
7.
= Total Cover
Herb Stratum (Plot size: )
1.
2.
3.
4.
5.
6.
7.
8.
9.
10.
11.
12.
= Total Cover
Woody Vine Stratum (Plot size: )
1.
2.
3.
4.
= Total Cover
Hydrophytic Vegetation Present? Yes No
Remarks: (Include photo numbers here or on a separate sheet.)
101-U
30 ftPinus strobusAcer rubrum
2510
YY
FACUFAC
2
4
50%
15 ft35
Rosa multiflora1010
YY
FACFACU
Acer rubrum
5 ft20
field grasses2515
--
--
Solidago sp.
30 ft40
XX0

US Army Corps of Engineers Northcentral and Northeast Region – Interim Version
SOIL Sampling Point:
Profile Description: (Describe to the depth needed to document the indicator or confirm the absence of indicators.) Depth Matrix Redox Features (inches) Color (moist) % Color (moist) % Type1 Loc2 Texture Remarks
1Type: C=Concentration, D=Depletion, RM=Reduced Matrix, CS=Covered or Coated Sand Grains. 2Location: PL=Pore Lining, M=Matrix. Hydric Soil Indicators: Indicators for Problematic Hydric Soils3: Histosol (A1) Polyvalue Below Surface (S8) (LRR R, 2 cm Muck (A10) (LRR K, L, MLRA 149B) Histic Epipedon (A2) MLRA 149B) Coast Prairie Redox (A16) (LRR K, L, R) Black Histic (A3) Thin Dark Surface (S9) (LRR R, MLRA 149B) 5 cm Mucky Peat or Peat (S3) (LRR K, L, R) Hydrogen Sulfide (A4) Loamy Mucky Mineral (F1) (LRR K, L) Dark Surface (S7) (LRR K, L) Stratified Layers (A5) Loamy Gleyed Matrix (F2) Polyvalue Below Surface (S8) (LRR K, L) Depleted Below Dark Surface (A11) Depleted Matrix (F3) Thin Dark Surface (S9) (LRR K, L) Thick Dark Surface (A12) Redox Dark Surface (F6) Iron-Manganese Masses (F12) (LRR K, L, R) Sandy Mucky Mineral (S1) Depleted Dark Surface (F7) Piedmont Floodplain Soils (F19) (MLRA 149B) Sandy Gleyed Matrix (S4) Redox Depressions (F8) Mesic Spodic (TA6) (MLRA 144A, 145, 149B) Sandy Redox (S5) Red Parent Material (TF2) Stripped Matrix (S6) Very Shallow Dark Surface (TF12) Dark Surface (S7) (LRR R, MLRA 149B) Other (Explain in Remarks) 3Indicators of hydrophytic vegetation and wetland hydrology must be present, unless disturbed or problematic. Restrictive Layer (if observed): Type:
Depth (inches):
Hydric Soil Present? Yes No
Remarks:
101-U
0-6
6-14
14-20
10YR 3/2
10YR 5/3
10YR 5/3
100
95 5YR 4/6 5 C M
vfsl
vfsl
fsl stony
XX

US Army Corps of Engineers Northcentral and Northeast Region – Interim Version
WETLAND DETERMINATION DATA FORM – Northcentral and Northeast Region Project/Site: City/County: Sampling Date:
Applicant/Owner: State: Sampling Point:
Investigator(s): Section, Township, Range:
Landform (hillslope, terrace, etc.): Local relief (concave, convex, none):
Slope (%): Lat: Long: Datum:
Soil Map Unit Name: NWI classification:
Are climatic / hydrologic conditions on the site typical for this time of year? Yes No (If no, explain in Remarks.)
Are Vegetation , Soil , or Hydrology significantly disturbed? Are “Normal Circumstances” present? Yes No
Are Vegetation , Soil , or Hydrology naturally problematic? (If needed, explain any answers in Remarks.)
SUMMARY OF FINDINGS – Attach site map showing sampling point locations, transects, important features, etc.
Hydrophytic Vegetation Present? Yes No Hydric Soil Present? Yes No Wetland Hydrology Present? Yes No
Is the Sampled Area within a Wetland? Yes No
If yes, optional Wetland Site ID: Remarks: (Explain alternative procedures here or in a separate report.)
HYDROLOGY Wetland Hydrology Indicators: Secondary Indicators (minimum of two required) Primary Indicators (minimum of one is required; check all that apply) Surface Soil Cracks (B6) Surface Water (A1) Water-Stained Leaves (B9) Drainage Patterns (B10) High Water Table (A2) Aquatic Fauna (B13) Moss Trim Lines (B16) Saturation (A3) Marl Deposits (B15) Dry-Season Water Table (C2) Water Marks (B1) Hydrogen Sulfide Odor (C1) Crayfish Burrows (C8) Sediment Deposits (B2) Oxidized Rhizospheres on Living Roots (C3) Saturation Visible on Aerial Imagery (C9) Drift Deposits (B3) Presence of Reduced Iron (C4) Stunted or Stressed Plants (D1) Algal Mat or Crust (B4) Recent Iron Reduction in Tilled Soils (C6) Geomorphic Position (D2) Iron Deposits (B5) Thin Muck Surface (C7) Shallow Aquitard (D3) Inundation Visible on Aerial Imagery (B7) Other (Explain in Remarks) Microtopographic Relief (D4) Sparsely Vegetated Concave Surface (B8) FAC-Neutral Test (D5) Field Observations: Surface Water Present? Yes No Depth (inches): Water Table Present? Yes No Depth (inches): Saturation Present? Yes No Depth (inches): (includes capillary fringe)
Wetland Hydrology Present? Yes No
Describe Recorded Data (stream gauge, monitoring well, aerial photos, previous inspections), if available:
Remarks:
Proposed Solar, Candlewood Mountain Road New Milford/Litchfield Co. 12-11-2016Amec Foster Wheeler Environment & Infrastructure, Inc. CT 113-W
Thomas W. Pietras, PEG, LLChill slope convex
3-5% 41.57574 -73.45606 750 ftRidgebury loam (Aeric Epiaquepts) PFO
Xno no no XXno no no
XXXX XX
XX
XXX
XX
X
X

US Army Corps of Engineers Northcentral and Northeast Region – Interim Version
VEGETATION – Use scientific names of plants. Sampling Point:
Dominance Test worksheet: Number of Dominant Species That Are OBL, FACW, or FAC: (A) Total Number of Dominant Species Across All Strata: (B) Percent of Dominant Species That Are OBL, FACW, or FAC: (A/B)
Prevalence Index worksheet: Total % Cover of: Multiply by: OBL species x 1 = FACW species x 2 = FAC species x 3 = FACU species x 4 = UPL species x 5 = Column Totals: (A) (B)
Prevalence Index = B/A =
Hydrophytic Vegetation Indicators: Rapid Test for Hydrophytic Vegetation Dominance Test is >50% Prevalence Index is 3.01 Morphological Adaptations1 (Provide supporting data in Remarks or on a separate sheet) Problematic Hydrophytic Vegetation1 (Explain) 1Indicators of hydric soil and wetland hydrology must be present, unless disturbed or problematic.
Definitions of Vegetation Strata: Tree – Woody plants 3 in. (7.6 cm) or more in diameter at breast height (DBH), regardless of height. Sapling/shrub – Woody plants less than 3 in. DBH and greater than 3.28 ft (1 m) tall. Herb – All herbaceous (non-woody) plants, regardless of size, and woody plants less than 3.28 ft tall. Woody vines – All woody vines greater than 3.28 ft in height.
Absolute Dominant Indicator Tree Stratum (Plot size: ) % Cover Species? Status
1.
2.
3.
4.
5.
6.
7.
= Total Cover
Sapling/Shrub Stratum (Plot size: )
1.
2.
3.
4.
5.
6.
7.
= Total Cover
Herb Stratum (Plot size: )
1.
2.
3.
4.
5.
6.
7.
8.
9.
10.
11.
12.
= Total Cover
Woody Vine Stratum (Plot size: )
1.
2.
3.
4.
= Total Cover
Hydrophytic Vegetation Present? Yes No
Remarks: (Include photo numbers here or on a separate sheet.)
113-W
30 ftQuercus rubraAcer rubrum Fraxinus americana
201515
YYY
FACUFACFACU
3
5
60%
15 ft50
35 Y FACWLindera benzoin
5 ft35
Sphagnum sp.358
Y-
FAC-
Microstegium vimineum
30 ft33
XX0
X

US Army Corps of Engineers Northcentral and Northeast Region – Interim Version
SOIL Sampling Point:
Profile Description: (Describe to the depth needed to document the indicator or confirm the absence of indicators.) Depth Matrix Redox Features (inches) Color (moist) % Color (moist) % Type1 Loc2 Texture Remarks
1Type: C=Concentration, D=Depletion, RM=Reduced Matrix, CS=Covered or Coated Sand Grains. 2Location: PL=Pore Lining, M=Matrix. Hydric Soil Indicators: Indicators for Problematic Hydric Soils3: Histosol (A1) Polyvalue Below Surface (S8) (LRR R, 2 cm Muck (A10) (LRR K, L, MLRA 149B) Histic Epipedon (A2) MLRA 149B) Coast Prairie Redox (A16) (LRR K, L, R) Black Histic (A3) Thin Dark Surface (S9) (LRR R, MLRA 149B) 5 cm Mucky Peat or Peat (S3) (LRR K, L, R) Hydrogen Sulfide (A4) Loamy Mucky Mineral (F1) (LRR K, L) Dark Surface (S7) (LRR K, L) Stratified Layers (A5) Loamy Gleyed Matrix (F2) Polyvalue Below Surface (S8) (LRR K, L) Depleted Below Dark Surface (A11) Depleted Matrix (F3) Thin Dark Surface (S9) (LRR K, L) Thick Dark Surface (A12) Redox Dark Surface (F6) Iron-Manganese Masses (F12) (LRR K, L, R) Sandy Mucky Mineral (S1) Depleted Dark Surface (F7) Piedmont Floodplain Soils (F19) (MLRA 149B) Sandy Gleyed Matrix (S4) Redox Depressions (F8) Mesic Spodic (TA6) (MLRA 144A, 145, 149B) Sandy Redox (S5) Red Parent Material (TF2) Stripped Matrix (S6) Very Shallow Dark Surface (TF12) Dark Surface (S7) (LRR R, MLRA 149B) Other (Explain in Remarks) 3Indicators of hydrophytic vegetation and wetland hydrology must be present, unless disturbed or problematic. Restrictive Layer (if observed): Type:
Depth (inches):
Hydric Soil Present? Yes No
Remarks:
113-W
1/2 to 0
0-6
6-14
14-18
18-24+
10YR 2/2
2.5 Y 5/2
2.5Y 4/3
2.5Y 5/3
100
85
90
85
5YR 4/6
5YR 4/6
5YR 4/610YR 6/2
15
10
105
C
C
CD
M
M
MM
si l
si l
si l
l
leaf litter
oxidized rhizosphere
Mn stains
slight firm
firm
X
compact lodgement till
18 X
Plot 113-W is located 10 west of WF # 113.Plot 113-U is located 8 feet east of WF #113.The approximate difference in elevation from Plot 113-U to Plot 1130-W is 2 feet.

US Army Corps of Engineers Northcentral and Northeast Region – Interim Version
WETLAND DETERMINATION DATA FORM – Northcentral and Northeast Region Project/Site: City/County: Sampling Date:
Applicant/Owner: State: Sampling Point:
Investigator(s): Section, Township, Range:
Landform (hillslope, terrace, etc.): Local relief (concave, convex, none):
Slope (%): Lat: Long: Datum:
Soil Map Unit Name: NWI classification:
Are climatic / hydrologic conditions on the site typical for this time of year? Yes No (If no, explain in Remarks.)
Are Vegetation , Soil , or Hydrology significantly disturbed? Are “Normal Circumstances” present? Yes No
Are Vegetation , Soil , or Hydrology naturally problematic? (If needed, explain any answers in Remarks.)
SUMMARY OF FINDINGS – Attach site map showing sampling point locations, transects, important features, etc.
Hydrophytic Vegetation Present? Yes No Hydric Soil Present? Yes No Wetland Hydrology Present? Yes No
Is the Sampled Area within a Wetland? Yes No
If yes, optional Wetland Site ID: Remarks: (Explain alternative procedures here or in a separate report.)
HYDROLOGY Wetland Hydrology Indicators: Secondary Indicators (minimum of two required) Primary Indicators (minimum of one is required; check all that apply) Surface Soil Cracks (B6) Surface Water (A1) Water-Stained Leaves (B9) Drainage Patterns (B10) High Water Table (A2) Aquatic Fauna (B13) Moss Trim Lines (B16) Saturation (A3) Marl Deposits (B15) Dry-Season Water Table (C2) Water Marks (B1) Hydrogen Sulfide Odor (C1) Crayfish Burrows (C8) Sediment Deposits (B2) Oxidized Rhizospheres on Living Roots (C3) Saturation Visible on Aerial Imagery (C9) Drift Deposits (B3) Presence of Reduced Iron (C4) Stunted or Stressed Plants (D1) Algal Mat or Crust (B4) Recent Iron Reduction in Tilled Soils (C6) Geomorphic Position (D2) Iron Deposits (B5) Thin Muck Surface (C7) Shallow Aquitard (D3) Inundation Visible on Aerial Imagery (B7) Other (Explain in Remarks) Microtopographic Relief (D4) Sparsely Vegetated Concave Surface (B8) FAC-Neutral Test (D5) Field Observations: Surface Water Present? Yes No Depth (inches): Water Table Present? Yes No Depth (inches): Saturation Present? Yes No Depth (inches): (includes capillary fringe)
Wetland Hydrology Present? Yes No
Describe Recorded Data (stream gauge, monitoring well, aerial photos, previous inspections), if available:
Remarks:
Proposed Solar, Candlewood Mountain Road New Milford/Litchfield Co. 12-11-2016Amec Foster Wheeler Environment & Infrastructure, Inc. CT 113-U
Thomas W. Pietras, PEG, LLC hill slope convex
10-15% 41.57576 -73.45600 752 ftWoodbridge very fine sandy loam (Aquic Dystrudepts)
Xno no no XXno no no
XXXX XX
XX
XXX X

US Army Corps of Engineers Northcentral and Northeast Region – Interim Version
VEGETATION – Use scientific names of plants. Sampling Point:
Dominance Test worksheet: Number of Dominant Species That Are OBL, FACW, or FAC: (A) Total Number of Dominant Species Across All Strata: (B) Percent of Dominant Species That Are OBL, FACW, or FAC: (A/B)
Prevalence Index worksheet: Total % Cover of: Multiply by: OBL species x 1 = FACW species x 2 = FAC species x 3 = FACU species x 4 = UPL species x 5 = Column Totals: (A) (B)
Prevalence Index = B/A =
Hydrophytic Vegetation Indicators: Rapid Test for Hydrophytic Vegetation Dominance Test is >50% Prevalence Index is 3.01 Morphological Adaptations1 (Provide supporting data in Remarks or on a separate sheet) Problematic Hydrophytic Vegetation1 (Explain) 1Indicators of hydric soil and wetland hydrology must be present, unless disturbed or problematic.
Definitions of Vegetation Strata: Tree – Woody plants 3 in. (7.6 cm) or more in diameter at breast height (DBH), regardless of height. Sapling/shrub – Woody plants less than 3 in. DBH and greater than 3.28 ft (1 m) tall. Herb – All herbaceous (non-woody) plants, regardless of size, and woody plants less than 3.28 ft tall. Woody vines – All woody vines greater than 3.28 ft in height.
Absolute Dominant Indicator Tree Stratum (Plot size: ) % Cover Species? Status
1.
2.
3.
4.
5.
6.
7.
= Total Cover
Sapling/Shrub Stratum (Plot size: )
1.
2.
3.
4.
5.
6.
7.
= Total Cover
Herb Stratum (Plot size: )
1.
2.
3.
4.
5.
6.
7.
8.
9.
10.
11.
12.
= Total Cover
Woody Vine Stratum (Plot size: )
1.
2.
3.
4.
= Total Cover
Hydrophytic Vegetation Present? Yes No
Remarks: (Include photo numbers here or on a separate sheet.)
113-U
30 ftQuercus rubraFraxinus americanaQuercus albaAcer rubrumBetula lenta
2020151510
YYYYN
FACUFACUFACUFACFACU
1
7
14%
15 ft80
Acer saccharumCarpinus caroliniana
20105
YYN
FACUFACUFAC
Hamamelis virginiana
5 ft35
5 Y NI-UPLCarex pensylvanica
30 ft5
XX0

US Army Corps of Engineers Northcentral and Northeast Region – Interim Version
SOIL Sampling Point:
Profile Description: (Describe to the depth needed to document the indicator or confirm the absence of indicators.) Depth Matrix Redox Features (inches) Color (moist) % Color (moist) % Type1 Loc2 Texture Remarks
1Type: C=Concentration, D=Depletion, RM=Reduced Matrix, CS=Covered or Coated Sand Grains. 2Location: PL=Pore Lining, M=Matrix. Hydric Soil Indicators: Indicators for Problematic Hydric Soils3: Histosol (A1) Polyvalue Below Surface (S8) (LRR R, 2 cm Muck (A10) (LRR K, L, MLRA 149B) Histic Epipedon (A2) MLRA 149B) Coast Prairie Redox (A16) (LRR K, L, R) Black Histic (A3) Thin Dark Surface (S9) (LRR R, MLRA 149B) 5 cm Mucky Peat or Peat (S3) (LRR K, L, R) Hydrogen Sulfide (A4) Loamy Mucky Mineral (F1) (LRR K, L) Dark Surface (S7) (LRR K, L) Stratified Layers (A5) Loamy Gleyed Matrix (F2) Polyvalue Below Surface (S8) (LRR K, L) Depleted Below Dark Surface (A11) Depleted Matrix (F3) Thin Dark Surface (S9) (LRR K, L) Thick Dark Surface (A12) Redox Dark Surface (F6) Iron-Manganese Masses (F12) (LRR K, L, R) Sandy Mucky Mineral (S1) Depleted Dark Surface (F7) Piedmont Floodplain Soils (F19) (MLRA 149B) Sandy Gleyed Matrix (S4) Redox Depressions (F8) Mesic Spodic (TA6) (MLRA 144A, 145, 149B) Sandy Redox (S5) Red Parent Material (TF2) Stripped Matrix (S6) Very Shallow Dark Surface (TF12) Dark Surface (S7) (LRR R, MLRA 149B) Other (Explain in Remarks) 3Indicators of hydrophytic vegetation and wetland hydrology must be present, unless disturbed or problematic. Restrictive Layer (if observed): Type:
Depth (inches):
Hydric Soil Present? Yes No
Remarks:
113-U
1 to 0
0-3
3-10
10-18
18-22+
10YR 2/2
10YR 4/4
10YR 5/3
10YR 4/4
100
100
100
97 5YR 4/6 3 C M
vfsl
vfsl
vfsl
vfsl
leaf litter
stony
stony
XX