Embed Size (px)
Citation preview

Publ ic Interest Energy Research (P IER) Program
INTERIM/FINAL PROJECT REPORT
Developing Information on Energy Savings and Associated Costs and Benefits of Energy Efficient Emerging Technologies Applicable in California
DECEMBER 2010
BOA ‐99 ‐205 ‐P
Prepared for: California Energy Commission
Prepared by: Lawrence Berkeley National Laboratory

Prepared by: Primary Author(s): Tengfang Xu Jan Willem Slaa Jayant Sathaye Lawrence Berkeley National Laboratory 1 Cyclotron Road Berkeley, CA 94720 http://www.lbl.gov Contract Number: BOA-99-205-P Prepared for: California Energy Commission Anish Gautam Contract Manager Pramod Kulkarni Project Manager Virginia Lew Office Manager Energy Efficiency Research Office Laurie Ten Hope Deputy Director Energy Research, Development and Demonstration Division Melissa Jones Executive Director
DISCLAIMER
This report was prepared as the result of work sponsored by the California Energy Commission. It does not necessarily represent the views of the Energy Commission, its employees or the State of California. The Energy Commission, the State of California, its employees, contractors and subcontractors make no warrant, express or implied, and assume no legal liability for the information in this report; nor does any party represent that the uses of this information will not infringe upon privately owned rights. This report has not been approved or disapproved by the California Energy Commission nor has the California Energy Commission passed upon the accuracy or adequacy of the information in this report.

i
ACKNOWLEDGEMENTS
This study is sponsored by the California Energy Commission’s Public Interest Energy Research (PIER) program, and managed by CIEE, under the Contract No. DE-AC02-05CH11231 with the U.S. Department of Energy. This report benefits from the guidance and recommendations provided by Anish Gautam and Promod Kulkarni of California Energy Commission’s Public Interest Energy Research (PIER) program. The authors would like to thank Dr. Wanfeng Zhang of Marvel Technologies, Inc. for his review comments on the report.

ii
PREFACE
The California Energy Commission’s Public Interest Energy Research (PIER) Program supports public interest energy research and development that will help improve the quality of life in California by bringing environmentally safe, affordable, and reliable energy services and products to the marketplace.
The PIER Program conducts public interest research, development, and demonstration (RD&D) projects to benefit California.
The PIER Program strives to conduct the most promising public interest energy research by partnering with RD&D entities, including individuals, businesses, utilities, and public or private research institutions.
• PIER funding efforts are focused on the following RD&D program areas:
• Buildings End‐Use Energy Efficiency
• Energy Innovations Small Grants
• Energy‐Related Environmental Research
• Energy Systems Integration
• Environmentally Preferred Advanced Generation
• Industrial/Agricultural/Water End‐Use Energy Efficiency
• Renewable Energy Technologies
• Transportation
Developing Information on Energy Savings and Associated Costs and Benefits of Energy Efficient Emerging Technologies Applicable in California is the report for the Industrial/Agricultural/Water End‐Use Energy Efficiency project (contract number BOA-99-205-P, grant number LBL9005398) conducted by Lawrence Berkeley National Laboratory. The information from this project contributes to PIER’s Industrial/Agricultural/Water End‐Use Energy Efficiency Program.
For more information about the PIER Program, please visit the Energy Commission’s website at www.energy.ca.gov/research/ or contact the Energy Commission at 916‐654‐4878.

iii
ABSTRACT
Adoption of energy-efficient technologies and practices as one of the most important and cost-effective strategies to reduce energy consumption while maintaining economic growth. In this study, we performed technology reviews to identify new or under-utilized technologies that could offer savings potential from improving energy efficiency and additional benefits to California industries as well as in the U.S. industries, followed by detailed technology assessment on each targeted technology, with a focus on California applications. A total of eleven emerging or underutilized technologies applicable to California were selected and characterized with detailed information in this report. The outcomes essentially include a multi-page summary profile for each of the 11 emerging or underutilized technologies applicable to California industries.
This document may be revised as the Energy Commission deems necessary. Please check for the latest version at:
www.energy.ca.gov/contracts/pier/contractors/
Keywords: California, emerging technology
Please use the following citation for this report:
Xu, Tengfang, Jan Willem Slaa, Jayant Sathaye. (Lawrence Berkeley National Laboratory). 2011. Developing Information on Energy Savings and Associated Costs and Benefits of Energy Efficient Emerging Technologies Applicable in California. California Energy Commission. Publication number: BOA-99-205-P.

iv
TABLE OF CONTENTS
Acknowledgements ................................................................................................................................... i
PREFACE ................................................................................................................................................... ii
ABSTRACT .............................................................................................................................................. iii
TABLE OF CONTENTS ......................................................................................................................... iv
Table of TAbles ......................................................................................................................................... v
EXECUTIVE SUMMARY ........................................................................................................................ 1
1 Introduction ....................................................................................................................................... 2
2 Methodology ...................................................................................................................................... 3
2.1 Assessment on Significance of Technologies ......................................................................... 4
2.1.1 Energy savings .................................................................................................................... 4
2.1.2 Cost of emerging technologies ......................................................................................... 5
2.1.3 Other benefits ..................................................................................................................... 5
2.2 Detailed Technology Characterizations .................................................................................. 6
2.2.1 Market information, new technology and reference technology in California ......... 6
2.2.2 Analyses of energy savings, cost, other benefits in California .................................... 6
3 Assessment on Significance of the Selected Emerging Technology ....................................... 7
3.1 Advanced Treatment Technologies – Ozonation of rinse water ......................................... 8
3.2 High-efficient Submersible Mixers for Wastewater Pond Aeration ................................. 11
3.3 Computer picked bacteria for better biogas generation in wastewater sludge digestion .
.................................................................................................................................................... 14
3.4 Solar dish engine to offset wastewater peak energy demand ........................................... 17
3.5 Vanadium Redox Flow Batteries for wastewater load management ............................... 19
3.6 Solar Thermal Cooling Systems ............................................................................................. 22
3.7 Motor Efficiency Improvement by Magnetically Coupled Adjustable Speed Drives
(MC-ASD) .............................................................................................................................................. 25
3.8 Power Factor Correction Controllers for More Efficient Electricity Grids ....................... 28
3.9 Super Boiler ............................................................................................................................... 31
3.10 CO2 as a refrigerant ................................................................................................................. 34
3.11 Submerged Combustion Melting ........................................................................................... 36
References................................................................................................................................................. 39

v
TABLE OF TABLES
Table 1. Significance ranking for each emerging technology by three criteria (i.e., energy savings, cost, other benefits). .................................................................................................................... 5
Table 2 Significance Assessment on 11 emerging technologies applicable to California ................ 7
Table 3. Advanced wastewater treatment Data table ......................................................................... 10
Table 4. High efficiency water mixer Data table ................................................................................. 13
Table 5. CASCADE clean energy system Data table .......................................................................... 16
Table 6. Solar Power Dish Engine for Wastewater Plant Electricity Data table ............................. 18
Table 7. Vanadium Redox Flow Batteries for Wastewater Treatment Plants Data table .............. 21
Table 8. Solar Thermal Cooling Data Table ......................................................................................... 24
Table 9. Magnetically Coupled Adjustable Speed Drives Data table .............................................. 27
Table 10. Power Factor Correction Controller implementation Data Table ................................... 30
Table 11. Super boiler Data table .......................................................................................................... 33
Table 12. CO2 refrigeration Data table ................................................................................................. 36
Table 13. Submerged combustion melting Data table ....................................................................... 38

1
EXECUTIVE SUMMARY
Implementation and adoption of efficient end-use technologies have proven to be one of the key measures for reducing greenhouse gas (GHG) emissions throughout the industries. In many cases, implementing energy efficiency measures is among one of the most cost effective investments that the industry could make in improving efficiency and productivity while reducing carbon dioxide (CO2) emissions. Over the years, there have been incentives to use resources and energy in a cleaner and more efficient way to create industries that are sustainable and more productive. With the working of energy programs and policies on GHG inventory and regulation, understanding and managing the costs associated with mitigation measures for GHG reductions is very important for the industry and policy makers around the world and in California. Successful implementation of applicable emerging technologies not only may help advance productivities, improve environmental impacts, or enhance industrial competitiveness, but also can play a significant role in climate-mitigation efforts by saving energy and reducing the associated GHG emissions. Developing new information on costs and savings benefits of energy efficient emerging technologies applicable in California market is important for policy makers as well as the industries. Therefore, provision of timely evaluation and estimation of the costs and energy savings potential of emerging technologies applicable to California is the focus of this report.
The overall goal of the project is to identify and select a set of emerging and under-utilized energy-efficient technologies and practices as they are important to reduce energy consumption in industry while maintaining economic growth. Specifically, this report contains the results from performing Task 3 “Technology Characterization for California Industries” for the project titled “Research Opportunities in Emerging and Under-Utilized Energy-Efficient Industrial Technologies,” sponsored by California Energy Commission (CEC) and managed by California Institute for Energy and Environment (CIEE). The project purpose is to characterize energy savings, technology costs, market potential, and economic viability of newly selected technologies applicable to California.
In this report, LBNL first performed technology reviews to identify new or under-utilized technologies that could offer potential in improving energy efficiency and additional benefits to California industries as well as in the U.S. industries, followed by detailed technology assessment on each targeted technology, with a focus on California applications. A total of eleven emerging or underutilized technologies applicable to California were selected and characterized with detailed information in this report. The outcomes essentially include a multi-page summary profile for each of the 11 emerging or underutilized technologies applicable to California industries, based on the formats used in the technology characterization reports (Xu et al. 2010; Martin et al. 2000).

2
1 Introduction The U.S. economy used 100 quadrillion Btu (106 EJ) of primary energy in 2008. The U.S. industries accounted for 32 percent of total domestic primary energy use that served the entire commercial, residential, industrial and transportation sectors. In California, a total of 7,707 TBtu (8.1 EJ) of primary energy was used in 2008, with the industrial sector using approximately 20% annually within the last decade (de la Rue du Can et al. 2010).
Implementation and adoption of efficient end-use technologies have proven to be one of the key measures for reducing greenhouse gas (GHG) emissions throughout the industries. In many cases, implementing energy efficiency measures is among one of the most cost effective investments that the industry could make in improving efficiency and productivity while reducing carbon dioxide (CO2) emissions. Over the years, there have been incentives to use resources and energy in a cleaner and more efficient way to create industries that are sustainable and more productive. With the working of energy programs and policies on GHG inventory and regulation, understanding and managing the costs associated with mitigation measures for GHG reductions is very important for the industry and policy makers around the world and in California. Successful implementation of applicable emerging technologies not only may help advance productivities, improve environmental impacts, or enhance industrial competitiveness, but also can play a significant role in climate-mitigation efforts by saving energy. Developing new information on costs and savings benefits of energy efficient emerging technologies applicable in California market is important for policy makers as well as the industries. Therefore, provision of timely evaluation and estimation of the costs and energy savings potential of emerging technologies applicable to California is the focus of this report.
a) Project Purpose
The overall goal of the project is to identify and select emerging and under-utilized energy-efficient technologies and practices as they are important to reduce energy consumption in industry while maintaining economic growth in California. This report contains the results from performing Task 3 “Technology Characterization for California Industries” for the project titled “Research Opportunities in Emerging and Under-Utilized Energy-Efficient Industrial Technologies,” sponsored by California Energy Commission (CEC) and managed by California Institute for Energy and Environment (CIEE). The project purpose is to characterize energy savings, technology costs, market potential, and economic viability of a set of newly selected technologies applicable to California.
b) Project Scope
In this project, we will first perform technology reviews to identify new or under-utilized technologies that could offer potential savings from improving energy efficiency and additional benefits to California industries as well as in the U.S. industries, followed by detailed technology assessment on each targeted technology, with a focus on California applications. A minimum of eight emerging technologies or underutilized technologies applicable to California will be identified and characterized with detailed information in this report. As a result, the report will also include a multi-page summary profile for each of the 11 emerging or underutilized technologies applicable to California industries, based on the formats used in the technology characterization reports (Xu et al. 2010; Martin et al. 2000).

3
2 Methodology Based upon the recent reviews and assessments of emerging energy-efficient industrial technologies by Xu et al. (2010), we first identified a few underutilized or new technologies that can be applicable to California industries but have not been studied before. Through further reviews, we also identified additional emerging technologies for detailed characterizations. During the course of the project, we communicated with the various industries to identify and select emerging technologies applicable to California industries. In summary, the new technologies included in this study were identified and selected via various activities that are categorized as:
1. Literature research and technology reviews, and 2. Communications with professionals and stake holders, including California
Energy Commission, utility companies, and various industries in California.
Specifically, we identified a number of underutilized or new technologies that were considered to have good potential in future perspective but had not been readily commercialized or were having low market penetration in the industries. In the project, we first performed technology and literature reviews to identify technologies, and collected relevant and updated information on energy efficiency, energy savings, market adoption, and costs of the selected emerging technologies applicable to various industries in California.
Using the data and information compiled, we then performed a technology screening to profile potential significance of each of the technologies that were initially identified, and selected a portion of them for detailed characterizations of costs and savings benefits. The initially identified technologies included:
• Novel materials for sludge dewatering • Ozonation treatment • Reuse wastewater by membrane filtration • Biodiesel methanol strippers • Wastewater pond mixers • Improve bacteria mix for biogas generation • Solar power dish engines • Vanadium redox flow batteries • Solar Thermal Cooling • Power Factor Correction • MagnaDrive
Based upon the overall score for each technology, we have eliminated three technologies that exhibited less significance. The following technologies had individual scores were 60 or higher, and were selected for detailed characterizations.
• Ozonation treatment • Wastewater pond mixers • Improve bacteria mix for biogas generation • Solar power dish engines

4
• Vanadium redox flow batteries • Solar Thermal Cooling • Power Factor Correction • MagnaDrive
Finally, we added three promising technologies that exhibited similar significance on the national level, and performed detailed characterizations of the following technologies applicable to California markets. Prior to this study, no detailed characterization of these four technologies has been performed.
• Super Boiler • Submerged Combustion Melting (SCM) • Carbon dioxide as a refrigerant.
2.1 Assessment on Significance of Technologies For the screening evaluation, significance of technologies was assessed by their potential using the following criteria: energy savings, first costs, and other benefits, all being compared to existing technologies. Here we used a similar rating system to rate the significance of energy saving, cost, and other benefits, as was adopted in the previous study (Xu et al. 2010). The three levels of significance are defined to be “low, medium, or high,” while in the case of “other benefits,” an additional category, “none,” is included.
Each level of significance corresponds to a pre-defined criteria score as shown in Table 1. The following describes how the criteria scores are developed including assumptions.
2.1.1 Energy savings First, the potential energy savings were identified by calculating the specific energy savings of an emerging technology when compared to that of the dominating technology (business as usual). Then, we extrapolated the difference to the total (potential) market size for California. The total potential energy savings percentage in the California industries can then be obtained by dividing this energy savings by the total industrial energy use in California, e.g., 45,176 GWh in 2010 ([EIA], 2010a).
There are various ways to obtain this percentage depending on the source of data and information available, based upon our literature research. For example, the savings can be quantified as an average saving in percentage (e.g. new method saves 20% energy), an average saving per product (e.g. 0.1 MBtu per short ton), or expected total savings for the whole sector in TBtu. In the first two scenarios mentioned, scaling up was then done by either looking at the total sector primary energy use, or the total production, respectively.
In this study, we evaluated the significance of energy savings potential for each emerging technology by its total potential energy savings percentage, which is defined as energy savings divided by the total California industrial energy use in 2009.
Based upon the comparison with the total California industrial electricity energy use in 2009, a total potential energy savings percentage above 0.1 percent for one technology is considered to have a “high” potential with a score of 40 points (shown in column 2 of Table 1), while a value lower than 0.01 percent is considered to have “low” potential, with a score of 10 points. A total potential energy savings percentage ranging between 0.01 and 0.1 percent is then considered to

5
have medium potential, corresponding to a score of 20 points. Overall, a higher savings score means greater significance in California.
Table 1. Significance ranking for each emerging technology by three criteria (i.e., energy savings, cost, other benefits).
2.1.2 Cost of emerging technologies Capital cost estimates of emerging technologies were based on descriptive information obtained from literature, mostly online sources, as actual costs are commonly unavailable in public domains.
As shown in column 3 of Table 1, an emerging technology is considered to have a “high” capital cost, corresponding to a score of 10 points, if its first cost is assessed as expensive as over 1.5 times the average cost of the conventional technology. On the other hand, a technology is considered to have a “low” capital cost, corresponding to a score of 30 points, if it is assessed to be significantly cheaper than the average cost of the conventional technology. If the technology first costs were comparable to a conventional technology or unclear, it would be assumed to be “medium,” corresponding to a score of 20 points. Overall, a higher cost score means a lower cost in California.
2.1.3 Other benefits Other benefits of emerging technologies, which are not directly related to energy savings or first costs, are also important factors affecting the market adoption of the emerging technologies. In the assessments, we considered four different types of other benefits: productivity improvement, product quality improvement, safety improvement benefits, and environmental benefits.
As shown in column 4 of Table 1, if any of these “other benefits” becomes the compelling driver for the technology’s adoption in the market, we would assign a high score (compelling benefits, 30 points). Otherwise, the other benefits could either be deemed ‘significant’ (medium score, 20 points), or ‘somewhat significant’ (low score, 10 points). No point was given when there were no “other benefits” identified in this study. A higher benefit score means greater significance in California.
For each technology, we then summed the scores from each of the three criteria. The summed score can in turn yield a final score that indicates the overall significance of the technology. By definitions shown in Table 1, the final score of an emerging technology could range from as low as 20 (low energy savings, high cost, no other benefit) up to 100 points (high energy savings, low cost, compelling other benefits).
According to the total score calculated for each technology, we then ranked the eight emerging technologies applicable to waste water management, and three additional cross-cutting technologies selected in this study, with a higher score indicating a higher level of significance.
Scoring RatingEnergy Savings Cost Other Benefits
High 40 10 30Medium 20 20 20Low 10 30 10None - - 0

6
In addition, we also identified three emerging technologies from the recent screening results (Xu et al. 2010) for further characterizations. As a result, a total of 11 technologies applicable to California are included for detailed characterization in this study.
2.2 Detailed Technology Characterizations For the 11 technologies selected, we performed updated characterization, each with a one- to two-page summary of the technology profiles, including a complementary data table. In the data table, the following information is included:
• Market information • Reference technology information • New technology information • Energy savings analysis • Cost analysis • Key non-energy factors • Evaluation • Data source information
2.2.1 Market information, new technology and reference technology in California In the profile table, market information includes types of technology application and energy used, and the industries to which the new technology is applicable. It also includes the estimated base-case in formation of the market in year 2015, such as production or the energy consumed in the relevant industries. Year 2015 was the same year used in the previous report for the sake of uniformity and the lack of proper forecasting tools. The reference technology information includes the reference technology application, throughput or production unit, and final and primary energy consumption per time (year, or hour), which provides a base case for the comparison with the new technology information. New technology information includes description of the new measure, electricity use, fuel use, and primary energy use. It also includes information on current status of market implementation, date of commercialization, and estimated life time of the new measure.
2.2.2 Analyses of energy savings, cost, other benefits in California The energy savings analysis is based upon the comparison of the new technology with its reference case. Estimates were made based on compiled source data from active literature research and technology information gathered in this study.
Normally, technology cost is quantified using either the cost of equipment installation or replacement, or incremental cost per energy unit compared to that of the reference technology. Sometimes, there was a lack of data for analyzing costs in which case no reasonable assessment could be made. In those cases, it will be notes as “N/A.”
The other benefits (non-energy) are evaluated using results from the screening assessments and promotion information on implementing the new technology.
Most of the updated information comes from online literature research and reviews. Specifically, we used the Google search engine to gather information and data for the technologies and the industries in which they are applicable. In addition, scientific literature was searched by using ISI Web of Knowledge. In these searches, particular emphasis was

7
placed on available information from manufacturers and research institutes that addressed implementation issues instead of academic issues. Information was also obtained from governmental websites (e.g. U.S. Department of Energy, U.S. Environmental Protection Agency) and the specific industry’s professional associations. Finally, information from newspaper and magazine articles was used to understand other benefits of relevant technologies in screening assessments.
3 Assessment on Significance of the Selected Emerging Technology
In this study, 11 technologies applicable to California industries were first assessed using the criteria described in the “Methodology” section. Table 2 includes the screening assessment results – criteria ranking scores and the total score for each of the 11 technologies.
Table 2 Significance Assessment on 11 emerging technologies applicable to California
Table 2 shows that five out of eight technologies sponsored by the California Energy Commission received total scores of 60 or above: Ozonation treatment, wastewater pond mixers, bacteria mix for biogas generation, solar power dish engines, and vanadium redox flow batteries. Based upon technical reviews, we also identified three emerging technologies that have significant potential, some of which have been implemented or demonstrated in other countries or states, while implementation of these are rather limited or non-existent in California. These technologies include: solar thermal cooling, power factor correction, and MagnaDrive (also in Table 2). In summary, eight technologies with total scores of 60 or above are selected for further characterizations. Three technologies (shaded in yellow color) with scores lower than 60 points were excluded for further characterization in this study.
Three additional technologies identified by Xu et al. 2010 from a recent study on the national level were then added due to their significance and applicability in California.
As a result, a total of 11 technologies are selected for detail characterizations in this study.
Measure / Technology Sector
Energy Savings Estimation
(GWh)
Energy savings
(%)Potential for
Energy Savings
Costs compared to
standard
Current Market
PenetrationOther
BenefitsSignificance of Other Benefits
Energy Scoring
Cost Scoring
Other Benefits scoring
Total Initial
ScoringNovel materials for sludge dewatering Wastewater 18 0.04% medium medium none P, E somewhat 0.2 0.2 0.1 50Ozonation treatment Food 15 0.03% medium low low P,Q,E,S compelling 0.2 0.3 0.3 80Reuse wastewater by membrane filtration Wastewater 42 0.09% medium medium low E somewhat 0.2 0.2 0.1 50Biodiesel methanol strippers Refineries 0.1 0.00% low medium none Q,E significant 0.1 0.2 0.2 50Wastewater pond mixers Wastewater 29 0.06% medium low low Q somewhat 0.2 0.3 0.1 60Improve bacteria mix for biogas Wastewater 483 1.04% high medium medium P,Q,E compelling 0.4 0.2 0.3 90Solar power dish engines cross-cutting 126 0.27% high high low E significant 0.4 0.1 0.2 70Vanadium redox flow batteries cross-cutting 50 0.11% high high low E somewhat 0.4 0.1 0.1 60Solar Thermal Cooling cross-cutting 681 1.46% high high medium E compelling 0.4 0.1 0.3 80Power Factor Correction cross-cutting 400 0.86% high medium low P,Q significant 0.4 0.2 0.2 80MagnaDrive cross-cutting 816 1.75% high medium low P somewhat 0.4 0.2 0.1 70

8
Detailed Characterizations
The following 11 technologies had individual scores of 60 or higher, and were selected for detailed characterizations.
• Ozonation treatment • Wastewater pond mixers • Improve bacteria mix for biogas generation • Solar power dish engines • Vanadium redox flow batteries • Solar Thermal Cooling • Power Factor Correction • MagnaDrive • Super Boiler • High‐efficiency welding • Submerged Combustion Melting (SCM) • Carbon dioxide as a refrigerant
Detailed characterizations are included in the following.
3.1 Advanced Treatment Technologies – Ozonation of rinse water In many wastewater treatment facilities it is common to disinfect the effluent at the end of treatment. Although definition vary, disinfection is sometimes qualified as part of tertiary or advanced treatment and aims to kill of pathogens and microorganisms ([EPA], 2004). Food processing industry may use large amounts of water to wash, cook and transport fruits and vegetables. It is estimated that 70 thousand acre feet (86,000,000 m3) are used in the fruit and vegetable industry in California annually, which is about ten percent of its industrial total water use (Gleick et al., 2003). As water use and energy use are closely related (Klein et al., 2005), the Californian fruit and vegetable industry also uses significant amounts of energy. Indeed, it estimated this sector uses 600-800 GWh annually (Shoemaker, 2006). Reducing water use by extending water lifetime and quality may therefore lead to major energy savings.
The fruit and vegetable processing industry of California is the largest in the United States due to the size of the state’s agricultural sector. In 2008, some 42 million short tons (38.1 Mt) of agricultural products were harvested in the state ([CDFA], 2010). Further processing steps depend on the large variety of fruit and vegetable end products (e.g. cans, frozen, fresh). For treatment of many fresh-cut fruits and vegetables a large quantity of water is necessary to rinse the product from dirt and other pollutants like pathogens or microorganisms, which could cause decay of the food product. In the data table we estimate that ten percent of the sector total water use is used for rinse water.
Currently, rinse water may act both as a conveyor to transport the fruits or vegetables to the next process, as well as for washing. To restrict microorganism growth, the washing water is mostly chilled, especially in the case of fresh cuts and antimicrobial chemicals like chlorine and organic acids may be added (Biswas, 2009). After a certain time period this rinse water needs to be refreshed and the residual water is mostly disposed at the sewage system for municipal wastewater treatment.

9
New advanced treatment technologies for disinfection have gained attention lately and can generally be classified in membrane filtration, UV radiation and advanced oxidation processes (AOPs) (Zhou & Smith, 2001). Advanced treatment is beneficial as it might enable the direct reuse of effluent water (Shon, Vigneswaran, & Snyder, 2006). Reclaiming wastewater for further use reduces the energy costs involved in transport and offsite treatment as well as decreasing the impact on natural water resources. In the fruit and vegetable processing industry an ideal solution would be to reuse the water for washing processes. Another way to use these advanced technologies in these industries could also be to treat water before use. Such would extend the period in which the water can be safely used end reduce chilling costs.
The most studied alternative to conventional disinfection technologies appears is ozonation. This is an advanced oxidation process which uses the reactive ozone gas to degrade organic compounds (Zhou & Smith, 2001). As ozone (O3) decomposes readily to oxygen, no harmful residues will result in ozonation processes, which is an advantage over chlorine use. Also, some microorganisms are better disabled by ozone than by chlorine (Olmez & Kretzschmar, 2009). A disadvantage of ozonation would be that it has to be generated onsite, because its reactivity makes it an explosive compound when used without proper handling. In recent years ozone has become more popular in the food industry (Hirneisen et al., 2010).
Ozone technology has been demonstrated at some food processing plants in California for the flour production and fresh cut vegetables processing (Biswas, 2009). Especially the latter case has gained some attention, because during implementation it was realized water use was reduced by about 60% due to fewer flume water changes (Strickland et al., 2007). The system still used some chlorine, but the whole system was a worthwhile investment with a payback period of less than two years. These values are used for the data table and because reduced water consumption results in less energy required for water chilling, it is assumed that energy reduction is comparable to the reduction in water use.
While there are significant benefits of using ozone instead of chlorine varying from quality to environmental benefits, barriers to further implementation still exist. There is a lack of information and communication with regard to the technology between suppliers and end-users (Biswas, 2009). Also, some health and safety fears remain. To address these issues, the California Energy Commission is currently funding a project at the Duda Farm Fresh Foods plant in Oxnard, California.

10
Table 3. Advanced wastewater treatment Data table
Advanced treatment technologies like ozonation might improve the energy efficiency of the Californian food processing industry. Water chilling is a significant energy cost of this industry and any technology which can reduce water use is likely to result in energy savings. Still, more research is needed on its actual potential and implementation issues. Ozone generation for example is an energy intensive process and might limit the potential of this technology.
Units NotesAdvanced Wastewater Treatment Technologies wastewater-2 Addition of ozone to flume and rinse water decreases microbial growth and energy use in water chilling
Market Information:Industries NAICS 31142 End-use(s)Energy types Market segment 2015 basecase GWh Shoemaker 2006Reference technology Description Throughput or annual operating hours MG 10% of sector total (Gleick 2003)Electricity use GWhFuel use TBtu Primary Energy use TBtu New Measure Information: Description Electricity use GWh 50% reduction (1:1 water use : chilling energy use)Fuel use TBtu Primary Energy use TBtu Current status Date of commercialization Author's EstimateEstimated average measure lifetime Years Author's EstimateSavings Information: Electricity savings GWh/% 15.21 0%Fuel savings TBtu/% 0.00 0%Primary energy savings TBtu/% 0.13 50% Penetration rate Feasible applications % Applicable to most plantsOther key assumptions for savings Electricity savings potential in 2015 GWhFuel savings potential in 2015 TBtu Primary energy savings potential in 2015 TBtu Cost Effectiveness Investment cost $ Demonstration in salad producing industry, StricklandType of cost Change in annual costs (O&M/other benefits) $Cost of conserved energy (electricity) $/kWhCost of conserved energy (fuel) $/Mbtu Cost of conserved energy (primary energy) $/Mbtu Simple payback period YearsInternal rate of return %Key non energy factors Productivity benefits Less water per product, less maintenance Product quality benefits Fewer chlorine residues Environmental benefits Embedded energy savings in water chainOther benefits Lower health-risk employeesCurrent promotional activity H,M,L Evaluation Major market barriers Grant Proposal (Biswas 2009)Likelihood of success H,M,L Significant benefits Recommended next steps On energy savingsData quality assessment E,G,F,PSources2015 basecase Shoemaker 2006Basecase energy use Gleick 2003, Grant Proposal (Biswas 2009)New Measure energy savings Grant Proposal (Biswas 2009)Lifetime Author's EstimateFeasible applications Grant Proposal (Biswas 2009)Costs Strickland 2006 Key non energy factors Grant Proposal (Biswas 2009)Principal contacts Additional notes and sources
Lack of understanding Medium
More researchFair
Somewhat SignificantSomewhat
Low
1100611 1.8
55% Significant
Full112300
N/A N/A
150
0.130
200000
30
Low90%
0.00 0.13
Field Test 2012
0.00 0.26
Addition of ozone to flume and rinse water to increase time water can be used15
800
Chlorination of flume and rinse water 228130
Fruit/vegetable processingProcess Cooling
ElectricityRetrofit

11
However, if an advanced treatment technology will be able to show productivity improvements, water reductions and environmental benefits without rebound effects, its future may be large.
3.2 High-efficient Submersible Mixers for Wastewater Pond Aeration While most wastewater treatment occurs in larger plants, small scale onsite treatment is an alternative when discharge to sewers is expensive or not possible. One of the oldest onsite methods would be the stabilization pond ([EPA], 1983). These ponds treat wastewater in large basins or ponds (sometimes also called lagoons), which are designed for an average residence time of 1-4 weeks normally. If the wastewater load is not too high, facultative ponds without aeration equipment can be used. However, many wastewater streams require artificial oxygen addition (aeration) to keep the bacteria, which break down the pollutants, alive. California currently has at least 150 aerated wastewater stabilizations ponds out of some 400 in total (Nelson, 2005).
Single wastewater treatment ponds consume less energy than a large, modern treatment plant per volume of wastewater. Still, it is expected to use about 1000 kWh per million gallons per day (MGD). To a large extent this is due to the electricity required for operating the aerators. Most aerators function both as aerator and as mixer in the wastewater pond and this might result in suboptimal working conditions (Oppenheimer, 2009). At this time aerators are mainly found in two types: surface aerators and aspirating aerators. The first pumps water into the air, while the latter pumps air into the water. In both cases there are limitations to the water depth which can be fully aerated.
Improvement of aeration efficiency will lead to a reduction in electricity use. One of the approaches to achieve such improvement is by replacing traditional water aerators by submerged water circulators or mixers. Better mixing would yield a more dynamic water surface, which would enhance oxygen transfer to the water. Recently, PAX water has developed an efficient submerged water mixer and demonstrated excellent water mixing properties in water towers with large temperature variation over the year. The main reason for these results would be in the design of the impeller. Based on computational fluid dynamics studies, the design was optimized to obtain uniform flow patterns and eliminate water gradients. The technology has been demonstrated successfully at a wastewater pond of a Californian winery and is currently being extended (Oppenheimer, 2009).
Aspirating and surface aerators cost about $ 5000-7000 per 5 or 10 HP unit. In the data table we assume the price for a high-efficient water mixer to be $ 10,000 per unit. If the electricity savings are large however (e.g. 50%) payback periods may be as short as half a year1. In this respect, investment in this new technology seems very worthwhile.
Nevertheless, successful demonstration in different wastewater ponds with different wastewater properties has yet to be presented as the combination of mixing and aeration is a complex issue (Sardeing et al., 2005). Oxygen transfer rates might still be lower with water mixers, compared to aerators. The water mixer requires a minimum depth of 8 feet (2.4 m) for optimal working and in some ponds this might be a problem. Also, water circulation can have unforeseen side effects. A recent study showed improved bacterial growth (which was
1 With an industrial electricity purchase price of $ 0.12 per kWh in California.

12
beneficial in this case) due to wastewater circulation (McGarvey et al., 2009). Therefore, further studies would be helpful in establish the effects of the high efficient water mixer on wastewater ponds.
The large barrier to implementation however, might be the limited scale to which the technology is applicable. While 400 wastewater ponds can be found in California (Nelson, 2005) and this number might even be larger as there is no exact recording system in the state (Oppenheimer, 2009), the ponds are generally small and may treat less than a million gallon per day (in the data table we assume 1 MGD). Its potential for energy savings on a large scale is therefore limited. Still, the technology can be valuable for small scale wastewater producers with an onsite wastewater pond who would like to cut on their energy expenses.

13
Table 4. High efficiency water mixer Data table
Units NotesHigh efficient wastewater pond mixerwastewater-5Improved design in wastewater pond mixer results in better aeration and mixer with lower electricity costsMarket Information:IndustriesEnd-use(s)Energy typesMarket segment2015 basecase MGDReference technologyDescriptionThroughput or annual operating hours MGDElectricity use kWhFuel use MBtuPrimary Energy use MBtuNew Measure Information:DescriptionElectricity use kWhFuel use MBtuPrimary Energy use MBtuCurrent statusDate of commercialization For freshwater stratification applicationsEstimated average measure lifetime YearsSavings Information:Electricity savings kWh/% 500 50%Fuel savings MBtu/% 0 0%Primary energy savings MBtu/% 4 50%Penetration rateFeasible applications %Other key assumptions for savingsElectricity savings potential in 2015 GWhFuel savings potential in 2015 TBtu Primary energy savings potential in 2015 TBtu Cost EffectivenessInvestment cost $Type of costChange in annual costs (O&M/other benefits) $Cost of conserved energy (electricity) $/kWhCost of conserved energy (fuel) $/MbtuCost of conserved energy (primary energy) $/MbtuSimple payback period YearsInternal rate of return %Key non energy factors Productivity benefitsProduct quality benefits Stratified effluentEnvironmental benefitsOther benefits Less noiseCurrent promotional activity H,M,LEvaluationMajor market barriersLikelihood of success H,M,LRecommended next stepsData quality assessment E,G,F,PSources:2015 basecase Nelson 2005Basecase energy use EPA 1983New Measure energy savings Proposal (Oppenheimer 2009)Lifetime Author's EstimateFeasible applications Nelson 2005Costs Proposal (Oppenheimer 2009)Key non energy factors Paxwater.com; Proposal (Oppenheimer 2009)Principal contactsAdditional notes and sources
UtilitiesElectricity
Replace on failure400
Energy use of aerated pond by surface or aspirating aerator1
1,00009
Energy use of new PAX water mixer with improved design500
04
Commercialized2007
20
Low40%
290
0.25
10000Full
21900200
55090.5
219%
NoneSomewhat
NoneSomewhat
High
Limited marketMedium
Demonstration no side-effectsFair

14
3.3 Computer picked bacteria for better biogas generation in wastewater sludge digestion
Wastewater treatment uses significant amounts of energy and accounts for 1-2 percent of the total industrial electricity use of the United States (Appelbaum, 2002). In California it is estimated that public wastewater treatment facilities use 2012 GWh (Klein et al., 2005). As more stringent environmental regulations might increase the energy intensity of wastewater treatment, there is a need to make the wastewater sector more energy efficient. One of the technologies which can reduce the energy consumption of a plant significantly is by making use of the biosolid waste to generate biogas (mainly methane). This gas can be used to drive a turbine and generate online electricity for the plant operations. Biogas is formed by anaerobic bacteria and this anaerobic digestion process has been established in wastewater treatment facilities (Lettinga, 1995). Nevertheless, natural bacteria only convert the organic sludge materials partly (60%) to natural gas (Braaksma, 2010). Improvement of this process may increase the energy efficiency of the total plant.
Currently, wastewater sludge is thickened and pretreated before actual digestion takes place (Appels et al., 2008). In the digestion process four reaction steps can be described. First, suspended organics are hydrolyzed so that all organic materials are in solution. Further degradation (acidogenesis and acetogenesis steps) takes place which results in organic acids and gasses like hydrogen and carbon dioxide. These materials are then converted in the final step to methane and carbon dioxide. Currently, the rate determining step is the initial hydrolysis step. All these steps are facilitated by anaerobic bacteria (Angenent et al., 2004).
To improve the efficiency of the anaerobic digestion process several approaches have been examined. Sludge pre-treatment by radiation for example, to ease the hydrolysis step, or co-digestion which digests several substrates simultaneously. Another approach however, addresses the bacteria which perform the digestion processes. Choosing the appropriate bacteria might enhance sludge conversion to biogas. Cascade Clean Energy has been developing software which recognizes wastewater characteristics for a fit to certain bacteria and has demonstrated large conversion gains by adding the best bacteria mix in laboratory settings (Zhou, 2009).
A wastewater treatment facility could improve its energy efficiency to a large extent if methane production would be enlarged to a large extent and used to generate electricity or for heating purposes. For the data table we assume that a plant uses 2000 kWh per million gallons of treated wastewater on average (Water Environment Federation, 2009). With potential energy savings of 30 percent due to the enhanced bacteria mix and applicability to 80 percent of the plants (> 2 MGD) ([EPA], 2008), this could yield electricity savings close to 500 GWh in California.
However, the technology still has to be developed to a commercial scale. At the moment field tests of the technology are to be performed at the Dublin San Ramon Service District wastewater plant to show whether the technology can actually be implemented on a plant level (Zhou, 2009). In this test no genetically modified bacteria will be used, which might make the biogas increase more modest. Problems might arise in controlling the large scale bacteria mix.
The technology is expensive because of the significant costs associated with bacteria acquirement, but might still have a payback period of some three years with the significant

15
production increase on a bench scale level. Still, capital costs are large and before a smaller wastewater treatment plant would like to invest such a technology, it has to have some proven results.
There is a definite chance of success for this technology, as the lab results have been very promising and biogas production out of a waste stream has clear benefits. It reduces infrastructural needs for energy supply and will also reduce the sludge volume which will save sludge disposal costs. Nevertheless, the complex bacteria mixture might prove difficult to maintain at a larger scale. If scaling up problems can be overcome, the impact of this technology can be very large.

16
Table 5. CASCADE clean energy system Data table
Units NotesCASCADE system for enhanced biogas generationwastewater-6Improving bacteria mix to enhance biogas generation in sludge generation, combined with biogas reactor for onsite electricity generationMarket Information:IndustriesEnd-use(s)Energy typesMarket segment2015 basecase GWhReference technologyDescriptionThroughput or annual operating hours MGDElectricity use kWhFuel use MBtuPrimary Energy use MBtuNew Measure Information:DescriptionElectricity use kWhFuel use MBtuPrimary Energy use MBtuCurrent statusDate of commercialization EstimatedEstimated average measure lifetime YearsSavings Information:Electricity savings kWh/% 600 30%Fuel savings MBtu/% 0 0%Primary energy savings MBtu/% 5 30%Penetration rateFeasible applications %Other key assumptions for savingsElectricity savings potential in 2015 GWhFuel savings potential in 2015 TBtu Primary energy savings potential in 2015 TBtu Cost EffectivenessInvestment cost $Type of costChange in annual costs (O&M/other benefits) $Cost of conserved energy (electricity) $/kWhCost of conserved energy (fuel) $/MbtuCost of conserved energy (primary energy) $/MbtuSimple payback period YearsInternal rate of return %Key non energy factors Productivity benefits More rapid biogas generationProduct quality benefits Higher energy densityEnvironmental benefits Lower sludge volumeOther benefitsCurrent promotional activity H,M,LEvaluationMajor market barriersLikelihood of success H,M,LRecommended next stepsData quality assessment E,G,F,PSources:2015 basecase Klein 2005Basecase energy use Water Environment Federation 2009New Measure energy savings Proposal (Zhou 2009)Lifetime Author's EstimateFeasible applications EPA 2008Costs Proposal (Zhou 2009)Key non energy factors Proposal (Zhou 2009)Principal contactsAdditional notes and sources
UtilitiesElectricityRetrofit2012
Activated sludge wastewater treatment plant without digestion1
2,000017
Activated sludge wastewater treatment plant with CASCADE bioreactor1400
012
Field test201220
Low80%
4830
4.12
780000Full
2600001300
032207
3.031%
SignificantSomewhatSignificant
NoneLow
No large scale resultsMedium
Large field demonstrationFair

17
3.4 Solar dish engine to offset wastewater peak energy demand Renewable energy sources like the wind and the sun have received major attention in the last decades as potential new sources of electricity. Especially the sun emits enormous amounts of energy, but has a low energy density which makes it more difficult to generate electricity competitively to fossil fuel sources. The main approach to solar electricity has been by developing photovoltaic cells (Gratzel, 2001). Another method however, concentrates sunlight with mirrors or lenses to create high temperatures which may drive turbines or engines. Such solar thermal energy designs have been installed for larger plants, compared to average photovoltaic sizes, at sunny locations (Ridao et al., 2007).
One of the concentrated solar power designs makes use of a large dish and a Sterling engine at the focal point (solar power dish engine). A large number of these devices can produce a significant amount of energy during daylight hours when the dish is tracking the sun. Arguably, the potential for this sort of technology may be very large, but has met with unfortunate market conditions in the past (Mills, 2004). In the last ten years however, solar power dish engines have become commercially available and are being built on ‘cloudless’ locations, for example in the U.S. states of Nevada and California. The intermittency of the power generation remains a disadvantage, although heat may be stored more easily than electricity.
An interesting idea is to use the solar dish engines at locations where peak energy consumption takes place during the day. This is an example of a demand response technology which acts when electricity consumption is rising to ‘shave’ the peak energy demand. One of the applicable industrial areas for this idea is the wastewater industry. Currently, Californian public wastewater treatment facilities use 2012 GWh annually (Klein et al., 2005) and have a larger energy demand in the daytime (Lekov et al., 2009; Park & Bennett, 2010). Demonstration of this technology at a Californian wastewater treatment facility is planned in the coming years (Loge, 2009). The demonstration project will involve 1 MW of energy producing solar engine dishes and about 330 dishes need to be built to achieve this output.
Manufacturers of such dishes are Infinia and Tessera Solar, which are starting full scale production in 2010. The reason for the very recent scale up of production is the approval of the environmental reviews of large surface projects (Woody, 2010). Still they need federal loans, because the capital investments are very significant. For the wastewater demonstration project the costs are estimated at about nine million dollars (including labor), which would correspond to some $ 27,000 per 3 kW dish. With a current industrial electricity price of $ 0.12 per kWh this would not yet be economical.
In the data table we take a 4 million gallon per day wastewater treatment plant with the average energy consumption of 2000 kWh / MG (Water Environment Federation, 2009) and assume the plant saves on its utility bill by installing the solar dishes. The project developers expect that these can reduce the utility-supplied energy by about 25 percent (Loge, 2009). For the whole state of California, such reduction would save some 500 GWh of publicly supplied energy if fully applied. We assume the technology to be applicable to 25% of the plant’s capacities as not all plants are large enough or have sufficient land available around the plant.
Despite these limitations, the technology might become more attractive with rising energy prices and would clearly aid in the state’s goal to generate more renewable energy. Especially in

18
the dry and sunny southern part of California, this technology would be in place. However, the costs have yet to come down to be implemented to its fullest extent.
Table 6. Solar Power Dish Engine for Wastewater Plant Electricity Data table
Units NotesSolar dish/engine for energy storagewastewater-7Using solar energy to offset the peak energy demand of a wastewater plantMarket Information:IndustriesEnd-use(s) UtilitiesEnergy types ElectricityMarket segment Retrofit2015 basecase GWh 2012Reference technologyDescription Wastewater treatment plant 2 MGDThroughput or annual operating hours MGD 4Electricity use kWh 8,000Fuel use MBtu 0Primary Energy use MBtu 68New Measure Information:Description Wastewater treatment plant 4 MGD with 1 MW Solar power generationElectricity use kWh 6000Fuel use MBtu 0Primary Energy use MBtu 51Current status CommercializedDate of commercialization 2010Estimated average measure lifetime Years 25 thepowerdish.comSavings Information:Electricity savings kWh/% 2000 25%Fuel savings MBtu/% 0 0%Primary energy savings MBtu/% 17 25%Penetration rate LowFeasible applications % 25%Other key assumptions for savingsElectricity savings potential in 2015 GWh 126Fuel savings potential in 2015 TBtu 0Primary energy savings potential in 2015 TBtu 1.07Cost EffectivenessInvestment cost $ 9000000Type of cost FullChange in annual costs (O&M/other benefits) $ 87600Cost of conserved energy (electricity) $/kWh 4500Cost of conserved energy (fuel) $/Mbtu 0Cost of conserved energy (primary energy) $/Mbtu 28915Simple payback period Years 102.7Internal rate of return % N/AKey non energy factors Productivity benefits NoneProduct quality benefits NoneEnvironmental benefits Significant No greenhouse gase emissionsOther benefits Somewhat Low maintenance costs, peak shavingCurrent promotional activity H,M,L LowEvaluationMajor market barriers Not yet profitableLikelihood of success H,M,L MediumRecommended next steps Reduce costsData quality assessment E,G,F,P FairSources:2015 basecase Klein 2005Basecase energy use Water Environment Federation 2009New Measure energy savings Proposal (Loge 2009)Lifetime thepowerdish.comFeasible applications thepowerdish.comCosts Proposal (Loge 2009)Key non energy factors Proposal (Loge 2009)Principal contactsAdditional notes and sources

19
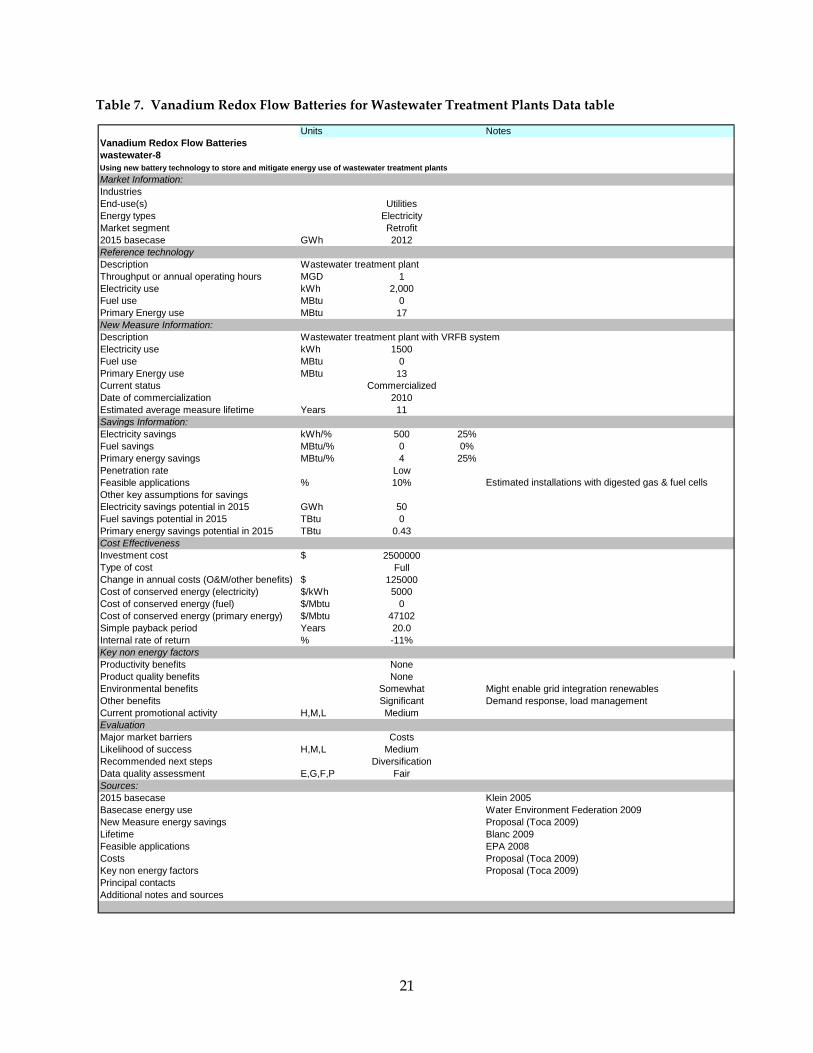
3.5 Vanadium Redox Flow Batteries for wastewater load management One of the challenges encountered when handling fluctuating electric energy sources and/or demands, is to maintain a stable grid which provides sufficient electric energy regardless of weather or unexpected peaks. This issue is especially important with an increasing share of renewable energy supply in a state’s or nation’s total energy supply, as the amount of wind or sunshine will cause larger fluctuations in some climates. An ideal solution would be to store electric energy at the moment supply is significantly larger than demand. However, electricity storage is complex and very difficult to achieve on a large scale (Lee & Gushee, 2008). Batteries have yet to deal with cost, charging time and lifetime issues at this level. Still, there are examples of promising novel battery designs like the vanadium redox flow batteries.
The wastewater treatment industry is one of the areas in which electric energy storage would help making the sector more energy efficient. Wastewater load is not continuous and stable over the day and in the year, but has periods in which treatment is more intensive than at other moments (Park & Bennett, 2010). Limiting the purchase of more expensive electricity at peak moments by energy storage would reduce the costs of a wastewater treatment facility. Also, it might help in the possible implementation of onsite biogas generators as digested sludge gas would now harness energy which could be stored and used later (Appels et al., 2008). The plant’s ability to practice facility load management and demand response opportunities would increase its efficiency and reduce its operating costs. Currently, it is estimated California’s publicly owned wastewater treatment plants use 2012 GWh (Klein et al., 2005) and wastewater treatment can be a large expenditure on a municipality’s budget (Elliott, 2005).
While rechargeable batteries are not suitable for large scale applications so far, they have certainly developed into commercial applications at a household level, for example as rechargeable alkaline batteries or in electronics. The most common rechargeable battery has been the lead-acid battery, which is found in virtually every car. Its costs are low, but lead is highly toxic and charge cycling is limited. Other rechargeable batteries make use of materials like lithium, nickel and sodium. They have varying energy densities, costs, cycle times and efficiencies.
A promise for larger applications is offered by vanadium redox flow batteries (VRBs), which have been developed since the 1980s (Skyllas-Kazacos & Robins, 1988). VRBs have a strongly distinctive operation mode compared to the batteries mentioned above, because vanadium can act both as an anode and a cathode. As the electrolyte is a vanadium-sulphuric acid solution without solids, lifetime is very long (Blanc, 2009). Another advantage is that such a battery system can be monitored in real-time due to the accessibility of the fluid, so the amount of energy which is stored is clearer. The major disadvantage would be the low energy density, which would result in large installations. Also, the costs for implementing these systems are unsure. Some demonstration sites exist, but the technology has yet to reach full commercialization and market breakthrough.
Currently, a new demonstration is planned at the Californian wastewater treatment plant in Pleasanton (Dublin San Ramon Service District) (Toca, 2009). In this plant (molten carbonate) fuel cells have been installed, which would be more effective when an electric energy storage system would be in place. Such a system could be able to reduce purchase from the electricity grid by 25 percent. Especially, since the fuel cells are run on digested sludge biogas this could

20
reduce energy consumption of wastewater treatment facilities by roughly the same number (data table).
There appears to be enough potential in this technology to reduce energy demand, while enabling demand response and load management. The wastewater industry could benefit from this technology. However, a limiting factor is likely to be the amount of wastewater treatment plants to which the technology would be applicable. Not every plant in California currently has an anaerobic digestion system in place which would generate the electric energy onsite. Even fewer plants are likely to have fuel cells in place. Nevertheless, successful demonstration of the Dublin San Ramon project would create a significant incentive for other plants to follow this example of an energy efficient technology.
21
Table 7. Vanadium Redox Flow Batteries for Wastewater Treatment Plants Data table
Units NotesVanadium Redox Flow Batterieswastewater-8Using new battery technology to store and mitigate energy use of wastewater treatment plantsMarket Information:IndustriesEnd-use(s) UtilitiesEnergy types ElectricityMarket segment Retrofit2015 basecase GWh 2012Reference technologyDescription Wastewater treatment plantThroughput or annual operating hours MGD 1Electricity use kWh 2,000Fuel use MBtu 0Primary Energy use MBtu 17New Measure Information:Description Wastewater treatment plant with VRFB systemElectricity use kWh 1500Fuel use MBtu 0Primary Energy use MBtu 13Current status CommercializedDate of commercialization 2010Estimated average measure lifetime Years 11Savings Information:Electricity savings kWh/% 500 25%Fuel savings MBtu/% 0 0%Primary energy savings MBtu/% 4 25%Penetration rate LowFeasible applications % 10% Estimated installations with digested gas & fuel cellsOther key assumptions for savingsElectricity savings potential in 2015 GWh 50Fuel savings potential in 2015 TBtu 0Primary energy savings potential in 2015 TBtu 0.43Cost EffectivenessInvestment cost $ 2500000Type of cost FullChange in annual costs (O&M/other benefits) $ 125000Cost of conserved energy (electricity) $/kWh 5000Cost of conserved energy (fuel) $/Mbtu 0Cost of conserved energy (primary energy) $/Mbtu 47102Simple payback period Years 20.0Internal rate of return % -11%Key non energy factors Productivity benefits NoneProduct quality benefits NoneEnvironmental benefits Somewhat Might enable grid integration renewablesOther benefits Significant Demand response, load managementCurrent promotional activity H,M,L MediumEvaluationMajor market barriers CostsLikelihood of success H,M,L MediumRecommended next steps DiversificationData quality assessment E,G,F,P FairSources:2015 basecase Klein 2005Basecase energy use Water Environment Federation 2009New Measure energy savings Proposal (Toca 2009)Lifetime Blanc 2009Feasible applications EPA 2008Costs Proposal (Toca 2009)Key non energy factors Proposal (Toca 2009)Principal contactsAdditional notes and sources

22
3.6 Solar Thermal Cooling Systems Solar thermal cooling technology is applicable for industrial process cooling (and heating) from renewable resource, i.e., solar energy. Applicable areas include a variety of food processing facilities, wineries, and grocery stores in which significantly improved energy efficiency of yearlong industrial cooling or refrigeration can be realized.
A typical solar thermal cooling system consists of solar heat collector, absorption chiller, hot-water storage tank, cooling tower, pumps, valves, and additional components. Different from a conventional chiller that uses grid-electricity to power the compressor in its refrigerating cycle to produce cooling, a solar thermal cooling system uses solar thermal collectors to produce heat that operates a conventional absorption or adsorption chiller that is thermally driven, and has no mechanically-moving components such as those seen in a traditional vapor compressor that demands high electric power. In addition, a compressor-based chiller typically uses HCFC or CFC refrigerant that is among the causes of depleted ozone and increases of greenhouse gas (GHG) emissions, while absorption chillers typically use ammonia or a salt solution such as lithium bromide (LiBr) solution, which is non-toxic and environmentally friendly. The technology inherits benign energy and environmental impacts when applied in the industries (Henning 2004, CEC 2002).
The absorption chillers are essentially thermally driven that take advantage of solar heat collected to change the solution phases within its cycles, and only require a much-smaller amount of electricity to power liquid-circulation pumps. The water heated by solar collectors is used to initiate a thermal dynamic process involving low-pressure chambers that cools water to around 44 degrees Fahrenheit. The chilled water is then brought to a series of copper pipes that efficiently cool air blown through the pipes and into the space or process. Among a variety of promising solar thermal cooling technologies, LiBr-based chillers present a wide range of applicability and products in terms of their cooling capacity, safety, and services worldwide. Relatively speaking, a LiBr-based cooling system driven by solar thermal energy can provide a workable balance between its promising high-performance, simplicity, and reliability. The decreasing costs of solar panels and increasingly gained experience in their applications have made solar thermal cooling system more affordable and attractive that it was before. Solar thermal cooling technology (i.e., LiBr-based chiller driven by solar thermal heat) has been in fact beyond the “proof-of-concept” stage with a convincing proof of performance at a laboratory or a pilot scale. It has gained more market acceptance in Europe and Japan than in the US. Some recent studies were mainly focused on system design and improvement. In fact, its commercial acceptance has been more benign and widely spread in Europe (e.g., 250+ installations) thanks to efforts within the European Union to combat global warming via reducing greenhouse gas emissions. For example, a number of applications of absorption chillers of various cooling capacity have performed with reliability and safety in buildings or processing. Unfortunately, its market acceptance and applications in California industrial sectors has been at most minimal due to a combination of technical and institutional barriers. Successful demonstrations of applying such systems (e.g., medium-size systems – e.g., absorption chiller with 10-ton or more cooling capacity) in the U.S. in pilot industrial plants (food or beverage) would be highly useful to diffuse the barriers due to lack of information and proof.
Based upon technology reviews and available data, we have concluded that it provides significant energy savings potential (approximately 56%) over conventional compressor-based

23
chillers, while cost of saving was conservatively estimated as $7.9/kWh. The technology would also offer significant environment benefits. Current penetration rate is essentially zero in California but this could change dramatically if programs or policies become supportive to promote its application in California. We estimate that 80% of the market for cooling requirements in food processing would be possible – corresponding to a potential energy savings of 681 GWh per year in California.

24
Table 8. Solar Thermal Cooling Data Table
Units NotesSolar Thermal CoolingET-Cal-JW8Using thermal solar energy as driving heat source for chillingMarket Information:IndustriesEnd-use(s)Energy typesMarket segment2015 basecase use TBtu Reference technologyDescription Conventional electric compression chillerThroughput or annual op. hrs. h 1 yearElectricity use kWh Simulation of chiller in AthensFuel use MBtuPrimary energy use MBtuNew Measure Information:Description Thermal chiller in combination with Advanced flat-plate collector fieldElectricity use kWh Simulation of chiller in AthensFuel use MBtuPrimary Energy use MBtuCurrent statusDate of commercialization Henning 2004Est. avg. measure life Years Henning 2004Savings Information:Electricity savings kWh/% 13814 56%Fuel savings MBtu/% 0.0 0%Primary energy savings MBtu/% 117.4 56%Penetration rateFeasible applications % Author's EstimateOther key assumptionsElec svgs potential in 2015 GWhFuel svgs potential in 2015 TBtu Primary energy svgs potential in 2015 TBtu Cost EffectivenessInvestment cost $ Total investment cost EUR 84209 *1.3 (exchange rate)Type of costChange in other costs $ Assuming elec price of $ 0.12 per kWh + difference in Cost of saved energy (elec) $/kWh annual O&M rate according to table 7.2 Henning 2004Cost of saved energy (fuel) $/MbtuCost of saved energy (primary) $/MbtuSimple payback period YearsInternal rate of return %Key non energy factors Productivity benefitsProduct quality benefitsEnvironmental benefitsOther benefitsCurrent promotional activity H,M,LEvaluationMajor market barriersLikelihood of success H,M,LRecommended next stepsData quality assessment E,G,F,PSources:2015 basecase EIA 2009Basecase energy use Henning 2004New measure energy savings Henning 2004Lifetime Henning 2004Feasible applications Author's EstimateCosts Henning 2004Key non energy factors Kalogirou 2004Principal contactsAdditional notes and sources
FoodProcess cooling
ElectricityNew13.0
876024811
0.0210.9
109970.093.5
Commercial<1990
20
Low80%
6810
5.79
109472
33107.9N/A93233.1-4%
NoneNone
Low ODP/GWP
Large scale deploymentGood
Less toxic/not flammableMedium
Variable energy source (at different locations)Medium

25
3.7 Motor Efficiency Improvement by Magnetically Coupled Adjustable Speed Drives (MC-ASD)
One of the largest shares of industrial electric energy is used for electric motors. These motors drive pumps, fans, compressors and several other (supporting) manufacturing machines. The exact numbers among different countries vary, but can be found in the range from 30 to 70 percent of the total industrial (electric) power of a country (Saidur, 2010). In the United States industrial motor systems account for about 17 percent of the country’s total electricity use (Lowe et al., 2010) and for the process manufacturing the share is as high as 71 percent ([DOE-OIT], 2000). According to the U.S. Energy Information Administration, the West Census Region uses 51.7 TWh for machine drives in its manufacturing sector ([EIA], 2009), of which 40 percent is estimated to be used in California.
Efficiency improvements in electric motor systems have large potential in California’s total industrial sector due to the scale on which these motors are used, even when an improvement might be small. Modern motors do have a high efficiency ranging between 83 and 92 percent or sometimes even higher (Saidur, 2010). Still, energy is lost due to e.g. friction, harmonics and current flow through stators and rotors. Such energy losses are mostly in the form of thermal energy (heat) and can require additional cooling of the motor. Also, losses occur due to load mismatches when the load is much lower than the capacity of the motor.
While energy can be saved by straightforward ways like motor cleaning and switching it off when they are not used, more sophisticated methods have come up in the last decades. One of these approaches is by improving the match between motor operations and its varying load. This is done by using adjustable (also called variable) speed drives, which either continuously change the speed of the motor by varying electric frequencies (variable frequency drives or VFDs) or by relieving the load shaft speed (which can be done with magnetic coupling and varying the air gap). The latter technology has been developed by MagnaDrive (Bellevue, WA) and Coyote Electronics (Fort Worth, TX) (Chvala, Winiarski, & Mulkerin, 2002).
The MC-ASD technology works by varying the air gap between the magnets, which increases or decreases the difference between input and output speed (the slip). If the load decreases, the slip will be increased and the load on the motor will thereby also decrease. The MagnaDrive has been developed since 1999 and been marketed together with the Northwest Energy Efficiency Alliance (NEEA) to push the new technology to the market (Quantec LLC, 2003, 2005). Since that moment few online sources can be found, but the annual report of NEEA has reported 7,000 installations have been installed since commercialization with an estimated total power savings of 7 MW ([NEEA], 2009).
The advantages of the technology would be the energy savings due to decreasing motor load, simple installation and maintenance and the absence of possible harmonics. Still, a problem of the technology has been the total costs (Quantec LLC, 2005). It is therefore that MagnaDrive has focused on explaining the costs and energy savings over the whole lifetime of the technology (‘total cost of ownership’). According to a more recent assessment the technology has comparable installation costs as VFDs, a 100-HP MagnaDrive motor should be installed for $ 20,000 (Tredinnick, 2010). For lower power applications it might be more expensive to buy a MagnaDrive compared to a VFD. In the data table we use the data of the 2002 study performed for the U.S. Department of Energy (Chvala & Winiarski, 2002; Chvala et al., 2002).

26
Other disadvantages might be that the efficiency drops at lower speeds and industrial market penetration is still limited (Tredinnick, 2010). The MC-ASD technology has often been compared to VFDs and might be less favorable in several markets (Chvala et al., 2002). An argument against MC-ASD is that it still requires the motor to run at full speed, which diminishes potential energy savings ([Anon], 2007). However, the technology is successful implemented in the U.S. Navy and several wastewater treatment plants as they appear to be very suitable to larger pump and fan applications (Tredinnick, 2010).
Magnetic Coupling – Adjustable Speed Drives do have significant potential for reducing Californian energy consumption in less efficient motors as long as it is noted that they do not provide a silver bullet for all motor applications. The technology has developed into maturity over the last decade and appears to have undergone continuous growth, although market penetration might be lower than expected earlier (Quantec LLC, 2005). Nevertheless, it is a useful addition to possible energy efficiency gains in electric motors.

27
Table 9. Magnetically Coupled Adjustable Speed Drives Data table
Units NotesMagnaDrive - Adjustable Speed DriveOther-1Reduces energetic load by adjusting the speed of the load shaft without physical contactMarket Information:IndustriesEnd-use(s)Energy typesMarket segment2015 basecase GWh 40 percent of West Census Region Machine DriveReference technologyDescriptionThroughput or annual operating hours hours 10% off-time in a yearElectricity use kWhFuel use MBtu Primary Energy use MBtu Chvala 2002New Measure Information:DescriptionElectricity use kWhFuel use MBtu Primary Energy use MBtu Current statusDate of commercialization Quantec 2005Estimated average measure lifetime Years Tredinnick 2010Savings Information:Electricity savings kWh/% 43,000 39%Fuel savings TBtu/% 0.00 0%Primary energy savings TBtu/% 367 39%Penetration rateFeasible applications % LimitedOther key assumptions for savingsElectricity savings potential in 2015 GWhFuel savings potential in 2015 TBtu Primary energy savings potential in 2015 TBtu Cost EffectivenessInvestment cost $Type of costChange in annual costs (O&M/other benefits) $ Electricity price $ 0.12 per kWhCost of conserved energy (electricity) $/kWhCost of conserved energy (fuel) $/MbtuCost of conserved energy (primary energy) $/MbtuSimple payback period YearsInternal rate of return %Key non energy factors Productivity benefitsProduct quality benefitsEnvironmental benefitsOther benefits Avoids harmonics and mechanical wearCurrent promotional activity H,M,LEvaluationMajor market barriersLikelihood of success H,M,LRecommended next stepsData quality assessment E,G,F,PSources:2015 basecase EIA 2009Basecase energy use Chvala 2002New Measure energy savings Chvala 2002Lifetime Tredinnick 2010Feasible applications Quantec 2005Costs Tredinnick 2010Key non energy factors Tredinnick 2010Principal contactsAdditional notes and sources
CrosscuttingMotor and Drives
ElectricityReplace on failure
20680
100 horsepower regular motor7884
109,0000.00930
100 horsepower motor with MagnaDrive ASD66,0000.00563
Commercialized200325
Low10%
8160
7.0
20000Full
5160N/AN/A153.9
22%
NoneNoneNone
SignificantLow
CostsLow
Cost reductionGood

28
3.8 Power Factor Correction Controllers for More Efficient Electricity Grids
Because energy efficiency has become important in U.S. policy to improve its national energy security and cut on dependence from foreign fossil sources, large steps have been undertaken in optimizing energy use in appliances. However, the quality of electric power has been pursued to a small extent only. Many electric appliances use more power (volt amperes) than would be expected by just looking at the (real) power (watts) demand. This is a result from the sinusoidal wave character of AC Input to the appliances and also the nature of the load (capacitive or inductive). This can result in current waveform leading or lagging the voltage waveform. Therefore, one needs to distinguish between apparent or total power (in Volt Amperes), reactive power (in vars; reactive Volt Amperes) and the real power (in Watts). The ratio between the real and the apparent power is called the power factor and will only be optimal (i.e. has a value of 1) when there is no reactive power (and hence full overlap (in phase) for the AC Input voltage and current waveforms). This unity power factor holds good when the electric circuits contain only resistive elements and no inductive elements (Fairchild Semiconductor, 2004).
While low power factors do not influence the device itself, they do result in higher currents in the local distribution wirings and hence the total grid. This results in larger than required capacities for the generating stations because of increased energy losses in transmission lines. Up to a certain level transmission losses are unavoidable, but improved power factors could reduce the total energy requirement. In California about 20,000 GWh are lost in electricity transmission, which is close to 7 percent of the total in state electricity use ([EIA], 2010). For this reason, companies like Marvell Semiconductor have been urging policy makers to implement power factor correction controllers (PFCs) in electronic appliances as this will lead to significant energy generation savings (Sutardja, 2009). In addition lower power factors pollute the grid with harmonic currents which could affect sensitive appliances connected to the grid. Indeed, Europe has required harmonics reduction and power factor correction for larger electric appliances (over 75W) in an agency regulation from 2001 (Keyser, 2009).
Nevertheless, solid data on potential energy savings is hard to find in scientific journals, as well as in online sources. One argument for this lack of data is the misconception that actual savings might be very low as the U.S. National Institute of Standards and Technology has put forward (Misakian, Nelson, & Feero, 2009). This could be especially true for residential consumers where there is no real benefit, because they are only billed for real power (in Watts) by electricity companies and will not see a difference in their energy costs for that reason. For industrial and some commercial consumers it can be somewhat different, because these users are better targeted by electric utility companies. Many utilities have a certain penalty charge for bad power factors and hence these customers will have an incentive to improve their total power factor. The electronics company of Intel has included power factor considerations in one of their recent Energy Star whitebooks (Intel, 2009).
An example with real data on energy savings is found in a study funded by the New York State Energy Research and Development Authority (NYSERDA) where PFCs were implemented at a manufacturing plant. This led to a decrease in real power demand of some 2 percent (from 500 W to 490 W) (Ellenbogen, 2010).

29
This potential saving could be applied to the total transmission losses in California. But this is a very limited application because there are few incentives currently in place to apply PFCs at a larger scale than ten percent market penetration.
There are other reasons for implementing PFCs. For one, it stabilizes the power grid, which will result in less maintenance and less risk in cable failure (which happened in the New York neighborhood of Queens in 2006 for example). It might also be a necessity for future development of smart grids and distributed generation facilities (Ellenbogen, 2009). Renewable energy sources like wind and solar power, as well as LED lamps, appear to have lower power factors which need to be taken into account when implementing at a large scale (Eltawil & Zhao, 2010; Siano, Chen, Chen, & Piccolo, 2010).
In general, power factor corrections have not been understood correctly. A significant reason for this is the large confusion on what power factor correction controllers can and cannot actually achieve. PFCs decrease reactive and apparent power, which decreases the current in the grid. This does lead to diminished transmission power losses, but does not directly lead to load power reductions for (residential) end users. Still, there are good arguments to promote them, but these arguments apply largely to utilities and grid owners. Energy (and cost) savings might be found in commercial and industrial end users, but this will be dependent on the type of loads and the utility contracts. Therefore, the outlook for rapid adoption of PFCs remains mixed, until convincing energy generation savings are understood and incentives are provided for better power factor by the utility Companies and the Government. For example, improving the power factor from 0.7 to 0.98 would technically decrease transmission loss by 29%. Given that there is approximately 7% transmission loss in the U.S. annually, a 50% reduction of transmission loss due to PFCs implementation would result in savings equivalent to 2% of total transmission loss per year. In the case of California, in 2008, the total transmission loss was 20,000 GWh. If PFCs were implemented, savings from reduced transmission loss would be 400 GWh in 2008.

30
Table 10. Power Factor Correction Controller implementation Data Table
Units NotesPower Factor CorrectionET-Cal-JW7Improves the power factor in electric aplliances to near unity, reducing distribution losses
Market Information:IndustriesEnd-use(s)Energy typesMarket segment2015 basecase GWh CA grid transmission losses of 2008Reference technologyDescriptionThroughput or annual operating hours hours 10% off-time in a yearElectricity use MWhFuel use MBtu Primary Energy use MBtu New Measure Information:DescriptionElectricity use MWhFuel use MBtu Primary Energy use MBtu Current statusDate of commercializationEstimated average measure lifetime Years
Savings Information:Elec Savings MWh/% 79 2%Fuel savings MBtu/% 0.00 0%Primary energy savings MBtu/% 673 2%Penetration rate
Feasible applications %Currently limited due to lack of incentives
Other key assumptions for savingsCA Electricity savings potential in 2015 GWhFuel savings potential in 2015 TBtu Primary energy savings potential in 2015 TBtu Cost EffectivenessInvestment cost $Type of costChange in annual costs (O&M/other benefits$Cost of conserved energy (electricity) $/kWhCost of conserved energy (fuel) $/MbtuCost of conserved energy (primary energy) $/MbtuSimple payback period YearsInternal rate of return %Key non energy factors Productivity benefits Fewer failuresProduct quality benefits Less over-heatingEnvironmental benefitsOther benefits Enables smart grid, LEDsCurrent promotional activity H,M,LEvaluationMajor market barriers E.g. from Energy Star / NISTLikelihood of success H,M,LRecommended next stepsData quality assessment E,G,F,PSources:2015 basecase EIA 2010Basecase energy use Ellenbogen 2010New Measure energy savings Ellenbogen 2010Lifetime Author's EstimateFeasible applications Author's EstimateCosts Ellenbogen 2010Key non energy factors Ellenbogen 2009Principal contactsAdditional notes and sources
78843,942
CrosscuttingUtilities
ElectricityRetrofit20000
500 kW manufacturing plant
3.4
20000
0.0033625
500 kW manufacturing plant with Power Factor Correction installed3,8630.00
32953Commercialized
Unknown20
high
100%
4000
Show significant energy savingsGood
Full86003.05N/A0.362.3
42%
compellingSignificant
NoneSignificant
Low
Little policy supportHigh if policy in place
31
3.9 Super Boiler Steam generation is one of the largest energy consuming processes in the U.S. industry. It accounted for 2871 TBtu (3043 PJ) of reported industrial end use by regular fuel consumption (oil, gas, coal) in 2006 ([EIA], 2009), about 30 percent of the reported total. However, these numbers underestimate the actual consumption due to the use of non-regular fuels for steam generation. Therefore, the (industrial) boiler inventory of 2005 (Energy and Environmental Analysis, 2005) estimates industrial boiler energy consumption at 6500 TBtu (6890 PJ), which is 37 percent of the total energy consumption. Efficiency improvements in this area could lead to large energy savings.
Typical efficiencies of new industrial boilers range between 70 and 85 percent with regular fuels ([CIBO], 2003). In 2000 the U.S. Department of Energy initiated a new program to increase energy efficiency in steam generating systems. An important outcome of this program was the development of a ‘Super Boiler’ by the Gas Technology Institute and Cleaver-Brooks, which achieved fuel to steam efficiencies of 93-94 percent ([DOE-ITP], 2008). As industrial boilers lose most energy in the flue gas stack, their approach to increase boiler efficiency focused on the flue gas (Wang et al., 2008).
Two key technologies were developed to reduce flue gas temperature, volume and moisture content: a premixed staged combustion process and a transport membrane-based heat recovery system (Wang et al., 2008). The staged combustion process made use of a GTI-patented forced internal recirculation (FIR) burner, which decreases NOx emissions while slightly increasing efficiency. However, the main efficiency gain lay in the heat recovery system. By use of a ceramic membrane both the sensible heat and the latent heat contained in the water vapor is captured. Especially capturing the latent heat has proved to be difficult, but this type of membrane overcame this problem by its capillary effect.
Demonstration of the technology was first performed on a small scale with two 80 boiler horsepower (0.78 MW) firetube boilers. 94 percent fuel efficiency was demonstrated with an output of up to 4 MBtu per hour ([DOE-ITP], 2008). Boiler pilots of 200-300 boiler horsepower (1.96 – 2.94 MW) were installed at three locations: Specification Rubber Products Inc. (Alabaster, AL), Clement Pappas & Co (Ontario, CA) and Third Dimension Inc. (West Jordan, UT). While the first pilot in Alabama with a single stage combustion proved to be successful (Wang et al., 2008) and is running continuously since 2006 according to the company’s website, online reports on the other locations (which would use two stage combustion) are scarce.
In October 2009 the Gas Technology Institute announced that they had licensed the Transport Membrane Condenser technology to Cannon Boilers Works ([GTI], 2009). Expectations are that the technology will be commercially available by the end of 2010 under the name Ultramizer and can be installed on new and existing industrial boilers at that time (Parkinson, 2010). Most recently, the first commercial design unit has been installed at the City Brewing plant in Latrobe, PA. 200 to 400 boiler horsepower units will be commercialized first, with larger units (400 to 800 HP) following in 2011 (Cannon Boiler Works, 2010).
In the data table we use the same energy consumption by industrial boilers as in 2005: 6500 TBtu (Energy and Environmental Analysis, 2005). Assuming an average efficiency increase from 75 to 90 percent the technology could have a fuel savings potential of over 1000 TBtu when fully

32
applied. Its expected payback period is 5.5 years due to the fuel saved over an expected lifetime of 30 years ([IEA ETSAP], 2010).
However, some limitations still exist. The initial design was too complex and cumbersome. Also, industrial markets would like to have fuel flexibility, which was not present (Connor, 2007). Nevertheless, a large potential for this energy efficient technology remains and the future introduction of the Transport Membrane Condenser to the market will be an important step in its implementation in industry.
For California this technology might also be very worthwhile, as its potential savings are large. Assuming California’s industrial energy consumption consists for 25 percent out of industrial boilers and 17 percent savings by super boilers, it could save about 80 TBtu.

33
Table 11. Super boiler Data table
Units NotesSuper Boiler
Advanced flue gas heat recovery system of boilersMarket Information:IndustriesEnd-use(s)Energy typesMarket segment2015 basecase use TBtu EEA 2005Reference technologyDescription Regular industrial boiler (75% eff) EEA 2005Throughput or annual op. hrs. hElectricity use kWhFuel use MBtu IEA ETSAP 2010Primary energy use MBtu IEA ETSAP 2010New Measure Information:Description Super boiler with TMC (90% eff) Parkinson 2010Electricity use kWhFuel use MBtuPrimary Energy use MBtuCurrent status Cannon Works 2010Date of commercialization Cannon Works 2010Est. avg. measure life Years IEA ETSAP 2010Savings Information:Electricity savings kWh/% 0 0%Fuel savings MBtu/% 1.9 17%Primary energy savings MBtu/% 1.9 17%Penetration rateFeasible applications % Author's estimateOther key assumptionsElec svgs potential in 2015 GWhFuel svgs potential in 2015 Tbtu Primary energy svgs potential in 2015 Tbtu Cost EffectivenessInvestment cost $ IEA ETSAP 2010Type of costChange in other costs $ IEA ETSAP 2010Cost of saved energy (elec) $/kWhCost of saved energy (fuel) $/MbtuCost of saved energy (primary) $/MbtuSimple payback period YearsInternal rate of return %Key non energy factors Productivity benefitsProduct quality benefitsEnvironmental benefits Lower NOx emissions, reduced water useOther benefits Boiler size reductionCurrent promotional activity H,M,LEvaluationMajor market barriersLikelihood of success H,M,LRecommended next stepsData quality assessment E,G,F,PSources:2015 basecase EEA 2005Basecase energy use IEA ETSAP 2010New measure energy savings Parkinson 2010Lifetime IEA ETSAP 2010Feasible applications Author's estimateCosts IEA ETSAP 2010Key non energy factors Principal contactsAdditional notes and sources
6500.0
Significant
Competition economizers, fuel flexibility, complex design
CrosscuttingProcess heatingFuels, electricity
New, retrofit
10
11.5
30
11.5
09.69.6
Pre-Commercial2010
10831083
60000
Low100%
0
5.517%
-10880-1741.99-1741.99-1741.99
None
SomeLow
MediumSuccesful commercialization
Fair

34
3.10 CO2 as a refrigerant Cooling and refrigeration processes account for 1-2 percent of primary energy use in U.S. industry of which about a third is used in food industry ([EIA], 2009). Since the main synthetic refrigerants (CFCs, HCFCs) are currently being phased out of use due to their ozone-depletion and global warming potential, interest in natural refrigerants like ammonia (NH3) and carbon dioxide (CO2) has increased significantly in the last two decades. Of these two, carbon dioxide is more easily available, is not flammable or toxic and has a higher volumetric capacity ([IIR], 2000). At lower temperatures it also has excellent energy efficiency characteristics.
Carbon dioxide has a long history as a refrigerant, dating back to the 19th century. In those days it was mostly used on ships, in theaters and in shops ([ASHRAE], 2009). Later, it fell out of favor because of the introduction of halocarbons. However, in the 1990s it attracted renewed attention due to the work by Lorentzen (Lorentzen, 1995). Since that moment some experts regard carbon dioxide as ‘the natural refrigerant of the future’ (Tillner-Rueth, 2009).
Carbon dioxide can be used as a regular refrigerant in mechanical vapor recompression systems, but there is an important caveat to its use. Carbon dioxide has a critical temperature of 88 degree F (31oC) at standard pressure, complicating its use at higher temperatures. Another complication is that subcritical CO2 gas condensates at higher pressures compared to normal refrigeration systems. These issues result in more complex and expensive systems. There are two large classes of CO2 refrigerators which work successfully with these conditions: trans-critical systems and cascade systems (which also use ammonia). Trans-critical systems resemble classic single stage refrigerators, but deliver their heat in supercritical conditions and as a consequence there is no condensation. Partial condensation only takes places at the expansion valve (Danfoss, 2008). Supercritical pressures in this system vary between 50 and 120 bars and are mostly installed in small units due to CO2’s large volumetric capacity (Reulens, 2009). Nevertheless, components for larger (industrial) units are scarce.
The other option is CO2/NH3 cascade refrigerators, which combine the good thermodynamic properties of carbon dioxide at low temperatures and these of ammonia at higher temperatures. In a cascade system there are two refrigeration cycles linked via a cascade heat exchanger and this allows carbon dioxide to be kept at subcritical conditions. This system is more complicated than trans-critical systems, but here regular components can be used. Also, it is more suited for larger systems (Reulens, 2009). In the data table we use the theoretical energy consumption in a moderate climate of such a cascade system with that of a HFC system for comparison (Sawalha, 2008).
However, the extent of energy savings and efficiency with CO2 systems remain unclear due to a lack of high quality data applicable to general refrigerator systems. Carbon dioxide seems excellent for low temperature applications, but would perform moderately at higher temperatures where refrigeration is perhaps more needed. Also, the costs of average CO2 systems are unknown. The scarce materials for high pressure construction might make capital costs higher than alternatives. Nevertheless, CO2 refrigerators are being installed in supermarkets and at industries in significant numbers (e.g. by Star Refrigeration).
Refrigeration is a crosscutting process which is found in industrial, commercial and residential applications. For the data table we kept the assessment to the U.S. food industry, where refrigeration is used widely to keep food from decay. In this field there is also a less

35
conventional commercial method which can use CO2 as refrigerant: cryogenic freezing. By dropping liquid carbon dioxide on a food item, it may freeze rapidly and efficiently (Lang, 2006). Its advantages would be low costs and higher productivity, but it unsure how it affects food quality (Lan & Farid, 2004). Also, cryogenic freezing can be done with liquid nitrogen which is even cheaper and more abundant than carbon dioxide. While the technology has gained some interest in scientific literature in the last decade, it does not appear to be largely applied.
Taken all together, there is a definite potential for carbon dioxide in refrigerating uses. However, at the moment both costs and energy efficiency are too uncertain to make a solid assessment of its future. Still, the number of companies investing in carbon dioxide refrigerants is large and continues to grow (Maté & Papathanasopoulos, 2010). In food industry there appears to be a slower adaptation, which is explained due to the lack of trained engineers and the larger capital cost of a completely new system (Watson, 2010). Success of CO2 refrigeration will depend on increased knowledge and further demonstration of cost- and energy-efficient installations.
California has a large food processing industry, which uses about 4,500 GWh of electricity annually (Coito, Worrell, Friedmann, & Rufo, 2005). Assuming the share of cooling and refrigeration in this consumption is comparable to the national average in the food industry, California uses close to 300 GWh of electricity for this purpose annually. Significant energy efficiency gains which could be achieved by carbon dioxide refrigeration, could therefore lead to reducing electricity use. In December 2009 the California Air Resources Board acknowledged the first state regulations regarding halocarbon refrigerant use with an exemption for natural refrigerants like CO2 ([CARB], 2009). This could lead to further implementation of carbon dioxide refrigeration, although the barriers from the previous paragraph still hold.

36
Table 12. CO2 refrigeration Data table
3.11 Submerged Combustion Melting As one of the oldest industries in the world, the glass industry produces a substantial number of diverse glass products, such as flat glasses, container glasses, pressed/blown glasses and glass
Units NotesCO2 as a refrigerant
The use of carbon dioxide for refrigeration purposesMarket Information:IndustriesEnd-use(s)Energy typesMarket segment2015 basecase use TBtu Reference technologyDescription R404A supermarket refrigeration system (theoretical, Sawalha 2008)Throughput or annual op. hrs. hElectricity use kWhFuel use MBtuPrimary energy use MBtuNew Measure Information:Description CO2/NH3 supermarket cascade system (theoretical, Sawalha 2008)Electricity use kWhFuel use MBtuPrimary Energy use MBtuCurrent statusDate of commercialization Lorentzen 1995Est. avg. measure life Years Author's EstimateSavings Information:Electricity savings kWh/% 2236 9%Fuel savings MBtu/% 0.0 0%Primary energy savings MBtu/% 19.0 9%Penetration rateFeasible applications % Author's EstimateOther key assumptionsElec svgs potential in 2015 GWhFuel svgs potential in 2015 TBtu Primary energy svgs potential in 2015 TBtu Cost EffectivenessInvestment cost $Type of costChange in other costs $Cost of saved energy (elec) $/kWhCost of saved energy (fuel) $/MbtuCost of saved energy (primary) $/MbtuSimple payback period YearsInternal rate of return %Key non energy factors Productivity benefitsProduct quality benefitsEnvironmental benefitsOther benefitsCurrent promotional activity H,M,LEvaluationMajor market barriersLikelihood of success H,M,LRecommended next stepsData quality assessment E,G,F,PSources:2015 basecase EIA 2009Basecase energy use Sawalha 2008New measure energy savings Sawalha 2008Lifetime Author's EstimateFeasible applications Author's EstimateCosts N/AKey non energy factors Reulens 2009Principal contactsAdditional notes and sources
Poor
Less toxic/not flammableHigh
Competition NH3, larger investment costsMedium
Extending CO2 freezing knowledge
N/A
NoneNone
Low ODP/GWP
N/AN/AN/AN/A
6.45
N/A
N/A
100%
7590
Commercial<1995
20
Low
206.2
220270.0
187.2
70.0
124263
0.0
FoodProcess cooling
ElectricityNew

37
wool. In the U.S. about 20 million short tons (18 Mt) of glass products are manufactured annually, which corresponds to a fifth of global glass production ([GMIC], 2004). It is an energy-intensive industry with an estimated annual primary energy use of 281 TBtu (298 PJ) in the U.S. ([EIA], 2009).
The largest energy consumer in glass production is the melting process, which is performed with the same basic equipment as a century ago ([DOE-ITP], 2006). Since the 1990s there is major interest in finding a new melting technology because of the need to reduce energy consumption and decrease the capital intensity of the industry. Also, more stringent environmental regulations might increase the need for new melting processes ([GMIC], 2004).
The regular melting process uses a continuously operated tank furnace fed by the batch mixture. Most furnaces are heated by natural gas, but they might be aided by electrical heating which increases melting speeds. Due to NOx formation in a normal combustion atmosphere, there is an increase in using oxy-fuel burning conditions. Energy consumption depends on the mixture and type of product but averages 6.5 MBtu per short ton (7.6 GJ/t) ([GMIC], 2004; Worrell, Galitsky, Masanet, & Graus, 2008).
An interesting new melting technology was developed in the 1960s and 1970s in the former Soviet Union and made use of submerged combustion to melt the batch, increase heat transfer and improve mixing properties. In this technique combustion takes place underneath the tank and the resulting hot flue gasses are bubbled through the molten liquid. The advantages of submerged combustion melting (SCM) are higher thermal efficiency, product quality and productivity, as well as a reduction in NOx emissions and capital costs (Greenman, 2008). Currently, a couple of SCM plants are in operation for glass melting purposes in Ukraine and Belarus ([GMIC], 2004).
In 2003, a U.S. consortium with five large glass companies, glass suppliers and the Gas Technology Institute started a project on this technology to see if could be developed commercially for the U.S. glass industry ([DOE-ITP], 2006). A SCM pilot was successfully presented throughout 2005 and 2006 (Rue, 2005), but demonstration on a larger scale has been slow. The first commercial plant to use the SCM technology is an abrasive manufacturer in La Porte, IN (Indiana Melting & Manufacturing). However, the continuous operation of the plant has been delayed for long periods. Only after Steel Dynamics acquired 90 percent of the company, it now appears the plant will be running in 2010 (Fritz, 2010).
The major barrier which needs to be overcome is likely to be investment costs. While the Gas Technology Institute estimated capital costs to be 80 percent lower than regular melting technologies, it is still a significant amount. Actual SCM installation costs are unknown; in the data table we assume capital cost to be 80 percent lower than rebuilding a regular melting system (which is $ 10 million) ([GMIC], 2004). By using 23 percent savings on the energy bill for a 300 t/day plant, the payback period would be close to four years. Other barriers which have been encountered during the pilot are quality issues (bubbles) and a residence time which was too short because of the design (Beerkens, Schaeffer, & Speith, 2008). Therefore, the potential for this technology appears to be significant but it needs to resolve these of issues and demonstrate stable, high quality glass production.
California has twelve glass production plants out of 149 nationwide (Worrell et al., 2008). Implementing this technology in these plants might reduce primary in-state energy

38
consumption up to 3 TBtu, assuming these plants produce about ten percent of total U.S. production.
Table 13. Submerged combustion melting Data table
Units NotesSubmerged Combustion Melting
Using submerged combustion for more energy efficient glass batch meltingMarket Information:IndustriesEnd-use(s)Energy typesMarket segment2015 basecase use tons GMIC 2004Reference technologyDescription Traditional meltingThroughput or annual op. hrs. tonsElectricity use kWhFuel use MBtuPrimary energy use MBtu Worrel 2008New Measure Information:Description Submerged Combustion MeltingElectricity use kWhFuel use MBtuPrimary Energy use MBtu DOE-ITP 2006Current statusDate of commercializationEst. avg. measure life Years Author's EstimateSavings Information:Electricity savings kWh/% 0 0%Fuel savings MBtu/% 0.0 0%Primary energy savings MBtu/% 1.5 23% DOE-ITP 2006Penetration rate Greenman 2008Feasible applications % GMIC 2004Other key assumptionsElec svgs potential in 2015 GWhFuel svgs potential in 2015 Tbtu Primary energy svgs potential in 2015 Tbtu Cost EffectivenessInvestment cost $ Author's EstimateType of costChange in other costs $ GMIC 2004, Author's EstimateCost of saved energy (elec) $/kWhCost of saved energy (fuel) $/MbtuCost of saved energy (primary) $/MbtuSimple payback period YearsInternal rate of return %Key non energy factors Productivity benefitsProduct quality benefitsEnvironmental benefitsOther benefitsCurrent promotional activity H,M,LEvaluationMajor market barriersLikelihood of success H,M,LRecommended next stepsData quality assessment E,G,F,PSources:2015 basecase GMIC 2004Basecase energy use Worrel 2008New measure energy savings DOE-ITP 2006Lifetime Author's EstimateFeasible applications GMIC 2004Costs GMIC 2004, Author's EstimateKey non energy factors Greenman 2008Principal contactsAdditional notes and sources
GlassOther
Natural gas, ElectricityReplace on failure
20,000,000
1
6.5
5.01st commercial plant startup
201020
Low90%
27
2,000,000Full
-547500
-227977.063.7
27%
Reduced NOx emissionsLess defects due to better mixingLower capital / surface for same production
Fair
Easy start / stop operationLow
MediumDemonstration with regular glass products
Investment costs

39
REFERENCES
[Anon]. (2007). MagnaDrive Adjustable Speed Drive (ASD). Retrieved 17 November, 2010, from http://www.eng-tips.com/viewthread.cfm?qid=187627
[ASHRAE], American Society of Heating, Refrigeration and Air-Conditioning Engineers. (2009). ASHRAE Position Document on Natural Refrigerants. Atlanta, GA: American Society of Heating, Refrigerating and Air-Conditioning Engineers.
[CARB], California Air Resources Board. (2009). California takes another step to reducing GHG emissions.
[CDFA], California Department of Food and Agriculture. (2010). California Agricultural Production Statistics 2008. Sacramento, CA: California Department of Food and Agriculture.
[CEC]. California Energy Commission. Report 500-02-047F. Design and Optimization of Solar Absorption Chillers. MARCH 2002.
[CIBO], Council of Industrial Boiler Owners. (2003, March). Energy Efficiency & Industrial Boiler Efficiency: An Industry Perspective.
[DOE-ITP], U.S. Department of Energy Industrial Technologies Program. (2006). Energy-Efficient Glass Melting - Next Generation Melter. Washington, DC: U.S. Department of Energy.
[DOE-ITP], U.S. Department of Energy Industrial Technologies Program. (2008). Combustion Success Story: First Super Boiler Demonstration. Washington, DC: U.S. Department of Energy.
[DOE-OIT], U.S. Department of Energy, Office of Industrial Technologies. (2000). United States Industrial Electric Motor Systems Market Opportunities Assessment. Burlington, MA: Xenergy.
[EIA], U.S. Energy Information Administration. (2009). 2006 Manufacturing Energy Consumption Survey. Washington, DC: U.S. Energy Information Administration.
[EIA], U.S. Energy Information Administration. (2010). California Electricity Profile - Table 10. In sept10ca.xls (Ed.), State Electricity Profiles. Washington, DC.
[EIA], U.S. Energy Information Administration. (2010a). Retail Electricity Sales in California Industrial Sector in 2010, http://www.eia.gov/cneaf/electricity/page/sales_revenue.xls, accessed March 2011.
[EPA], U.S. Environmental Protection Agency. (2008). Clean Watershed Needs Survey: U.S. Environmental Protection Agency.
[EPA], United States Environmental Protection Agency. (1983). Design Manual: Municipal Wastewater Stabilization Ponds (No. 625/1-83-015). Washington, DC: United States Environmental Protection Agency.

40
[EPA], United States Environmental Protection Agency. (2004). Primer for Municipal Wastewater Treatment Systems (No. 832-R-04-001). Washington, DC: United States Environmental Protection Agency.
[GMIC], Glass Manufacturing Industry Council. (2004). Glass Melting Technology: A Technical and Economic Assessment (No. DE-FC36-02D14315). Westerville, OH: Glass Manufacturing Industry Council.
[GTI], Gas Technology Institute. (2009, October 6th). GTI Signs Licensing Agreement for Transport Membrane Condenser with Cannon Boiler Works. Retrieved August 25th, 2010, from http://www.gastechnology.org/webroot/app/xn/xd.aspx?it=enweb&xd=6NewsRoom/2009/cannonboiler_NR_10-06-2009.xml
[IEA ETSAP], International Energy Agency - Energy Technology Systems Analysis Programme. (2010). Industrial Combustion Boilers (No. Technology Brief I01). Paris, France: International Energy Agency.
[IIR], International Institut of Refrigeration. (2000). 15th Informatory Note on Refrigerants: Carbon Dioxide as a Refrigerant. Paris, France: International Institut of Refrigeration.
[NEEA], Northwest Energy Efficiency Alliance. (2009). 2009 Annual Report. Portland, OR: Northwest Energy Efficiency Alliance.
Angenent, L. T., Karim, K., Al-Dahhan, M. H., & Domiguez-Espinosa, R. (2004). Production of bioenergy and biochemicals from industrial and agricultural wastewater. Trends in Biotechnology, 22(9), 477-485.
Appelbaum, B. (2002). Water and Sustainability: U.S. Electricity Consumption for Water Supply & Treatment - The Next Half Century (No. 1006787). Palo Alto, CA: Electric Power Research Institute (EPRI).
Appels, L., Baeyens, J., Degreve, J., & Dewil, R. (2008). Principles and potential of the anaerobic digestion of waste-activated sludge. Progress in Energy and Combustion Science, 34(6), 755-781.
Beerkens, R., Schaeffer, H., & Speith, S. (2008). Conclusions of the expert meeting on “Innovative Glass Melting Technology in the Year 2020”, Innovative Melting of Glass. Brig, Switzerland.
Biswas, P. (2009). Advanced Water Treatment Technologies for Onsite Water Reuse. In Emerging Technologies Demonstration Grant Program (Ed.): California Energy Commission.
Blanc, C. (2009). Modeling of a Vanadium Redox Flow Battery Electricity Storage System. Ecole Polytechnique Fédérale de Lausanne, Lausanne, Switzerland.
Braaksma, A. (2010). G-gas: from Groningen gas to Green gas? An assessment of the Dutch green gas potential and its delivery to the natural gas system based on Groningen gas quality. University of Groningen, Groningen, Netherlands.
Cannon Boiler Works. (2010, 10 August). Ultramizer: Ultimate Heat Recovery System.

41
Chvala, W. D., & Winiarski, D. W. (2002). Technology Demonstration: Magnetically-Coupled Adjustable Speed Drive Systems. Paper presented at the Association of Energy Engineers (AEE), World Energy Engineering Congress (WEEC).
Chvala, W. D., Winiarski, D. W., & Mulkerin, M. C. (2002). New Technology Demonstration Program: Technology Demonstration of Magnetically-Coupled Adjustable Speed Drive Systems (No. PNNL-13879). Richland, WA: Pacific Northwest National Laboratory.
Coito, F., Worrell, E., Friedmann, R., & Rufo, M. (2005). California Industrial Energy Efficiency Potential (No. LBNL-59956). Berkeley, CA: Lawrence Berkeley National Laboratory.
Connor, S. (2007, August). Optimizing Steam Generation: A Call to Conserve Finite Resources and Reduce Valuable Space. Cleaver Brooks.
Danfoss. (2008). Transcritical Refrigeration Systems with Carbon Dioxide (CO2): How to design and operate a small-capacity (< 10 kW) transcritical CO2 system.
de la Rue du Can et al et al. 2010. California Energy Balance Update and Decomposition Analysis for the Industry and Building Sectors. LBNL Report to CEC.
Ellenbogen, R. (2009). Power Quality: How It Affects All of Us and How to Improve It. New Rochelle, NY: Power Factor Correction.
Ellenbogen, R. (2010). At Load Power Factor Correction: Pilot Project to determine the feasibility and economics of small scale “At Load” Power Factor Correction. New Rochelle, NY: Power Factor Correction.
Elliott, R. N. (2005). Roadmap to Energy in the Water and Wastewater Industry (No. IE054). Washington, DC: American Council for an Energy-Efficient Economy.
Eltawil, M. A., & Zhao, Z. M. (2010). Grid-connected photovoltaic power systems: Technical and potential problems-A review. Renewable & Sustainable Energy Reviews, 14(1), 112-129.
Energy and Environmental Analysis, Inc. (2005). Characterization of the U.S. Industrial Commercial Boiler Population.
Fairchild Semiconductor. (2004). Power Factor Correction (PFC) Basics (No. Application Note 42047). San Jose, CA: Fairchild Semiconductor.
Fritz, M. (2010). Indiana Melting near full operations; production of new material in works. The News Dispatch.
Gleick, P. H., Haasz, D., Henges-Jeck, C., Srinivasan, V., Wolff, G., Cushing, K. K., et al. (2003). Waste Not, Want Not: The Potential for Urban Water Conservation in California. Oakland, CA: Pacific Institute.
Gratzel, M. (2001). Photoelectrochemical cells. Nature, 414(6861), 338-344.
Greenman, M. (2008, 13 November). Innovation in the Glass Industry. Paper presented at the 19° Encontro Técnico da Abividro, São Paulo, Brazil.
Henning, Hans-Marin. 2004. Solar-assisted Air-Conditioning in Buildings. Springer Wien New York.

42
Hirneisen, K. A., Black, E. P., Cascarino, J. L., Fino, V. R., Hoover, D. G., & Kniel, K. E. (2010). Viral Inactivation in Foods: A Review of Traditional and Novel Food-Processing Technologies. Comprehensive Reviews in Food Science and Food Safety, 9(1), 3-20.
Intel. (2009). ENERGY STAR* Version 5.0 System Implementation: Whitepaper (No. 321556-001). Santa Clara, CA: Intel.
Keyser, G. E. (2009). Power Conservation, Improved Control, and Equipment Protection with Drive Output Synchronized Closed Transition.
Klein, G., Krebs, M., Hall, V., O'Brien, T., & Blevins, B. B. (2005). California's Water – Energy Relationship (No. CEC-700-2005-011-SF). Sacramento, CA: California Energy Commission.
Lan, S. H., & Farid, M. M. (2004). Experimental analysis of cryogenic freezing of food. Journal of Chemical Engineering of Japan, 37(2), 304-309.
Lang, G. (2006, 19 January). Cryogenic Freezing. Paper presented at the Industrial Refrigeration Consortium Research & Technology Forum.
Lee, B. S., & Gushee, D. E. (2008). Electricity Storage: The Achilles' Heel of Renewable Energy. Chemical Engineering Progress.
Lekov, A., Thompson, L., McKane, A., Song, K., & Piette, M. A. (2009). Opportunities for Energy Efficiency and Open Automated Demand Response in Wastewater Treatment Facilities in California - Phase I Report (No. LBNL-2572E). Berkeley, CA: Lawrence Berkeley National Laboratory.
Lettinga, G. (1995). Anaerobic-Digestion and Waste-Water Treatment Systems. Antonie Van Leeuwenhoek International Journal of General and Molecular Microbiology, 67(1), 3-28.
Loge, F. J. (2009). Demonstration of Mid-Scale Concentrated Solar Power - Dish/Engine (CSP-D/E) System to Offset Peak Energy Cost at a Wastewater Treatment Facility. In Emerging Technologies Demonstration Grant Program (Ed.): California Energy Commission.
Lorentzen, G. (1993a). Application of 'natural' refrigerants. IIF/IIR Energy Efficiency in Refrigeration and Global Warming Impact - Proceedings of meetings of Commissions B1/2 of the International Institute for Refrigeration(IIR)/Institut International de Froide (IIF).
Lorentzen, G. (1993b). Large heat pumps using CO2 refrigerant. IIF/IIR Energy Efficiency in Refrigeration and Global Warming Impact - Proceedings of meetings of Commissions B1/2 of the International Institute for Refrigeration(IIR)/Institut International de Froide (IIF).
Lorentzen, G. (1995). The use of natural refrigerants: a complete solution to the CFC/HCFC predicament. International Journal of Refrigeration, 18(3), 190.
Lowe, M., Golini, R., Gereffi, G., Ahmed, G., & Tokuoka, S. (2010). U.S. Adoption of High-Efficiency Motors and Drives: Lessons Learned. Durham, NC: Center on Globalization, Governance & Competitiveness, Duke University.

43
Martin, N., Worrell, E., Ruth, M., Price, L., Elliott, R. N., Shipley, A. M., et al. (2000). Emerging Energy-Efficient Industrial Technologies (No. LBNL 46990). Berkeley, CA: Lawrence Berkeley National Laboratory.
Maté, J., & Papathanasopoulos, C. (2010). Cool Technologies: Working Without HFCs - Examples of HFC-Free Cooling Technologies in Various Industrial Sectors: Greenpeace.
McGarvey, J. A., Miller, W. G., Lathrop, J. R., Silva, C. J., & Bullard, G. L. (2009). Induction of purple sulfur bacterial growth in dairy wastewater lagoons by circulation. Letters in Applied Microbiology, 49(4), 427-433.
Mills, D. (2004). Advances in solar thermal electricity technology. Solar Energy, 76(1-3), 19-31.
Misakian, M., Nelson, T. L., & Feero, W. E. (2009). Regarding Electric Energy Savings, Power Factors, and Carbon Footprints: A Primer (No. NIST Technical Note 1654). Gaithersburg, MD: National Institute for Standards and Technology.
Nelson, K. L. (2005). Small and Decentralized Systems for Wastewater Treatment and Reuse. In H. Vaux, J. Crook & R. Parkin (Eds.), Water Conservation, Reuse, and Recycling: Proceedings of an Iranian-American Workshop (pp. 54-66). Washington, DC: National Academies Press.
Olmez, H., & Kretzschmar, U. (2009). Potential alternative disinfection methods for organic fresh-cut industry for minimizing water consumption and environmental impact. Lwt-Food Science and Technology, 42(3), 686-693.
Oppenheimer, J. (2009). High-Efficiency Submersible Mixers for Wastewater Pond Aeration. In Emerging Technologies Demonstration Grant Program (Ed.): California Energy Commission.
Park, L., & Bennett, B. (2010). Embedded Energy in Water Studies - Study 2: Water Agency and Function Component Study and Embedded Energy-Water Load Profiles. Sacramento, CA: California Public Utilities Commission.
Parkinson, G. (2010). ‘Super Boiler' achieves higher efficiency through the recovery of waste heat. Chemical Engineering (January).
Quantec LLC. (2003). MagnaDrive: Market Progress Evaluation Report No. 3 (No. E03-118). Portland, OR: Quantec.
Quantec LLC. (2005). MagnaDrive: Market Progress Evaluation Report No. 4 (No. E05-149). Portland, OR: Quantec.
Reulens, W. (2009). Natural Refrigerant CO2 (No. NARECO2). Diepenbeek, Belgium: Katholieke Hogeschool Limburg.
Ridao, A. R., Garcia, E. H., Escobar, B. M., & Toro, M. Z. (2007). Solar energy in Andalusia (Spain): present state and prospects for the future. Renewable & Sustainable Energy Reviews, 11(1), 148-161.
Rue, D. (2005, 26 October). Submerged Combustion Melting: The Next Generation Melting System. Paper presented at the 66th Glass Problems Conference, Champaign, IL.

44
Saidur, R. (2010). A review on electrical motors energy use and energy savings. Renewable & Sustainable Energy Reviews, 14(3), 877-898.
Sardeing, R., Poux, M., Melen, S. P., Avrillier, P., & Xuereb, C. (2005). Aeration of large size tanks by a surface agitator. Chemical Engineering & Technology, 28(5), 587-595.
Sawalha, S. (2008). Theoretical evaluation of trans-critical CO2 systems in supermarket refrigeration. Part II: System modifications and comparisons of different solutions. International Journal of Refrigeration, 31(3), 525.
Shoemaker, S. (2006). Technology Roadmap: Energy Efficiency in California's Food Industry (No. CEC-500-2006-073). Sacramento, CA: California Energy Commission.
Shon, H. K., Vigneswaran, S., & Snyder, S. A. (2006). Effluent organic matter (EfOM) in wastewater: Constituents, effects, and treatment. Critical Reviews in Environmental Science and Technology, 36(4), 327-374.
Siano, P., Chen, P., Chen, Z., & Piccolo, A. (2010). Evaluating maximum wind energy exploitation in active distribution networks. Generation Transmission & Distribution, 4(5), 598-608. Institution of Engineering and Technology.
Skyllas-Kazacos, M., & Robins, R. (1988). All-vanadium redox battery. United States: Unisearch Ltd.
Strickland, W., Sopher, C. D., Rice, R. G., & Battles, G. T. (2007). Six Years of Ozone Processing of Fresh Cut Salad Mixes. Paper presented at the IOA Conference and Exhibition, Valencia, Spain.
Sutardja, S. (2009, 18 May). Tech’s little green secret. Reuters.
Tillner-Rueth, R. (2009). Environmentally Friendly Refrigeration in the Retail Trade: Refrigerant R22 soon to be a Thing of the Past - Future Ecological Alternative Can Be CO2. In V. Hasse, L. Edeber & D. Colbourne (Eds.), Natural Refrigerants: Sustainable Ozone- and Climate-Friendly Alternatives to HCFCs. Eschborn, Germany: Deutsche Gesellschaft für Technische Zusammenarbeit (GTZ).
Toca, C. (2009). Application of High Capacity Electric Energy Storage via Vanadium Redox Flow Batteries, in conjunction with Fuel Cells, to a Wastewater Treatment Facility. In Emerging Technologies Demonstration Grant Program (Ed.): California Energy Commission.
Tredinnick, S. (2010). Magnetic Couplings: A peachy ‘new’ flavor for ASDs? District Energy (2), 66-67.
Wang, D., Knight, R., Chojnacki, D., Molvie, P., Tynkov, B., & Willems, D. (2008). Saving Energy with the High Efficiency Super Boiler. Energy Engineering, 105(3), 38 - 48.
Water Environment Federation. (2009). Energy Conservation in Water and Wastewater Facilities. New York, NY: McGraw-Hill.
Watson, E. (2010, 3 August). BOC: Carbon dioxide will remain niche refrigerant in food production. FoodManufacture.co.uk.

45
Woody, T. (2010, 29 October). Warp Speed for Risky Solar Ventures. New York Times.
Worrell, E., Galitsky, C., Masanet, E., & Graus, W. (2008). Energy Efficiency Improvement and Cost Saving Opportunities for the Glass Industry (No. LBNL-57335-Revision). Berkeley, CA: Lawrence Berkeley National Laboratory.
Xu, T., Slaa, J., and Sathaye, J. 2010. Characterizing Costs, Savings and Benefits of a Selection of Energy Efficient Emerging Technologies in the United States. LBNL Report to CEC/CIEE.
Zhou, C. (2009). CASCADE Clean Energy System for California Energy Commission PIER ETDG in Water and Waste Water Projects. In Emerging Technologies Demonstration Grant Program (Ed.): California Energy Commission.
Zhou, H., & Smith, D. W. (2001). Advanced technologies in water and wastewater treatment. Canadian Journal of Civil Engineering, 28, 49-66.