Embed Size (px)
Citation preview

Iranian Journal of Fisheries Sciences 11(4) 807-824 2012
Phytoplankton growth and microzooplankton grazing in the
Homa Lagoon (İzmir Bay, Turkey)
Kutlu Banu
Received: April 2012 Accepted: September 2012
Abstract
Phytoplankton growth and microzooplankton grazing were investigated at one station in the
Homa Lagoon from February to January in 2006-2007. Our results showed significant
seasonal variations in phytoplankton dynamics. Microzooplankton was mainly composed of
dinoflagellates and tintinnid ciliates and nauplii. Microzooplankton grazing increased with
increasing of temperature. Grazing rate was maximum levels in spring and summer.
Microphytoplankton, which dominated the total algal biomass and production, were
characterized by the proliferation of several chain-forming diatoms. Small heterotrophic
flagellates and aloricate ciliates were the main controllers of phytoplankton. Phytoplankton
represented a significant for micrograzers, which grazing represented 20–120% of diatom and
cynabacteria algal production during 2006-2007. Microzooplankton has, however, a
relatively high impact on microphytoplankton, as > 45% of microalgal production was
consumed throughout the year. These results suggest that the low grazing was one of the
factors contributing to the development of the spring bloom. All of seasonal bases, the
phytoplankton production were grazed by microzooplankton in summer, autumn and winter–
spring seasons have been changing between 20%-120%. The seasonal variation in the
microzooplankton grazing pressure seems to result from the dominant size class of the
phytoplankton community of this lagoon diatom and cynabacteria.
Keywords: Grazing, Lagoons, Microzooplankton, Nutrient, Phytoplankton.
_______________ Tunceli University, Fisheries Faculty, 62000, Tunceli, Turkey. *Corresponding author’s email: [email protected]
Dow
nloa
ded
from
jifr
o.ir
at 1
4:47
+04
30 o
n S
atur
day
June
9th
201
8
808 Kutlu., Phytoplankton growth and microzooplankton grazing...
Introduction
Phytoplankton require multiple nutrients
for growth and multiple nutrients interact
to limit growth is essential to
understanding the causes of variation in
phytoplankton (Rhee, 1978; Goldman et
al., 1979). The identity of the nutrient(s)
limiting biomass and primary production
(Smith, 1982), and the effect of resource
competition on community structure
(Tilman, 1982). Of particular interest are
nitrogen (N) and phosphorus (P), two
macronutrients that are commonly thought
to limit phytoplankton growth (Smith,
1982; Downing, 1997).
Grazing microzooplankton can
control the biomass of bacteria and
phytoplankton (Fenchel, 1982; McManus
and Fuhrman, 1988, York et al., 2010), and
are in turn a main food source for
mesozooplankton (Bouley and Kimmerer,
2006; Gifford et al., 2007). Thus,
microplankton are important trophic
intermediaries between the microbial loop
and the rest of the food web.
Microzooplankton, including heterotrophic
flagellates, ciliates and copepod nauplii
can represent significant proportion of the
total zooplankton biomass of the oceans
(Odate and Maitan, 1988; Tsuda et al.,
1990; Booth et al., 1993; Boyd et al.,
1995). The roles of micro-zooplankton in
pelagic ecosystems, include those of
consumers of pico- to nano-sized
phytoplankton and rapid regenerators of
nutrients (Paasche and Kristiansen, 1982;
Goldman and Caron, 1985). Further, the
microzooplankton are considered to play
an intermediary role in trophic exchanges
between the pico- to nanophytoplankton
and meso-zooplankton (Gifford, 1991).
Determination of effects of
nutrients and microzooplankton essential
to phytoplankton growth is crucial in
coastal areas. The limiting nutrient can be
detected using different methods, e.g., by
inorganic nitrogen to phosphorus ratios
(Neill, 2005), enrichment experiments
(e.g., Ryther and Dunstan, 1971; Graneli,
1987), or measuring intracellular
concentrations of nutrients (Hecky and
Kilham, 1988).
As such complicated effects of
nutrients are best studied with natural
populations (Stumm and Baccini, 1983;
Vaquer et al., 1996; Pedrós-Alió et al.,
1999; Robinson, 2000; Morán et al., 2001;
Fonda Umani et al., 2005; Sakka et al.,
2007). Furthermore, the significant
impacts of microzooplankton grazing on
phytoplankton communities has been well
documented in many regions of the world's
oceans (Capriulo and Carpenter, 1983;
Burkill et al., 1987; Paranjape, 1987;
Gilford, 1988; Odate and Maita, 1988;
Verity et al., 1993; Froneman and
Perissinotto, 1996; Tsuda and Kawaguchi,
1997; Shinada et al., 2000; Suffrian et al.,
2008). However, there are only a few
reports on the role of microzooplankton
grazing in determining in the fate of
primary production coastal lagoon
ecosystems (Calbet and Landry, 2004;
Sakka et al., 2007).
The main objective of this study
was to examine both microzooplankton
grazing rates on phytoplankton and
phytoplankton growth rates during various
seasons of the year and discuss the balance
between microzooplankton and
phytoplankton in order to evaluate the
Dow
nloa
ded
from
jifr
o.ir
at 1
4:47
+04
30 o
n S
atur
day
June
9th
201
8
Iranian Journal of Fisheries Sciences, 11(4), 2012 809
quantitative trophic role of
microzooplankton in the planktonic food
web of the Homa Lagoon, İzmir, Turkey.
Materials and methods
Study Site
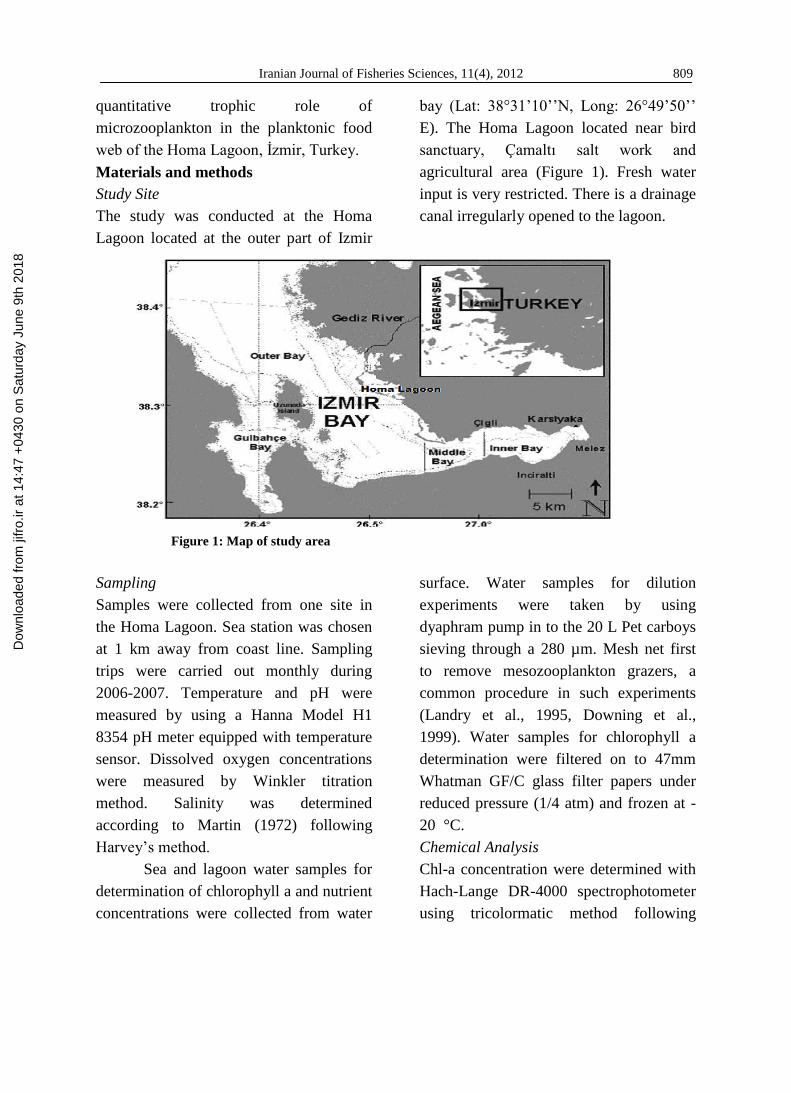
The study was conducted at the Homa
Lagoon located at the outer part of Izmir
bay (Lat: 38°31’10’’N, Long: 26°49’50’’
E). The Homa Lagoon located near bird
sanctuary, Çamaltı salt work and
agricultural area (Figure 1). Fresh water
input is very restricted. There is a drainage
canal irregularly opened to the lagoon.
Figure 1: Map of study area
Sampling
Samples were collected from one site in
the Homa Lagoon. Sea station was chosen
at 1 km away from coast line. Sampling
trips were carried out monthly during
2006-2007. Temperature and pH were
measured by using a Hanna Model H1
8354 pH meter equipped with temperature
sensor. Dissolved oxygen concentrations
were measured by Winkler titration
method. Salinity was determined
according to Martin (1972) following
Harvey’s method.
Sea and lagoon water samples for
determination of chlorophyll a and nutrient
concentrations were collected from water
surface. Water samples for dilution
experiments were taken by using
dyaphram pump in to the 20 L Pet carboys
sieving through a 280 µm. Mesh net first
to remove mesozooplankton grazers, a
common procedure in such experiments
(Landry et al., 1995, Downing et al.,
1999). Water samples for chlorophyll a
determination were filtered on to 47mm
Whatman GF/C glass filter papers under
reduced pressure (1/4 atm) and frozen at -
20 °C.
Chemical Analysis
Chl-a concentration were determined with
Hach-Lange DR-4000 spectrophotometer
using tricolormatic method following
Dow
nloa
ded
from
jifr
o.ir
at 1
4:47
+04
30 o
n S
atur
day
June
9th
201
8

810 Kutlu., Phytoplankton growth and microzooplankton grazing...
extraction in 90% acetone according to
Strickland and Parsons (1972). The filtrate
was collected in 100 ml acid washed
bottles and stated in a refrigerator for a few
days prior to analysis. NH4+-N, Reactive
Silicate (RSi), Reactive phosphate (RP)
were analysed using spectrophotometer
according to Strickland and Parsons (1972)
and NO3--N according Wood et al. (1967).
Dilution Experiments
Total of 12 dilution experiments for lagoon
water were conducted throughout the study
period by using clean technique. All
carboys, silicone tubing and filter
cartridges were soaked overnight in 10%
HCl: ultrapure water (18.2M Ω) and rinsed
3 times with ultrapure water and finally
with filtered seawater. Plastic gloves were
used during all steps of experiment
including sub sampling and cleaning.
Duplicate incubations were carried
out at 4 fractions of whole lagoon water at
dilution levels D=1, 0.70, 0.45, 0.20, all
enriched first with added N (NO3--N,
NH4+-N), RP and RSi prior to dilution.
Final nutrient concentrations were 1/100 of
Guillard’s f/2 medium 0.363 µMP, 8.83µ
MNO3--N, 5 µ MNH4
+-N, 10.7 µ MRSi).
Firstly, 0.2 µm Cartridge filtered seawater
was transferred to 3 L PET Carboys up to
certain volume, added nutrients and then
natural lagoon water was added from 20 L
mixed carboys up to 2.7 L final volume.
Two additional 3 L carboys were filled
with unfiltered lagoon water without
nutrient addition, in order to determine in
situ growth rates of phytoplankton
community. All experimental carboys (2.7
L) were incubated in situ for 24h.
The geometric phytoplankton
biomass during incubations without
nutrient supplements (Cm) was determined
by following equations for ∆t= 1day
Where Co is the initial
phytoplankton biomass; the determination
of the net growth rate of the phytoplankton
community (µ) was based on changes in
concentrations at chl a
Where t is the duration of the
experiments Co and Ct is initial and final
phytoplankton biomass, respectively.
Relationship between net growth rates and
grazing was described by Landry and
Hassett (1982) as:
µ=µmax-gD
With the assumptions that µmax is
density independent and g
(microzooplankton grazing) is proportional
to the dilution factor, D (or the grazer’s
density) grazing threshold (Gaul and
Antia, 2001) from dilution experiments, g
µgross were described as
µgross= µinsitu(N-)+gt
Where µ insitu(N-) is growth rate (d-1
)
without nutrient additions and without
dilution (100% natural sea water). g+ is
grazing rate (d-1
) with nutrient additions.
µmax is net infinite dilution (in case of no
animals) determined by extrapolation to
zero unfiltered sea water fraction (intercept
of line).
Dow
nloa
ded
from
jifr
o.ir
at 1
4:47
+04
30 o
n S
atur
day
June
9th
201
8

Iranian Journal of Fisheries Sciences, 11(4), 2012 811
Pb=Chla biomass removed daily by
grazing (%d-1
).
Pb=
Pp is the chl a production remaxed
daily by grazing (%day-1)
Pp=
Statistical analyses
Analyses were performed using SPSS 14.0
statistical software for Windows. One-way
ANOVA was used to test the differences
among stations for Chl a, phytoplankton,
growth rates and grazing coefficients. The
ANOVA was followed by multiple
comparison tests (Duncan test) to identify
which groups were significantly different
from the others.
Results
Environmental condition and nutrient
concentrations
Surface water temperature, salinity,
silicate, ammonium, nitrite and nitrate
concentrations are presented in Figure 2.
Surface water temperature ranged from
7.0°C (in February 2006) to 26.5 °C (in
August 2006). Salinity ranged from 36.45
psu to 44.71 psu. Salinity variations were
due to precipitation evaporation and the
water exchange with adjacent sea in
relation to predominant winds. There was
an increase of the pH values in March,
May, July, October and November.
Generally, the increase in the pH value
was significant during the months when
phytoplankton produced substantially. The
decrease observed in phosphate
concentration was due to the increase of
phytoplankton biomass.
The ammonium concentration
decreased in mid-spring due to the fact that
phytoplankton species use ammonium in
the spring bloom. The ammonium
concentration reached to maximum level
in August.
During the study, mean Nitrate
concentration was 7.37 ± 4.84 µgat/l (0.76-
16.07). Nitrate concentrations, like the
other nutrients, showed an increase in mid-
spring. There was no significant difference
in nitrate concentrations in the summer.
This could be explained by nitrate-rich
waters of the bay. However, the nitrate
concentrations at two stations increased at
the end of autumn. During the end of
autumn, nitrate concentrations decrease in
the nitrate concentrations in the following
months could be explained with the
absence of rains and the consumption by
phytoplankton.
Dow
nloa
ded
from
jifr
o.ir
at 1
4:47
+04
30 o
n S
atur
day
June
9th
201
8

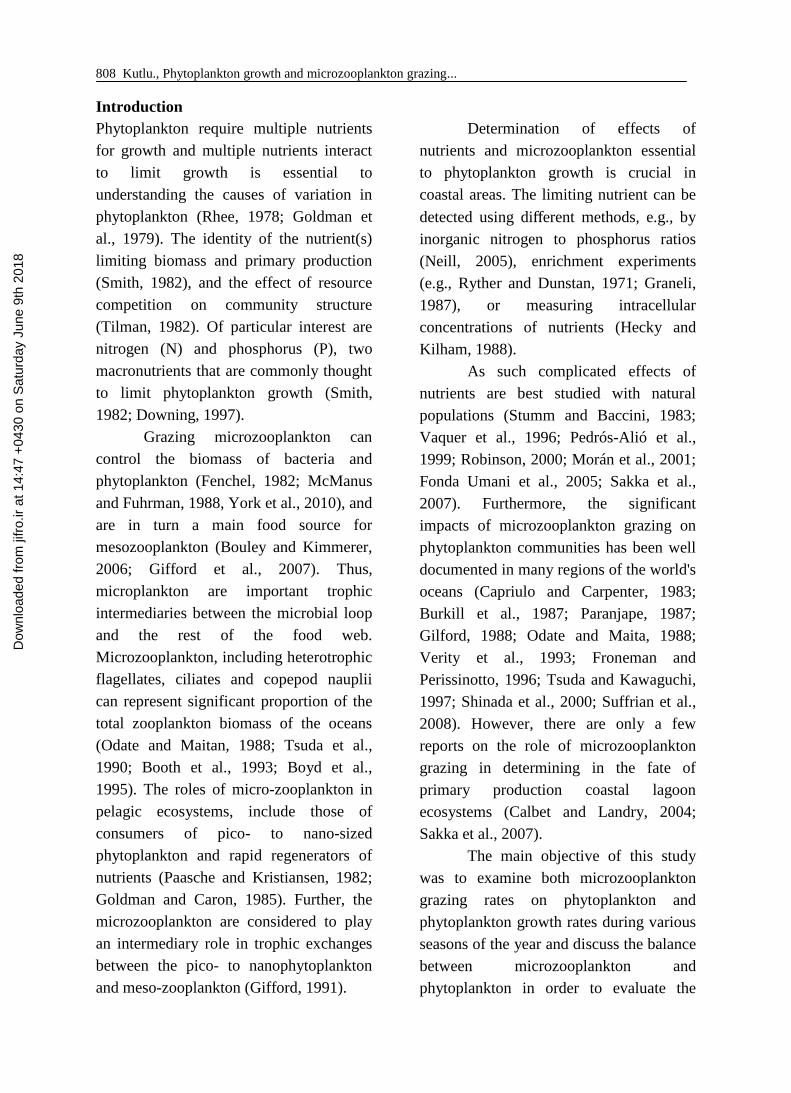
812 Kutlu, Phytoplankton growth and microzooplankton grazing...
Figure 2. Physical and chemical Parameters. A. Temperature-Salinity B. Nutrient
Phytoplankton and microzooplankton
community dynamics
Chl-a concentrations were significantly
different among months (P < 0.05) during
2006 and 2007. In the acetone extraction
method, the Chl-a in May exhibited a high
increase. The Chl-a (0.17-5.49µg/l) in July
increased progressively and sharply
decreased in January in vivo measurement.
The relative contribution of large-sized
cells (like diatoms) to total phytoplankton
(412777 cells ml/L) abundance increased
in July. Indeed, several chain-forming
species (Navicula sp., Cylindrotheca
closterium, Licmophora abbreviate,
Gyrosigma fasciola, Ceratium teres,
Tintinnopsis sp., Protoperidinium
brevipes, Dinophysis fortii, Prorocentrum
rotundatum, Gyrosigma balticum,
Gyrosigma spenceri, Striella delicatum, P.
micans, D. fortii, P. rotundatum, P.
brevipes) proliferated intensively during
spring (Fig. 3). At the beginning of
summer, diatoms and dinoflagellates
remarkably increased and predominant
diatoms were Rhizosolenia sp., N.
longissima, Licmophora abbreviata, C.
closterium, Navicula spp.. The
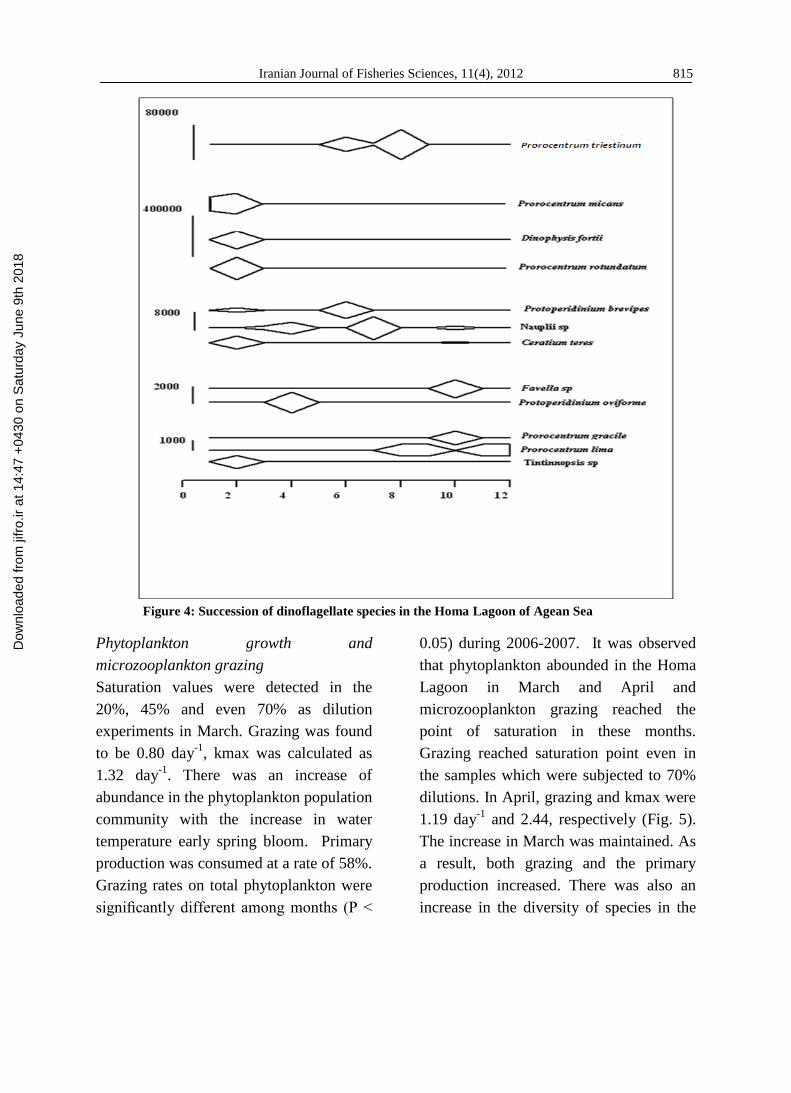
winter/autumn communities of
phytoplankton were dominated by
microzooplankton species (Prorocentrum
triestinum, Prorocentrum lima nauplii,
Favella sp., Ceratium teres, P. lima) (Fig.
4).
Dow
nloa
ded
from
jifr
o.ir
at 1
4:47
+04
30 o
n S
atur
day
June
9th
201
8

Iranian Journal of Fisheries Sciences, 11(4), 2012 813
(a)
Dow
nloa
ded
from
jifr
o.ir
at 1
4:47
+04
30 o
n S
atur
day
June
9th
201
8

814 Kutlu., Phytoplankton growth and microzooplankton grazing...
(b)
Figure 3: Succession of diatom species in the Homa lagoon of Agean Sea (a, b)
Dow
nloa
ded
from
jifr
o.ir
at 1
4:47
+04
30 o
n S
atur
day
June
9th
201
8
Iranian Journal of Fisheries Sciences, 11(4), 2012 815
Figure 4: Succession of dinoflagellate species in the Homa Lagoon of Agean Sea
Phytoplankton growth and
microzooplankton grazing
Saturation values were detected in the
20%, 45% and even 70% as dilution
experiments in March. Grazing was found
to be 0.80 day-1
, kmax was calculated as
1.32 day-1
. There was an increase of
abundance in the phytoplankton population
community with the increase in water
temperature early spring bloom. Primary
production was consumed at a rate of 58%.
Grazing rates on total phytoplankton were
significantly different among months (P <
0.05) during 2006-2007. It was observed
that phytoplankton abounded in the Homa
Lagoon in March and April and
microzooplankton grazing reached the
point of saturation in these months.
Grazing reached saturation point even in
the samples which were subjected to 70%
dilutions. In April, grazing and kmax were
1.19 day-1
and 2.44, respectively (Fig. 5).
The increase in March was maintained. As
a result, both grazing and the primary
production increased. There was also an
increase in the diversity of species in the
Dow
nloa
ded
from
jifr
o.ir
at 1
4:47
+04
30 o
n S
atur
day
June
9th
201
8

816 Kutlu., Phytoplankton growth and microzooplankton grazing...
medium. The 97% of the biomass was
consumed by grazing from April to the end
of the year. Grazing in May was 3.34 day-1
and kmax was 4.28 day-1
. There was an
increase in phytoplankton species
composition (Fig. 5). The quantity of
phytoplankton in May is not so much as to
render the microzooplankton grazing at
saturation level. All the values in June are
maximum levels. During the period of
spring, grazing rates prominently increased
with increasing the growth rate of
community and it was observed that
maximum growth rates were significantly
higher than the grazing rates. The situation
can be explained in proportion to the
duration and intensity of light. In March,
significant increases in growth rate due to
grazing weak limitation. In April and May,
is provided for increasing in growth rate of
phytoplankton community.
The 99% of the biomass was
consumed by grazing in June. During first
half of July, grazing, kmax, r2
were1.12 d-
1, 4.509 day
-1 and 78%, respectively. The
grazing percentages progressively
decreased from 99% to 66% from July
onwards (Fig. 5). In early summer, the
growth rates reached to the maximum level
while the lowest grazing rates were
recorded. In August, very high grazing rate
is indicated a temporary over-grazing in a
narrow. Therefore, the situation is
important in terms of reflecting the period.
The community composition
showed changes in September and
October. The grazing, kmax, r2
were 1.34
day-1
, 3.84 day-1
and 94%, respectively
(Fig. 5). At the beginning of October, the
changes in primary production, potential
primary production and grazing showed
similar trend. Grazing increased as primary
production increased and grazing was
more than production in the medium from
the end of summer onwards (Fig. 5).
Grazing percentage increased in
September and reached the maximum
point in November. All data showed
decreasing in grazing percentage during
the winter. Early autumn, grazing rates of
phytoplankton were in lower levels while
community grazing rates of phytoplankton
increased. In contrast, in mid to late
autumn, grazing rates were higher levels.
In January, grazing and kmax were
increased. Grazing was found to be 0.20
day-1
in the experiment carried out in
February (Fig. 5). Grazing had the least
percentage since production was low in
February. There was a decrease in
phytoplankton activity in the medium, and
the grazing had the least percentage value.
During the first half of the season, nutrient
limitation was observed. In growth rates
between nutrient addition and without
nutrient addition groups were observed
difference. In January, growth and grazing
rate of phytoplankton community were
nearly equal and relatively higher level
although the variation value was
significantly high. At the end of winter,
both grazing rate and growth rate were
significantly declined and grazing was
relatively low.
Dow
nloa
ded
from
jifr
o.ir
at 1
4:47
+04
30 o
n S
atur
day
June
9th
201
8

Iranian Journal of Fisheries Sciences, 11(4), 2012 817
Figure 5. Relation between net growth rate of phytoplankton and
fraction of unfiltered sea water.
Discussion
Environmental conditions and nutrient
concentrations
Inorganic nitrogen and phosphorous
(NO2- + NO3
- + NH4
+, PO4
-3) in the Homa
Lagoon is characterized by relatively
Dow
nloa
ded
from
jifr
o.ir
at 1
4:47
+04
30 o
n S
atur
day
June
9th
201
8

818 Kutlu., Phytoplankton growth and microzooplankton grazing...
normal concentrations compared to
previous reports for other Mediterranean
coastal systems, as lagoon of Thau
(Vaquer et al., 1996) and Gulf of Trieste
(Fonda Umani et al., 2003), Bizeert lagoon
nutrient concentrations of inorganic
nitrogen and phosphorous, (Sakka et al.,
2007). The nitrite was low concentrations
from the end of February to the end of the
year. The increase in nitrite concentrations
may explain the nitrification. In the range
of Chl-a concentrations levels reported for
the three coastal ecosystems (Fonda
Umani et.al., 2003; Bec et al., 2005; Sakka
et al., 2007). This study illustrated that
species-specific information on critical
N:P ratios are requires for accurate
predictions of the effect of nutrient
additions on a phytoplankton community.
Furthermore, consideration should be
given to the prokaryotic or eukaryotic
species of phytoplankton competitors as
likely exhibit different physiological
properties and reactions (Hudson, 2007).
Chl-a specific μ over a year in the
surface water of the Homa Lagoon were
estimated as 1.12 day-1
. Similarly, μ values
were reported in previous studies
(Paranjape, 1989; Tsuda and Kawaguchi,
1997; Goericke and Welschmeyer, 1998;
Lessard and Murrell, 1998; Shinada et al.,
2000; Odate and Saitoh, 2001).
Phytoplankton and microzooplankton
community dynamics
In previous studies, diatoms predominated
when the surface water temperature was
low in winter (9°C) (Odate and Maita,
1988; Shinada et al., 1999). μ in winter
and spring were comparable to reported
values based on cultures for diatoms at low
temperature (Smith and Sakshaug, 1990).
Raven (1986) reported the summer
phytoplankton community of lagoon was
dominated by cyanobacteria at 20°C. On
the other hand, microzooplankton was
dominated by heterotrophic dinoflagellates
and ciliates during summer.
The present results showed that
phytoplankton abundance and biomass
were in lower levels during the winter
season. During the winter period, the
ambient phytoplankton biomass may be
sufficiently low that microzooplankton
may cease grazing, thus exhibiting a de
facto threshold feeding response (Frost,
1975; Campbell and Carpenter, 1986), or
they may only graze minimally.
Additionally, the low significant grazing
observed during the period of year, in
particular in December and February 2002,
would be the grazing of the phototrophic
P. lima, P. micans, P. Rotundatum and P.
triesstrium.
Phytoplankton growth and
microzooplankton grazing
Microzooplankton grazing (g) averaged
71% of phytoplankton growth (µ) on a
worldwide basis (Calbet and Landry,
2004). They stated that microzooplankton
grazing accounted for a cross-system
average of 64% of primary production
within a range of 59 to 74%. In contrast,
the present results indicated that in 2006-
2007, and the average ratio of g: µ in the
Aegean Sea Homa Lagoon in year was
1.71. The impact of microzooplankton on
the phytoplankton blooms in the upper
estuary might significant.
In this study, there was no significant
difference in the mean μ between summer
and winter–spring seasons, although
higher μ often occurred in summer.
Dow
nloa
ded
from
jifr
o.ir
at 1
4:47
+04
30 o
n S
atur
day
June
9th
201
8
Iranian Journal of Fisheries Sciences, 11(4), 2012 819
Similarly, μ in surface waters were not
varied systematically over the year, in
spite of seasonally changing
concentrations of nitrate (Goericke and
Welschmeyer, 1998). The present results
showed that g was less than μ in spring.
This suggests that the onset of the spring
bloom results from increased
phytoplankton growth, as observed at the
beginning of March, coupled with a
continuously low grazing pressure in
spring. At this stage, we cannot identify
what factor(s) affect the increase in
phytoplankton growth. However, the
factors seem to be most likely associated
with phytoplankton growth are light and
mixing depth. Phytoplankton has a high
potential growth rate throughout the year.
It has been found that phytoplankton
growth rates were low due to selective
grazing by the microzooplankton
community on different phytoplankton
groups, which were evaluated by company
the composition of the phytoplankton
community after incubation in the
presence and absence of grazing (Lionard
et al., 2005).
Based on dilution experiments, we
found a clear seasonal change of
microzooplankton grazing as potential loss
factor for phytoplankton impact between
spring, summer and autumn in a shallow
coastal area. Our study demonstrated high
seasonal variability in microzooplankton
grazing. Microzooplankton grazing
controlled phytoplankton dynamics in
summer, presumably retaining a high
percentage of summer phytoplankton
biomass in the pelagic food web.
Microzooplankton grazing was not
controlled the diatom spring bloom: from
the build-up until the decay of the diatom
bloom no grazing was observed. Bloom
dynamics were mainly controlled by light
and nutrients and that most of the biomass
entered benthic food webs by
sedimentation and benthic assimilation
(Loebl and Beusekom, 2008).
In conclusion, our study showed the
high impact of microzooplankton grazing
on phytoplankton production throughout
the year in Homa Lagoon. Grazing control
was particularly pronounced in summer
and autumn when the large algae (i.e.,
diatoms) contributed a high fraction of the
primary production. As phytoplankton
production was mostly channelled to the
microzooplankton, an important
component of the microbial food web, the
flux of material to the seafloor, would be
reduced. Results showed significant
correlations between phytoplankton
growth and microzooplankton grazing
rates between phytoplankton and ciliate
abundance (Zhou et al., 2012).
This should be considered when
modelling the carbon cycling in coastal
environments and under conditions of
diatom dominance. Our study
demonstrated that the ciliate community of
the restricted Homa Lagoon was the more
active grazer of the large algae (diatoms)
than the heterotrophic dinoflagellates,
which is contrary to finding in open
coastal waters.
Dow
nloa
ded
from
jifr
o.ir
at 1
4:47
+04
30 o
n S
atur
day
June
9th
201
8

820 Kutlu., Phytoplankton growth and microzooplankton grazing...
References
Bec, B., Husseini-Ratrema, J., Collos,
Y., Souchu, P. and Vaquer, A., 2005.
Phytoplankton seasonal dynamics in a
Mediterranean coastal lagoon:
emphasis on the picoeukaryote
community. Journal of Plankton
Research, 27, 881-894.
Booth, B. C., Lewin, J. and Postel, J. R.,
1993. Temporal variation in the
structure of autotrophic and
heterotrophic communities in the
subarctic Pacific. Progress in
Oceanography, 32, 57–99.
Boyd, P. W., Strom, S., Whitney, F. A.,
Doherty, S., Wen, M. E., Harrison,
P. J., Wong, C. S. and Varela, D. E.,
1995. The NE subarctic Pacific in
winter: I. Biological standing stocks.
Marine Ecology Progress Series, 128,
11–24.
Burkill, P. H., Mantoura, R. F.,
Llewellyn C. A. and Owens, N. J. P.,
1987. Microzooplankton grazing and
selectivity of phytoplankton. Marine
Biology, 93, 581-590.
Calbet, A. and Landry, M. R., 2004.
Phytoplankton growth,
microzooplankton grazing, and carbon
cycling in marine systems. Limnology
and Oceanography, 49, 51-57.
Campbell, L. and Carpenter, E. J., 1986.
Estimating the grazing pressure of
heterotrophic nanoplankton on
Synechococcus spp. using the sea
water dilution and selective inhibitor
techniques. Marine Ecology Progress
Series, 33, 121-129.
Capriulo, G. M. and Carpenter, E. J.,
1983. Abundance, species
composition and feeding impact of
tintinnid micro-zooplankton in central
Long Island Sound. Marine Ecology
Progress Series, 10, 277-288.
Downing, J. A., 1997. Marine nitrogen :
phosphorus stoichiometry and the
global N : P cycle. Biogeochemistry,
37, 237–252.
Downing, J. A., Osenberg, C. W. and
Sarnelle, O., 1999. Meta-analysis of
marine nutrient enrichments
experiments:variation in the
magnitude of nutrient limitation.
Ecology, 80, 1157–1167.
Fenchel, T., 1982. Ecology of
heterotrophic microflagellates. IV.
Quantitative occurrence and
importance as bacterial consumers.
Mar. Ecol. Prog. Ser. 9,35–42.
Fonda Umani, S., Tirelli, V., Beran, A.
and Guardiana, B., 2005.
Relationships between
microzooplankton and
mesozooplankton: competition versus
predation on natural assemblages of
the Gulf of Trieste (northern Adriatic
Sea). Journal of Plankton Research,
27, 973-986.
Froneman, P. W. and Perissinotto, R.,
1996. Structure and grazing of the
microzooplankton communities of the
Subtropical Convergence and warm-
core eddy in the Atlantic sector of the
Southern Ocean. Marine Ecology
Progress Series, 135, 237-245.
Frost, B. W., 1975. A threshold feeding
response in Calanus pacificus.
Limnology and Oceanography, 20,
257-263.
Gaul, W. and Antia, A. N., 2001. Taxon-
specific growth and selective
microzooplankton grazing of
Dow
nloa
ded
from
jifr
o.ir
at 1
4:47
+04
30 o
n S
atur
day
June
9th
201
8
Iranian Journal of Fisheries Sciences, 11(4), 2012 821
phytoplankton in the Northeast
Atlantic. Journal of Marine Systems,
30, 241–261.
Gifford, D. J., 1991. The protozoan-
metazoan trophic link in pelagic
ecosystems. Journal of Protozoology,
38, 81-86.
Gilford, D.J., 1988. Impact of grazing by
microzooplankton in the northwest
arm of Halifax Harbour, Nova Scotia.
Marine Ecology Progress Series 47,
249-258.
Goericke, R. and Welschmeyer, N.,
1998. Response of Sargasso Sea
phytoplankton biomass, growth rates
and primary production to seasonally
varying physical forcing. Journal of
Plankton Research, 20, 2233–2249.
Goldman, J. C. and Caron, D. A., 1985.
Experimental studies on an
omnivorous microflagellates:
implication for grazing and nutrient
regeneration in the marine microbial
food chain. Deep-Sea Research, 32,
899-915.
Goldman, J.C., 1979. Outdoor algal mass
culture. II. Photo-synthetic yield
limitations. Water Res. 13, 119-136.
Hecky, R. E. and Kilham, P., 1988.
Nutrient limitation of phytoplankton
in freshwater and marine
environments: a review of recent
evidence on the effects of enrichment.
Limnology and Oceanography,
33(4/22), 796–822.
Hudson, R.DeYoe., Buskey, E. J. and
Jockem, F. J., 2007. Physiological
responses of Aureoumbra lagunensis
and Synechococcus sp. to nitrogen
addition in a mesocosm experiment.
Harmful Algae, 6, 48–55.
Landry, M. R. and Hassett, R. P., 1982.
Estimating the grazing impact of
marine micro-zooplankton. Marine
Biology, 67, 283–288.
Landry, M. R., Kirshtein, J. and
Constantinou, J., 1995. A refined
dilution technique for measuring the
community grazing impact of
microzooplankton, with experimental
tests in the central equatorial Pacific.
Marine Ecology Progress Series, 120,
53–63.
Landry, M.R. and Calbert, A., 2004.
Microzooplankton production in the
oceans.Ices Journal Marine. Science,
61, 501-507.
Lessard, E. J. and Murrell, M. C., 1998.
Microzooplankton herbivory and
phytoplankton growth in the
northwestern Sargasso Sea. Aquatic
Microbial Ecology, 16, 173–188.
Lionard, M., Aze´mar, F., Bouleˆtreau,
S., Muylaert, K., Tackx, M. and
Vyverman, W., 2005. Grazing by
meso- and microzooplankton on
phytoplankton in the upper reaches of
the Schelde estuary (Belgium/The
Netherlands). Estuarine, Coastal and
Shelf Science, 64, 764-774.
Maita, Y., Odate, T. and Yanada, M.,
1988. Vertical transport of organic
carbon by sinking particles and the
role of zoo- and phytogenic matters in
neritic waters. Bulletin of the Faculty
Dow
nloa
ded
from
jifr
o.ir
at 1
4:47
+04
30 o
n S
atur
day
June
9th
201
8

822 Kutlu., Phytoplankton growth and microzooplankton grazing...
of Fisheries Hokkaido University, 39,
265–274.
Martin, D. F., 1972. Marine Chemistry,
Vol. 1, Analytical Methods, Marcel
Dekker Inc., New York, 389 p.
McManus G.B.and Fuhrman, J.A.,
1988. Control of marine bacterio-
plankton populations: measurement
and significance of grazing.
Hydrobiologia 159:51–62.
Morán, X. A. G., Taupier-Letage, I.,
Vázquez-Domínguez, E., Ruiz, S.,
Arin, L., Raimbault, P. and
Estrada, M., 2001. Physical-
biological coupling in the Algerian
Basin (SW Mediterranean): Influence
of mesoscale instabilities on the
biomass and production of
phytoplankton and bacterioplankton.
Deep Sea Research I, 48, 405-437.
Neill, M., 2005. A method to determine
which nutrient is limiting for plant
growth in estuarine waters at any
salinity. Marine Pollution Bulletin, 50
(9), 945–955.
Odate, T. and Maita, Y., 1988. Seasonal
changes in the biomass of zooplankton
and their food requirement in Funka
Bay. Journal of the Oceanographical
Society of Japan, 44, 228–234.
Odate, T. and Saitoh, S., 2001.
Chlorophyll specific growth rate and
grazing mortality rate of
phytoplankton in the shelf water of the
Bering Sea in summer. Polar
Biosciences, 14, 122–128.
Paasche, E. and Kristiansen, S., 1982.
Ammonium regeneration by
microzooplankton in the Oslofjord.
Marine Biology, 69, 55-63.
Paranjape, M. A., 1987. Grazing by
microzooplankton in the eastern
Canadian Arctic in summer 1983.
Marine Ecology Progress Series, 40,
239-246.
Paranjape, M., 1989. Grazing by
microzooplankton in the eastern
Canadian arctic in summer 1983.
Marine Ecology Progress Series, 40,
239–246.
Pedrós-Alió, C., Calderón-Paz, J. I.,
Guixa-Boixereu, N., Estrada, M.
and Gasol, J. M., 1999.
Bacterioplankton and phytoplankton
biomass and production during
summer stratification in the
northwestern Mediterranean Sea.
Deep Sea Research I, 46, 985-1019.
Raven, J. A., 1986. Physiological
consequences of extremely small size
for autotrophic organisms in the sea.
In Platt, T. and Li, W. K. W. (eds),
Photosynthetic Picoplankton.
Canadian Bulletin of Fisheries and
Aquatic Sciences, 214, 1–70.
Rhee, G., 1978. Effects of N:P atomic
ratios and nitrate limitation on algal
growth, cell composition, and nitrate
uptake. Limnology and
Oceanography, 23, 10–25.
Robinson, C., 2000. Plankton gross
production andrespiration in the
shallow water hydrothermal systems
of Milos, Aegean Sea. Journal of
Plankton Research, 22, 887-906.
Ryther J. H. and Dunstan W. M., 1971.
Nitrogen, phosphorus, and
eutrophication in the coastal marine
environment. Science, 171, 1008–
1013.
Dow
nloa
ded
from
jifr
o.ir
at 1
4:47
+04
30 o
n S
atur
day
June
9th
201
8

82 Iranian Journal of Fisheries Sciences, 11(4), 2012 3
Sakka Hlaili, A., Grami, B., Hadj
Mabrouk, H., Gosselin, M. and
Hamel, D., 2007. Phytoplankton
growth and microzooplankton grazing
rates in a restricted Mediterranean
lagoon (Bizerte Lagoon, Tunisia).
Marine Biology, 151, 767-783.
Shinada, A. 2000. The plankton food
chain structure in north western
subarctic Pacific. Ph. D. Thesis,
Hokkaido Univ (In Japanese).
Shinada, A., 2000. The plankton food
chain structure in northwestern
subarctic Pacific. PhD Thesis,
Hokkaido Uniersity, pp. 111.
Shinada, A., Shiga, N. and Ban, S., 1999.
Structure and magnitude of diatom
spring bloom in Funka Bay,
southwestern Hokkaido, Japan, as
influenced by the intrusion of Coastal
Oyashio Water. Plankton Biology and
Ecology, 46, 24–29.
Smith, V. H., 1982. The nitrogen and
phosphorus dependence of algal
biomass in lakes: An empirical and
theoretical analysis. Limnology and
Oceanography, 27, 1101–1112.
Smith, W. O. and Jr Sakshaug, E., 1990.
Polar phytoplankton. In Smith, W. O.,
Jr (ed.), Polar Oceanography, Part B:
Chemistry, Biology, and Geology.
Academic Press, San Diego, CA, pp.
477–525.
Strickland, J.D.H. and Parsons, T.R.,
1972. A Practical Handbook of
Seawater Analysis. The Alger Press
Ltd. Ottowa.
Stumm, W. and Baccini, P., 1983. Man-
made chemical perturbations of lakes.
In: Lerman, A. (Ed.), Lakes,
Chemistry, Geology, Physics.
Springer-Verlag, New York, pp. 91-
126.
Suffrian, K., Simonelli, P., Nejstgaard,
J. C., Putzeys, S., Carotenuto, Y.
and Antia, A. N., 2008.
Microzooplankton grazing and
phytoplankton growth in marine
mesocosms with increased CO2 levels.
Biogeosciences Discussions, 5, 411-
433.
Tilman, D., 1982. Phytoplankton
Community The Role of Limiting
Nutrient. Ecology System, 13, 349-
379.
Tsuda, A. and Kawaguchi, S., 1997.
Microzooplankton grazing in the
surface water of the Southern Ocean
during an austral summer. Polar
Biology, 18, 240-245.
Tsuda, A., Furuya, K. and Nemoto, T.,
1990. Feeding of microand
macrozooplankton at the subsurface
chlorophyll maximum in the
subtropical North Pacific. Journal of
Experimental Marine Biology and
Ecology, 132, 41–52.
Vaquer, A., Troussellier, M., Courtis, C.
and Bibent, B., 1996. Standing stock
and dynamics of picophytoplankton in
the Thau Lagoon (northwest
Mediterranean coast). Limnology and
Oceanography, 41, 1821-1828.
Verity, P. G., Stoecker, D. K., Sieracki,
M. E. and Nelson, J. R., 1993.
Dow
nloa
ded
from
jifr
o.ir
at 1
4:47
+04
30 o
n S
atur
day
June
9th
201
8
824 Kutlu., Phytoplankton growth and microzooplankton grazing...
Grazing, growth and mortality of
microzooplankton during the 1989
North Atlantic spring bloom at 47°N,
18°W. Deep Sea Research I, W. 1793-
1814.
Wood, E. D., Armstrong, F. A. J. and
Richards, F. A., 1967. Determination
of nitrate in seawater by cadmium–
copper reduction to nitrite. Journal of
the Marine Biological Association of
the United Kingdom, 47, 23–31.
York J. K., Costas B. A. and McManus,
G.B., 2010. Microzooplankton
grazing in green water – results from
two contrasting estu- aries. Estuaries
Coasts, 33, 373–38.
Zhou, L., Tan, Y., Huang, L., Huang, J.,
Liu, H. and Lian, X., 2012.
Phytoplankton growth and
microzooplankton grazing in the
continental shelf area of northeastern
South China Sea after Typhoon
Fengshen. Continental Shelf Research
,31, 1663-1671.
Dow
nloa
ded
from
jifr
o.ir
at 1
4:47
+04
30 o
n S
atur
day
June
9th
201
8