Embed Size (px)
Citation preview

P H Y S I C S U N I O N M A T H E M A T I C S
Physics IIDynamics
Supported by the National Science Foundation (DRL-0733140) and Science Demo, Ltd.
Student Edition

2 PUM | Dynamics | Adapted from A. Van Heuvelen and E. Etkina, Active Learning Guide, Addison Wesley, San Francisco, 2006© Copyright 2009, Rutgers, The State University of New Jersey.
PUM Physics IIDynamics
Adapted from:
A. Van Heuvelen and E. Etkina, Active Learning Guide, Addison Wesley, San Francisco, 2006. Used with permission.
This material is based upon work supported by the National Science Foundation under Grant DRL-0733140. Any opinions, findings and conclusions or recommendations expressed in this material are those of the authors and do not necessarily reflect the views of the National Science Foundation (NSF).

PUM | Dynamics | Adapted from A. Van Heuvelen and E. Etkina, Active Learning Guide, Addison Wesley, San Francisco, 2006
© Copyright 2009, Rutgers, The State University of New Jersey.
3
Table of Contents
LESSON 1: FORCE AS AN INTERACTION 4
LESSON 2: EXPERIMENTAL DESIGN AND ASSESSMENT 12
LESSON 3: MOTION DIAGRAMS & FORCE DIAGRAMS 14
LESSON 4: WHAT’S A FORCE TO DO? 18
LESSON 5: INERTIAL AND NON-INERTIAL REFERENCE FRAMES 24
LESSON 6: NEWTON’S SECOND LAW: QUALITATIVE 28
LESSON 7: NEWTON’S SECOND LAW: QUANTITATIVE 32
LESSON 8: DESIGN AN EXPERIMENT 37
LESSON 9: APPLYING NEWTON’S SECOND LAW 41
LESSON 10: NEWTON’S THIRD LAW: QUALITATIVE 45
LESSON 11: NEWTON’S THIRD LAW: QUANTITATIVE 47
LESSON 12: TWO-BODY PROBLEMS 51
LESSON 13: DESIGN AN EXPERIMENT 54
LESSON 14: FRICTION 57
LESSON 15: PUTTING IT ALL TOGETHER 63
LESSON 16: COMPONENTS 65
LESSON 17: FINDING THE COEFFICIENT 73
LESSONS 18: PRACTICE 76
LESSON 19: REVIEW 81

4 PUM | Dynamics | Lesson 1: Force as an InteractionAdapted from A. Van Heuvelen and E. Etkina, Active Learning Guide, Addison Wesley, San Francisco, 2006© Copyright 2009, Rutgers, The State University of New Jersey.
Lesson 1: Force as an Interaction
1.1 Observe and Represent
a) Pick up a tennis ball and hold it in your hand. Now pick up a medicine ball and hold it. Do you feel the difference? How can you describe what you feel in simple words?
b) Think of how we represented the motion of objects in the last module. What are some possible ways of representing the interaction between your hand and the tennis ball?
c) Let’s choose the ball as our object of interest. Represent the medicine ball with a dot andlabel the dot with “Ball” Draw an arrow to show how your hand pushes the ball. Connect the tail of the arrow to the dot. This arrow represents the force that your hand exerts on the ball.
Did You Know?
The word “force” is used in physics for a physical quantity that characterizes the interaction of two objects. A single object does not have a force by default, as the force is defined through the interaction of two objects.
Remember that all physical quantities are measured in units. The unit of force is called the newton (N), where 1 N = (1 kg)(1 m/s2).
d) How could you label this force arrow to show that it is the force your hand exerts on the ball? Add this label to your representation.
Here’s An Idea!
To show that the force arrow represents the push that the hand exerts on the ball, we can use a symbol F with two little words at the bottom on the right. These are called subscripts.
For example: If we look at the interaction of a golf ball and a golf club while the club is hitting the ball. Then if we choose the golf ball as the object of interest, the golf club exerts a force on the golf ball. As a label for an arrow on a force diagram, this would be written as Fclub on ball.
e) What do you think would happen to the ball if your hand were the only object interacting with it? What does this tell you about other objects interacting with the ball?
f) What other objects are interacting with the ball? List each object and the direction of the push or pull.
1.2 Test Your Reasoning

PUM | Dynamics | Lesson 1: Force as an InteractionAdapted from A. Van Heuvelen and E. Etkina, Active Learning Guide, Addison Wesley, San Francisco, 2006
© Copyright 2009, Rutgers, The State University of New Jersey.
5
a) In the previous activity, did you say that air interacts with the ball for part f? How do you think air interacts with the ball?
b) What experiment can you perform to test your idea about whether the air pushes up or down on the ball?
c) Use the video experiment on the website or CD if your class does not have the equipment. Before watching the video or performing the experiment, write a prediction of what should happen to the bottle based on your hypothesis.
d) Watch the video or perform the experiment: http://paer.rutgers.edu/pt3/movies/bottle_in_vacuum.mov. (Or on the CD it is on the List of Videos, Bottle in a vacuum).
e) Summarize what effect the air has on the ball.
1.3 Represent and Reason
a) In activity 1.1, did you say that gravity interacts with the ball? Gravity is not an object;you cannot hold or touch it. So when we use the word gravity to note the pull down on all objects on Earth, what is the object that exerts this downward pull?
b) Add another arrow on your diagram in 1.1 (c). Label the arrow with the appropriate subscripts.
c) What do you notice about the length of the arrows in your diagram? What do you think would happen if the arrow representing the interaction with your hand were longer than the arrow due to the interaction with the Earth? If it were the other way around?
d) Now draw a diagram for the heavy ball. How are the force arrows different from the arrows on the diagram for the tennis ball?
Did You Know?
The diagrams you created in activity 1.1 through 1.3 are called force diagrams. Force diagrams are used to represent the forces exerted on an object of interest (system) by other objects.
A system is an object or group of objects that we are interested in analyzing. Everything outside the system is called the environment and consists of objects that might interact with and affect the system object’s motion. These are external interactions. When we draw force diagrams, we only consider the forces exerted on the system object(s).
1.4 Represent and Reason

6 PUM | Dynamics | Lesson 1: Force as an InteractionAdapted from A. Van Heuvelen and E. Etkina, Active Learning Guide, Addison Wesley, San Francisco, 2006© Copyright 2009, Rutgers, The State University of New Jersey.
a) Think of a word to describe the force arrows in each force diagram.
Did You Know?
When the forces exerted on an object of interest are balanced, we say that the object is in EQUILIBRIUM (equilibrium does not necessarily mean rest).
b) How might we represent our force diagrams with a mathematical representation or math statement? Write a math statement for the medicine ball.
Need Some Help?
Imagine putting an axis next to the force diagram with the origin at the dot. You can use + for the up direction and – for the downward direction.
For example: Let’s take the situation of a puppy curled up in your lap. Then we can write the total force exerted on the puppy by your legs and the Earth as: Flegs on dog + FEarth on dog = 0.
c) For your math statement, does it matter whether you chose up as positive or down as positive? How would this affect the math statement you wrote? What happens to the total force exerted on the ball if we switched the axis?
Did You Know?
Notice that depending on the orientation of the axis, either FHand on Ball or FEarth on Ball has a negative
value, thus the sum of a positive and a negative number can be zero. How do we know which force is positive and which one is negative? If the force arrow points in the positive direction of the chosen axis, we consider the force positive. If the y axis points down, for example, then FEarth on Ball >0 and FHand on Ball <0.
d) Look at your force diagrams for the tennis ball and medicine ball? What is the same about the diagrams? What is different?
e) Write an expression for the forces exerted on the tennis ball similar to the expression you wrote for the medicine ball. Is the tennis ball in equilibrium? Explain.
1.5 Observe and Explain
a) Perform the experiments described in the first column. Then record your data and fill in the empty cells. Remember that the scale, as a measuring instrument, has an uncertainty of measurement associated with it.

PUM | Dynamics | Lesson 1: Force as an InteractionAdapted from A. Van Heuvelen and E. Etkina, Active Learning Guide, Addison Wesley, San Francisco, 2006
© Copyright 2009, Rutgers, The State University of New Jersey.
7
Experiment Draw a picture of
the apparatus.
List objects
interacting with the object of interest.
Draw a force
diagram for the object.
Discuss what objects exert forces balancing
the force that the Earth exerts on the
object. What is/are the direction of the
balancing force/forces?
Write a mathematical expression for
the forces exerted on the object. Specify
your axis.
(a) Hang an object from a spring scale. Record reading of the scale here
______________
(b) Lower the object onto a platform scale so it touches the scale. Record new reading of the spring scale _______
Record the reading platform scale _______________
(c) Remove the spring scale and leave the object on the platform scale. Record new reading platform scale _______________
(d) You place the object on a horizontal meter stick whose ends rest on two blocks. Record what happens
_____________________
(e) You place the object on a thick, foam cushion. Record what happens
_____________________
(f) You place the object on a tabletop.
Record what happens
_____________________
(g) You place the block on the platform scale and then tilt the scale at a small angle.
Record what happens
_____________________

8 PUM | Dynamics | Lesson 1: Force as an InteractionAdapted from A. Van Heuvelen and E. Etkina, Active Learning Guide, Addison Wesley, San Francisco, 2006© Copyright 2009, Rutgers, The State University of New Jersey.
a) Some people think that only alive (animate) objects can exert forces. The table is not alive. How can a table push on an object?
b) A book rests on top of a table. Jim says that the force exerted by the table on the book is always the same in magnitude as the force exerted by the Earth on the book. Why would Jim say this? Do you agree or disagree with Jim? If you disagree, how can you argue your case?
1.6 Reason
a) Summarize in what direction the force is exerted on an object of interest by the supporting object.
b) Is this force always equal in magnitude and direction to the force that the Earth exerts on the object? Provide experimental evidence and reasoning to support your opinion.
c) Look at the force diagram shown in the “Did You Know?” below. How would the force diagram change if instead of dragging the box on a smooth floor, you dragged it on the carpet?
Did You Know?The diagrams we constructed above are force diagrams. A force diagram is a physical representation used to analyze and evaluate processes involving forces.In order to create a force diagram, follow the 6 steps below.
2. Circle the object of interest
SKETCHFORCE DIAGRAM
3. Draw a dot representing the box
5. Draw forces to represent interactions, watch the length of arrows
6. Label the forces
4. Identify interactions between the system and other objects. Here: Earth, floor, rope and surface
Check for understanding: What does the length of an arrow on the diagram mean?
1. Sketch the situation
FFloor on Box
FEarth on Box
FRope on Box
y

PUM | Dynamics | Lesson 1: Force as an InteractionAdapted from A. Van Heuvelen and E. Etkina, Active Learning Guide, Addison Wesley, San Francisco, 2006
© Copyright 2009, Rutgers, The State University of New Jersey.
9
Did You Know?
System: A system is the object of interest that we choose to analyze. Make a sketch of the process that you are analyzing. Then circle the object of interest – your system. Everything outside that system is called the environment and consists of objects that might interact with and affect the system object’s motion. These are external interactions.
Force: A force that one object exerts on another characterizes an interaction between the two objects. The force causes some effect or influence of the one object on the second object. Forces are represented by a symbol with an arrow above it to show that the force has direction and with two subscripts indicating the two objects. For example, if the Earth pulls
on a ball, we note the force exerted by the Earth on the ball as: FEarth on Ball .
The arrow above force indicates that force is the physical quantity that both has magnitude and direction. The symbol also indicated that in this case our system is the ball and the Earth is the external object. If we are interested in the force that the ball exerts on the Earth, we
will write it as FBall on Earth .
1.7 Reason
Describe a situation in which a surface exerts ONLY a horizontal force on the object. Draw a picture of the situation. Then draw a force diagram.
1.8 Represent and Reason
A person pushes a box across a very smooth floor.
a) Examine the force diagram to the right. Do the forces in the vertical direction balance? Do the forces in the horizontal direction balance?
b) Draw an arrow to indicate the direction of the unbalanced force, if there is one. Discuss whether the result is reasonable.

10 PUM | Dynamics | Lesson 1: Force as an InteractionAdapted from A. Van Heuvelen and E. Etkina, Active Learning Guide, Addison Wesley, San Francisco, 2006© Copyright 2009, Rutgers, The State University of New Jersey.
1.9 Represent and ReasonRead each of the scenarios and then draw a force diagram for the selected object of interest.
1. You are throwing a tennis ball upward. Consider the moment right before the ball leaves your hand. The ball is the object of interest.
3. The ball is at the top of the flight. The ball is the object of interest
2. The ball is flying up. The ball is the object of interest.
4. The ball is being caught by you. Consider the moment when your hands are stopping the ball.The ball is the object of interest.
Now use the rubric below to self-assess your force diagrams.
Missing An attempt Needs improvement Acceptable
No force diagram is constructed.
Force diagram is constructed but contains major errors: missing or extra forces (not matching with the interacting objects), incorrect directions of arrows, or incorrect relative length of force arrows.
Force diagram contains no errors in force arrows but lacks a key feature such as labels of forces with two subscripts or forces are not drawn from single point.
The diagram contains forces for each interaction and each force is labeled so that one can clearly understand what each force represents. Relative lengths of force arrows are correct.

PUM | Dynamics | Adapted from A. Van Heuvelen and E. Etkina, Active Learning Guide, Addison Wesley, San Francisco, 2006
© Copyright 2009, Rutgers, The State University of New Jersey.
11
Homework
1.10 Represent and Reason
a) Draw force diagrams and use them to determine the direction of the unbalanced force exerted on the following objects of interest:
i. A hockey puck moving on ice slows to a stop. The puck is the object of interest. ii. A box is sliding down an inclined plane. The box is the object of interest.
iii. You start lifting up a heavy suitcase; the suitcase is the object of interest. iv. A boat floats in the ocean; the boat is the object of interest. v. You are pulling a sled on fresh snow at constant speed; the sled is the object of
interest. vi. You are pushing a lawnmower; the lawnmower is the object of interest.
b) Examine the unlabeled force diagrams below and come up with a real life situation that they might describe. Then label each force with the appropriate subscripts.
1.11 Estimate uncertainty
Rob and Tina collected data using a scale that had divisions every newton (N): 0 N, 1 N, 2 N, 3 N, etc. When Tina hung her bag on the spring scale, she wrote the reading of the scale as 2.2 N. Rob repeated the experiment and wrote the reading as 2.3 N. They used the same bag. Why are their numbers different? Who do you think is correct? Based on your answer, decide haw precisely you can measure the force with this scale.
1.12 Estimate uncertainty
Find three measuring devices in your house (each one needs to show the quantity that it ismeasuring, the units of measurement, and a scale).
a) Write down the experimental uncertainty for each instrument. You may need to recall how we determined experimental uncertainty in the kinematics module.
b) Now take a measurement with each instrument and write the result so that it incorporates the experimental uncertainty.

12 PUM | Dynamics | Lesson 2: Experimental Design and AssessmentAdapted from A. Van Heuvelen and E. Etkina, Active Learning Guide, Addison Wesley, San Francisco, 2006© Copyright 2009, Rutgers, The State University of New Jersey.
Lesson 2: Experimental Design and Assessment
2.1 Observe and Find a Pattern
You have the following equipment: a spring scale, a plastic bottle filled with sand, a container of water, and a ruler (measuring tape).
a) Examine the equipment that you are given. Think of possible questions you can answer using the equipment. Focus your questions on the magnitudes and directions of forces that the water exerts on the bottle.
b) As a group, decide what question(s) you are going to investigate and the experiment you are going to conduct to answer your question(s). Draw a picture of the apparatus.
c) What physical quantities will you measure? What do you think are the dependent and independent variables? How are you going to record and represent the data?
d) Perform the experiment and collect the data. Represent the interactions of the bottle with the scale, Earth, and water using a force diagram.
e) What patterns did you find? Summarize your findings for the question(s) you posed.
f) Based on the experiment you performed, does the water push up or down on the object? Does the push depend on how deeply the object is submerged? If you cannot answer these questions from you experiment, conduct a second experiment to answer them.
Homework
2.2 Communicate
Write a report about your investigation so that a person who did not see your experiment can repeat it and obtain similar results. Use the rubrics on the next page to help write your report. Be sure to include what you learned from performing the experiment(s)?
2.3 Equation Jeopardy
The following equations are mathematical descriptions of several situations that you might have encountered in activity 2.1. Try to visualize the equations and describe what situations they could describe. Choose the upward direction as positive.
a) 10.0 N + (-10.0 N) = 0
b) 7.0 N + 3.0 N + (-10.0 N) = 0
c) 4.0 N + 6.0 N + (-10.0 N) = 0
Scientific AbilityMissing An attempt
Needs some improvement
Acceptable

PUM | Dynamics | Lesson 2: Experimental Design and AssessmentAdapted from A. Van Heuvelen and E. Etkina, Active Learning Guide, Addison Wesley, San Francisco, 2006
© Copyright 2009, Rutgers, The State University of New Jersey.
13
1
Is able to identify the question to be investigated
The question is not mentioned.
An attempt is made to formulate the question but it is described in a confusing manner, or is not the question of interest.
The question is posed but there are minor omissions or vague detail.
The question to be investigated is clearly stated.
2
Is able to decide what is to be measured and identify independent and dependent variables
The chosen measurementswill not produce data that can be used to achieve the goals of the experiment.
The chosen measurements will produce data that can be used at best to partially achieve the goals of the experiment.
The chosen measurements will produce data that can be used to achieve the goals of the experiment. However, independent and dependent variables are not clearly distinguished.
The chosen measurements will produce data that can be used to achieve the goals of the experiment. Independent and dependent variables areclearly distinguished.
3
Is able to use available equipment to make measurements
At least one of the chosen measurements cannot be made with the available equipment.
All chosen measurements can be made, but no details are given about how it is done.
All chosen measurements can be made, but the details of how it is done are vague or incomplete.
All chosen measurements can be made and all details of how it is done are clearly provided.
4
Is able to describe what is observed in words and with a picture of the experimental setup.
No description is mentioned.
A description is mentioned but it is incomplete. No picture is present.
A description exists, but it is mixed up with explanations or other elements of the experiment. A labeled picture is present.
Clearly describes what happens in the experiment both verbally and by means of a labeled picture.
5
Is able to identify sources of experimental uncertainty
No attempt is made to identify experimental uncertainties.
An attempt is made to identify experimental uncertainties, but most are missing, described vaguely, or incorrect.
Most experimental uncertainties are correctly identified.
Experimental uncertainties due to all instruments are correctly identified. Random uncertainty is considered.
6
Is able to evaluate specifically how identified experimental uncertainties may affect the data
No attempt is made to evaluate experimental uncertainties.
An attempt is made to evaluate experimental uncertainties, but most are missing, described vaguely, or incorrect. Or only absolute uncertainties are mentioned.
The final result does take the identified uncertainties into account but is not correctly evaluated.
The final result is written with the uncertainty.

14 PUM | Dynamics | Lesson 3: Motion diagrams & Force diagramsAdapted from A. Van Heuvelen and E. Etkina, Active Learning Guide, Addison Wesley, San Francisco, 2006© Copyright 2009, Rutgers, The State University of New Jersey.
Lesson 3: Motion diagrams & Force diagrams
3.1 Observe and Represent
Consider the following experiment: You have a bowling ball and a board (or anything that rolls easily, a billiard ball or a low friction cart on a track). You place the ball on the floor and push it with the board continuously trying to exert a constant force.
a) Sketch the situation.
b) Perform the experiment, then describe the motion of the ball in words.
c) List all of the objects interacting with the bowling ball while it is being pushed.
d) Draw a motion diagram for the ball. Indicate the direction of the v
arrow.
e) Draw a force diagram for the ball.
3.2 Represent and Reason
a) Look at the force diagram you drew in 3.1 Are there any forces that are balanced? If so,please indicate which and explain why you think so.
b) Indicate if there is an unbalanced force exerted on the ball. Indicate the direction of the unbalanced force with an arrow.
c) Indicate the direction of the velocity change arrow ( v
) on the motion diagram.
3.3 Observe and Represent
Consider this new experiment: You push the ball to start it moving. Once it is already rolling, you lightly push the front of the moving bowling ball continuously with a board in the direction opposite to the direction of motion.
a) Sketch the situation.
b) Perform the experiment and describe the motion of the ball in words.
c) List all of the objects interacting with the bowling ball while it is being pushed in the direction opposite to its motion.
d) Draw a motion diagram.
e) Draw a force diagram for the ball.
f) Examine your force diagram. Indicate which forces are balanced and which forces are unbalanced. How do you know? Draw an arrow to show the direction of the unbalanced force.
g) Indicate the direction of the change in velocity arrow on the motion diagram.

PUM | Dynamics | Lesson 3: Motion diagrams & Force diagramsAdapted from A. Van Heuvelen and E. Etkina, Active Learning Guide, Addison Wesley, San Francisco, 2006
© Copyright 2009, Rutgers, The State University of New Jersey.
15
3.4 Represent and Reason
Imagine that you have a bowling ball that is moving on a very smooth floor (neglect all friction forces). While the ball is in motion, its velocity does not change.
a) Draw a motion diagram for the ball. What is the direction of the velocity change?
b) Draw a force diagram for the ball. What is the direction of the unbalanced force?
c) If the floor is infinitely long, how long will the ball move before it stops? Should it ever stop?
3.5 Find a Pattern
Consider the experiments you performed in activities 3.1 - 3.4. Examine the force and motion diagrams for each experiment.
a) Is there a pattern in the directions of the unbalanced forces that other objects exert on the ball and in the directions of the
rv arrows on the motion diagrams for the ball?
b) Is there a pattern in the directions of the unbalanced forces that other objects exert on the ball and the directions of the v
arrows in the motion diagrams?
c) Use the pattern that you found to formulate a statement relating the force diagram to the motion diagram.
d) How do you understand the difference between the words “motion” and “change in motion”? Give an example.
e) Do you think the net force exerted on an object causes motion or change in motion?
f) Who was the observer recording the velocity changes for the ball? Would there be observers for whom the statement relating the force diagram to the motion diagram would not be true?
3.6 Test the Pattern
a) Design 2 different experiments whose outcome you can predict using the statement you formulated in activity 3.5 (c).
Need Some Help?
The statement you are testing is the rule or pattern you noticed between the direction of the unbalanced force on the force diagram and the direction of the v
arrow on the motion diagram
for the same object. The experiment you design should try to “rule out” the pattern, not to “prove” it.
b) Write predictions for the outcome of each experiment based on the pattern you noticed.

16 PUM | Dynamics | Lesson 3: Motion diagrams & Force diagramsAdapted from A. Van Heuvelen and E. Etkina, Active Learning Guide, Addison Wesley, San Francisco, 2006© Copyright 2009, Rutgers, The State University of New Jersey.
c) Perform the experiment and record the outcome. How did your prediction compare to the outcome? Did you succeed in the disproving the pattern? Explain your judgment.
Homework
3.7 Test the Pattern
You have a medicine ball. When you place it on a bathroom scale, the scale reads 6 pounds (a unit of force in a the British system). Imagine that a friend drops a medicine ball, and it falls straight down on a bathroom scale.
a) Draw a force diagram for the ball when it sits on the scale at rest. Draw a motion diagram for the ball.
b) Draw a motion diagram for the ball when it just touches the scale but is not yet stopped.
c) Draw a force diagram to match the motion diagram.
Assume that the scale reads the force that the scale exerts on the ball. Make a prediction about the reading of the scale as it stops the falling ball using the pattern between the motion diagram and the force diagram you formulated and tested during the lesson.
d) After you made the prediction, watch the videos. Make sure that in the second clip, you move frame by frame.
http://paer.rutgers.edu/pt3/movies/medballdrop1.mov then http://paer.rutgers.edu/pt3/movies/medballdrop2.mov.
e) What judgment can you make about the pattern you formulated?
3.8 Represent and Reason
a) Draw a motion diagram for a book sliding on a table coming to a stop. Draw a force diagram for the book. Are the force diagram and motion diagram consistent with each other? Explain.
b) You are holding a birthday balloon filled with helium. Draw motion and force diagrams for the balloon. Are the force diagram and motion diagram consistent with each other? Explain.
c) You are holding a birthday balloon filled with helium and then let it go. Draw motion and force diagrams for the balloon the moment you let it go. Are the diagrams consistent with each other? Explain.
d) The balloon reaches the ceiling. Draw motion and force diagrams for the balloon the moment the top of it touches the ceiling. Check the consistency of your representations. Can you represent the balloon as a particle in this case? Explain.
e) A matchbox slides down a steep incline. Draw a motion diagram and a force diagram for the matchbox as it slides down the incline. Check the consistency of your representations.

PUM | Dynamics | Lesson 3: Motion diagrams & Force diagramsAdapted from A. Van Heuvelen and E. Etkina, Active Learning Guide, Addison Wesley, San Francisco, 2006
© Copyright 2009, Rutgers, The State University of New Jersey.
17
3.9 Pose a Problem
Consider the scenario: You are playing ice hockey.
Pose a problem similar to the two activities above. Then solve your problem.

18 PUM | Dynamics | Lesson 4: What’s a Force to Do?Adapted from A. Van Heuvelen and E. Etkina, Active Learning Guide, Addison Wesley, San Francisco, 2006© Copyright 2009, Rutgers, The State University of New Jersey.
Lesson 4: What’s a Force to Do?
4.1 Test an Idea
Aaron has a hypothesis that says “objects always move in the direction of the unbalanced force exerted on them by other objects.”
a) Design an experiment whose outcome might be consistent with Aaron’s hypothesis. Carefully describe what you are going to do. Draw a force diagram for the system object for the experiment you described.
b) Make a prediction about the object’s motion based on Aaron’s hypothesis. Use the rubrics below to help in your reasoning.
Need Some Help?
Remember in our kinematics unit we spent some time talking about hypotheses, predictions, and H-D statements. Recall the difference between hypotheses and predictions. Also recall that the H-D statements are written in an If-And-Then statement. REMEMBER! – Your predicted outcome always must be based on your hypothesis.
c) Now perform the experiment and record the outcome. How did the outcome compare to the prediction? Can you say that you proved Aaron’s hypothesis?
4.2 Test an Idea
a) Think of an experiment you can perform in which you can exert a force on an already moving object in a direction that is different from the direction of its motion. Describe the experiment carefully and draw a force diagram.
b) Use Aaron’s idea to make a prediction about the object’s motion. Use the rubrics below to help in your reasoning.
c) Perform the experiment and record the outcome. Compare the outcome to your prediction. What judgment can you make about Aaron’s HYPOTHESIS?
Scientific Ability
Missing An attemptNeeds some improvement
Acceptable
Is able to distinguish between a hypothesis and a prediction
No prediction is made. The experiment is not treated as a testing experiment.
A prediction is made but it is identical to the hypothesis.
A prediction is made and is distinct from the hypothesis but does not describe the outcome of the designed experiment.
A prediction is made, is distinct from the hypothesis, and describes the outcome of the designed experiment.
Is able to make a reasonable prediction based on a hypothesis
No attempt to make a prediction is made.
A prediction is made that is distinct from the hypothesis but is not based on it.
A prediction is made that follows from the hypothesis but does not have an if-and-then structure.
A prediction is made that is based on the hypothesis and has an if-and-then structure.
Is able to make a reasonablejudgment about the hypothesis
No judgment is made about the hypothesis.
A judgment is made but is not consistent with the outcome of the experiment.
A judgment is made and is consistent with the outcome of the experiment but assumptions are not taken into account.
A reasonable judgment is made and assumptions are taken into account.

PUM | Dynamics | Lesson 4: What’s a Force to Do?Adapted from A. Van Heuvelen and E. Etkina, Active Learning Guide, Addison Wesley, San Francisco, 2006
© Copyright 2009, Rutgers, The State University of New Jersey.
19
4.3 Hypothesize
Based on the experiments above and the experiments you performed in lesson 3, formulate the relationship between the unbalanced force exerted by other objects on the object of interest and the motion (or change in motion) of the object of interest.
4.4 Test an Idea
James thinks that when the net force exerted by other objects on the object of interest is zero, the object is at rest.
a) Design two experiments to test James’s hypothesis.
b) Write a prediction for each experiment based on James’s hypothesis.
c) Perform the experiments and record the outcomes. Compare the outcomes to your predictions.
d) What judgment can you make about James’s hypothesis now? Why would James have such an idea?
Did You Know?Relationship between force and motion: If external objects exert an unbalanced force on the system object of interest, its motion changes so that the
rv arrow in a motion diagram
describing the motion of this object is in the same direction as the unbalanced force exerted on the object.
Homework
4.5 Reason
For each part below, identify the system, draw a force diagram, draw a motion diagram, and determine if the force and motion diagram are consistent.
a) Give an example for an object moving in the direction of the unbalanced force exerted on it by other objects.
b) Give an example for an object moving in the direction opposite to the unbalanced force exerted on it by other objects.
c) Give an example for an object moving at an angle with the unbalanced force exerted on it by other objects.
d) You throw a small ball upward.

20 PUM | Dynamics | Lesson 4: What’s a Force to Do?Adapted from A. Van Heuvelen and E. Etkina, Active Learning Guide, Addison Wesley, San Francisco, 2006© Copyright 2009, Rutgers, The State University of New Jersey.
4.6 Represent and Reason
Draw a motion diagram and a force diagram for each of the following objects (the object of interest is underlined) once the object is in motion. Make sure that the force diagram and motion diagram are consistent with each other.
Situation Motion diagram Force diagramHow do you know if they are consistent?
A ball is dropped and is falling down.
A ball is thrown down.
A football is landing on a cushion and the cushion is being compressed.
A rabbit sits in its cage.
FE on O
FE on R
FS on R

PUM | Dynamics | Lesson 4: What’s a Force to Do?Adapted from A. Van Heuvelen and E. Etkina, Active Learning Guide, Addison Wesley, San Francisco, 2006
© Copyright 2009, Rutgers, The State University of New Jersey.
21
Situation Motion diagram Force diagram How do you know if they are consistent?
A matchbox slides down a smooth book cover.
An air hockey puckslides across an air table.
4.7 Reason
Read the statements below and classify each into one of three groups: experimental evidence, hypothesis, prediction.
a) As the plants grow their mass increases.
b) The mass of the plants increases because you water them.
c) The increase in the mass of the growing plant should be exactly equal to the decrease in the mass of the potting soil in a pot with a plant. Measure when the soil is dry.
d) The mass of the plants increases because they absorb carbon from the air.
e) The mass of the plants increases because they absorb nutrients from the soil.
f) The increase in the mass of the growing plant should be exactly equal to the mass of water used to water the plant.
g) Explain how you understand the difference between the terms experimental evidence, hypothesis, and prediction. Provide your own example for each.
FE on O
FS on O
FS on O

22 PUM | Dynamics | Lesson 4: What’s a Force to Do?Adapted from A. Van Heuvelen and E. Etkina, Active Learning Guide, Addison Wesley, San Francisco, 2006© Copyright 2009, Rutgers, The State University of New Jersey.
Additional Problems and Exercises
Representing Horizontal Motion
I. Complete the diagrams below.
a) Which dot represents t = 0 in the motion diagram? Label t = 0.b) Where is the object at t = 0 in the motion diagram? Let that be the origin, and label it.c) What do the arrows represent in the motion diagrams? Label them.d) Indicate the direction of
rv for the motion diagrams.
e) Label the forces in the force diagrams.
Motion Diagrams Force Diagrams
A.
B.
C.
· · · · · ·
· ·· ·
· ·· ·
··· ·
·· · ·
· · · ·· ·
·
1.
2.
3.
4.
5.
6.
7.

PUM | Dynamics | Lesson 4: What’s a Force to Do?Adapted from A. Van Heuvelen and E. Etkina, Active Learning Guide, Addison Wesley, San Francisco, 2006
© Copyright 2009, Rutgers, The State University of New Jersey.
23
II. For each of the force diagrams, determine which motion diagrams from the previous activity can physically represent the force diagram. For each force diagram-motion diagram combination, tell a story that they could be representing. An example is done for you. Be creative!
Force Diagram Motion Diagram
#
Story
7 Example: A turkey leg sits on a plate. The downward force is the FEarth on turkey and the upward force is Fplate on turkey
III. Pick one story for each of the three force diagrams and write a problem that includes numbers. Then solve the problem.
A.
B.
C.

24 PUM | Dynamics | Lesson 5: Inertial and Non-inertial Reference FramesAdapted from A. Van Heuvelen and E. Etkina, Active Learning Guide, Addison Wesley, San Francisco, 2006© Copyright 2009, Rutgers, The State University of New Jersey.
Lesson 5: Inertial and Non-inertial Reference Frames
5.1 Observe and Analyze
You are sitting on a train and place a ping-pong ball on a tray table in front of you. The ping-pong ball is at rest. All of a sudden, the ball starts rolling towards you. At the same time, your friend who was waiting for your train to depart, saw the train starting to move in the direction in which you were facing, but she saw the ball stationary and the train leaving from under it.
a) Describe the motion of the ball when it starts rolling using a motion diagram for each observer: you on the train and your friend on the platform.
b) Explain the behavior of the ball when it starts rolling using a force diagram for eachobserver: you on the train and your friend on the platform.
ObserverYou on a train that is
starting to moveYour friend on the platform
Motion diagram for the ball (description of motion)
Force diagram for the ball (explanation of motion)
Are the diagrams consistent?Explain.
c) What can you say about the relationship between the unbalanced force and change in motion for the observer on the train that starts to move?
d) How will you rewrite the relationship between force and change in motion to include the role of the observer?
e) Why do you think your friend on the platform did not see the ball starting to move (i.e. change its motion) when the train started to move?
Did You Know?Inertial reference frame: Inertia is the phenomenon when an object continues moving at constant velocity if no other objects interact with it or if the sum of all these interactions is zero. Reference frames in which we can observe this phenomenon are called inertial reference frames. If the sum of all forces exerted on the object is zero, then in an inertial reference frame, the object’s velocity remains constant.

PUM | Dynamics | Lesson 5: Inertial and Non-inertial Reference FramesAdapted from A. Van Heuvelen and E. Etkina, Active Learning Guide, Addison Wesley, San Francisco, 2006
© Copyright 2009, Rutgers, The State University of New Jersey.
25
Newton’s first law of motion: We choose a particular object as the object of interest—the system. If no other objects interact with the system object or if the sum of all the external forces exerted on the system object is zero (forces in the y direction are balanced and forces in the xdirection are balanced), then the system object continues moving at constant velocity (including remaining at rest) as seen by observers in the inertial reference frames.
5.2 Reason
Consider the following idea: The relationship between the unbalanced force and the change in motion depends on the observer.
Apply this idea using all of the videos at:http://paer.rutgers.edu/pt3/experimentindex.php?topicid=3&cycleid=1.
For some observers, THE RELATIONSHIP between the direction of the unbalanced force and the direction of the
rv arrow DOES NOT WORK. Identify such observers in every experiment.
Need Some Help?
Recall in the kinematics module that motion is relative. For each video, describe the motion of the object from multiple reference frames.
Recall that when we draw force diagrams, we only consider the forces exerted on the systemobject(s).
5.3 Reason
a) You are a passenger in a car. All of a sudden, your head jerks backwards. Explain this experiment from the reference frame of the car. Explain this experiment from the reference frame of the pavement.
b) Describe what an observer on the ground sees when you stumble on a rock or slip on a banana peel (focus on the motion of your feet and your head, assuming that the head is only loosely attached to the body). Then describe what you observe.
c) Use Newton’s first law to explain the observations of the Earth-based observer and your observations for the situation described in b. Who is in the inertial reference frame? How do you know?
d) Imagine that you have an infinitely long, smooth table covered in sand. A bowling ball is hit once so that it starts rolling on the table but stops after 2 m. After removing some of the sand and repeating the experiment, the ball stops rolling after 5 m. How far do you think the ball will roll if ALL the sand is removed?
e) If you take a ball whose mass is half of the mass of the bowling ball, how will the outcome of the last experiment change?

26 PUM | Dynamics | Lesson 5: Inertial and Non-inertial Reference FramesAdapted from A. Van Heuvelen and E. Etkina, Active Learning Guide, Addison Wesley, San Francisco, 2006© Copyright 2009, Rutgers, The State University of New Jersey.
Homework
5.4 Explain
a) Provide two examples when the forces exerted on an object of interest are balanced.
b) Choose an observer who will see this object moving with a constant velocity.
c) Now choose an observer who will see this object moving with a changing velocity.
d) Draw pictures of the same situation as seen by the two different observers. What is different about the reference frames of these two observers?
Need Some Help?
Example: A pendulum with a pendulum bob is attached to the ceiling of a car. For an observer sitting in the car, the bob instantly starts moving towards him. For an observer on the ground,the bob remains at rest but the car accelerates forward.
5.5 Represent and Reason
An elevator starts at rest on the ground floor of a building and stops at the top floor. The elevator then returns to the bottom floor. The elevator is our object of interest.
Complete the table that follows to determine how the force the supporting cable exerts on the elevator compares to the force the Earth exerts on the elevator. The motion diagram and the force diagram should be consistent with each other and with the rule relating motion and forces developed in lesson 3.
ExperimentSketch a motion
diagram.Draw a force
diagram.Check the consistency of
the diagrams.
(a) Elevator hangs at rest at the ground floor.
(b) Elevator starts moving upward with increasing speed.

PUM | Dynamics | Lesson 5: Inertial and Non-inertial Reference FramesAdapted from A. Van Heuvelen and E. Etkina, Active Learning Guide, Addison Wesley, San Francisco, 2006
© Copyright 2009, Rutgers, The State University of New Jersey.
27
(c) Elevator reaches a constant upward speed.
(d) Elevator slows as it approaches the top floor.
(e) Elevator starts moving down with increasing speed.
(f) Elevator moves down at constant speed.
(g) Elevator slows to a stop on ground floor.
Summarize what you learned about how the magnitude of the force that the supporting cable exerts on the elevator compares to the force that the Earth exerts on the elevator when the elevator moves at constant speed and changing speed.

28 PUM | Dynamics | Lesson 6: Newton’s Second Law: QualitativeAdapted from A. Van Heuvelen and E. Etkina, Active Learning Guide, Addison Wesley, San Francisco, 2006© Copyright 2009, Rutgers, The State University of New Jersey.
Lesson 6: Newton’s Second Law: Qualitative
6.1 Observe and Find a Pattern
Student A is on rollerblades and stands in front of a motion detector. The motion detector produces the velocity-versus-time graphs shown. Student B (not on rollerblades) stands behind Student A and pushes her forward. Student A starts moving. The surface is very smooth (linoleum floor).
a) Describe any patterns you see on the graph.
b) Draw a motion diagram and a force diagram for student A (1) when student B is pushing and (2) when she is not pushing. Are the diagrams consistent with each other for each time interval?
c) What is the meaning of the slope of the graph? Write a mathematical function that describes each part of one line on the graph. Write a second mathematical function that describes each part of a second line on the graph. What is the difference in the functions?
d) What can you say about the relationship between an unbalanced force exerted on an object and its acceleration?
6.2 Reason
Refer to the previous activity and graphs.
a) Why do you think student A does not stop moving when student B stops pushing?
b) Break each motion down into two parts: when student B is pushing and when student B is not pushing. What is different about the motion of student A for the three cases? What is the same?
c) Imagine that while student A is moving at a constant speed, student B starts pulling her in the direction opposite to her motion, exerting a constant force. Draw a motion diagram and a force diagram for student A and extend the existing velocity versus time graphs to represent the experiment.
d) Repeat c but imagine that student B pulls even harder in the direction opposite to student A’s motion.

PUM | Dynamics | Lesson 6: Newton’s Second Law: QualitativeAdapted from A. Van Heuvelen and E. Etkina, Active Learning Guide, Addison Wesley, San Francisco, 2006
© Copyright 2009, Rutgers, The State University of New Jersey.
29
6.3 Observe and Find a Pattern
Student A is still on rollerblades, but this time she is wearing a backpack filled with textbooks. Student B pushes Student Aseveral times; each time, student A adds three more books to the backpack. Student B pushes exerting the same force each time.
a) Use the graph to find a qualitative pattern between the change in Student A’s velocity and the amount of stuff in her backpack.
Did You Know?Mass: Mass m characterizes the amount of matter in an object and the ability of the object to change velocity in response to interactions with other objects. The unit of mass is called a kilogram (kg). Mass is a scalar quantity, and masses add as scalars.
b) What can you say about the velocity of Student A after Student B stops pushing her?
c) Does the mass of an object affect the velocity of an object or the change of velocitywhen there is a force exerted on it?
d) How does changing the mass of the object affect the acceleration of an object if the force exerted on it is the same?
6.4 Find a Relationship
Summarize how the change in the velocity of the object depends on the unbalanced force exerted on it by other objects. Then summarize how the change in the velocity of the object depends on the mass. Use the words: more, less, and constant. Now combine these two relationships into one.
6.5 Test the Relationship
a) Use the relationship you formulated in activity 6.4 to predict the shape of the velocity versus time graph for an object that is dropped
b) Use the relationship you formulated in activity 6.4 to predict the shape of the velocity versus time graph for an object that is thrown downward.
c) Explain the shape of the graphs in terms of the relationship you are testing.
d) Conduct the experiment using a motion detector. If there is no motion detector in your classroom, use the graphs provided by your teacher to compare the predictionwith the actual outcome.
e) Revise the relationship if the prediction does not match the outcome.
Did You Know?

30 PUM | Dynamics | Lesson 6: Newton’s Second Law: QualitativeAdapted from A. Van Heuvelen and E. Etkina, Active Learning Guide, Addison Wesley, San Francisco, 2006© Copyright 2009, Rutgers, The State University of New Jersey.
Two new words are used in physics to describe the processes and objects in activity 6.3. The first is “inertia”. It describes the motion of an object that does not interact with any other objects –AND – inertia also describes the motion of an object whose interactions with other objects are balanced. Only observers in “inertial reference frames” observe inertia.
The second word is “inertness”. Inertness is a property of objects that describes how hard it is to change their velocity by exerting forces on them.
6.6 Reason
Examine the graphs in activity 6.3. Discuss which parts of the graph relate to the word “inertia” and which parts relate to the word “inertness”. What is a familiar physical quantity that is a quantitative measure of inertness?
Homework
6.7 Represent and reason
Draw a velocity versus time graph for the following scenario: A bowling ball is rolling on the floor. Then a person starts pushing it very lightly in the direction opposite to the direction of motion and continues pushing for a while. Finally the person stops pushing the ball.
How many possible graphs can you draw for this scenario? Examine the effects of assumptions on your answer.
6.8 Reason
When you talk about the change in velocity of an object and the unbalanced force exerted on that object, what is the cause and what is the effect? How do you know?
6.9 Equation Jeopardy
The following system of equations describes forces exerted on an object in the vertical and in the horizontal direction. Describe two different situations that this system can describe in which the object of interest is moving in two different directions:
x direction: 12.0 N +(- 9.0 N) = 3.0 Ny direction: 20.0 N +(-20.0 N) = 0
6.10 Ranking Tasks

PUM | Dynamics | Lesson 6: Newton’s Second Law: QualitativeAdapted from A. Van Heuvelen and E. Etkina, Active Learning Guide, Addison Wesley, San Francisco, 2006
© Copyright 2009, Rutgers, The State University of New Jersey.
31
Examine the forces exerted on each object and the mass of each object. Rank the magnitude of the accelerations of the objects from largest to smallest. Each arrow represents a force exerted by some other object on the object of interest. Be sure to explain the reasoning behind your ranking.
1,000 g 200 g400 g
200 g1,000 g 500 g
A
FED
B C

32 PUM | Dynamics | Lesson 7: Newton’s Second Law: QuantitativeAdapted from A. Van Heuvelen and E. Etkina, Active Learning Guide, Addison Wesley, San Francisco, 2006© Copyright 2009, Rutgers, The State University of New Jersey.
Lesson 7: Newton’s Second Law: Quantitative
7.1 Observe and Find a Pattern
Imagine an experiment in which one or more identical springs pull one or more identical carts in the same direction on a smooth horizontal track. (The springs are stretched the same amount so that each spring exerts the same force on the cart.)
Experiment number Number of springs Number of carts Acceleration of carts1 0 1 02 1 1 1.03 m/s2
3 2 1 1.98 m/s2
4 3 1 3.03 m/s2
5 4 1 3.95 m/s2
6 1 2 0.51 m/s2
7 1 3 0.32 m/s2
8 2 2 1.02 m/s2
9 2 3 0.66 m/s2
a) Use the data table above. Draw pictures and force diagrams for the cart in Experiments 1 – 4.
Picture and Force Diagram for Experiment 1
Picture and Force Diagram for Experiment 2
Force Diagram for Experiment 3
Force Diagram for Experiment 4
b) Use the data in the table above to devise a relationship that shows how the carts’ acceleration depends on the carts’ mass and on the sum of the forces exerted on the carts by the springs, the Earth, and the track.
Need Some Help?
When doing such analysis, it is possible to devise a relationship between the dependent variable and each independent variable, one at a time. Then combine these relationships to get a final relationship.
For example, use some of the data to see how the acceleration depends on the number of springs. Then use other parts of the data to see how the acceleration depends on the number of carts.
You can also collect your own data using the video experiments if you prefer (optional):http://paer.rutgers.edu/pt3/experiment.php?topicid=3&exptid=3

PUM | Dynamics | Lesson 7: Newton’s Second Law: QuantitativeAdapted from A. Van Heuvelen and E. Etkina, Active Learning Guide, Addison Wesley, San Francisco, 2006
© Copyright 2009, Rutgers, The State University of New Jersey.
33
and http://paer.rutgers.edu/pt3/experiment.php?topicid=3&exptid=1
7.2 Observe and Find a Pattern
Imagine springs are attached to both ends of a cart. The springs can pull the cart left or right. Each spring pulls with the same strength, but the number of springs on either side of the cart can vary.
a) Examine the data in the table that follows.
ExperimentNumber of springs pulling to the right
Number of springs pulling to the left
Acceleration of the cart
1 3 3 02 1 2 –1.03 m/s2
3 3 1 1.98 m/s2
4 4 1 3.03 m/s2
5 2 6 –3.95 m/s2
b) Draw a force diagram for the cart in each experiment. Show the horizontal forces only; the upward force exerted by the surface on the cart’s wheels and the downward force exerted by the Earth on the cart balance.
Force Diagram for Experiment 1 Force Diagram for Experiment 2 Force Diagram for Experiment 3
Force Diagram for Experiment 4
Force Diagram for Experiment 5
c) Explain why there are negative signs in the acceleration column of the data table.
d) Use the data in the table above to devise a relationship between the cart’s accelerationand the sum of the forces exerted by the springs, the Earth, and the track on the cart.

34 PUM | Dynamics | Lesson 7: Newton’s Second Law: QuantitativeAdapted from A. Van Heuvelen and E. Etkina, Active Learning Guide, Addison Wesley, San Francisco, 2006© Copyright 2009, Rutgers, The State University of New Jersey.
e) Is this relationship consistent with the relationship you came up with in the previous activity? Explain.
7.3 Explain
In the two previous activities, you analyzed experiments in which the motion of an object was affected by other objects.
a) Mathematically represent the relationship between the object’s acceleration, the unbalanced force exerted on it by other objects, and its mass. Make sure that you write the relationship as a cause-effect relationship.
Need Some Help?
Think of cause-effect relationships you encounter in everyday life. For example, you set your alarm early (cause), you get to use the bathroom first (effect). Another example would be, you stub your toe on a rock (cause), your toe starts aching (effect).
Determine what variables in part a can be causes (independent variables) and what variable can be the effect (dependent variable).
b) Represent the relationship graphically. What is your dependent variable and what are your independent variables? How many graphs do you need in order to represent the relationship?
c) How does acceleration of an object depend on the unbalanced force exerted on it? How does the acceleration depend on the mass of the object?
d) What variable(s) did you hold constant in answering the questions above? Why was this necessary?
e) What does it mean if one quantity is directly proportional to another quantity? What doesit mean if it is inversely proportional? Give integer examples and draw graphs to explain your reasoning.
7.4 Test Your Idea
a) Design an experiment whose outcome you can predict using the idea that you invented in 7.3.
b) Make a list of the equipment will you need. Describe the experiment in words and with a picture.
Here’s An Idea!

PUM | Dynamics | Lesson 7: Newton’s Second Law: QuantitativeAdapted from A. Van Heuvelen and E. Etkina, Active Learning Guide, Addison Wesley, San Francisco, 2006
© Copyright 2009, Rutgers, The State University of New Jersey.
35
Use the motion of objects that you are familiar with. One possibility would be a ball thrown upward.
c) Make a prediction about the outcome of the experiment using the idea you invented in 7.3.
d) Perform the experiment and record the outcome. How does your prediction compare to the outcome? What judgment can you make about your idea?
Did You Know?In the previous lessons, you have developed and tested Newton’s Second Law of Motion.
Newton’s Second Law of Motion: We choose a particular object, or group of objects, as our system object. The acceleration
a of the system is directly proportional to the unbalanced
(net) force Fnet
rF1 on S
rF2 on S ...
rFn on S
rFn on S exerted by other objects on the system
object and inversely proportional to the mass m of the system object:
a
rFnet
mS
rFn on S
mS
Homework
7.5 Reason
When you studied kinematics, you learned that all objects fall with the same acceleration: 9.8 m/s2. Use this observational evidence and Newton’s Second Law to write a mathematical expression for the force that the Earth exerts on any object.
7.6 Reason
a) Two forces are exerted on an object in the vertical direction: a 20 N force downward and a 10 N force upward. The mass of the object is 25 kg. (1) What do you know about the motion of this object? (2) Represent the motion of the object with a force diagram and a motion diagram.
b) You pull a 20-kg sled, exerting an unbalanced, horizontal force of 30 N on it for 10 seconds. (1) What is the acceleration of the sled? (2) What is the speed of the sled after 3 seconds? (3) What force do you need to exert on the sled if you wish to keep it going at that constant velocity?
c) You hang a picture using two ropes, each at an angle of 30 with the vertical. (1) Draw a sketch of the situation. (2) Draw a force diagram for the picture. (3) If the mass of the picture is 5 kg, what is the force that each rope must exert on the picture to keep it stable? (4) How can you use trigonometry to solve the problem?

36 PUM | Dynamics | Adapted from A. Van Heuvelen and E. Etkina, Active Learning Guide, Addison Wesley, San Francisco, 2006© Copyright 2009, Rutgers, The State University of New Jersey.
7.7 Represent and Reason
Complete the table that follows. The system object is underlined.
Write a word description of the situation.
Sketch the situation and circle the system object.
Draw a force diagram; do not forget the axes. Label the forces, if needed. Draw a motion diagram.
Draw the direction of the acceleration and of the net force. Are they consistent?
Write Newton’s Second Law in component form.
An elevator pulled by a rope is slowing down on its way up.
ay TR on O (FE on O )
m
2m
s2
800 N+(-1000 N)
10 kg
Did You Know?Gravitational force: The magnitude of the gravitational force that the Earth exerts on any object near its surface equals the product of the object’s mass m and the gravitational constant g:
FE on O = m g
where g = 9.8 m/s2 = 9.8 N/kg on or near the Earth’s surface. The force points toward the center of the Earth.
30o

PUM | Dynamics | Lesson 8: Design an ExperimentAdapted from A. Van Heuvelen and E. Etkina, Active Learning Guide, Addison Wesley, San Francisco, 2006
© Copyright 2009, Rutgers, The State University of New Jersey.
37
Lesson 8: Design an Experiment
8.1 Design an Experiment
You have a spring and a set of objects of known masses. Your goal is to create a mathematical model for the spring constant, which relates the forces exerted by the spring to the stretch of the spring.
a) Design an experiment to determine the relationship between how much the spring stretches from the original unstretched position as it pulls on an object and the force that it exerts on that object.
b) Sketch the setup for your experiment and outline the plan. What instruments are you going to use?
c) What are you going to measure? What are the dependent and independent variables?
d) Perform the experiment, collect the data, and decide how you can best represent it both graphically and mathematically.
e) Represent the data and decide how you will represent the uncertainties in the measurements on your graph.
f) What pattern do you notice? How can you express the pattern mathematically? Examine the units of the slope on the graph. What information do the units give you about the spring?
Did You Know?
A spring constant is a quantity that determines the force that the spring must exert on an object in order to stretch it by 1 m from its original length. The unit of the spring constant, k, is 1 N/m.
g) What is the spring constant of your spring? How certain are you in your answer?
h) Use the rubrics below to improve your lab report.
Ability Missing An attempt Needs some improvement
Acceptable

38 PUM | Dynamics | Lesson 8: Design an ExperimentAdapted from A. Van Heuvelen and E. Etkina, Active Learning Guide, Addison Wesley, San Francisco, 2006© Copyright 2009, Rutgers, The State University of New Jersey.
8.2 Reason
A 0.5 kg object attached to a 0.5 m spring stretches it by 0.1 m. Draw a force diagram for this situation and determine the spring constant of the spring.
8.3. Design an Experiment
Attach a 100 g object to a spring scale and lift the scale slowly. Notice the reading on the scale. Can you get it to read 1 N when the object is moving? Can you get it to read more? Can you get it to read less? How were you able to achieve this?
8.4 Test an Idea
Ritesh says: “If you hang an object on a spring scale, the scale always reads how much force the Earth exerts on the object”.
Erin says: “The scale always reads the unbalanced force exerted on the object”.
a) Think of what you can do to test their opinions. Describe the experiment.
b) Make a prediction based on each of the hypotheses
c) Perform the experiment or watch the video and record the outcome: http://paer.rutgers.edu/pt3/experiment.php?topicid=3&exptid=172
Is able to record and represent data in a meaningful way
Data are absent. Data are present but impossible to understand. Units are missing.
Data are present and have units, but one needs to make a serious effort to understand the data.
Data are present, organized, and recorded clearly. A table is made.
Is able to analyze data using a graph
No graph is present.
A graph is present but the axes are not labeled. There is no scale on the axes
The graph is present and axes are labeled, but the axes do not correspond to the independent and dependent variables or the scale is not accurate.
The graph has correctly labeled axes. The independent variable is along the horizontal axis and the scale is accurate.
Is able to construct a mathematical (if applicable) relationship that represents a trend in the data
No attempt is made to construct a relationship that represents a trend in the data.
An attempt is made, but the relationship does not represent the trend.
The relationship represents the trend but no analysis of how well it agrees with the data is included (if applicable), or some features of the relationship are missing.
The relationship represents the trend accurately and completely and an analysis of how well it agrees with the data is included (if applicable).

PUM | Dynamics | Lesson 8: Design an ExperimentAdapted from A. Van Heuvelen and E. Etkina, Active Learning Guide, Addison Wesley, San Francisco, 2006
© Copyright 2009, Rutgers, The State University of New Jersey.
39
d) Make a judgment about each person’s hypothesis. What can you say the scale measures?
Did You Know?
Elastic force: An object that stretches or compresses like a spring exerts an elastic force on some other object that is causing it to stretch or compress. The elastic force exerted by the spring on that object points in the direction opposite to the stretch (or compression). The magnitude of the force is directly proportional to the distance x that the elastic object (spring) is stretched or compressed from its equilibrium position (at x = 0):
FS on O= k x
The force constant k in units N/m is a measure of the stiffness of the spring (the ratio of the force in N needed to stretch the spring 1 m).
Homework
8.5 Reflect
Make a list of things you learned from the lab activity above with the springs. How did you learn each?
8.6 Reason
Calculate the relative uncertainties of your scale measurements. When was your knowledge about the force more accurate?
Need Some Help?Recall from kinematics that when you measure a quantity and the measurement is small, the uncertainty is a big percentage of the measurement. When the measurement is large, the uncertainty is a smaller percentage of the measurement.
The relative uncertainty is the fraction of the measurement due to the uncertainty.
For example, when the measurement is 2 N and the uncertainty is 0.5 N, the relative uncertainty becomes 0.5/2 = 0.4 or 40%. When the measurement is 15 N and the uncertainty is 0.5 N, the relative uncertainty is 0.5/15 = 0.3 or 30%.
Therefore for the accuracy of measurement with a particular instrument, we want to measure quantities that are large.
8.7 Reason
What is the uncertainty in your parents’ car speedometer? When is the measurement of the speed more accurate: driving in the city or on a highway? Explain.

40 PUM | Dynamics | Lesson 8: Design an ExperimentAdapted from A. Van Heuvelen and E. Etkina, Active Learning Guide, Addison Wesley, San Francisco, 2006© Copyright 2009, Rutgers, The State University of New Jersey.
8.8 Reason
If you are to stand on a scale in a very powerful elevator in a very tall building, what might happen to the scale reading as the elevator takes you from the 1st floor to the 42nd floor? Use force diagrams, motion diagrams, and Newton’s Second Law to explain your answer.

PUM | Dynamics | Lesson 9: Applying Newton’s Second LawAdapted from A. Van Heuvelen and E. Etkina, Active Learning Guide, Addison Wesley, San Francisco, 2006
© Copyright 2009, Rutgers, The State University of New Jersey.
41
Lesson 9: Applying Newton’s Second Law
Problem-Solving Strategy for Dynamics Problems
Sketch and Translate:• Sketch the situation described in the problem; include all known information.• Choose a system object and make a list of objects that interact with the system.• Indicate the direction of acceleration, if you know it.Simplify and Diagram:• Consider the system as a particle. • Decide if you can ignore any interactions of the environment with the system object. • Draw a force diagram for the system. Label the forces with two subscripts. Make sure the diagram is consistent with the acceleration of the system object (if known). Include perpendicular x- and y-coordinate axes.Represent Mathematically:• Apply Newton’s Second Law in component form to the situation you represented in the force diagram. • Add kinematics equations if necessary. Solve and Evaluate:• Solve the equations for an unknown quantity and evaluate the results to see if they are reasonable (the magnitude of the answer, its units, how the solution changes in limiting cases, and so forth).
Need Some Help?
Here is an example that applies the strategy shown above: A 5-kgobject (the Earth exerts a 50 N force on it) is lifted by a cable that exerts a 100 N force on it. Calculated the acceleration of the object.
Translate: The object is our system; the Earth and the cable interact with the object. The acceleration is up.
Simplify and Diagram: In this case there are two forces exerted on the object – one exerted by the cable and one exerted by the Earth. We choose the positive axis to be down.
Represent Mathematically: Newton’s second law in component form: aO y FC on O y FE on O y
mO
Solve and Evaluate: The component of the force exerted by the cable is negative as the force points in the negative direction, the component of the force exerted by the Earth is positive. Thus
aO y (70 N) 50 N
5 kg (4 N/kg) = (-4 m/s2 ) . The negative sign of acceleration means that it is
pointed upward – the elevator is accelerating in the upward direct (not necessarily moving in the upward direction, it can be slowing down).
FC on O
FE on O
y

42 PUM | Dynamics | Lesson 9: Applying Newton’s Second LawAdapted from A. Van Heuvelen and E. Etkina, Active Learning Guide, Addison Wesley, San Francisco, 2006© Copyright 2009, Rutgers, The State University of New Jersey.
9.1 Represent and Reason
Description of the object of interest is underlined
A Sketch the situation.Circle the object of interest.Draw the direction of the acceleration, if known.
BTranslate the givens into physical quantities.
C Draw a force diagram for the object of interest.
D Can you evaluate any of the forces in the force diagram?
Which are negative and which are positive?
E Write Newton’s Second Law in component form.
Fill in anything you know and solve for anything you do not know.
1) A 2.2 kg bucket of clams sits at rest on a desk.
Given in description:a = 0 (sits )m = 2.2kg
FE on B y = -mg=-22 N
ay F
Earth on Bucket y F
Table on Bucket y
m
0 (22N) F
Table on Bucket
2.2kg
2) A 5kg bucket of clams hangs motionless from a spring that stretches 40 cm.
3) A man pulls a 40kg refrigeratorup an elevator shaft with a rope at a constant speed.Come up with your own for an object in equilibriumwith 3 or more other objects interactingwith it.

PUM | Dynamics | Lesson 9: Applying Newton’s Second LawAdapted from A. Van Heuvelen and E. Etkina, Active Learning Guide, Addison Wesley, San Francisco, 2006
© Copyright 2009, Rutgers, The State University of New Jersey.
43
9.2 Regular Problem
In a grocery store, you push a 14.5 kg shopping cart. It is initially rolling at a constant speed of 2 m/s. You push on it in the direction opposite to its motion exerting a force of 12 N.
a) Draw a force diagram and a motion diagram for the cart when you start pushing in the direction opposite to its motion.
b) Assuming you push the cart exerting constant force for a while, how far will it travel in 3 seconds? (Ignore friction for all parts of this problem.) Use the problem-solving strategy steps illustrated above.
9.3 Design an Experiment
a) Describe an experiment that you can design to test Newton’s Second Law. Decide on what aspect of the law you can test.
b) Brainstorm different possibilities and decide which ones are the best. Think of the criteria for choosing the best experiment.
d) What equipment will you need? What data will you collect?
a) What is your prediction about the relationships in the data based on Newton’s Second Law?
b) What is the difference between Newton’s Second Law and the predictions?

44 PUM | Dynamics | Lesson 9: Applying Newton’s Second LawAdapted from A. Van Heuvelen and E. Etkina, Active Learning Guide, Addison Wesley, San Francisco, 2006© Copyright 2009, Rutgers, The State University of New Jersey.
Homework
9.4 Practice
Fill in the table below. The system object is underlined.
Description of the object of interest is underlined
A Sketch the situation.Circle the object of interest.Draw a motion diagram and the direction of the acceleration,if known
BTranslate the givens into physical quantities.
C Draw a force diagram for the object of interest.
D Can you evaluate any of the force components in the force diagram? Which are negative and which are positive? What if you changed the direction of the axes?
E Write Newton’s Second Law in component form.
What can you determine using the information in the problem?
1) A 72 kg crate on a freight elevator accelerates upwards at a rate of 0.2 m/s2 while moving down.
2) A 172 kg crate on a freight elevator accelerates downwards at a rate of 0.4 m/s2
while moving up.
3) A physics teacher of mass m is holding onto a rope attached to a hot air balloon and is accelerating upwards at am/s2.

PUM | Dynamics | Lesson 10: Newton’s Third Law: QualitativeAdapted from A. Van Heuvelen and E. Etkina, Active Learning Guide, Addison Wesley, San Francisco, 2006
© Copyright 2009, Rutgers, The State University of New Jersey.
45
Lesson 10: Newton’s Third Law: Qualitative
10.1 Observe and Explain
Student A and Student B both wear rollerblades or are on chairs with wheels. Student B pushes Student A abruptly. If you are not observing the real-life experiment, watch the video experiments: http://paer.rutgers.edu/pt3/experiment.php?topicid=3&exptid=36 and http://paer.rutgers.edu/pt3/experiment.php?topicid=3&exptid=37
a) Observe what happens during the instant of the push to both students, and describe your observations in words.
b) Draw motion diagrams and force diagrams for each student for the instant when B pushes A. Use the diagrams to explain the observations.
c) Why didn’t Student B’s velocity change in activities 6.1 and 6.3? Explain using force diagrams.
10.2 Test your Idea
Use Newton’s Second Law and the explanation that you devised in the previous activity to predict what will happen if Students A and B, both on rollerblades, start throwing a heavy medicine ball back and forth to each other. If you have the equipment, perform the experiment and then check whether your prediction matches the outcome. You can also watch the video of the experiment at: http://paer.rutgers.edu/pt3/experiment.php?topicid=3&exptid=30
a) What was your hypothesis?
b) Where did the hypothesis come from?
c) What was your prediction?
d) Did the outcome of the experiment prove the hypothesis to be right or fail to disprove it?
10.3. Apply
Examine a fan cart on your desk. Turn on the fan and observe its motion. Draw a motion diagram for the cart and decide what object exerts the force to accelerate the cart. Use the sail on your desk to test your answer. Record all your observations and the testing experiment very carefully.

46 PUM | Dynamics | Lesson 10: Newton’s Third Law: QualitativeAdapted from A. Van Heuvelen and E. Etkina, Active Learning Guide, Addison Wesley, San Francisco, 2006© Copyright 2009, Rutgers, The State University of New Jersey.
Homework
10.4 Represent and Reason
Fill in the empty spaces and draw pictures representing the situations. Place force arrows on the pictures; remember to think about the lengths of the arrows.
a) When the Earth exerts a force on the book, the book exerts a force on __________
b) When a table exerts a force on the book, the book exerts a force on _________
c) When a tennis racket exerts a force on the ball, the ball exerts a force on_________
d) When car tires push back on the Earth’s surface, the Earth’s surface _________
10.5 Relate
List 5 everyday experiences that support the idea that when object B exerts a force on object A, object A will simultaneously exert a force on object B. Discuss whether you can always observe the effects of these forces that the interacting objects exert on each other. List possible reasons.

PUM | Dynamics | Lesson 11: Newton’s Third Law: QuantitativeAdapted from A. Van Heuvelen and E. Etkina, Active Learning Guide, Addison Wesley, San Francisco, 2006
© Copyright 2009, Rutgers, The State University of New Jersey.
47
Lesson 11: Newton’s Third Law: Quantitative
11.1 Observe and Find a Pattern
The goal of this experiment is to determine a mathematical relationship between the force that object A exerts on object B and the force that object B exerts on object A when they are interacting with each other.
Available Equipment: Force probe sensors with hooks on the end and computers.
Note on equipment: You will be using a new sensor for this experiment; it is called a force probe. A force probe is a sensor that sends a signal to the computer indicating the force exerted on its tip. The software interface helps you plot force as a function of time for two different force probes.
a) Take one of the probes, connect it to the computer, and gently pull or push on it. Examine the graph on the screen and make sure it makes sense to you.
Need Some Help?
The force probe is an object. You exerted a force on this object, and this force was recorded as a function of time.
b) Design and perform enough experiments to find a pattern in the readings of the two probes when they record forces that two interacting objects exert on each other.
Here’s An Idea!
Place one force probe on the table and tap it gently with the second probe. The probes are very delicate, and if you use them to tap each other, you must do it lightly. Even a light tap will register on the graph.
c) Write a short report, summarizing the experiments and your findings. For your report, be sure to include the following:
1) For each experiment, describe the setup in words and sketch the graphs that you see on the computer.
2) Find a pattern in the pairs of graphs representing the force-versus-time functions recorded by each probe during an interaction.
3) Formulate a tentative rule relating the force that object A exerts on object B to the force that the object B exerts on the object A.
4) Use the observational experiment rubric and data analysis rubric to write your report about this experiment.

48 PUM | Dynamics | Lesson 11: Newton’s Third Law: QuantitativeAdapted from A. Van Heuvelen and E. Etkina, Active Learning Guide, Addison Wesley, San Francisco, 2006© Copyright 2009, Rutgers, The State University of New Jersey.
11.2 Test Your Hypothesis
Available Equipment: Force probe sensors with hooks on the end, a track, carts, objects of different masses to put on the carts, cushions, elastic bands, and computers.
a) State the rule you are going to test which you devised in 11.1.
b) Brainstorm a list of possible experiments whose outcome can be predicted with the help of the rule. Choose two experiments from your list.
c) Briefly describe your chosen design. Include a labeled sketch.
d) Use the tentative rule to make a prediction about the outcome of each experiment.
e) Perform each experiment. Record the outcome.
f) Does the outcome support the prediction? Explain.
g) Based on the prediction and the outcome of the experiments, what is your judgment about the rule?
h) Think of the assumptions that you used to make the predictions for the testing experiments. How could these assumptions have affected your judgment?
i) Talk to your classmates in other lab groups and find out about their results. Are they consistent with yours?
j) Use the testing experiment rubric to write your report.
11.3 Reason
Use the rule that you devised and tested to decide who exerts a larger force for the following situations:
1. A mosquito on a car’s windshield or a car’s windshield when a mosquito smashes into it;
2. A reflex hammer (Taylor hammer) on your knee or your knee on the hammer when a doctor taps your knee with it.
Reconcile your answers with your observations of these phenomena.
Did You Know?
Newton’s Third Law of Motion: When two objects interact, object 1 exerts a force on object 2. Object 2 in turn exerts an equal-magnitude, oppositely directed force on object 1:
F1 on 2
rF2 on 1 . Each force above is caused by one object and is exerted on another object. Since
these two forces are exerted on two different objects, they cannot be added to find a net force.

PUM | Dynamics | Lesson 11: Newton’s Third Law: QuantitativeAdapted from A. Van Heuvelen and E. Etkina, Active Learning Guide, Addison Wesley, San Francisco, 2006
© Copyright 2009, Rutgers, The State University of New Jersey.
49
Homework
11.4 Reason
a) A book sits on the tabletop. What is the Newton’s Third Law pair for the force that the Earth exerts on the book?
b) If the Earth exerts a 5 N force on the book, what is the force that the book exerts on the Earth?
c) What is the acceleration of the book if the Earth is the only object exerting a force on it?
d) Why does the book fall onto the Earth but the Earth does not fall onto the book? The mass of the Earth is 6.00 x 1024 kg.
Need Some Help?
Use the Earth’s mass to calculate the Earth’s acceleration. What does this tell you about the motion of the Earth?
e) The Sun’s mass is 2.00 x 1030 kg. It pulls on the Earth, exerting a force of about 1020 N. What is the force that the Earth exerts on the Sun?
11.5 Reason
Two students sit on office chairs with wheels. Student A pushes student B away from him. Student B does nothing. Does student B exert the force on A? How do you know?
11.6 Reason
a) You hit a stationary puck with a hockey stick. The stick exerts a 100 N horizontal force on the puck. What is the force exerted by the puck on the stick? How do you know?
b) A truck rear ends a small sports car that is moving in the same direction as the truck. The collision makes the truck slow down and the sports car is propelled forward. What object exerts a larger force on the other object: the truck on the car or the car on the truck. Explain how your answer reconciles with Newton’s third law and with the fact that the sports car is damaged more than the truck.
c) The Earth pulls on an apple exerting a 1.0 N force on it. What is the force that the apple exerts on the Earth? Why does the apple fall towards the Earth but the Earth does not move towards the apple?
d) The tree branch exerts a 1.0 N force holding the apple. What is the force that the apple exerts on the tree branch?
11.7 Reason

50 PUM | Dynamics | Lesson 11: Newton’s Third Law: QuantitativeAdapted from A. Van Heuvelen and E. Etkina, Active Learning Guide, Addison Wesley, San Francisco, 2006© Copyright 2009, Rutgers, The State University of New Jersey.
Use Newton’s third law to predict what will happen if you try to open a door wearing rollerblades. Draw a force diagram for yourself to help make the prediction.
11.8 Represent and Reason
Your friend says that if Newton’s third law is correct, no object would ever start moving. Here is his argument: “You pull a sled exerting a 50 N force on it. According to Newton’s third law the sled exerts the force of 50 N on you in the opposite direction. The total force is zero, thus the sled should never start moving. But it does. Thus Newton’s third law is wrong.”
What is your opinion about this answer? How can you convince your friend of your opinion?
11.9 Reason
The Moon orbits the Earth because the Earth exerts a force on it. The Moon, therefore, has to exert a force on the Earth. What is the visible result of this force?
11.10 Regular Problem
A person of mass m is standing on the floor of an elevator that starts from the first floor and reaches the 21st floor.
a) Make two kinematics models for the motion of the elevator. Describe them in words. What is the same about the two models? What is different?
b) Now describe the same models with motions diagrams, with position, velocity and acceleration versus time graphs, and with algebraic functions.
c) Choose one of the models and draw force diagrams for the person for three different parts of the trip.
d) Write a mathematical expression that will help you determine the magnitude of the force that the person exerts on the floor when the acceleration of the elevator is upward and again when the acceleration is downward. What is a reasonable magnitude for the elevator’s acceleration?
e) Who is pushing harder – the elevator’s floor on the person or the person on the floor? The Earth on the person or the floor on the person?

PUM | Dynamics | Lesson 12: Two-Body ProblemsAdapted from A. Van Heuvelen and E. Etkina, Active Learning Guide, Addison Wesley, San Francisco, 2006
© Copyright 2009, Rutgers, The State University of New Jersey.
51
Lesson 12: Two-Body Problems
12.1 Represent and Reason
1 2
You push two crates that have different masses on a smooth surface. Fill in the table that follows for the two situations. Use the rule that relates the forces that two objects exert on each other while interacting (devised in lesson 11).
Situation 1: You push crate 1, which pushes against the smaller crate 2.
Situation 2: You now reverse the positions of the crates and push crate 2, which pushes on larger crate 1.
(a) You push crate 1. Show the force that 2 exerts on 1. Show the force that 1 exerts on 2.
(b) You push crate 2. Show the force that 1 exerts on 2. Show the force that 2 exerts on 1.
c) Based on the diagrams in (a) and (b), should it be easier to push the crates in one situation than the other? Explain.
d) Is your answer to (c) consistent with Newton’s Third Law?
e) Calculate the sum of the forces from part (a), the force crate 1 exerts on crate 2 and the force crate 2 exerts on crate 1. How does this compare to the sum of these forces for part (b)? What does this imply about the magnitude of the force of one crate on the other and vice versa?
12.2 Represent and Reason
This time, instead of pushing two crates, you connect them with a rope and attach another rope to crate 1. You pull this second rope horizontally, exerting a force Fyou on crate1. The masses of the crates are m1 and m2.
a) Find the acceleration of the crates. Decide what assumptions you need to make to solve this problem. Follow the problem-solving strategy.
b) Find the force that the rope connecting the two crates exerts on crate 2. Again, be sure to follow the problem-solving strategy.
21
2 1

52 PUM | Dynamics | Lesson 12: Two-Body ProblemsAdapted from A. Van Heuvelen and E. Etkina, Active Learning Guide, Addison Wesley, San Francisco, 2006© Copyright 2009, Rutgers, The State University of New Jersey.
12.3. Test your ideas
a) Examine the experimental setup in the video experiment at:http://paer.rutgers.edu/pt3/experiment.php?topicid=3&exptid=105
b) Before watching the video predict how much each object in the video will move in 1 second. (Based on Newton’s 2nd Law) Your prediction should contain an uncertainty value with it. Make sure you follow the problem-solving strategy closely and list all of your assumptions.
c) How might the result be different from your prediction if the assumptions are not valid?
Homework
12.3 Continued
Perform the experiment (watch the video) and record the outcome.
Clearly describe of how you found whether the prediction matched the outcome of the experiment.
What can you say about Newton’s Laws based on this experiment?
12.4 Represent and reason
A person pulls on a rope, which in turn pulls a crate across a horizontal rough surface, as shown below.
Three motion diagrams for the crate are shown below (with v arrows only). In the table that follows, construct a force diagram for the crate. Check the consistency of your motion diagrams and force diagrams.
(a) (b) (c)
(a) (b) (c)

PUM | Dynamics | Lesson 12: Two-Body ProblemsAdapted from A. Van Heuvelen and E. Etkina, Active Learning Guide, Addison Wesley, San Francisco, 2006
© Copyright 2009, Rutgers, The State University of New Jersey.
53
12.5 Represent and Reason
Examine the system on the right. Jon says that the force the rope exerts on the cart is always equal to m1 g. Why would Jon have such an opinion? Do you agree or disagree? Explain your answer.
12.6 Reason
You use the setup described in activity 12.5. You first hold the cart with your hand so the system is at rest. Then you abruptly push the cart to the left and let it go. Describe the motion of the cart in words after you let it go. Explain the motion using force diagrams for both the cart and the hanging object. Then sketch the acceleration versus time graph for the cart.
m1

54 PUM | Dynamics | Lesson 13: Design an ExperimentAdapted from A. Van Heuvelen and E. Etkina, Active Learning Guide, Addison Wesley, San Francisco, 2006© Copyright 2009, Rutgers, The State University of New Jersey.
Lesson 13: Design an Experiment
13.1 Design an Experiment
You have helium balloons and air balloons at your disposal. You can attach different objects to the balloons.
a) Decide what questions you can investigate using one or both balloons. Brainstorm a list of questions.
b) Decide which one you and your group can perform with the equipment available.
c) Decide what you need to know more about in order to pursue the question.
d) Make a sketch of the experimental design and list the physical quantities that you plan to measure.
e) Are you going to conduct an observational experiment or a testing experiment? If it is a testing experiment, make sure that you outline the hypothesis being tested and the prediction of the outcome of the experiment based on the hypothesis. If you cannot make a prediction, you should consider whether you are actually doing a testing experiment.
f) Perform the experiment, record your data, represent the data, and perform necessary calculations. Do not forget about the uncertainties when you are presenting the final results.
g) Write a report about your investigation. Include sketches of the equipment, motiondiagrams and force diagrams if necessary, tables of data, graphs, and your findings,including the uncertainties. Make sure that the report is clear enough that a person who has not seen the experiment can repeat it.
h) Use the rubrics to improve your report.

PUM | Dynamics | Lesson 13: Design an ExperimentAdapted from A. Van Heuvelen and E. Etkina, Active Learning Guide, Addison Wesley, San Francisco, 2006
© Copyright 2009, Rutgers, The State University of New Jersey.
55
Ability Absent An attempt Needs some improvement
Acceptable
Is able to formulate the question to be investigated
The question to be investigated is not mentioned.
The question is posed but it is not clear.
The question is posed but it involves more than one variable.
The question is posed and it involves only one variable.

56 PUM | Dynamics | Lesson 13: Design an ExperimentAdapted from A. Van Heuvelen and E. Etkina, Active Learning Guide, Addison Wesley, San Francisco, 2006© Copyright 2009, Rutgers, The State University of New Jersey.
Homework
13.2 Finish Your Report
In the next class, you will need to evaluate one of your classmate’s report and your classmate will evaluate yours. Make a list of necessary elements that you will look for in your classmate’s report.
Is able to design an experiment to answer the question
The experiment does not answer the question.
The experiment is related to the question but will not help answer it.
The experiment investigates the question but might not produce the data to find a pattern.
The experiment investigates the question and might produce the data to find a pattern.
Is able to decide what is to be measured and identify independent and dependent variables
It is not clear what will be measured.
It is clear what will be measured, but independent and dependent variables are not identified.
It is clear what will be measured, and independent and dependent variables are identified but the choice is not explained.
It is clear what will be measured and independent and dependent variables are identified and the choice is explained.
Is able to use available equipment to make measurements
At least one of the chosen measurements cannot be made with the available equipment.
All chosen measurements can be made, but no details are given about how it is done.
All chosen measurements can be made, but the details of how it is done are vague or incomplete.
All chosen measurements can be made and all details of how it is done are clearly provided.
Is able to describe what is observed in words, pictures and diagrams.
There is no description of what was observed.
A description is mentioned but it is incomplete. No picture is present.
A description exists, but it is mixed up with explanations or other elements of the experiment. A labeled picture is present.
Clearly describes what happens in the experiments both verbally and by means of a labeled picture.
Is able to construct a mathematical (if applicable) relationship that represents a trend in data
No attempt is made to construct a relationship that represents a trend in the data.
An attempt is made, but the relationship does not represent the trend.
The relationship represents the trend but no analysis of how well it agrees with the data is included (if applicable), or some features of the relationship are missing.
The relationship represents the trend accurately and completely and an analysis of how well it agrees with the data is included (if applicable).

PUM | Dynamics | Lesson 14: FrictionAdapted from A. Van Heuvelen and E. Etkina, Active Learning Guide, Addison Wesley, San Francisco, 2006
© Copyright 2009, Rutgers, The State University of New Jersey.
57
Lesson 14: Friction
14.1 Observe and Find a Pattern
Perform the following experiment: Rest a wooden block (or some other object, like your shoe) on a table. Attach a large spring scale to a string attached to the front of the block. Pull the scaleharder and harder. Notice what happens to the scale reading while the block does not move. Notice the reading right before the block starts moving and right after. Keep the block moving but not accelerating.
a) Fill in the table that follows by constructing a force diagram for the block (the system) for these five situations.
The block sits on the table with no scale pulling it.
The spring pulls on the block, which does not start moving.
The spring pulls harder, but the block still does not move.
The spring pulls on the block, and the block is just about to start moving.
The spring pulls the block at a slow, constant velocity.
b) Describe in words how the magnitude of the force that the table’s surface exerts on the block varies with the force exerted by the spring pulling on the block.
c) Compare the magnitude of the force just before the block starts moving to the magnitudewhen it is moving at a constant velocity. What do you observe?
d) What object is exerting this friction force for the scenarios given above?
e) Summarize your findings for the friction force exerted on an object at rest and on the same object moving at a constant velocity.
Did You Know?
The friction force is a resistive force exerted by the surface on an object. There are two kinds offriction forces you observed in the experiments above. The static friction force is variable. As you saw, once the maximum static friction force is overcome, the object will start to move. The kinetic friction force is the resistive force exerted on a moving object.

58 PUM | Dynamics | Lesson 14: FrictionAdapted from A. Van Heuvelen and E. Etkina, Active Learning Guide, Addison Wesley, San Francisco, 2006© Copyright 2009, Rutgers, The State University of New Jersey.
14.2 Observe and Find a Pattern
Instead of the block in the previous activity, you have rectangular blocks with different surface areas and different types of surfaces on which the block slides horizontally.
The force that the string exerts on the block (as measured by the spring scale reading) when the block just starts to slide is recorded in the table that follows. This force is equal in magnitude to the maximum static friction force (as we discovered in the previous activity). Examine the data in the table that follows.
Mass of the block Surface areaQuality ofsurfaces
Maximumstatic friction force
1 kg 0.1 m2 Medium smooth 3.1 N1 kg 0.2 m2 Medium smooth 3.0 N1 kg 0.3 m2 Medium smooth 3.1 N1 kg 0.1 m2 A little rougher 4.2 N1 kg 0.1 m2 Even rougher 5.1 N1 kg 0.1 m2 Roughest 7.0 N
Now decide how the maximum static friction force that the surface exerts on the block depends on the surface area of the block and on the roughness of the two surfaces.
14.3 Observe and Find a Pattern
A spring scale pulls a 1 kg block over a medium smooth surface. The reading of the scale can be used to determine the magnitude of the maximum static friction force—in this instance, the force when the block starts to slide. In some experiments, a compressible spring also pushes vertically down on the block (see the second block).
Use the data in the table to draw a graph of the maximum static friction force versus the normal force the surface exerts on the block.
Extra downward force exerted on the 1-kg block
Normal force exerted by the board on the block
Maximumstatic friction force
0 N 10 N 3 N5 N 15 N 4.5 N10 N 20 N 6 N20 N 30 N 9 N
1 kg 1 kg
Spring pushes

PUM | Dynamics | Lesson 14: FrictionAdapted from A. Van Heuvelen and E. Etkina, Active Learning Guide, Addison Wesley, San Francisco, 2006
© Copyright 2009, Rutgers, The State University of New Jersey.
59
b) Express mathematically a relationship between the normal force and the maximum static friction force.
14.4. Test your idea
Design an experiment to test that the magnitude of the maximum static friction force is equal to fs surface on object Nsurface on object . Describe what you will do, what data you will collect and
what the predicted outcome should be if the expression is correct. Then perform the experiment and make a judgment about the hypothesis.
14.5 Reason
a) Take a textbook and drag it with your pinky finger. Repeat but this time have your neighbor push down lightly on the book. Repeat 3 more times with your neighbor pushing down successively harder. Draw a force diagram for each case. What can you say about the maximum static friction force?
b) Consider the previous activity. Why would we consider the normal force exerted on the object rather than the force of the Earth exerted on the object?
c) A person is holding a book against a vertical wall, pushing on it horizontally. The book is at rest. Draw a force diagram for the book. Check if all forces balance. Which force prevents the book from falling down? Why, if you do not push on the book hard enough, does the book start falling?
Did You Know?
Normal force: When two objects touch each other, they exert a normal force on each other. The force of the one object on the other object points perpendicular to the surface of contact. Often one symbol N is used to denote this force (do not confuse with the Newton, N). There is no equation for calculating the normal force. Its magnitude must be determined for each situation by some other method.
Static friction force: When two objects touch each other, they exert a friction force on each other. The friction force of the one object on the other object points parallel to the surfaces of contact. If the objects are not moving with respect to each other, the friction force that they exert on each other is static. The static friction force between two surfaces opposes the tendency of one surface to move across the other and provides flexible resistance (as much as is needed) to prevent motion—up to some maximum value. This maximum static friction force depends on the relative roughness of the surfaces (on the coefficient of static friction µs
between the surfaces) and on the magnitude of the normal force N between the surfaces. The magnitude of the static friction force is always less than or equal to the product of these two quantities:
Fs surface on object sN

60 PUM | Dynamics | Lesson 14: FrictionAdapted from A. Van Heuvelen and E. Etkina, Active Learning Guide, Addison Wesley, San Francisco, 2006© Copyright 2009, Rutgers, The State University of New Jersey.
Kinetic friction force: The kinetic friction force between two surfaces is exerted parallel to the surfaces and opposes the motion of one surface relative to the other surface. The kinetic friction force depends on the relative roughness of the surfaces (on the coefficient of kinetic friction µk) and on the magnitude of the normal force N between the surfaces:
Fk surface on object k N
Homework
14.6 Observe and Represent
Imagine that you could watch yourself walk in slow motion. Analyze your steps in terms of the force of friction that the floor exerts on your foot and in terms of Newton’s Second and Third Laws. In order to do this, break the step into two parts: (1) when you put the foot down to finish up the previous step, and (2) when you are pushing off the floor to start a new step. Draw force diagrams to represent your reasoning.
14.7 Evaluate
Jamie says that the force of friction is something that we should reduce in order to make the cars go faster. What friction force could she mean? Do you agree or disagree with her opinion? If you agree, how would you argue for it? If you disagree, how would you argue against it?
14.8 Represent and Reason
Some students are trying to move a heavy desk across the room. Diana pushes it across the floor at the same time that Omar and Jeff pull on it. Omar pulls on the desk, exerting a (-150)N force, and Jeff pulls exerting a (-125) N force. There is also a (-200) N friction force exerted by the floor on the desk. The net force exerted on the desk is 27 N.
a) Make a sketch of the situation.
b) Draw a force diagram for the desk. Draw a motion diagram.
c) Write an algebraic statement that describes the force diagram you drew.
d) How hard is Diana pushing?
e) Is the desk moving with a constant velocity or is it speeding up? How do you know?
f) What would happen if, after a few seconds, the boys stopped pulling?

PUM | Dynamics | Lesson 14: FrictionAdapted from A. Van Heuvelen and E. Etkina, Active Learning Guide, Addison Wesley, San Francisco, 2006
© Copyright 2009, Rutgers, The State University of New Jersey.
61
Additional Problems and Exercises
I. Complete the diagrams below.
Label the motion diagrams with the appropriate labels.Label the forces in the force diagrams.
Motion Diagrams Force Diagrams
II. For each of the force diagrams identify the motion diagrams and force diagrams that describe the same situations. For each force diagram-motion diagram combination, tell a story about what that they could be representing. An example is done for you. Be creative!
A.
B.
C.
· · · · · ·
· ·· ·
· ·· ·
··· ·
·· · ·
· · · ·· ·
·
1.
2.
3.
4.
5.
6.
7.

62 PUM | Dynamics | Adapted from A. Van Heuvelen and E. Etkina, Active Learning Guide, Addison Wesley, San Francisco, 2006© Copyright 2009, Rutgers, The State University of New Jersey.
Force Diagram Motion Diagram
#
Story
5 Example: Kids were being pulled by their cousin on a sled to the right in wet snow. The youngest one was scared and wanted to slow down, so the cousin now pulls less hard, letting the snow slow them down. The downward force is the FEarth on sled and the upward force is Fground on sled The force to the left is the Fsnow on sled and the force to the right is Fcousin on
sled
III. Pick one story for each of the three force diagrams and write a problem that includes numbers. Then solve the problem.
A.
B.
C.

PUM | Dynamics | Lesson 15: Putting It All TogetherAdapted from A. Van Heuvelen and E. Etkina, Active Learning Guide, Addison Wesley, San Francisco, 2006
© Copyright 2009, Rutgers, The State University of New Jersey.
63
Lesson 15: Putting It All Together
15.1 Reason
You stand on a bathroom scale that reads 712 N (160 lb) (You can use your own weight in newtons in this problem if you wish). You place the scale on an elevator floor and stand on thescale. a) What does it read at the beginning of the ride when the elevator accelerates up at 2.0 m/s2? b) What does the scale read when the elevator continues to move up at a constant speed of 4.0 m/s? c) What does it read at the end of the ride when the elevator slows down at a rate of magnitude 2.0 m/s2?
15.2 ReasonDescribe in words a problem for which the following equation is a solution and draw the force diagram that is consistent with the equation (specify the direction of the axis):
(30 kg)(–1.0 m/s2 ) = 100 N – fS on O
15.3 Reason Explain the whiplash phenomenon from the point of view of an observer on the ground and an observer in the car.
15.4 ReasonYou push a bowling ball along a bowling alley. Draw force diagrams for the ball: (a) just before you let it go; (b) when the ball is rolling along the alley; (c) as the ball is hitting a pin. (d) For each force exerted on the ball in parts (a)-(c), draw to the side the Newton’s third law pair force and indicate the object on which these third law forces are exerted.
15.5 Reason James Steward, 2002 Motocross/Supercross Rookie of the Year, is leading the race when he runs out of gas near the finish line. He is moving at 16 m/s when he enters a section of the course covered with sand where the effective coefficient of friction is 0.90. Will he be able to coast through this 15-m long section to the finish line at the end? If yes, what is his speed at the finish line? What assumptions did you have to make to solve this problem?
15.6 Reason According to Auto Week magazine, a Chevrolet Blazer traveling at 60 mph (97 km/h) can stop in 48 m on a level road. Determine the coefficient of friction between the tires and the road. Do you think this is coefficient of kinetic or static friction? Explain.

64 PUM | Dynamics | Lesson 15: Putting It All TogetherAdapted from A. Van Heuvelen and E. Etkina, Active Learning Guide, Addison Wesley, San Francisco, 2006© Copyright 2009, Rutgers, The State University of New Jersey.
15.7 Reason A 50-kg box rests on the floor. The coefficients of static and kinetic friction between the bottom of the box and the floor are 0.70 and 0.50, respectively. (a) What is the minimum force a person needs to exert on it to start the box sliding? (b) After the box starts sliding, the person continues to push it exerting the same force. What will happen to the box? Answer this question quantitatively.
15.8 ReasonA wagon is moving to the right faster and faster. A book is pressed against the back vertical side of the wagon and does not slide down. Explain how this can be.
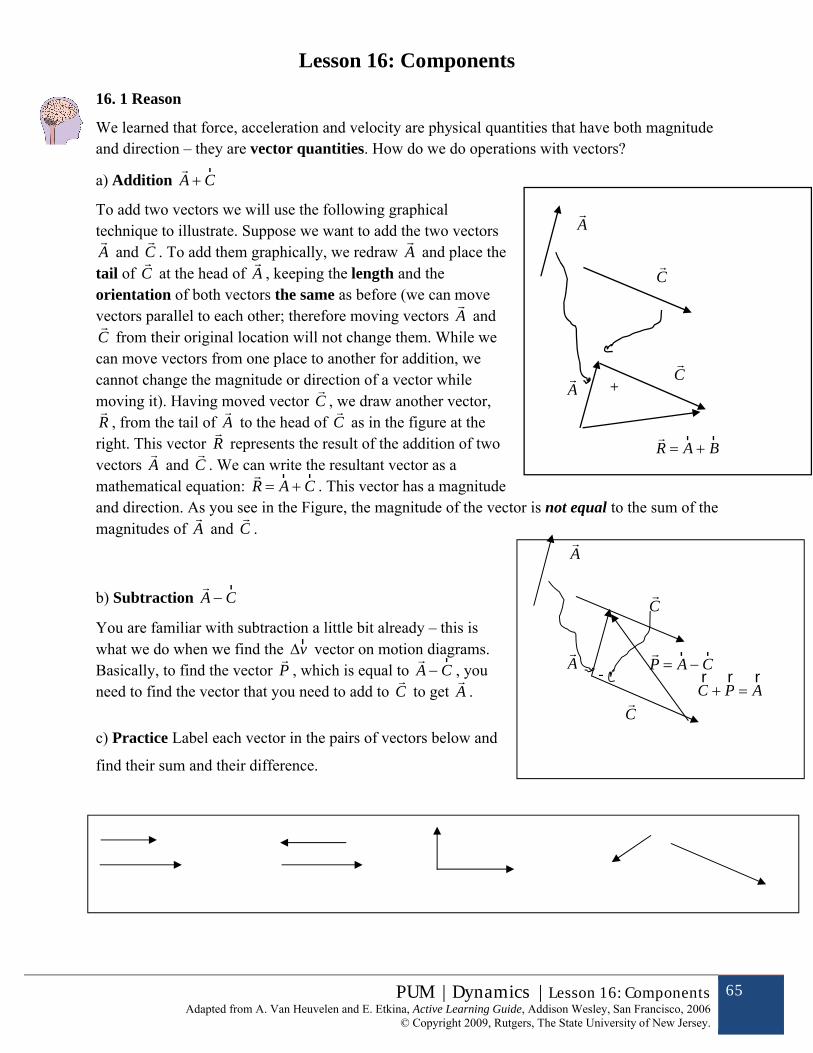
PUM | Dynamics | Lesson 16: ComponentsAdapted from A. Van Heuvelen and E. Etkina, Active Learning Guide, Addison Wesley, San Francisco, 2006
© Copyright 2009, Rutgers, The State University of New Jersey.
65
Lesson 16: Components
16. 1 Reason
We learned that force, acceleration and velocity are physical quantities that have both magnitude and direction – they are vector quantities. How do we do operations with vectors?
a) Addition A
rC
To add two vectors we will use the following graphical technique to illustrate. Suppose we want to add the two vectors
A and
C . To add them graphically, we redraw
A and place the
tail of C at the head of
A , keeping the length and the
orientation of both vectors the same as before (we can move vectors parallel to each other; therefore moving vectors
A and
C from their original location will not change them. While we can move vectors from one place to another for addition, we cannot change the magnitude or direction of a vector while moving it). Having moved vector
C , we draw another vector,
R , from the tail of
A to the head of
C as in the figure at the
right. This vector R represents the result of the addition of two
vectors A and
C . We can write the resultant vector as a
mathematical equation: R
rA
rC . This vector has a magnitude
and direction. As you see in the Figure, the magnitude of the vector is not equal to the sum of the magnitudes of
A and
C .
b) Subtraction A
rC
You are familiar with subtraction a little bit already – this is what we do when we find the
rv vector on motion diagrams.
Basically, to find the vector P , which is equal to
A
rC , you
need to find the vector that you need to add to C to get
A .
c) Practice Label each vector in the pairs of vectors below and
find their sum and their difference.
A
C
R
rA
rB
A
C
+
A
C
P
rA
rCrC
rP
rA
A
-
C

66 PUM | Dynamics | Lesson 16: ComponentsAdapted from A. Van Heuvelen and E. Etkina, Active Learning Guide, Addison Wesley, San Francisco, 2006© Copyright 2009, Rutgers, The State University of New Jersey.
Supplemental Material for those who can use Phet simulations
Vector Analysis- Tip to Tail Method
Tip to Tail: One vector “tail” starts from the origin and each vector added on after is added to the arrow “tip” of the previous vector. The vector tips become the new origin for each subsequent vector arrow. It is very important that you keep your orientation (0º, 90º, 180º, 270º or E, N, W & S) consistent in each diagram to be as accurate as possible with the direction of the vector. The magnitude of the vector is represented in the length of the arrow and should be to scale (ex. 1 cm = 1 m/s or 5 cm = 100 N).
You can only add similar vectors with the same units (ex. Velocity and velocity, acceleration and acceleration, m/s² and m/s²).
PhET Simulation
Go to phet.colorado.edu and click on “Play with Sims” button. From the side menu bar select “Math” and then select Vector Addition Simulation. Select the “Run Now” button and a new window should pop up.
Begin making your tip-to-tail diagrams by selecting a vector arrow from the bucket. Drag and drop the vector into the space provided.
Changing The Vector Arrow
You can change the length and direction of the arrow by clicking on the tip and dragging it to the direction you choose or extend or compress it in size. Notice the box on the top has symbols and numbers. These will change when you change the length or direction of your arrow. Click on another arrow and it will display its values. Align the vector arrows so they are tip to tail. To get the resultant, click on “Show Sum” and a green arrow will appear in the space. Drag the arrow over to your diagram so that the Resultant (green) arrow’s tail is at the origin and the tip of the Resultant is at the last arrow tip.
You have just made a tip-to-tail vector diagram.
NOTE: When doing this by hand, you will label the vector’s magnitude (size) and direction next to the vector itself. The Resultant will be represented by a dotted line instead of a green line and the components will be solid lines.

PUM | Dynamics | Lesson 16: ComponentsAdapted from A. Van Heuvelen and E. Etkina, Active Learning Guide, Addison Wesley, San Francisco, 2006
© Copyright 2009, Rutgers, The State University of New Jersey.
67
Answer the following questions using the simulation.
1. You take a walk and travel 20 meters in the north direction (90º).a. Could this arrow represent another type of vector, like “20 m/s North” or “200 N 290º”?
Explain.b. Next, you turn left and walk 10 meters to the west (180º). Click “show sum” to find the
resultant of these vectors. Arrange the vectors to display a tip-to-tail vector diagram. How far are you from your initial position? In which direction is the resultant? In what direction would you have to travel to get from your end point back to your starting point?
c. Your friend says that you will get different answers if you set up your vectors in the wrong order, so you need to be extra careful. Do you agree with your friend? Support your answer with evidence.
2. On the weekend, you decide to run a couple of errands for your parents (the holidays will be here in no time!) on your way to your friend’s house. You travel East on Rt. 537 driving 15 m/s, then travel North on Rt. 9 moving 21 m/s, and then take the back roads traveling 11 m/s at 328º to your friends house. What was the resultant velocity for your trip?
For this next problem, select “Style 2” so that you can see the x and y components of a vector at an angle and use a scale to convert the units associated with the arrow’s length to the force in your force diagram.
3. A boy pulls his sled across newly fallen snow. The weight of the sled is 150 N and the boy pulls the sled with a constant velocity with a rope that makes a 45º angle with the ground. The ground exerts an upward force of 100 N and a horizontal force (friction) of 40 N. Draw a force diagram to represent this situation. What is the force the rope exerts on the sled?

68 PUM | Dynamics | Lesson 16: ComponentsAdapted from A. Van Heuvelen and E. Etkina, Active Learning Guide, Addison Wesley, San Francisco, 2006© Copyright 2009, Rutgers, The State University of New Jersey.
TO BE HANDED IN
Name:_________________________________________ Date:_______________________ Period:______
The following vector problems should be done by hand, with ruler, protractor and graphing or computer paper and can be double checked by using the PhET simulation.
4. A duck waddles 2.5 m east and 6.0 m north. What is the duck’s displacement?
5. While following directions on a treasure map, you walk 45.0 m south and then 7.50 m east to find the “X marks the spot”. Show two other ways you could have arrived at the same spot from your starting position.
6. A hiker walks 4.5 km northwest and then walks 4.5 km south. What is the hiker’s displacement? What magnitude and direction should the hiker have to go to get straight back to her starting position?
7. A stoplight hangs from two wires that make a 30º angle with a line parallel to the ground. Each wire can exert a maximum of 560 N. What is the maximum weight the light can be so that the light does not fall to the ground?
8. You are flying a plane at 140 m/s northeast when a gale wind of 40 m/s heading north begins to blow.a. With what velocity would an observer on the ground see you flying?b. If you wanted to stay on the original course (140 m/s NE), what correction (vector
component) would you need to make so that your original velocity became your resultant?
Check your Tip to Tail Vector Diagrams:
Scale present (ex. 1 cm = 1 m/s)
Orientation of the diagram remains consistent
Vectors are labeled with magnitude, units and direction
Vectors are done in proper format (tip to tail or coordinate)
Vectors are drawn to scale
Protractors, rulers and straight edge is used when drawing vector diagram
Vector components are solid lines and resultant is dotted (or vice versa)

PUM | Dynamics | Lesson 16: ComponentsAdapted from A. Van Heuvelen and E. Etkina, Active Learning Guide, Addison Wesley, San Francisco, 2006
© Copyright 2009, Rutgers, The State University of New Jersey.
69
16.2 Reason
Finding components of a vector
a) Represent each vector below as the sum of two vectors, one that is parallel to the x-axis and one that is parallel to the y-axis. Assign some integer values to the length of the
vector a and the angle and find the length of the components in terms of your chosen
values. Show your work.
b) Now express the length of each component in terms of the length of the vector a and the
angle . Do not forget the sign!
16. 3 Represent and reason
You are pulling a 20-kg crate on a rug exerting a 300-N force at a 300 angle with the horizontal. The maximum coefficient of static friction between the rug and the crate is 0.5. Represent the situation with a force diagram, motion diagram and mathematically. Make sure your vertical forces and force components balance.
16.4 Represent and reason
Inclined planes
Draw a force diagram and show the direction of the acceleration for an object sliding down an
inclined plane tilted at an angle with the horizontal.
On the force diagram, consider the direction of the following forces exerted on the object described above.
a) Consider the frictional force (which is parallel to the surface) exerted by the surface of the incline on the object and the normal force exerted by the incline on the object (which points perpendicular to the surface). How do they compare to each other?

70 PUM | Dynamics | Lesson 16: ComponentsAdapted from A. Van Heuvelen and E. Etkina, Active Learning Guide, Addison Wesley, San Francisco, 2006© Copyright 2009, Rutgers, The State University of New Jersey.
b) Consider the force exerted by the Earth on the object. How does the direction of the force that the Earth exerts on the object compare to those mentioned in part (a)? How does the magnitude of this force compare to the magnitude of the normal force?
c) Which forces are perpendicular to each other? Which of the forces that are exerted on the object are not perpendicular?
16.5 Evaluate
Examine the two diagrams below, which represent an object of mass m accelerating down an inclined plane. The incline has a rough surface. One diagram has an axis that is upright. The other diagram has an axis that is tilted. For each situation, draw a force diagram and write
Newton’s Second Law in variable/component form ax Fx
m
and ay Fy
m
for each
situation. Which coordinate axis would you prefer to use for evaluating objects on inclines and why?
Scenario 1: Upright Axis
Scenario 2: Tilted Axis
a
x
y
θ
θ
y
x
a

PUM | Dynamics | Lesson 16: ComponentsAdapted from A. Van Heuvelen and E. Etkina, Active Learning Guide, Addison Wesley, San Francisco, 2006
© Copyright 2009, Rutgers, The State University of New Jersey.
71
Did You Know?
Components of a force: The force that one object exerts on another has the same effect on that object as the perpendicular components Fx and Fy of the force. The values of the components are:
Fx = ± F cos Fy = ± F sin
where F is the magnitude of the force and q is the angle (90o or less) between the positive or negative x-axis and the direction of the force. The component is positive if it projects in the positive direction of the x- or y-axis and negative if it projects in the negative direction of the axes.
Newton’s Second Law in component form:
ax F1 on S x F2 on S x ... Fn on S x
mS
Fnet x
mS
ay F1 on S y F2 on S y ... Fn on S y
mS
Fnet y
mS
16.6 Regular Problem
You are trying to pull a sled with two children on it up a hill that makes a 20 angle with the horizontal. The combined mass of the sled and children is 80 kg. The coefficient of kinetic friction is 0.2.
How hard should you pull parallel to the hill’s surface if you:
a) want the sled to move at a constant speed?
b) want the sled to accelerate at 1 m/s2 ?
c) If you let the sled sit on the hill, will it slide down or stay in place? The maximum coefficient of static friction is 0.25.
d) If you wish to use a pulley system to pull the kids up, what should be the mass of the object attached to the other side of the pulley to pull the sled up at constant speed?

72 PUM | Dynamics | Lesson 16: ComponentsAdapted from A. Van Heuvelen and E. Etkina, Active Learning Guide, Addison Wesley, San Francisco, 2006© Copyright 2009, Rutgers, The State University of New Jersey.
Homework
16.7 Represent and Reason
Complete the table that follows.
Write a description of the situation in words.
Sketch the situation and circle the system object.
Draw a force diagram with perpendicular axes. Label the forces if needed.
Draw the direction of acceleration and of the net force. Are they consistent?
Write Newton’s Second Law in component form.
1. An elevator is slowing down on its way up.
2.
3.
4.
1
2
y
x
R on OT
E on OF
30ox
N S on O
y
T R on O
F E on O
30o
30o
y
x60o
30o
N S on O
F E on O
y
y
x x
F E on 1
F E on 2
T R on 1
T R on 2

PUM | Dynamics | Lesson 17: Finding the coefficientAdapted from A. Van Heuvelen and E. Etkina, Active Learning Guide, Addison Wesley, San Francisco, 2006
© Copyright 2009, Rutgers, The State University of New Jersey.
73
Lesson 17: Finding the coefficient
17.1 Design an Experiment
You are to determine the maximum coefficient of static friction between a shoe and a board in two different ways. You have the following equipment: the shoe, a spring scale, the board, a meter stick, and a protractor.
a) Devise a method using the spring scale.
b) Describe the experiment you will perform and the mathematical procedure that you will use to solve the problem.
c) What quantities will you measure and what quantities will you calculate?
d) What are you assuming to be true in your procedure?
e) Perform the experiment and calculate the coefficient of static friction. Do not forget that you cannot obtain an exact value. How do you know if the result is reasonable?
f) Devise a second method using the block and board but not using the spring scale. Repeat steps (b) – (e).
g) Compare the outcome of the two methods. Do they agree within expected uncertainties? Explain.
h) Write a complete report about your experiment.
Use the rubrics to improve your report.
Ability to design and conduct an application experiment
Scientific AbilityMissing An attempt
Needs some improvement
Acceptable
1
Is able to identify the problem to be solved
No mention is made of the problem to be solved.
An attempt is made to identify the problem to be solved but it is described in a confusing manner.
The problem to be solved is described but there are minor omissions or vague details.
The problem to be solved is clearly stated.
2
Is able to design a reliable experiment that solves the problem
The experiment does not solve the problem.
The experiment attempts to solve the problem but due to the nature of the design the data will not lead to a reliable solution.
The experiment attempts to solve the problem but due to the nature of the design there is a moderate chance the data will not lead to a reliable solution.
The experiment solves the problem and has a high likelihood of producing data that will lead to a reliable solution.

74 PUM | Dynamics | Lesson 17: Finding the coefficientAdapted from A. Van Heuvelen and E. Etkina, Active Learning Guide, Addison Wesley, San Francisco, 2006© Copyright 2009, Rutgers, The State University of New Jersey.
3
Is able to use available equipment to make measurements
At least one of the chosen measurements cannot be made with the available equipment.
All of the chosen measurements can be made, but no details are given about how it is done.
All of the chosen measurements can be made, but the details about how they are done are vague or incomplete.
All of the chosen measurements can be made and all details about how they are done are provided and clear.
4
Is able to make a judgment about the results of the experiment
No discussion is presented about the results of the experiment
A judgment is made about the results, but it is not reasonable or coherent.
An acceptable judgment is made about the result, but the reasoning is flawed or incomplete.
An acceptable judgment is made about the result, with clear reasoning. The effects of assumptions and experimental uncertainties are considered.
5
Is able to evaluate the results by means of an independent method
No attempt is made to evaluate the consistency of the result using an independent method.
A second independent method is used to evaluate the results. However there is little or no discussion about the differences in the results due to the two methods.
A second independent method is used to evaluate the results. The results of the two methods are compared using experimental uncertainties. But there is little or no discussion of the possible reasons for the differences when the results are different,
A second independent method is used to evaluate the results and the evaluation is done with the experimental uncertainties. The discrepancy between the results of the two methods, and possible reasons are discussed.
6
Is able to identify the shortcomings in an experimental design and suggest specific improvements
No attempt is made to identify any shortcomings of the experimental design.
An attempt is made to identify shortcomings, but they are described vaguely and no specific suggestions for improvements are made.
Some shortcomings are identified and some improvements are suggested, but not all aspects of the design are considered.
All major shortcomings of the experiment are identified and specific suggestions for improvement are made.
7
Is able to choose a productive mathematical procedure for solving the experimental problem
Mathematical procedure is either missing, or the equations written down are irrelevant to the design.
A mathematical procedure is described, but is incorrect or incomplete, due to which the final answer cannot be calculated.
Correct and complete mathematical procedure is described but an error is made in the calculations.
Mathematical procedure is fully consistent with the design. All quantities are calculated correctly. Final answer is meaningful.
8
Is able to identify the assumptions made in using the mathematical procedure
No attempt is made to identify any assumptions.
An attempt is made to identify assumptions, but the assumptions are irrelevant or incorrect for the situation.
Relevant assumptions are identified but are not significant for solving the problem.
All relevant assumptions are correctly identified.

PUM | Dynamics | Lesson 17: Finding the coefficientAdapted from A. Van Heuvelen and E. Etkina, Active Learning Guide, Addison Wesley, San Francisco, 2006
© Copyright 2009, Rutgers, The State University of New Jersey.
75
9
Is able to determine specifically the way in which assumptions might affect the results
No attempt is made to determine the effects of assumptions.
The effects of assumptions are mentioned but are described vaguely.
The effects of assumptions are determined, but no attempt is made to validate them.
The effects of the assumptions are determined and the assumptions are validated.

76 PUM | Dynamics | Lessons 18: PracticeAdapted from A. Van Heuvelen and E. Etkina, Active Learning Guide, Addison Wesley, San Francisco, 2006© Copyright 2009, Rutgers, The State University of New Jersey.
Lessons 18: Practice
18.1 Represent and Reason
A book rests on a table.
a) Draw a sketch of the situation and identify objects that interact with the book.
b) Draw forces representing these interactions (a force diagram for the book).
c) If the book is stationary, these forces are equal in magnitude and opposite in direction. Can we say that they represent Newton’s Third Law pair forces? If not, why not?
d) Draw the Newton’s Third Law force pairs for each force shown in the force diagram from part (b). Identify the cause of each of these forces and the objects on which each of these forces is exerted.
18.2 Regular Problem
A large plane with a mass of 3.5 x 10⁵ kg lands on a runway at a speed of 27 m/s. If the frictional force exerted by the road and the air on the plane is 4.3 x 10⁵ N
a) How long does it take the plane to stop?
b) How far does the plane travel in this time?
c) What is the effective coefficient of friction?
d) What is the force that the plane exerts on the runway?
18.3 Regular Problem
The driver of a 1560-kg Toyota Avalon, traveling at 24 m/s on a level, paved road, hits the brakes to stop for a red light. Determine the distance needed to stop the car if the coefficient of kinetic friction between the car tires and the road is 0.80.
Sketch the situation described in the problem; provide all known information.
Choose a system object in the sketch from the first cell of this table and make a list of objects that interact with the system object. Simplify objects and interactions if necessary.

PUM | Dynamics | Lessons 18: PracticeAdapted from A. Van Heuvelen and E. Etkina, Active Learning Guide, Addison Wesley, San Francisco, 2006
© Copyright 2009, Rutgers, The State University of New Jersey.
77
Draw a force diagram for the system object. Label the forces. Make sure the diagram is consistent with the motion of the system. Include perpendicular x and y axes.
Apply Newton’s Second Law in component form (x and y axes) to the situation shown in the force diagram.
Combine the results from the above force analysis with kinematics to determine the unknown quantity. Evaluate the result to see if it is reasonable (unit, magnitude, and value for limiting situations).
18.4. Regular Problem
To give a 17 kg child a ride on a 3.4 kg sled, two teenagers pull at 35° angles to the direction of the sled’s motion (see picture). The unpacked snow exerts a frictional force of 57 N. If both teenagers pull, each exerting a force of 55 N, what is the acceleration of the sled?
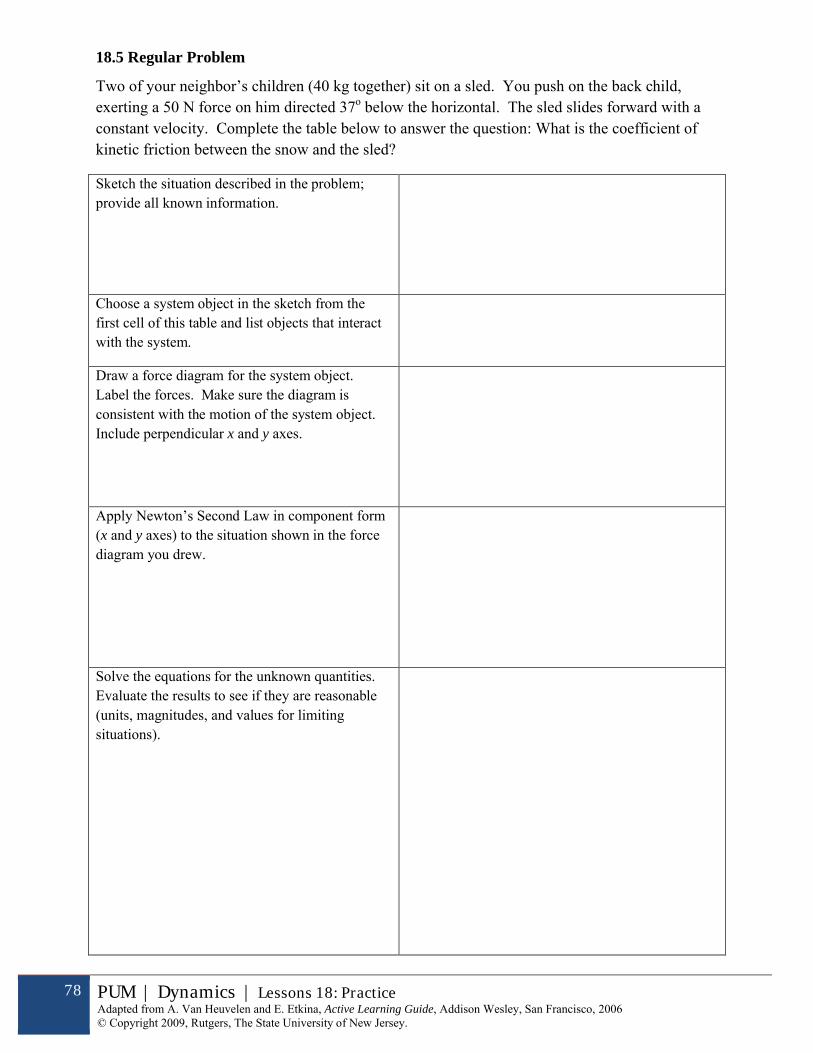
78 PUM | Dynamics | Lessons 18: PracticeAdapted from A. Van Heuvelen and E. Etkina, Active Learning Guide, Addison Wesley, San Francisco, 2006© Copyright 2009, Rutgers, The State University of New Jersey.
18.5 Regular Problem
Two of your neighbor’s children (40 kg together) sit on a sled. You push on the back child, exerting a 50 N force on him directed 37o below the horizontal. The sled slides forward with a constant velocity. Complete the table below to answer the question: What is the coefficient of kinetic friction between the snow and the sled?
Sketch the situation described in the problem; provide all known information.
Choose a system object in the sketch from the first cell of this table and list objects that interact with the system.
Draw a force diagram for the system object. Label the forces. Make sure the diagram is consistent with the motion of the system object. Include perpendicular x and y axes.
Apply Newton’s Second Law in component form (x and y axes) to the situation shown in the force diagram you drew.
Solve the equations for the unknown quantities. Evaluate the results to see if they are reasonable (units, magnitudes, and values for limiting situations).

PUM | Dynamics | Lessons 18: PracticeAdapted from A. Van Heuvelen and E. Etkina, Active Learning Guide, Addison Wesley, San Francisco, 2006
© Copyright 2009, Rutgers, The State University of New Jersey.
79
18.6 Evaluate the Solution
Identify any errors in the solution to the following problem and provide a corrected solution if there are errors.
The problem: A 1000 kg elevator is moving down at 6.0 m/s. It slows to a stop in 3.0 m as it approaches the ground floor. Determine the force that the cable supporting the elevator exerts on the elevator as the elevator stops. Assume that g = 10 N/kg.
Proposed solution: The elevator at the right is the object of interest. It is considered a particle, and the forces that other objects exert on the elevator are shown in the force diagram. The acceleration of the elevator is:
a = v02/2d = (6.0 m/s)2/2(3.0 m) = 6.0 m/s2.
The force of the cable on the elevator while stopping is:
T = ma = (1000 kg)(6.0 m/s2) = 6000 N.
18.7 Evaluate the solution
Identify any errors in the solution to the following problem and provide a corrected solution if there are errors.
The problem: You push a 20-kg lawn mower, exerting a 100-N force on it. You push 37o below the horizontal. The effective coefficient of kinetic friction between the grass and mower is 0.60. Determine the acceleration of the lawn mower. Assume that g = 10 m/s2.
Proposed solution: The situation is pictured at the right. The mower is the object of interest and is considered a particle. The forces that other objects exert on the mower are shown in the force diagram. The magnitude of the kinetic friction force is:
fk = µk N = 0.60(20 kg)(10 m/s2) = 120 N.
The acceleration of the mower is:
a = (F – fk)/m = (100 N – 120 N)/(20 kg) = –1.0 m/s2.
18.8 Design an Experiment
Design a balloon racer. You are given 2 balloons, straws, paper, and tape. The racer should be designed using your understanding of “forces”. You will race this balloon racer against other students in the class.
a) Design a method in which you can determine the time it takes to travel a given distance when relative uncertainty is taken into account.
,
,,

80 PUM | Dynamics | Lessons 18: PracticeAdapted from A. Van Heuvelen and E. Etkina, Active Learning Guide, Addison Wesley, San Francisco, 2006© Copyright 2009, Rutgers, The State University of New Jersey.
b) Design a method to determine the average acceleration during this time when relative uncertainty is taken into account.
c) Design a method in which to determine the average force the air pushing its way out of the balloon exerts on the balloon itself when relative uncertainty is taken into account. Be sure to include force diagrams
d) What assumptions did you make when doing these calculations? How do your assumptions affect your calculated estimate?
e) What is your relative uncertainty in each value? What could you have done to reduce uncertainty?

PUM | Dynamics | Lesson 19: ReviewAdapted from A. Van Heuvelen and E. Etkina, Active Learning Guide, Addison Wesley, San Francisco, 2006
© Copyright 2009, Rutgers, The State University of New Jersey.
81
Lesson 19: Review
19.1 Equation Jeopardy
Several mathematical statements are listed below. For each statement, describe a problem for which this statement could be a solution. Then represent the statement using a force diagram and a motion diagram. For one of the forces involved in the situation find Newton’s third law pair.
a) Funbalanced on object = (9.8 N/kg) x (3 kg)
b) (-7 m/s) + (2 m/s) = (3 s) x a
c) (-35 N) + (9.8 N) = (1 kg) x a
d) Frope on sled – FJake on sled = (35 kg) x (0 m/s2)
e) a m1 m2
m1 m2
g
f) (70 N) cos 300 – 0.4Ffloor on crate = (5 kg) x a
19.2 Diagram Jeopardy
Six force diagrams are shown below. Describe a situation for each diagram; be sure each diagram can represent the situation created for it. For each situation, in what direction is the object moving? How many answers can you have? Draw a matching motion diagram and write Newton’s Second Law in component form for each scenario.
19.3 Graph Jeopardy
Three lines on the graph below describe three motions of an object. Tell a story about each motion. Draw a motion diagram and a force diagram. How many answers can you have? Determine the unbalanced force in each case if the mass of the object is 250 kg.
19.4 Reason
The Earth exerts a 5-N force on an apple, what is the force that the apple exerts on the Earth?

82 PUM | Dynamics | Lesson 19: ReviewAdapted from A. Van Heuvelen and E. Etkina, Active Learning Guide, Addison Wesley, San Francisco, 2006© Copyright 2009, Rutgers, The State University of New Jersey.
19.5 Reason
You are pulling two boxes (10 kg and 15 kg) connected with a rope on a horizontal surface. You exert a 250 N force at an angle of 270 with the horizontal by pulling the second rope attached to a 15-kg box. Represent the situation with the force and motion diagram. Write Newton’s second law in component form for each box. Consider two cases: the surface is a smooth floor and the boxes are made of laminated cardboard and the floor is a carpet and the boxes are made of regular cardboard.
19.6 Reason
A horse is pulling a cart. According to Newton’s third law the force that the cart exerts on the horse is always the same in magnitude and opposite in direction to the force that the horse exerts on the cart. How does the horse ever manage to get the cart moving?
19.7 Reason
A woman pushes a 60 kg couch along a rough surface. The couch accelerates at a rate of 0.5m/s2. Coefficient of kinetic friction between the couch and the floor μk = 0.13. Make a list of physical quantities you can determine using this information and determine 2 of those quantities.
19.8 Reason
A football player exerts a force of 1800 N to push a 40 kg blocking sled with an acceleration of 10 m/s2 over a very rough surface. Make a list of physical quantities you can determine using this information and determine 2 of those quantities.
19.9 Reason
A car locks its brakes and skids to a stop with an acceleration of 4 m/s2. For tires on the road, μk
= 0.25. Assume the car has a mass of 2000 kg
19.10 Reason
Mr. T. pulls a 400 kg walk-in refrigerator behind his car as he drives. The road exerts a 3000 N force on the car but the car does not accelerate. Explain why. Make a list of quantities you can determine using this information. Determine 2 of them.
19.11 Reason A football player exerts a force of 1800 N to push a 40 kg blocking sled on a rough surface. The μk between the surface and sled is 0.5. Determine everything you can using this information.
19.12 Reason A car slows to a stop with an acceleration of 8 m/s2. Assume the force of friction exerted by the air and the road on the car is 15000 N. Pose a question about this situation that you can answer and provide additional information if necessary.

PUM | Dynamics | Lesson 19: ReviewAdapted from A. Van Heuvelen and E. Etkina, Active Learning Guide, Addison Wesley, San Francisco, 2006
© Copyright 2009, Rutgers, The State University of New Jersey.
83
19.13 Reason Two objects of masses m1 and m2 are connected with a light rope going over a light pulley. Draw a picture representing is situation. Then determine the accelerations of the object when the system is let go and the force that the rope exerts on both objects. How many different scenarios can you come up with? How are the acceleration and the force difference depending on the scenario?


![[PHYSICS, CHEMISTRY & MATHEMATICS] PART A PHYSICS](https://img.dokumen.tips/doc/110x75/61ffccc96fcd340f94038045/physics-chemistry-amp-mathematics-part-a-physics.jpg)
