Embed Size (px)
Citation preview
1
Physics of Electrolytic Gas Evolution
C. A. C. Sequeira*, D. M. F. Santos, B. Šljukić, and L. Amaral
Department of Chemical Engineering, Instituto Superior Técnico, Technical
University of Lisbon (TU Lisbon), Av. Rovisco Pais, 1049-001 Lisboa, Portugal
* E-mail: [email protected] (C. A. C. Sequeira); Tel: +351 218417765
A brief analysis of the physics and effects of electrolytic gas evolution is presented. Aspects
considered include bubble nucleation, growth, and detachment, enhancement of mass and heat
transfer, and decrease of apparent electrical conductivity of bubble containing electrolytes. This
analysis is mainly oriented to hydrogen/oxygen evolving electrodes.
Keywords: bubble nucleation, growth and detachment; hydrogen-evolving
electrodes; oxygen-evolving electrodes; alkaline electrolysis; electrolyte
conductivity; mass transfer.
1 INTRODUCTION
Electrolytic gas evolution process is of great importance in numerous
electrochemical reactions and devices. These include primary electrode reactions
of alkaline water and chlorine electrolysis, side reactions during charging of lead-
acid batteries, metal electrowinning, anode reaction of Hall process for aluminium
production, chlorate production etc. In fact, one could say that there are relatively
few main electrochemical processes in which evolved gases do not appear.
At present, we are concerned with the electrolytic hydrogen (H2)
production, which involves two important gas evolution processes, the hydrogen

2
evolving reaction and the oxygen (O2) evolving reaction. Clearly, the kinetics of
these reactions is very dependent on the physics and effects of the evolved gases,
which justify the present analysis.
Electrolytic gas evolution study comprises two subjects: its physics (the
phenomenon by which bubbles grow) and its effects (the havoc engendered by
their presence). The physics of gas evolution proceeds through three phases:
nucleation, growth and detachment. Bubbles start nucleating at electrode surface
from solution once the solution becomes highly supersaturated with produced gas.
Subsequently, bubbles grow by dissolved gas diffusion to their surface or by
coalescence with others, and finally detach from the electrode when the forces
pulling them away overcome the surface forces binding them. Many phenomena
of gas evolution within each of these stages and the effect of process parameters
on the stages have been theoretically and experimentally investigated, but much
remains still to be done. Just as growth of bubbles is complicated, so are the
effects of gas bubbles which include electrolyte solution mixing and obstruction
of electric current. Impeding the current, bubbles decrease electrolyte conductivity
and hence add to ohmic losses in the cell. Furthermore, mixing the electrolyte,
bubbles enhance heat transfer from the electrode and mass transfer to the
electrode surface. In this study we will summarise the physics and effects of
electrolytic gas evolution, being mainly concerned with the presence of bubbles in
alkaline water, particularly close to both the hydrogen and oxygen evolving
electrodes.

3
2 BUBBLES NUCLEATION
Bubbles may nucleate when the electrolyte near the electrode is
supersaturated with gas as, for example, in the electrolytic production of H2. A
flux of H2 based on a current of a few mA/cm2 is sufficient to supersaturate the
liquid since H2 is sparingly soluble. When the dissolved gas concentration reaches
a critical value, bubbles nucleate and grow. The critical dissolved H2
concentration leading to nucleation can be theoretically obtained from classical
nucleation theory; however, the effectiveness of this theory for electrolytic gas
evolution needs further examination.
Nucleation theory dates from the 1920s when investigators considered the
thermodynamics and kinetics of single-component phase transitions [1-8]. From
this work evolved classical nucleation theory in which density fluctuations
engender vapour nuclei that may grow or decay depending on whether the bubble
nucleus is higher or smaller than a certain size, determined by so-called critical
radius. At this stage, the bubble is in metastable chemical and mechanical
equilibrium with its surroundings. The frequency of formation of critical nuclei is
inversely proportional to the exponential of the isothermal minimum work
required to form such nuclei divided by kT, being k the Boltzmann constant and T
the temperature. Thus, the essential features of nucleation theory are the
expression defining the size of the critical bubble nucleus and the formulation of
the rate expression as an exponential function of the work associated with the
production of a nucleus having this dimension. Blander and Katz [9] have
reviewed the derivation of these equations.
Electrolytically evolved gas bubbles nucleate from solutions of gas
dissolved in a host liquid; hence theory for multiple components is required for

4
this case. Ward [10] obtained an expression for the critical radius for multi-
component systems:
2
P'-'P'P
021
c
C
CR
(1)
where P is the vapour pressure of solvent at the temperature of the liquid, P′ is
the external pressure in the liquid, 1,2 are the vapour phase activity coefficients
of the solvent and solute, C′ is the concentration of the gas in the solution
surrounding the bubble, expressed as moles of solute per mole of solvent, 0C is
the equilibrium concentration of the gas in the solvent when a flat surface of the
solvent is exposed to the gas only at T′ and P′, expressed as moles of solute per
mole of solvent, is the surface tension of the liquid-gas interface often assumed
equal to the surface tension of the liquid vapour interface, and is defined as
C'
kT
P P'- exp 1
V (2)
where V1 is the specific volume of the pure solvent.
Tucker and Ward [11] derived a general expression for the critical radius
of a bubble for an arbitrary number of volatile solutes present. Their final
expression has the same form as (1), but the partial pressure in the denominator is
summed over all solutes. The solute gas decreases the critical radius from that of
the pure solvent at the same temperature and pressure; therefore the rate of
nucleation correspondingly increases. Ward et al. [10] have also shown that the
rate equation derived for the pure solvent,
2
3
P' 'P'3kT
16exp Z J
(3)

5
(where J is the frequency of nucleation (s cm3)-1
, Z is the frequency factor, a very
weak function of T and P, and P′′ is the pressure inside the critical size bubble)
also applies to multi-component solutions; however, P′′ has two contributions in
this case. The dissolved gas exerts a vapour pressure in addition to the vapour
pressure of the pure solvent. The increase of P′′ lowers the critical radius and
therefore decreases the maximum sustainable supersaturation.
Equation (3) and equation (4) are sufficient for the prediction of the
maximum attainable limit of supersaturation.
C'
kT
P P'V exp
PC'P' 'P' 1
102
C
(4)
On the right side of equation (3) is the exponential function that governs the rate
of nucleation while equation (4) relates the pressure inside the critical size bubble
to the concentration of dissolved gas in the surrounding liquid.
Supersaturation of H2 gas dissolved in 1 N sulphuric acid (H2SO4)
evaluated using equations (3) and (4) is found to be a thousandfold as the limit
[12]. However, supersaturation in the vicinity of gas evolving electrodes does not
reach this magnitude; instead supersaturations of O (102) were found in aqueous
solutions. The reason is that these theories do not take into account nucleation at
solid surfaces that unavoidably have imperfections that work as nucleation centres
[13,14]. It was reported that nucleation on microelectrodes occurs at pits and
scratches as preferred sites [15] or, in the case of rotating platinum (Pt) wire, at
specific sites that depend on pre-treatment as well as on current density [16].
Furthermore, study of H2 evolution in H2SO4 solutions on mercury (Hg) as an
ideally smooth electrode [12] (with Hg electrode area core for nucleation being
continuously renewed) showed that nucleation at supersaturations was much less
than predicted by theory. This indicated a possible effect of the strong electric

6
field within the electric double layer. Later studies from theoretical models and
experimental results described in the literature have cast new light on the
underlying mechanisms of the nucleation of electrolytic gas bubbles [17-22].
3 GROWTH STAGE
The growth stage of gas evolution includes the diffusion of dissolved gas to the
gas/liquid interface and the coalescence of bubbles. Scriven [23] and others
[24,25] theoretically analysed the mass transfer of dissolved gas to the gas/liquid
interface. Scriven’s [23] square-root-of-time growth dependence was
experimentally confirmed by Westerheide and Westwater [15] for a single bubble,
while multiple bubbles interfered with each other. Still, this study established
diffusion of gas to the bubble surface as at least the initial mechanism by which
bubbles grow. Glas and Westwater [26] extended the study including different
gases and different electrode materials.
The diffusion-limited initial stage of growth being established,
significance of coalescence in gas evolution was pointed out. Janssen and von
Stralen [27], exploring O2 bubbles evolution in aqueous potassium hydroxide
(KOH) on a transparent nickel (Ni) electrode, found frequent coalescence,
mobility of bubbles on the electrode surface, a radial movement of small bubbles
toward large ones and consumption of small bubbles by large ones at high current
density. Based on observation of H2 bubbles production in acid media, Putt [28]
suggested that bubbles grew large by a scavenging mechanism, i.e. by sliding
along the electrode surface and consuming other smaller bubbles. On the basis of

7
high speed motion pictures taken from the backside of a transparent electrode,
Sides [29] proposed a cyclic mechanism of bubble growth in the basic medium.
This mechanism starts with nucleation, followed by growth by diffusion,
coalescence of small bubbles, radial movement of small bubbles and their
coalescence with stationary medium-size bubbles, and scavenging coalescence of
the medium bubbles by large ones moving along the electrode. This is the process
by which large O2 bubbles are built in basic medium.
A film sequence recording this mode of coalescence appears in Fig. 1 [30].
FIG 1
The cyclic process of bubble growth has been seen on a much larger scale
by Fortin et al. [31] in a physical model designed to investigate the behaviour of
bubbles underneath the carbon anodes of the Hall process for aluminium
production. When the electrode was twisted a few degrees from horizontal,
bubbles forming uniformly under the simulated electrodes coalesced to produce a
large bubble “front” that moved across the surface and scavenged other bubbles in
its path. The process was repeated at a frequency of 1 – 3 Hz when the gas
evolution rate was equivalent to 1 A/cm2.
4 BUBBLES DETACHMENT
Detachment as the final phase in the physics of gas evolution has also been
subject of both theoretical and experimental studies. The bubbles are found to

8
detach once the surface adhesive forces, related to bubble contact angles, can no
longer restrain them [32]. In contrast to these equilibrium measurements, studies
of the dynamics of gas evolution showed that the bubble formed by the
coalescence of two large bubbles would jump off the electrode and sometimes
even return [15]. Other authors [27,28,33-35] have also reported that bubble
coalescence often precedes their detachment from the electrode surface. It was
concluded that the expanding boundaries of the new bubble mechanically forced it
off the electrode. It was further speculated that bubbles’ movement towards the
electrode could be affected by electrostatic forces on a moving bubble or by
surface forces varying with concentration.
Related to the detachment of bubbles is their mobility on electrode
surfaces. Investigation of the forces holding a drop on an inclined plane led to
conclusion that drops holding onto these surfaces are a result of the contact angle
hysteresis, the adherence between bubbles’ advancing and retreating contact
angles [36]. The main cause of hysteresis is roughness of the surface. Later
contribution of the same authors [37] valid in the case of gas bubbles as well,
established criteria for determining whether or not a bubble should move on an
inclined surface. Figure 2, taken from Dussan [37], illustrates the relation between
the hysteresis angle, the contact angle, and the volume of the largest bubble that
sticks to a surface facing downward and inclined by degrees to the horizontal
and how they determine the minimal and maximal size of electrolytically
produced bubbles in aqueous media. With increasing the contact angle and
keeping the other parameters constant, increase of bubble size can be observed.
FIG 2
9
5 OPERATING PARAMETERS
Bubble growth and consequently its final size are determined by several
parameters including electrode material, current density and different additives.
Venczel [38] explored bubble growth on different electrode substrates, namely
graphite, iron (Fe), copper (Cu) and Pt as well as on glass plates with thin layers
of Pt, chromium (Cr), Ni and gold (Au). Bubble growth on Pt was uniform
leading to bubbles coalescence and formation of large bubbles. On the contrary,
bubbles were observed to detach from Cu and Fe electrode substrates before
reaching a size for coalescence, resulting in small bubbles. Ibl and Venczel [39]
confirmed that the size of bubbles depends on experimental conditions and also
observed that bubbles evolved on Pt were much larger than those evolved on Cu.
Furthermore, it has been established that current density affects bubble size, but
there are still some disagreements in the literature about its exact effect. Janssen
and Hoogland observed that higher current density values provoked bubbles’
coalescence [16]. Their explorations of gas evolution in alkaline media on
horizontal and vertical Pt discs [40] showed that all bubbles but H2 increased with
increase of current densities (i > 10 mA/cm2); this was attributed to the more
frequent coalescence of bubbles. As seen in Figure 3, the size of H2 bubbles
produced in alkaline medium is not influenced by current density and they are the
smallest ones. On the other hand, O2 bubbles evolved in the same medium rapidly
grew for current density values higher than 30 mA/cm2. Some other authors have
confirmed the increase of bubbles’ size with increasing current density [41,42].
Quite the contrary, Venczel [38] claimed that bubble size decreased with the
increase of current density. Up-to-date there are still some disagreements on the
exact influence of current density on bubble size.

10
FIG 3
Besides the electrode material and current density, additives are another
parameter believed to influence bubble behaviour and size. Studies showed that
presence of additives such as gelatine, glycerine and β-naphthochinolin in the
electrolyte solutions results in evolution of smaller bubbles in most cases with
formation of frothy mixture being observed [38]. It is believed that additives
reduced the ratio of the bubble diameter to the contact diameter by half and
increased the electrode wettability. This resulted in the presence of a thick film of
electrolyte between the gas and the electrode that is less adhesive than thin films.
Still, the forces holding the bubbles to the electrode were most likely weakened
proportionally to the decrease of both the perimeter of the contact area and the
contact angle. Moreover, it is speculated that the inhibitors stabilise the bubble
interfaces and avert their coalescence on the electrode.
In addition to electrode material, current density value and presence of
additives in the electrolyte, other process parameters have been reported to
influence bubble size and behaviour. It was found that the bubble size decreased
with increasing flow rate in the interelectrode area [42] with significantly higher
current densities being achieved in comparison to those in stagnant electrolyte.
Furthermore, electrode orientation and configuration are also expected to affect
bubble size [43].
A more comprehensive study on the effect of the operational parameters
such as position, diameter and material of the electrode, nature of gas evolved,
temperature, pressure and KOH concentration, was published by Janssen and
Barendrecht [44]. They determined the electrolytic resistance of solution layers of
KOH at the gas-evolving electrodes, by the alternating current impedance method.

11
The investigation was restricted to electrodes of small diameter. R*/i curves
were obtained, where R* = (R – R0)/R0, R being the ohmic resistance of the
solution, and R0 the value of R at i = 0. All log R* / log i curves for the H2
electrode were linear. Their slope, b, did not depend significantly on KOH
concentration. An observed steep slope at 358 K was caused by a high percentage
of water vapour in the hydrogen gas-water vapour mixture. Since R* increases
with increasing gas void fraction in a solution layer at a gas-evolving electrode, it
is likely that the observed decrease of slope b with increasing KOH concentration
is due to the fact that KOH concentration strongly affects the gas void fraction.
The solution layer at a gas-evolving electrode can be divided into two
layers, viz. a “fixed layer” (thickness being the diameter of adhered bubbles)
adjacent to the electrode surface, followed by a “diffuse layer”. To explain the
dependence of R*, it is important to determine the gas void fraction in the “fixed
layer”. This determination was not possible for the hydrogen-evolving electrode.
Generally, for a hydrogen-evolving electrode, log R* = a1 + b log i and log R*
= a2 – b log p, where a1 and a2 are constants depending on the position, height and
material of the electrode and on temperature. Pressure, p, and current density have
similar effects on R*. So the constant b strongly depends on the KOH
concentration. For the oxygen-evolving electrode, the log R* / log i curve was
not linear but S-shaped.
This result may be caused by coalescence of oxygen bubbles depending on
many factors, such as KOH concentration, pressure, temperature and nature of
electrode material. In this case, determination of the gas void fraction in the “fixed
layer” can help explaining the experimental log R*/ log i relations.

12
For an oxygen-evolving electrode, the gas void fraction was determined as
a function of the distance from the electrode surface to explain the experimental
R*/ log i relations. The reduced resistance increase R* is related to a solution
layer with a thickness of 0.125 de at a gas-evolving disc electrode of diameter de
and a surface area of 0.25π Almost all the bubbles within this layer are adhered
to the electrode surface. So, the contribution of “free” bubbles to the gas void
fraction can be neglected. R* was calculated using the Bruggeman equation [45]
p = p0 (1 - )-3/x
(5)
where p and p0 are the effective and real pressures of the solution layer, stands
for the dielectric constant of the media and the exponent -3/x is the asphericity
parameter of the spherical bubbles. Both log R* / log i curves calculated and
obtained experimentally agreed very well with each other. Consequently, it was
shown that the Bruggeman equation is useful to determine the ohmic resistance of
a solution layer containing bubbles of different size and at which each bubble
adheres to the electrode surface.
6 EFFECT OF GAS BUBBLES ON ELECTROLYTE CONDUCTIVITY
The conductivity of a heterogeneous medium, an important topic in
diverse technical problems, depends on three characteristics: the ratio of the
conductivity of the dispersed and continuous phases, the gross volume fraction
occupied by the dispersed phase, and its state of aggregation. Depending on
whether its conductivity is greater or lesser than the surrounding medium, the

13
dispersed phase can enhance or retard transport. Volume fraction is often the only
parameter other than the aforementioned ratio which appears in equations
predicting the effect of a given dispersed phase in the overall conductivity. By
state of aggregation we mean both the shape of the dispersed phase, which can
range from spheres to cylinders to planes, and its distribution in the system’s
container.
Meredith and Tobias [46] have written an important review of the role
these three characteristics play in the conductivity of heterogeneous media.
The use of any equation describing the conductivity of heterogeneous
media generally requires accuracy and convenience. The equation must predict
accurate values, be useful over the whole range of void fraction, f, and have a
form as simple as possible. There are equations in the literature which satisfy
many of these criteria: Maxwell’s equation [47], Bruggeman’s equation [45],
Tobias Distribution Model [48] and Prager’s equation [49], shown in equations (6
– 9), respectively.
2) / f (1 / f)(1 Km (6)
5.1
m f)(1 K (7)
f) - (4 f) (4 / f) - (1 f)(2 8 Km (8)
2
m 0.5f 2 / f31 K (9)
Km is the ratio of the conductance with the dispersed phase present to the
conductance in the absence of the dispersed phase. Maxwell’s equation (6) [47] is
a fundamental result in the theory of heterogeneous conductivity. Prager [49] has
improved on Maxwell’s result in the concentrated range of void fraction by
applying the principle of minimum entropy to obtain bounds on the diffusion
coefficient of a solute in a suspension of solid particles. Since the diffusion rate

14
ratio can be considered analogous to the conductivity ratio, one may use his
equation (9), exact for a suspension of spheres, to estimate the conductivity of
heterogeneous electrolyte. The other two equations were derived for electrolytes
containing a distribution of bubble sizes. Meredith and Tobias [48] derived
equation (8) for electrolytes containing two sizes of bubbles while Bruggeman
[45] treated a pseudo-continuous distribution of bubble sizes by accumulating the
contributions of a range of bubble sizes (equation 7). We call it pseudo-
continuous because, in principle, each size fraction must be very different from
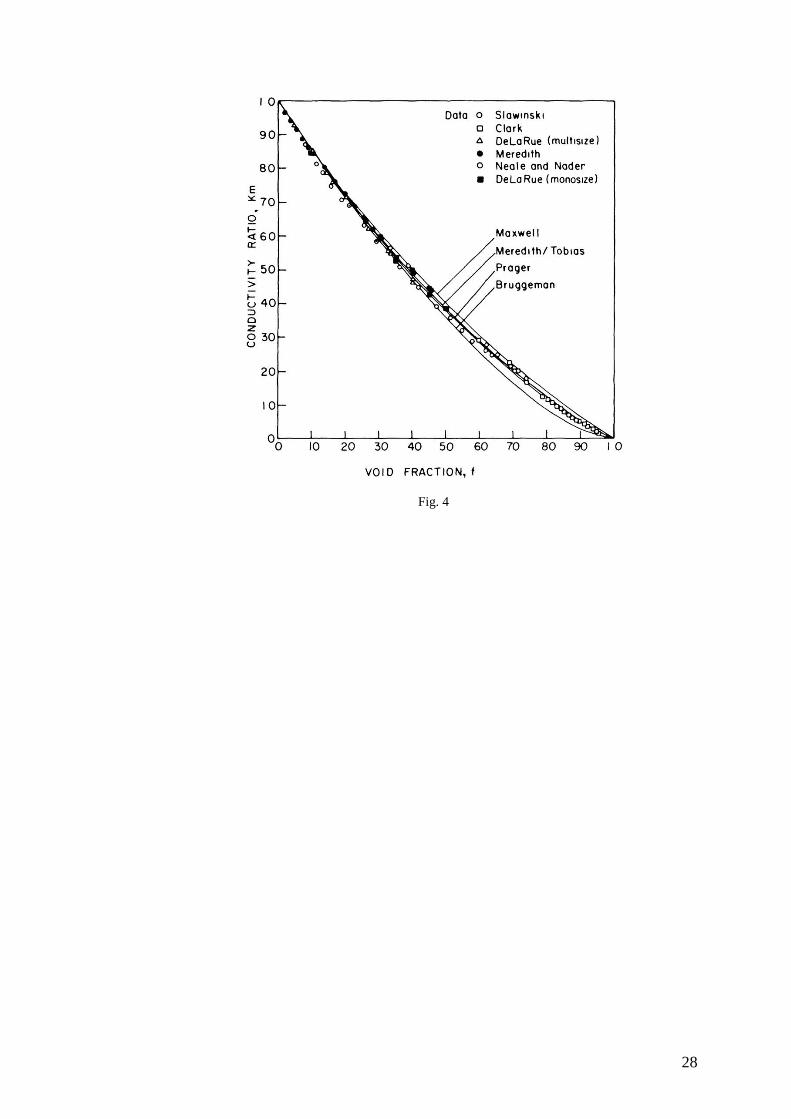
each of the other sizes. In this work we compare the predictions of these four
equations to conductivity data spanning the range of void fraction and show that,
for many applications, these general equations reliably estimate the heterogeneous
conductivity of random dispersions of dielectric spheres. The data are taken from
several sources [50-56], the earliest of which appeared in 1926 [50]. Equations (6-
9) are compared to the data in Figure 4, although the data follow a similar trend,
there are important differences among them. The results of Meredith [55] and
DeLaRue [53] follow the same line at low void fractions but, beginning between
void fractions of 0.1 and 0.2, DeLaRue’s conductivities of dispersions containing
spheres of various sizes are consistently lower than Meredith’s conductivities and
DeLaRue’s own conductivities of dispersions of monosized spheres. We conclude
that there are three distinct cases in the problem of the conductivity of dispersion
of spheres. The first case, dilute dispersions, obeys Maxwell’s equation (6) and is
independent of the size distribution. The second case, concentrated dispersions of
spheres of various sizes, obeys Bruggeman’s equation. The third case,
concentrated solutions of monosized spheres, is intermediate between the first two
in the sense that its conductivities are lower than those predicted by Maxwell’s
equation and higher than those predicted by Bruggeman’s. The distribution model

15
of Meredith/Tobias equation (8) and Prager’s equation (9) predict nearly equally
accurate values for this case.
FIG 4
These equations and experiments concerned bubbles contained in bulk
electrolyte far from electrode surfaces. Sides and Tobias [58,59] theoretically and
experimentally investigated the effects of bubble layers on electrodes and
concluded that, although the behaviour of the conductivity is definitely different
from that in the bulk, the equations derived for the bulk give reasonable estimates
if one is careful to apply them to only the region near the electrode where the
bubble layer exists. Lanzi and Savinell [60] showed that differences appear at
bubble layer void fractions above 0.5.
Apart from these theoretical investigations and experiments on the static
models, several authors have studied dynamic gas evolving electrodes. Hine et al.
[61,62] reported the results of experiments on large-scale vertical electrolysers
and concluded that Bruggeman’s equation (7) described the results. Sigrist et al.
[63] also examined electrodes producing bubbles but found that Maxwell’s
equation best fit their data. Janssen et al. [64] investigated ohmic losses in water
electrolysis resulting from the presence of bubbles and proposed a correlation to
describe the added resistance. Kubasov and Volkov [65], investigating bubble
layers formed on graphite electrodes during chlorine evolution, measured voltage
losses as high as three volts. Takata et al. [66] also worked on chlorine evolving
electrodes. In 1956, Hine et al. [67] discussed the anode shift potential caused by
the local current density exceeding the superficial current density because the
bubbles screen the electrode surface. Janssen and Barendrecht [44] investigated

16
the electrolytic resistance of solution layers at hydrogen and oxygen evolving
electrodes. Finding that the equations derived for bulk electrolytes worked well,
they confirmed the conclusion of Sides and Tobias [59].
Decreasing the local conductivity of the electrolyte, gas evolution can
affect macroscopic current distributions. A classic paper in this subject was
written by Tobias [68] who analysed the current distribution in vertical
electrolysers with evolution of bubbles. Others [61,62,69-71] have performed
experiments on the current distribution in such systems.
7 MASS TRANSFER AT GAS-EVOLVING ELECTRODES
Electrolytically evolved bubbles enhance heat and mass transfer to gas
evolving electrodes because the growing and detaching of gas bubbles mix the
electrolyte near the surface with electrolyte in the bulk. For example, Roald and
Beck [72] in 1951 noted that the rate of magnesium dissolution in acid electrolyte
was controlled by transport of acid to the electrode surface and that stirring by the
evolved hydrogen bubbles increased the rate. Evolving gas bubbles can accelerate
mass transfer to rates achieved by only intense mechanical stirring or flow and is
thus very effective where circumstances allow its use.
Phenomena of gas evolution discussed at the outset are responsible for
mixing at the electrode. The growing bubbles produce convection as their
boundaries expand by diffusion and coalescence. When a bubble detaches,
electrolyte must flow to fill the vacancy. The effective density of a heterogeneous
mixture of gas and electrolyte is lower than that of bulk electrolyte; hence there is

17
macro-stirring of the electrolyte by the rising gas bubbles (gas lift). Individually,
these are complicated phenomena to describe and it seems impossible to
mathematically analyse the flows that are a result of them all; thus, engineers have
constructed theories which explain and correlate the experimental results and
patterns. Three well-known schools of thought in Switzerland, Netherlands and
Germany may be identified from research published over the last fifty years.
The first two schools began with Venczel’s dissertation in Zurich in 1961
[73] in which he investigated transport of ferric ion to an electrode evolving
hydrogen gas from 1 M H2SO4. The author observed increased mass transfer with
the onset of gas evolution. Ibl and Venczel [39], reporting the results in 1970,
attributed the mass transfer enhancement to the reactant’s diffusion over short
distances from fresh electrolyte brought to the surface after bubble detachment.
Surface renewal and penetration theory were used as the basis of a derivation
predicting a dependence of the mass transfer rate on the square root of the gas
evolution rate. Exponents varying from 0.4 to 0.6 were found experimentally by
the authors but a significant number of data were grouped around 0.53.
Unfortunately, one must know the bubble size at departure and the fractional area
of the electrode shadowed by bubbles on the surface to use this model.
The second school of thought was developed at Eindhoven, in the
Netherlands. Janssen and co-workers [16,27,40,74,75] investigated mass transfer
enhancement in alkaline electrolyte. O2 bubbles can be quite large (200 μm),
whereas H2 bubbles are very small (20 μm) [40]. It was found that the mass
transfer enhancement caused by H2 bubbles followed a smaller exponent (0.31) of
the gas current density than that reported by Ibl et al. [39,51] for low current
densities and a large exponent at higher current densities. This change in slope
occurred at the same gas evolution rate as the change in bubble size of O2 bubbles

18
from around 60 to 200 μm. Janssen and Hoogland [40] related this change in mass
transfer enhancement to increased coalescence and correlated the low exponent to
a hydrodynamic model in which convective flows toward a detaching bubble
account for the mass transfer.
The third school of thought is represented by Vogt [76] who correlated
previously reported results with a model considering the primary enhancement a
result of the convective flows originated by expansion of the bubble during
growth. He adapted mass transfer theory for laminar flow over planes to his
system and integrated the resulting equation over the period of bubble growth. His
equation appeared to successfully correlate data from other investigators.
Investigators of mass transfer enhancement at gas-evolving electrodes
have generally reported Nernst mass transfer boundary layer thickness, N, as a
function of gas evolution rate (cm3/cm
2s) or current density. The Nernst boundary
layer thickness is given by
nFDC/i N (10)
where n stands for the equivalents per mole, D is the diffusivity and F is Faraday’s
constant. N is essentially the reciprocal of a mass transfer coefficient divided by
the molecular diffusivity. Figure 5 is a plot of the results of Ibl et al. [77] on mass
transfer enhancement in acid solutions. It may be observed that the boundary layer
thickness decreases with the increase of the gas evolution rate. At the highest gas
evolution rates, corresponding to 10 A/cm2, the boundary layer thickness is of the
order of 1 μm which is quite thin. The Nernst boundary layer thickness is a simple
characteristic of the mass transfer rate and is usually expressed by
b
N ai (11)

19
taking into account fluid viscosity, kinematic viscosity and the diffusion
coefficient, being the exponent b the centre of differences between the schools of
thought, taking on values from -0.25 to -0.87 [51].
FIG 5
Figure 6 was taken from Janssen and Hoogland [40] and it is the basis of
their hydrodynamic theory of mass transfer in the absence of coalescence. The
slope change, around 30 mA/cm2, corresponds to a change in bubble size for the
O2 bubbles evolved in basic solution. This was considered an indication of the
onset of coalescence between bubbles on the electrode. Vogt [76] correlates
results from many authors with the equation
0.4870.5ScRe 925.0h S (12)
where Sh is the Sherwood number defined as kd/D with k being the mass transfer
coefficient, Sc is the Schmidt number, Re is the Reynolds number being defined
by VGd/v, VG is the gas evolution rate, d is the bubble breakoff diameter, and v is
the kinematic viscosity.
FIG 6
Regardless of the differences between the three main schools of thought on
mass transfer at gas evolving electrodes, some issues have reached consensus
among the several investigators. Among them is the fact that gas evolution is
considered an effective means of enhancing transport. It is also generally accepted
that roughness of the electrodes on the order of the boundary layer thickness does
not strongly influence the amount of acceleration. A slight dependence on

20
electrode orientation and on the length of a vertically oriented electrode is also
recognized, but as secondary effects [78-82].
8 RECENT DEVELOPMENTS AND FUTURE TRENDS
Electrolytic gas evolution has been an interesting field for researchers and
great progress has been achieved, but there are still challenging questions to be
answered [83-93]. The majority of the studies have focused on miniature or
micrometer-sized bubbles that are formed at the electrodes’ surface and
subsequently detach from it. Recently, electrochemically generated nanobubbles,
which work as embryos for the bubbles, have been receiving a great deal of
attention [94-97]. These nanobubbles behave differently from macroscopic ones,
having contact angle lower than expected from Young’s law, being stable against
violent decompression, and for much longer than theoretically predicted [97].
They were found to grow into microbubbles before detaching from the substrate
[95].
However, the nucleation of gas bubbles at the electrode surface still needs
clarification. The phenomena of growth, coalescence, and detachment of bubbles
require further enlightenment. Although the conductivity of electrolytes
containing gas bubbles is theoretically understood, these effects in large-scale
systems, such as in industrial electrolysers, are yet to be fully clarified [98]. The
voltage balance at the gas evolving electrode is also not clear. The enhancement
of mass and heat transfer at gas evolving electrodes have been widely
investigated, but more comprehensive semi-empirical analysis is still required.

21
Furthermore, the discovery of surface nanobubbles opened a new field of research
and numerous questions have been raised, including issues regarding their nature
and unexpected long stability, which are important aspects for electrolytic gas
evolution.
9 CONCLUSION
Gas bubbles formed at the solid/liquid interface are a classical
phenomenon that is of great importance in various processes, including
electrolytic gas evolution. Many studies have been devoted to the topic but there
are still important questions and areas to be explored.
The details of bubble formation and the effects of the bubbles presented in
this brief analysis based on the pioneering works of Ibl, Janssen, Sides, Tobias,
Venczel, Vogt, and many others, are nothing but the microscopic aspects of a
phenomenon that affects the macroscopic behaviour of electrochemical cells,
namely those developed for the electrolytic hydrogen production. Going deeper
into the ultramicro- and nanoscopic aspects of bubble formation at the tertiary
system - water, highly concentrated gas and solid electrode - one comes across
with surface nanobubbles, whose existence at the solid/liquid interface has a
relevant impact on the nucleation and growth of gas bubbles.

22
Acknowledgements
FCT, the Portuguese Foundation for Science and Technology, is gratefully acknowledged for
funding project Functional materials for electrolytic hydrogen production (PTDC/SEN-
ENR/121265/2010) and L. Amaral thanks for a research grant within this project. D.M.F. Santos
and B. Šljukić would also like to thank FCT for postdoctoral research grant
(SFRH/BPD/63226/2009) and SFRH/BPD/77768/2011, respectively.
References
[1] M. Volmer, A. Weber, Z. Phys. Chem. 119, 277 (1926).
[2] L. Farkas, Z. Phys. Chem. 125, 236 (1927).
[3] R. Becker, W. Doring, Ann. Phys. 24, 719 (1935).
[4] W. Doring, Z. Phys. Chem. 36, 371 (1937).
[5] W. Doring, Z. Phys. Chem. 38, 292 (1938).
[6] Ya.B. Zeldovich, Acta Physicochim. USSR 18, 1 (1943).
[7] Yu. Kagan, Russ. J. Phys. Chem. 34, 42 (1960).
[8] J. Frenkel, Kinetic Theory of Liquids (Dover, New York, 1955).
[9] M. Blander, J.L. Katz, AIChE J. 21, 833 (1975).
[10] C.A. Ward, A. Balakrishnan, F.C. Hooper, Trans. ASME 92, 695 (1970).
[11] A.S. Tucker, C.A. Ward, J. Appl. Phys. 46, 4801 (1975).
[12] K. Dapkus, P. Sides, J. Coll. Interface Sci. 111, 133 (1986).
[13] H.B. Clark, P.S. Strenge, J.W. Westwater, Chem. Eng. Prog. Symp. Ser. 29, 55, 103 (1957).
[14] R. Cole, Adv. Heat Transfer 10, 85 (1974).
[15] D.E. Westerheide, J.W. Westwater, Am. Inst. Chem. Engrs. J. 7, 357 (1961).
[16] L.J.J. Janssen, J.H. Hoogland, Electrochim. Acta 15, 1013 (1970).
[17] H. Vogt, Electrochim. Acta 25, 527 (1980).
[18] S. Lubtekin, Electrochim. Acta 48, 357 (2002).
[19] J. Eigeldinger, H. Vogt, Electrochim. Acta 45, 4449 (2000).
[20] A. Volanschi, W. Olthuis, P. Bergveld, Sensor Actuat A-Phys 52, 18 (1996).
[21] H. Vogt, R.J. Balzer, Electrochim. Acta 50, 2073 (2005).
[22] H. Vogt, O. Aras, R.J. Balzer, Int. J. Heat Mass Transfer 47, 787 (2004).
[23] L.E. Scriven, Chem. Eng. Sci. 27, 1753 (1959).
[24] H.Y. Cheh, Ph.D. Thesis, University of California (1967).
[25] M.S. Plesset, S.A. Zwick, J. Appl. Physics 25, 493 (1954).
[26] J.P. Glas, J.W. Westwater, Int. J. Heat Mass Transfer 7, 1427 (1964).
[27] L.J.J. Janssen, S. van Stralen, Electrochim. Acta 26, 1011 (1981).
[28] R. Putt, M.Sc. Thesis, University of California (1975).
[29] P.J. Sides, Ph.D. Thesis, University of California (1981).
[30] P.J. Sides, C.W. Tobias, J. Electrochem. Soc. 132, 583 (1985).
[31] S. Fortin, M. Gerhardt, A. Gesing, Light Met, March, 721-741 (1983).
[32] B. Kabanov, A. Frumkin, Z. Phys. Chem. 165A, 433 (1933).
[33] C. Browne, R.F. Tabor, D.Y.C. Chan, R.R. Dagostine, M. Ashokkumar, F. Grieser, Langmuir
27, 12025 (2011).
[34] S. Samanta, P. Ghosh, Ind. Eng. Chem. Res. 50, 4484 (2011).
[35] B.V. Boshenyatov, Dokl Akad Nauk 427, 321 (2009).
[36] E. Dussan, R. Chow, J. Fluid Mech. 137, 1 (1983).
[37] E. Dussan, J. Fluid Mech. 151, 1 (1985).
[38] J. Venczel, Electrochim. Acta 15, 1909 (1970).
[39] N. Ibl, J. Venczel, Metalloberflache 24, 365 (1970).
[40] L.J.J. Janssen, J. Hoogland, Electrochim. Acta 18, 543 (1973).
[41] N. Ibl, Chimie. Ing. Tech. 43, 202 (1971).
[42] D. Landolt, R. Acosta, R. Muller, C.W. Tobias, J. Electrochem. Soc. 117, 839 (1970).
[43] E.L. Littauer, United States Patent 3,880,721 (1975).
[44] L.J.J. Janssen, E. Barendrecht, Electrochim. Acta 28, 341 (1983).
[45] D.A.G. Bruggeman, Ann. Phys. 24, 636 (1935).
[46] R.E. Meredith, C.W. Tobias, in Advances in Electrochemistry and Electrochemical
Engineering, vol. 2, ed. by C.W. Tobias (Interscience, New York, 1962) , p. 15.

23
[47] J.C. Maxwell, A Treatise on Electricity and Magnetism, vol. 1, 2nd edn. (Clarendon Press,
Oxford, 1981) p. 435.
[48] R.E. Meredith, C.W. Tobias, J. Electrochem. Soc. 108, 286 (1961).
[49] S. Prager, Physica 29 (1963).
[50] A. Slawinski, J. Chim. Phys. 23, 710 (1926).
[51] N.O.O. Clark, Trans. Faraday Soc. 44, 13 (1948).
[52] R.E. DeLaRue, C.W. Tobias, J. Electrochem. Soc. 106, 827 (1959).
[53] R.E. DeLaRue, M.Sc. Thesis, University of California (1955).
[54] R.E. Meredith, C.W. Tobias, J. Appl. Phys. 31, 1270 (1960).
[55] R.E. Meredith, Ph.D. Thesis, University of California (1959).
[56] G.H. Neale, W.K. Nader, AIChE J. 19, 112 (1973).
[57] P.J. Sides, in Modern Aspects of Electrochemistry, vol. 18, ed. by R.E. White, J.O’M.
Bockris, B.E. Conway (Plenum Press, New York, 1986), p. 303-354.
[58] P.J. Sides, C.W. Tobias, J. Electrochem. Soc. 127, 288 (1980).
[59] P.J. Sides, C.W. Tobias, J. Electrochem. Soc. 129, 2715 (1982).
[60] O. Lanzi, R.F. Savinell, J. Electrochem. Soc. 130, 799 (1983).
[61] F. Hine, M. Yasuda, R. Nakamura, T. Noda, J. Electrochem. Soc. 122, 1185 (1975).
[62] F. Hine, K. Murakami, J. Electrochem. Soc. 127, 293 (1980).
[63] L. Sigrist, O. Dossenback, N. Ibl, J. Appl. Electrochem. 10, 223 (1980).
[64] L.J.J. Janssen, J.M.M. Geraets, E. Barendrecht, S.D.J. van Stralen, Electrochim. Acta 27,
1207 (1982).
[65] V.L. Kubasov, G.I. Volkov, Sov. Electrochem. 2, 665 (1966).
[66] K. Takata, H. Morishita, Denki Kagaku 32, 378 (1964).
[67] F. Hine, M. Yoshizawa, S. Okada, Denki Kagaku 24, 370 (1956).
[68] C.W. Tobias, J. Electrochem. Soc. 106, 833 (1959).
[69] V.K. Jain, Advanced Machining Processes (Allied Publishers PVT, Ltd., New Delhi, 2002).
[70] M. Chikhi, M. Rakib, Ph. Viers, S. Laborie, A. Hita, G. Durand, Desalination 149, 375
(2002).
[71] M.M. Saleh, J.W. Weidner, B.G. Ateya, J. Electrochem. Soc. 142, 4113 (1995).
[72] B. Roald, W. Beck, J. Electrochem. Soc. 98, 277 (1951).
[73] J. Venczel, Ph.D. Thesis, ETH Zurich Nr. 3019 (1961).
[74] L.J.J. Janssen, Electrochim. Acta 23, 81 (1978).
[75] L.J.J. Janssen, E. Barendrecht, Electrochim. Acta 24, 693 (1979).
[76] K. Stephan, H. Vogt, Electrochim. Acta 24, 11 (1979).
[77] N. Ibl, R. Kind, E. Adam, Ann. Chim. 71, 1008 (1975).
[78] L.J.J. Janssen, Electrochim. Acta 34, 161 (1989).
[79] H. Vogt, J. Appl. Electrochem. 19, 713 (1989).
[80] M. El-Amin, ed., Advanced Topics in Mass Transfer (InTech Europe, Rijeka, 2011).
[81] R. Wetind, Ph.D. Thesis, Royal Institute of Technology, Stockholm (2001).
[82] G.H. Sedahmed, A.M. Ahmed, Canadian J. Chem. Engr. 67, 942 (1989).
[83] K. Klunder, F.A. Hekman, K.L. Brown, G.F. Peaslee, Electrochemistry 80, 574 (2012).
[84] M. Hammoudi, C. Henao, K. Agbossou, Y. Dubé, M.L. Doumbia, Int. J. Hydrogen Energy
37, 13895 (2012).
[85] P. Mandin, H. Roustan, J. Hamburger, R. Würthrich, G. Picard, CHISA 2006, 17th
Int.
Congress Chem. Proc. Engr. (2006).
[86] R. Wüthrich, G. Comninellis, H. Bleuler, Electrochim. Acta 50, 5242 (2005).
[87] C.L. Fan, D.L. Piron, H.J. Miao, M. Rojas, J. Appl. Electrochem. 23, 985 (1993).
[88] L.J.J. Janssen, J. Appl. Electrochem. 17, 1177 (1987).
[89] A.A. Dahlkild, J. Fluid Mech. 428, 249 (2001).
[90] M. Rojas, C.L. Fan, H.J. Miao, D.L. Piron, J. Appl. Electrochem. 22, 1135 (1992).
[91] R.D.S. Cavalcanti, S.R. de Farias Neto, E.O. Vilar, Braz. Arch. Biol. Technol. 48, 219 (2005).
[92] M. Kuhn, G. Kreysa, J. Appl. Electrochem. 19, 720 (1989).
[93] H. Vogt, Electrochim. Acta 78, 183 (2012).
[94] S. Yang, P. Tsai, E.S. Kooij, A. Prosperetti, H.J.W. Zandvliet, D. Lohse, Langmuir 25, 1466
(2009).
[95] J.R.T. Seddon, D. Lohse, J. Phys.: Condens. Matter. 23, 133001 (2011).
[96] L. Zhang, B. Zhao, L. Xue, Z. Guo, Y. Dong, H. Fang, R. Taia, J. Hu, J. Synchrotron Rad. 20
(2013).
[97] J.H. Weijs, D. Lohse, Phys. Rev. Lett. 110, 054501 (2013).
[98] W.K. Epling, J. Gelb, S. Lilster, Adv. Funct. Mat. 22, 555 (2012).

24
Figure captions
FIG. 1: Documentation of specific radial coalescence, from Sides and Tobias [30]. The indicated
bubble at time zero receives the four bubbles around it sequentially and visibly grows. One may
observe this same effect around other bubbles in the sequence. Conditions: 10,000 frames per
second, oxygen evolution, 298 K, no forced convection, 3 wt. % KOH, 500 mA/cm2.
FIG. 2: Dimensionless volume of largest bubble or drop that adheres to an inclined surface; graph
from Dussan [37].
FIG. 3: Bubble breakoff diameter as a function of current density for a Pt gas-evolving electrode
(horizontal) in various solutions [40].
FIG. 4: Comparison of equations (6-9) predicting the reduced conductivity dispersions of spheres
of unequal sizes with data over the whole range of void fraction [57].
FIG. 5: Thickness of diffusion layer at H2-evolving horizontal Pt-electrodes of different roughness
[77].
FIG. 6: Nernst boundary layer thickness for horizontal gas-evolving Pt electrode as a function of
current density in various solutions [40].

25
Fig. 1

26
Fig. 2

27
Fig. 3
28
Fig. 4

29
Fig. 5

30
Fig 6.

![arXiv:2006.15126v1 [hep-ph] 26 Jun 2020 probabilities through energy evolution. · 2020-06-29 · arXiv:2006.15126v1 [hep-ph] 26 Jun 2020 probabilities through energy evolution. Contents](https://img.dokumen.tips/doc/110x75/5f5a12f48fabb639b41d720f/arxiv200615126v1-hep-ph-26-jun-2020-probabilities-through-energy-2020-06-29.jpg)
![The CMA Evolution Strategy: A Tutorial - arXiv · arXiv:1604.00772v1 [cs.LG] 4 Apr 2016 The CMA Evolution Strategy: A Tutorial Nikolaus Hansen Inria Research centre Saclay–ˆIle-de-France](https://img.dokumen.tips/doc/110x75/5b39186b7f8b9a310e8e10d8/the-cma-evolution-strategy-a-tutorial-arxiv-arxiv160400772v1-cslg-4.jpg)