Embed Size (px)
Citation preview

PHYSICS EXTENDED ESSAY
THE RELATIONSHIP BETWEEN THE SALINITY OF WATER AND THE REFRACTIVE INDEX OF WATER
Candidate Name: Bartu Or
Candidate Number: 001120 - 0090
Candidate School: TED Ankara College
Foundation High School
PhysicsExtendedEssayCandidateNumber:001129‐0090
2
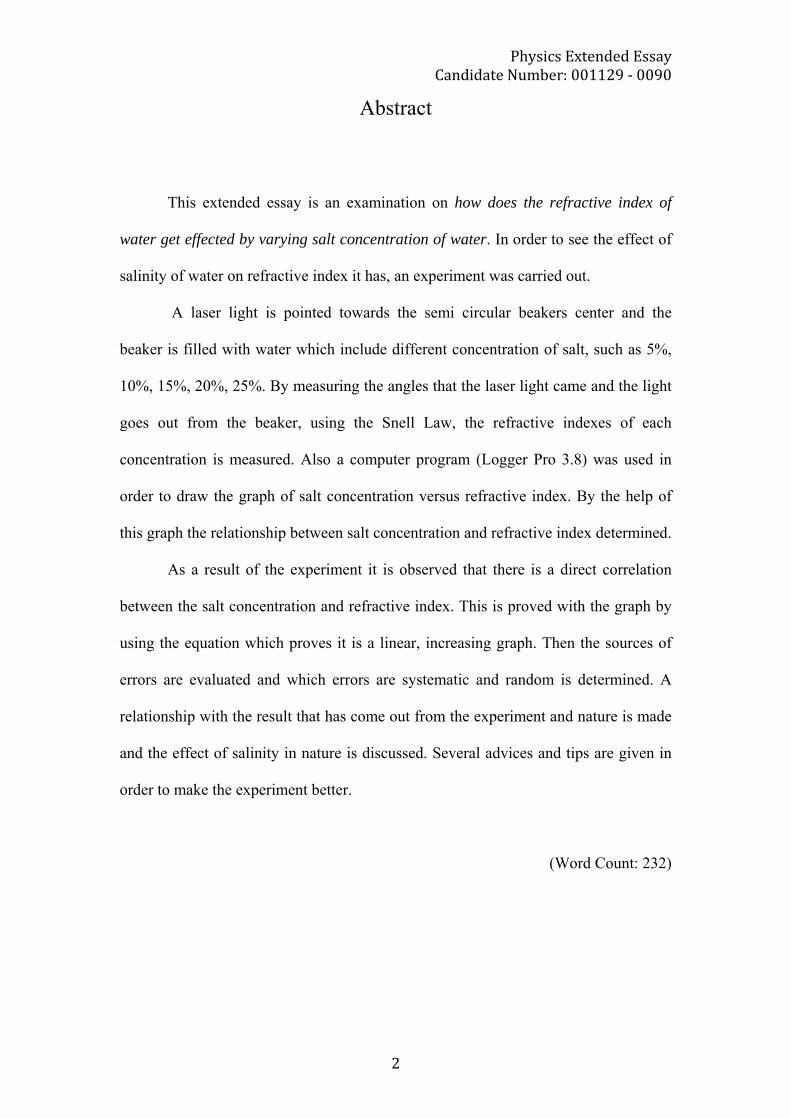
Abstract
This extended essay is an examination on how does the refractive index of
water get effected by varying salt concentration of water. In order to see the effect of
salinity of water on refractive index it has, an experiment was carried out.
A laser light is pointed towards the semi circular beakers center and the
beaker is filled with water which include different concentration of salt, such as 5%,
10%, 15%, 20%, 25%. By measuring the angles that the laser light came and the light
goes out from the beaker, using the Snell Law, the refractive indexes of each
concentration is measured. Also a computer program (Logger Pro 3.8) was used in
order to draw the graph of salt concentration versus refractive index. By the help of
this graph the relationship between salt concentration and refractive index determined.
As a result of the experiment it is observed that there is a direct correlation
between the salt concentration and refractive index. This is proved with the graph by
using the equation which proves it is a linear, increasing graph. Then the sources of
errors are evaluated and which errors are systematic and random is determined. A
relationship with the result that has come out from the experiment and nature is made
and the effect of salinity in nature is discussed. Several advices and tips are given in
order to make the experiment better.
(Word Count: 232)
PhysicsExtendedEssayCandidateNumber:001129‐0090
3
TABLE OF CONTENTS
Content Page 1) Introduction ……………………………………………4
2) Experiment …………………………………………….7
a) Apparatus …………………………………………...8
b) Method ……………………………………………...9
c) Raw Data ……………………………………………12
d) Data Calculation …………………………………….16
e) Data Analysis ………………………………………..21
3) Conclusion and Evaluation ……………………………..23
4) Bibliography ……………………………………………27

PhysicsExtendedEssayCandidateNumber:001129‐0090
4
INTRODUCTION As the scientists observed the light has a constant velocity in vacuum which is said to
be 3 x 10⁸ m s-1. This is a speed which can not be reached by us, the humans, so it is
very hard to make experiments with the light. But in the nature we can observe
different properties of light. As in deserts, someone who is stuck in there for a long
time can see mirages. We can call these mirages as games of light or illusions. But in
physics it has a simple explanation which is discovered firstly by Willebrord Snellius
(Snell) who stated an equation for this property of light.
Figure 1. Diagram of light travelling in to a different medium and refract in that
medium where n1 and n2 are the refractive indexes of the mediums and θ1, θ2 are the
angles between the light ray and the line which is perpendicular to the medium
separation line.
The discovery of the equation refers back to the Ancient Egypt times. But the first
Physicist who is said to be discovered this equation is Thomas Harriot. He did several
workings on this equation but he died before he had a chance to publish it. Then the
guy who I mentioned before, Willebrord Snellius, did some experiments and came
across with this equation but just like Harriot he did not publish it. Then the famous
PhysicsExtendedEssayCandidateNumber:001129‐0090
5
philosophe Descartes, published this equation in his famous book “Discourse on
Method”. Because there are several scientist who worked on this equation and come
up with the same result, around the world this equation has different names at
different countries.
This behavior of light is explained by the wave phenomena of the light. Every place
where light can pass has an index which determine the behavior of light in that
medium. These medium indexes are derived after accepting the vacuums index as 1.
In order to use the Snell’s law all the other mediums are said to have a higher index
than 1 and the smallest index which a medium can have is 1.
The definition of this behavior of light in physics is explained as “The difference in
the speed of propagation of light in different media is responsible for effect called
refraction.”
Also this refractive indexes of mediums can be changed by outside effects like
changing pressure, temperature, salinity etc. We can observe this change in nature by
just watching a fish in a river and another fish in a sea where both of the fishes are
staying at the same depth from the surface of the. As we all know sea has a higher
salinity than rivers so the fish can be seen closer to surface in sea than river.
In this experiment the relationship between the salinity of pure water and change in
refractive index will be investigated. The main purpose is to see the refraction of light
at different salinity rates of pure water.

PhysicsExtendedEssayCandidateNumber:001129‐0090
6
Snell’s law can be used to determine the effect of salinity by observing the angles that
are between the light rays and the normal line which is perpendicular to the line which
separates the mediums. Then the index of the medium can be determined.
PhysicsExtendedEssayCandidateNumber:001129‐0090
7
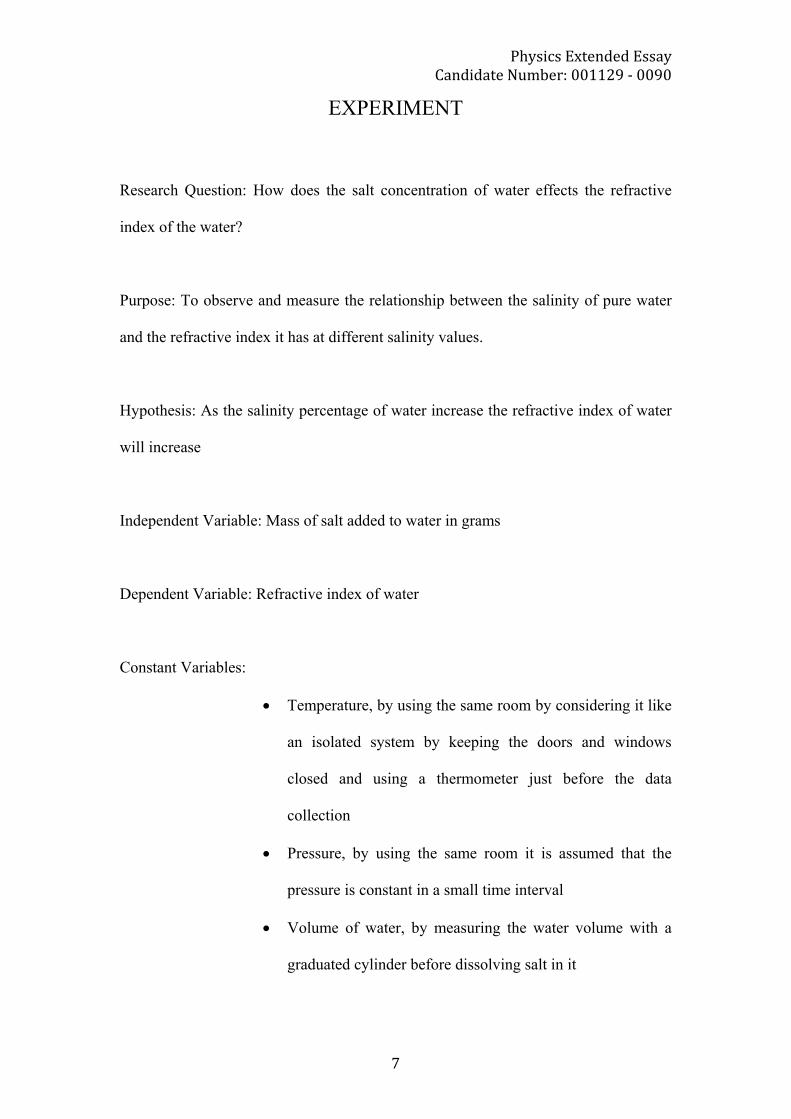
EXPERIMENT
Research Question: How does the salt concentration of water effects the refractive
index of the water?
Purpose: To observe and measure the relationship between the salinity of pure water
and the refractive index it has at different salinity values.
Hypothesis: As the salinity percentage of water increase the refractive index of water
will increase
Independent Variable: Mass of salt added to water in grams
Dependent Variable: Refractive index of water
Constant Variables:
Temperature, by using the same room by considering it like
an isolated system by keeping the doors and windows
closed and using a thermometer just before the data
collection
Pressure, by using the same room it is assumed that the
pressure is constant in a small time interval
Volume of water, by measuring the water volume with a
graduated cylinder before dissolving salt in it

PhysicsExtendedEssayCandidateNumber:001129‐0090
8
APPARATUS
Pure water (3L)
Graduated Cylinder (±0.5 ml)
Beaker (x30)
Semi-circular beaker
Laser (Green Laser, 100mW power,)
Heating Mixer
Salt (300gr)
Thermometer (analog, ±0.5ºC)
A4 Paper
Needle
Tape
Weigher (digital, ±0.5gr)
Straw
Ruler (±0.5mm)
Angle Meter (±0.1º)
PhysicsExtendedEssayCandidateNumber:001129‐0090
9
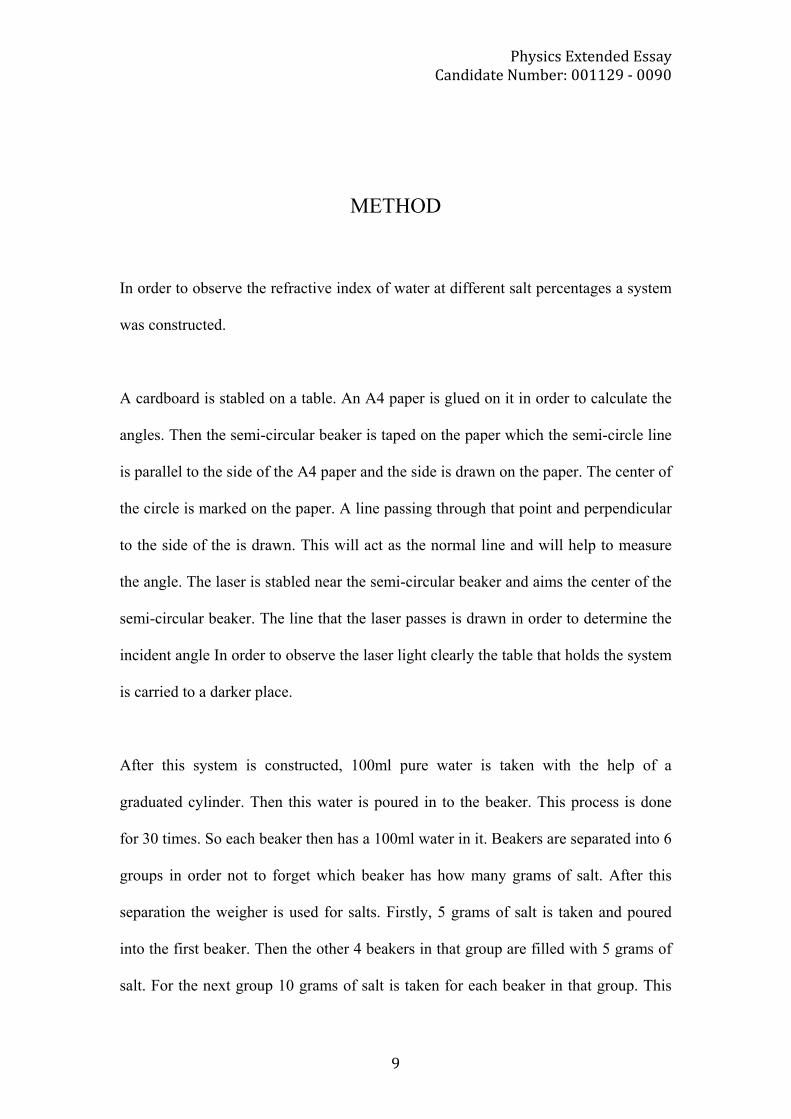
METHOD
In order to observe the refractive index of water at different salt percentages a system
was constructed.
A cardboard is stabled on a table. An A4 paper is glued on it in order to calculate the
angles. Then the semi-circular beaker is taped on the paper which the semi-circle line
is parallel to the side of the A4 paper and the side is drawn on the paper. The center of
the circle is marked on the paper. A line passing through that point and perpendicular
to the side of the is drawn. This will act as the normal line and will help to measure
the angle. The laser is stabled near the semi-circular beaker and aims the center of the
semi-circular beaker. The line that the laser passes is drawn in order to determine the
incident angle In order to observe the laser light clearly the table that holds the system
is carried to a darker place.
After this system is constructed, 100ml pure water is taken with the help of a
graduated cylinder. Then this water is poured in to the beaker. This process is done
for 30 times. So each beaker then has a 100ml water in it. Beakers are separated into 6
groups in order not to forget which beaker has how many grams of salt. After this
separation the weigher is used for salts. Firstly, 5 grams of salt is taken and poured
into the first beaker. Then the other 4 beakers in that group are filled with 5 grams of
salt. For the next group 10 grams of salt is taken for each beaker in that group. This
PhysicsExtendedEssayCandidateNumber:001129‐0090
10
process is done for the other 3 groups which will include 15, 20, 25 grams of salt
respectively. The last group will not include any salt so it is used as the control group
in the experiment.
The mixer that will be used in the experiment has the ability to heat while mixing the
water with help of the electromagnetic forces. A magnetic fish is put into the beaker
and then it starts stirring. Also the beaker is heated by the heater which is located
under the beaker.
The laser is opened before filling the semi-circular beaker and the laser light that
passes through the semi-circular beaker is marked with the help of a needle. The
needle is jabbed on the way of the light after passing inside the semi-circular beaker.
So it can be measured where the light passes through. This process is done without
water in order to control that the laser aims the center of the semi-circular beaker
because if not it will change direction.
While the mixer’s heater is opened, the experiment of the first control group will be
done. The beaker is put on the mixer in order to heat it to 30°C. The thermometer is
pricked in to the beaker and when the thermometer shows 30°C the water is poured
into the semi-circular beaker. Then the lights turn off and the laser is opened. The
needle is jabbed on the way of the light and a hole in the paper is opened. After the
marking session, the water is taken away from the beaker with the help of a straw.
The water is sucked in with the help of the straw and spitted to the sink. When all of
the water is taken away, this process is repeated for the other 4 beakers, which does
not contain any salt.

PhysicsExtendedEssayCandidateNumber:001129‐0090
11
For the second group which contains 5 grams of salt. The magnetic fish is dropped in
to the beaker and the mixer is started to stir while heating. The thermometer is pricked
and when it shows 30°C the heater is closed. After the whole salt is mixed the beaker
is poured into semi-circular beaker. Then the lights are turned of and the laser is
turned on. With the needle the way of the light ray is marked. Then with a straw the
water is sucked and the semi-circular beaker become empty. This process is done for
4 times for the other beakers which contain 5 grams of salt.
Then the same process which is done for group 2 is again done for the groups, 3, 4, 5,
6 respectively. Each beaker is mixed and heated to 30°C and poured and the refraction
is measured. By making the experiment in the same room the constant pressure
conditions are created
After the experiment the A4 paper is taken from the system and the beaker is taken
from the top of the paper. With the help of a ruler, the hole that the needle created is
connected to the intersection of normal line and side line of the beaker. By using the
angle meter the diffraction angles are measured.
PhysicsExtendedEssayCandidateNumber:001129‐0090
12
RAW DATA
Water
Amount
(±0.5ml)
Temperature
(±0.5ºC)
Salt Weight
(±0.5gr)
Concentration
(%gr/ml)
Incident
Angle
(±0.1º)
Refraction
Angle
(±0.1º)
100.0 27.0 5.0 5% 42.0º 33.2º
100.0 27.0 5.0 5% 42.0º 33.5º
100.0 27.0 5.0 5% 42.0º 33.3º
100.0 27.0 5.0 5% 42.0º 33.7º
100.0 27.0 5.0 5% 42.0º 33.8º
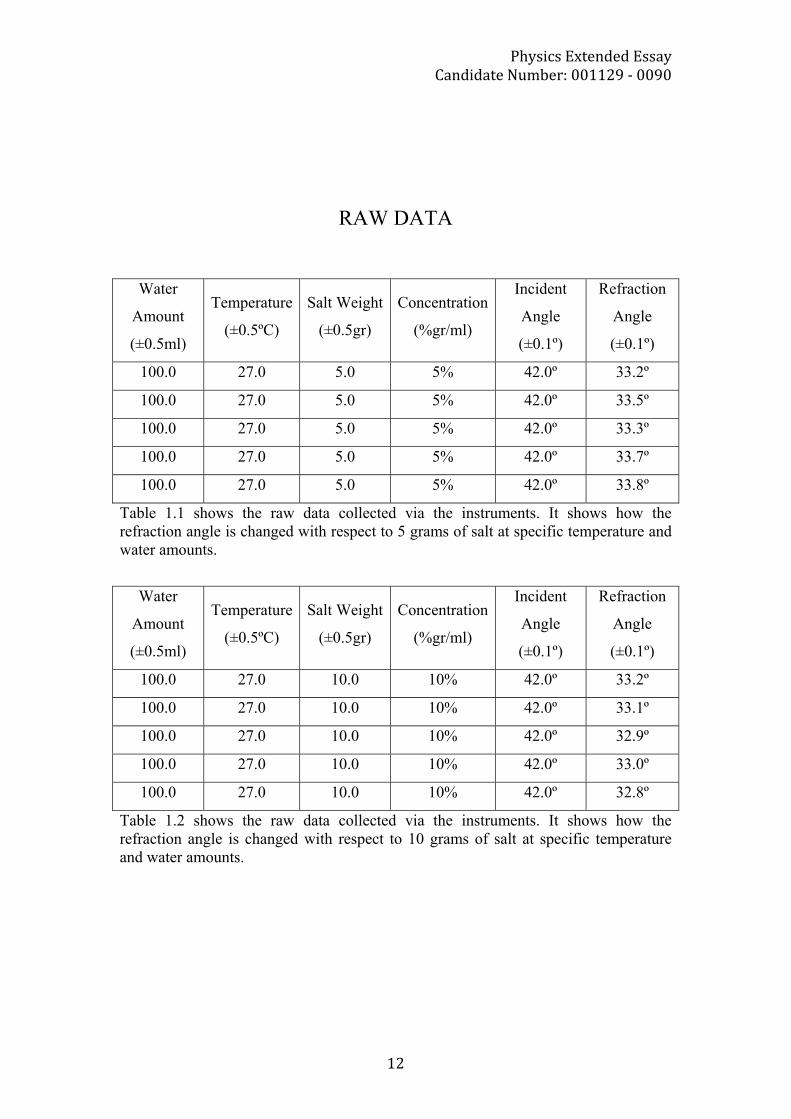
Table 1.1 shows the raw data collected via the instruments. It shows how the refraction angle is changed with respect to 5 grams of salt at specific temperature and water amounts.
Water
Amount
(±0.5ml)
Temperature
(±0.5ºC)
Salt Weight
(±0.5gr)
Concentration
(%gr/ml)
Incident
Angle
(±0.1º)
Refraction
Angle
(±0.1º)
100.0 27.0 10.0 10% 42.0º 33.2º
100.0 27.0 10.0 10% 42.0º 33.1º
100.0 27.0 10.0 10% 42.0º 32.9º
100.0 27.0 10.0 10% 42.0º 33.0º
100.0 27.0 10.0 10% 42.0º 32.8º
Table 1.2 shows the raw data collected via the instruments. It shows how the refraction angle is changed with respect to 10 grams of salt at specific temperature and water amounts.

PhysicsExtendedEssayCandidateNumber:001129‐0090
13
Water
Amount
(±0.5ml)
Temperature
(±0.5ºC)
Salt Weight
(±0.5gr)
Concentration
(%gr/ml)
Incident
Angle
(±0.1º)
Refraction
Angle
(±0.1º)
100.0 27.0 15.0 15% 42.0º 32.1º
100.0 27.0 15.0 15% 42.0º 31.7º
100.0 27.0 15.0 15% 42.0º 32.2º
100.0 27.0 15.0 15% 42.0º 32.3º
100.0 27.0 15.0 15% 42.0º 31.7º
Table 1.3 shows the raw data collected via the instruments. It shows how the refraction angle is changed with respect to 15 grams of salt at specific temperature and water amounts.
Water
Amount
(±0.5ml)
Temperature
(±0.5ºC)
Salt Weight
(±0.5gr)
Concentration
(%gr/ml)
Incident
Angle
(±0.1º)
Refraction
Angle
(±0.1º)
100.0 27.0 20.0 20% 42.0º 31.7º
100.0 27.0 20.0 20% 42.0º 31.9º
100.0 27.0 20.0 20% 42.0º 31.5º
100.0 27.0 20.0 20% 42.0º 31.3º
100.0 27.0 20.0 20% 42.0º 31.1º
Table 1.4 shows the raw data collected via the instruments. It shows how the refraction angle is changed with respect to 20 grams of salt at specific temperature and water amounts.
Water
Amount
(±0.5ml)
Temperature
(±0.5ºC)
Salt Weight
(±0.5gr)
Concentration
(%gr/ml)
Incident
Angle
(±0.1º)
Refraction
Angle
(±0.1º)
100.0 27.0 25.0 25% 42.0º 30.6º
100.0 27.0 25.0 25% 42.0º 30.5º
100.0 27.0 25.0 25% 42.0º 30.5º
100.0 27.0 25.0 25% 42.0º 30.4º
100.0 27.0 25.0 25% 42.0º 30.5º
Table 1.5 shows the raw data collected via the instruments. It shows how the refraction angle is changed with respect to 25 grams of salt at specific temperature and water amounts.

PhysicsExtendedEssayCandidateNumber:001129‐0090
14
Water
Amount
(±0.5ml)
Temperature
(±0.5ºC)
Salt Weight
(±0.5gr)
Concentration
(%gr/ml)
Incident
Angle
(±0.1º)
Refraction
Angle
(±0.1º)
100.0 27.0 0.0 0% 42.0º 33.7º
100.0 27.0 0.0 0% 42.0º 33.3º
100.0 27.0 0.0 0% 42.0º 34.4º
100.0 27.0 0.0 0% 42.0º 34.1º
100.0 27.0 0.0 0% 42.0º 34.5º
Table 1.6 shows the raw data collected via the instruments. It shows how the refraction angle is changed with respect to 0 grams of salt at specific temperature and water amounts.
The datas that were collected from the 6 experiments are above given. Then I wrote
average of the each experiment on the table 2.1. I used the formula
R = Refraction Angle
(R1 + R2 + R3 + R4 + R5) / 5 = Raverage
PhysicsExtendedEssayCandidateNumber:001129‐0090
15
Water
Amount
(±0.5ml)
Temperature
(±0.5ºC)
Salt Weight
(±0.5gr)
Concentration
(%gr/ml)
Incident
Angle
(±0.1º)
Refraction
Angle
(±0.1º)
100.0 27.0 0.0 0% 42.0º 34.0º
100.0 27.0 5.0 5% 42.0º 33.5º
100.0 27.0 10.0 10% 42.0º 33.0º
100.0 27.0 15.0 15% 42.0º 32.0º
100.0 27.0 20.0 20% 42.0º 31.5º
100.0 27.0 25.0 25% 42.0º 30.5º
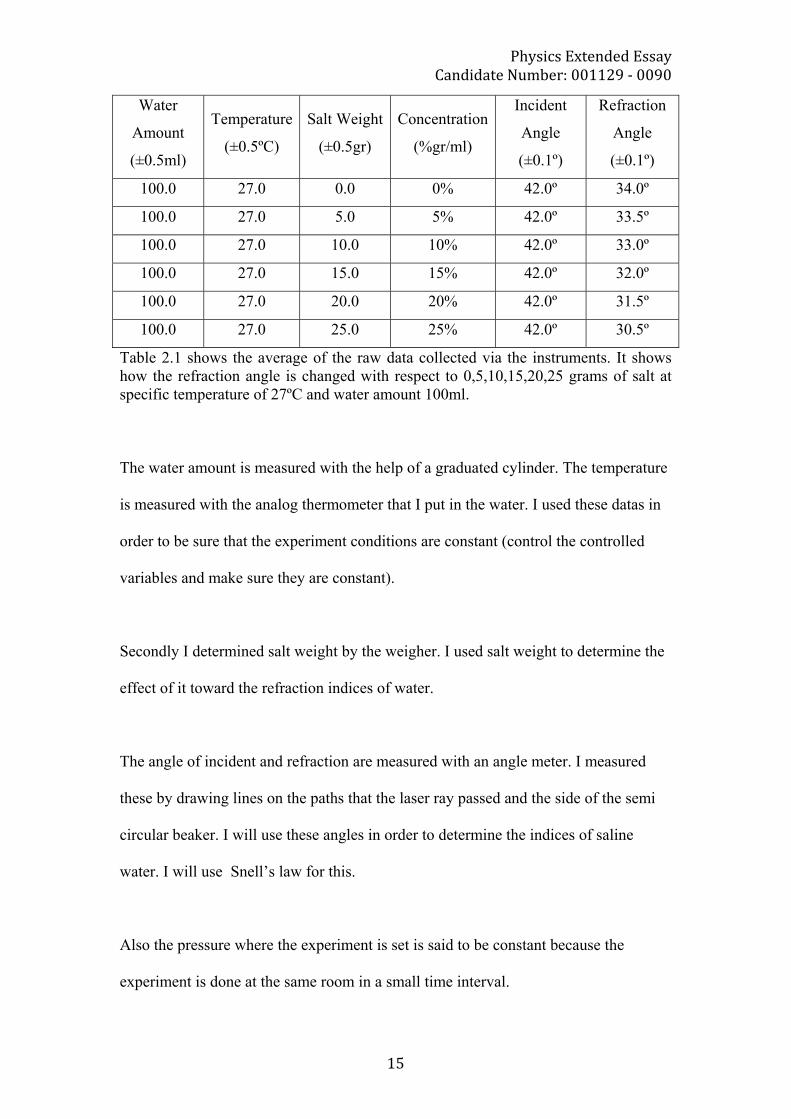
Table 2.1 shows the average of the raw data collected via the instruments. It shows how the refraction angle is changed with respect to 0,5,10,15,20,25 grams of salt at specific temperature of 27ºC and water amount 100ml.
The water amount is measured with the help of a graduated cylinder. The temperature
is measured with the analog thermometer that I put in the water. I used these datas in
order to be sure that the experiment conditions are constant (control the controlled
variables and make sure they are constant).
Secondly I determined salt weight by the weigher. I used salt weight to determine the
effect of it toward the refraction indices of water.
The angle of incident and refraction are measured with an angle meter. I measured
these by drawing lines on the paths that the laser ray passed and the side of the semi
circular beaker. I will use these angles in order to determine the indices of saline
water. I will use Snell’s law for this.
Also the pressure where the experiment is set is said to be constant because the
experiment is done at the same room in a small time interval.

PhysicsExtendedEssayCandidateNumber:001129‐0090
16
DATA CALCULATION
In this experiment there are some values that cannot be reached by using
specific instruments. So some calculations must be done in order to determine the
indices of saline water at different salinity rates. So the Snell’s law must be used.
Because I assume that I prepared the experiment in the ideal air, I will assume its
refractive index as 1.
n1 x sinα = n2 x sinβ
We will assume that n1 is equal to 1 because of air.
For the 5 grams of salt
α = 42º, n1 = 1 …….. β = 33.5º , n2 = ?
sinα = sin42.0º = 0.6691
Error = (sin43 – sin41) / 2= 0.0129
Sinα = 0.6691 ± 0.0129 = 0.6691 ± 1.92%
sinβ = sin33.5º = 0.5519
Error = (sin34.5 – sin32.5) / 2 = 0.0145
Sinβ = 0.5519 ± 0.0145 = 0.5519 ± 2.62%
n1 x sinα = n2 x sinβ
1 x sin42 = n x sin33.5
(1 x sin42) / sin(33.5) = 1.2123
Error = 1.92 + 2.62 = 4.54%
1.2123 ± 4.54%

PhysicsExtendedEssayCandidateNumber:001129‐0090
17
For the 10 grams of salt
α = 42º, n1 = 1 …….. β = 33.0º , n2 = ?
sinα = sin42.0º = 0.6691
Error = (sin43 – sin41) / 2= 0.0129
Sinα = 0.6691 ± 0.0129 = 0.6691 ± 1.92%
sinβ = sin33.0º = 0.5446
Error = (sin34.0 – sin32.0) / 2 = 0.0146
Sinβ = 0.5446 ± 0.0146 = 0.5446 ± 2.68%
n1 x sinα = n2 x sinβ
1 x sin42 = n x sin33
(1 x sin42) / sin(33) = 1.2286
Error = 1.92 + 2.68 = 4.6%
1.2286 ± 4.60%
For the 15 grams of salt
α = 42º, n1 = 1 …….. β = 32.0º , n2 = ?
sinα = sin42.0º = 0.6691
Error = (sin43 – sin41) / 2= 0.0129
Sinα = 0.6691 ± 0.0129 = 0.6691 ± 1.92%
sinβ = sin32.0º = 0.5299
Error = (sin33.0 – sin31.0) / 2 = 0.0148
PhysicsExtendedEssayCandidateNumber:001129‐0090
18
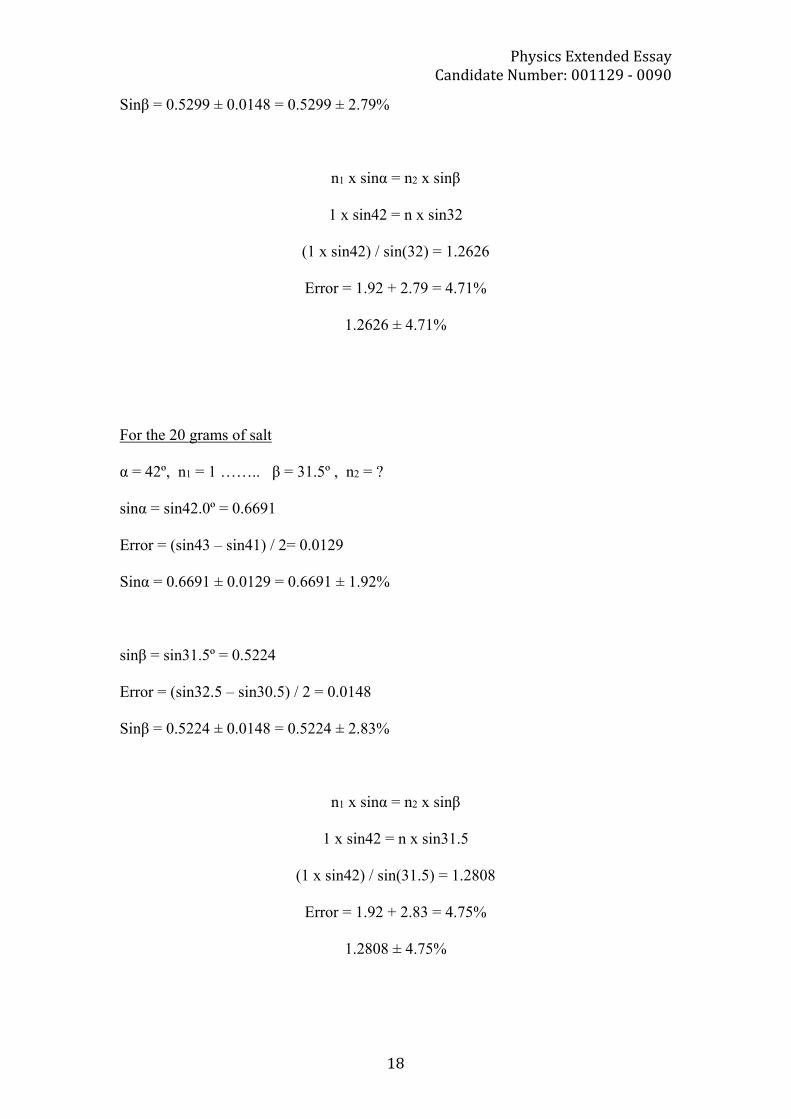
Sinβ = 0.5299 ± 0.0148 = 0.5299 ± 2.79%
n1 x sinα = n2 x sinβ
1 x sin42 = n x sin32
(1 x sin42) / sin(32) = 1.2626
Error = 1.92 + 2.79 = 4.71%
1.2626 ± 4.71%
For the 20 grams of salt
α = 42º, n1 = 1 …….. β = 31.5º , n2 = ?
sinα = sin42.0º = 0.6691
Error = (sin43 – sin41) / 2= 0.0129
Sinα = 0.6691 ± 0.0129 = 0.6691 ± 1.92%
sinβ = sin31.5º = 0.5224
Error = (sin32.5 – sin30.5) / 2 = 0.0148
Sinβ = 0.5224 ± 0.0148 = 0.5224 ± 2.83%
n1 x sinα = n2 x sinβ
1 x sin42 = n x sin31.5
(1 x sin42) / sin(31.5) = 1.2808
Error = 1.92 + 2.83 = 4.75%
1.2808 ± 4.75%
PhysicsExtendedEssayCandidateNumber:001129‐0090
19
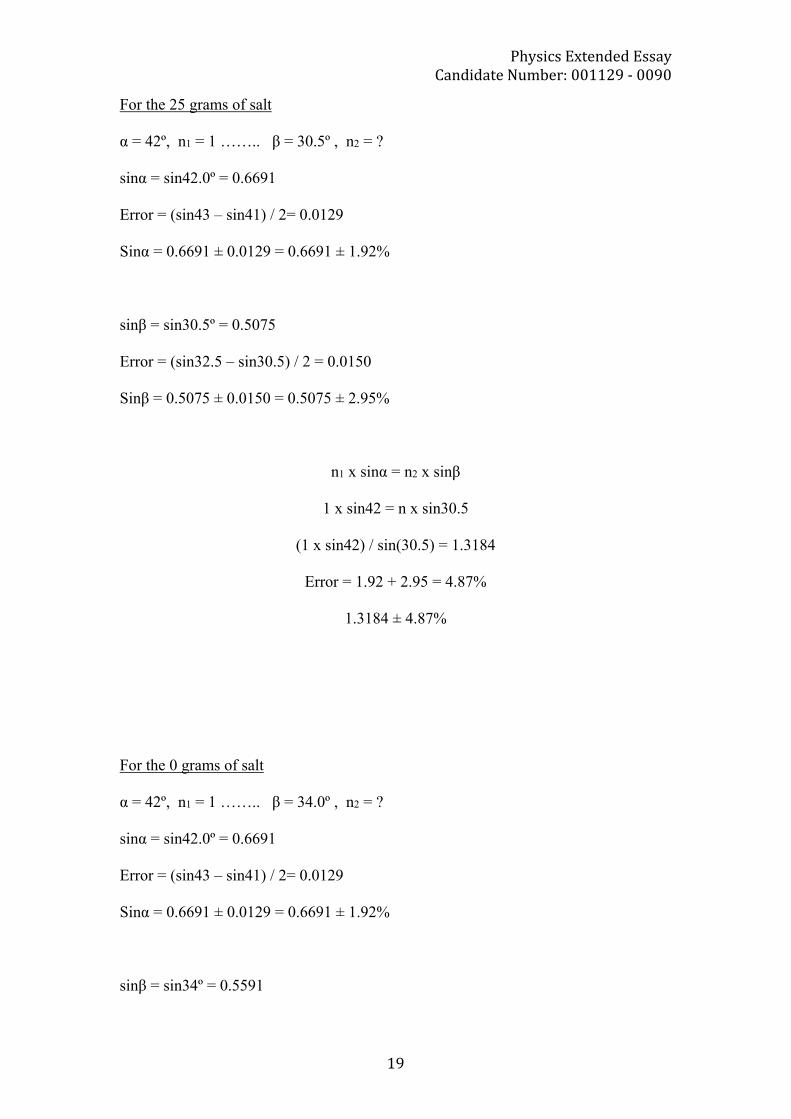
For the 25 grams of salt
α = 42º, n1 = 1 …….. β = 30.5º , n2 = ?
sinα = sin42.0º = 0.6691
Error = (sin43 – sin41) / 2= 0.0129
Sinα = 0.6691 ± 0.0129 = 0.6691 ± 1.92%
sinβ = sin30.5º = 0.5075
Error = (sin32.5 – sin30.5) / 2 = 0.0150
Sinβ = 0.5075 ± 0.0150 = 0.5075 ± 2.95%
n1 x sinα = n2 x sinβ
1 x sin42 = n x sin30.5
(1 x sin42) / sin(30.5) = 1.3184
Error = 1.92 + 2.95 = 4.87%
1.3184 ± 4.87%
For the 0 grams of salt
α = 42º, n1 = 1 …….. β = 34.0º , n2 = ?
sinα = sin42.0º = 0.6691
Error = (sin43 – sin41) / 2= 0.0129
Sinα = 0.6691 ± 0.0129 = 0.6691 ± 1.92%
sinβ = sin34º = 0.5591

PhysicsExtendedEssayCandidateNumber:001129‐0090
20
Error = (sin35 – sin33) / 2 = 0.0144
Sinβ = 0.5591 ± 0.0144 = 0.5591 ± 2.57%
n1 x sinα = n2 x sinβ
1 x sin42 = n x sin34
(1 x sin42) / sin(34) = 1.1967
Error = 1.92 + 2.57 = 4.49%
1.1967 ± 4.49%
Table 3.1 shows the sine of incident and refractive angles at specific temperature 27ºC, water amount 100ml, with changing salt weights 5, 10, 15, 20, 25 and according to that changing concentrations 5%, 10%, 15%, 20%, 25%.
Water
Amount
(±0.5ml)
Temperature
(±0.5ºC)
Salt Weight
(±0.5gr)
Concentration
(%gr/ml)
Sine of
incident
angle
Sine of
refractive
angle
100.0 27.0 0.0 0% 0.6691 ±
0.0129
0.5591 ±
0.0144
100.0 27.0 5.0 5% 0.6691 ±
0.0129
0.5519 ±
0.0145
100.0 27.0 10.0 10% 0.6691 ±
0.0129
0.5446 ±
0.0146
100.0 27.0 15.0 15% 0.6691 ±
0.0129
0.5299 ±
0.0148
100.0 27.0 20.0 20% 0.6691 ±
0.0129
0.5224 ±
0.0148
100.0 27.0 25.0 25% 0.6691 ±
0.0129
0.5075 ±
0.0150

PhysicsExtendedEssayCandidateNumber:001129‐0090
21
DATA ANALYSIS
Salt Weight
(±0.5gr)
Concentration
(±0.5
%gr/ml)
Sine of
incident
angle
Sine of
refractive
angle
Refraction
index of air
Refractive
index of
saline water
0.0 0% 0.6691 ±
0.0129
0.5591 ±
0.0144 1
1.1967 ±
4.49%
5.0 5% 0.6691 ±
0.0129
0.5519 ±
0.0145 1
1.2123 ±
4.54%
10.0 10% 0.6691 ±
0.0129
0.5446 ±
0.0146 1
1.2286 ±
4.60%
15.0 15% 0.6691 ±
0.0129
0.5299 ±
0.0148 1
1.2626 ±
4.71%
20.0 20% 0.6691 ±
0.0129
0.5224 ±
0.0148 1
1.2808 ±
4.75%
25.0 25% 0.6691 ±
0.0129
0.5075 ±
0.0150 1
1.3184 ±
4.87%
Table 3.2 shows the sine of incident, refractive angles and refraction indexes of air, saline water at specific temperature 27ºC, water amount 100ml, with changing salt weights 5, 10, 15, 20, 25 and according to that changing concentrations 5%, 10%, 15%, 20%, 25%.
Average Error of Refractive Index
Error of (n1 + n2 + n3 + n4 + n5 + n6) / 6
(4.49 + 4.54 + 4.60+ 4.71 + 4.75 + 4.87) / 6 = 4.66%
PhysicsExtendedEssayCandidateNumber:001129‐0090
22
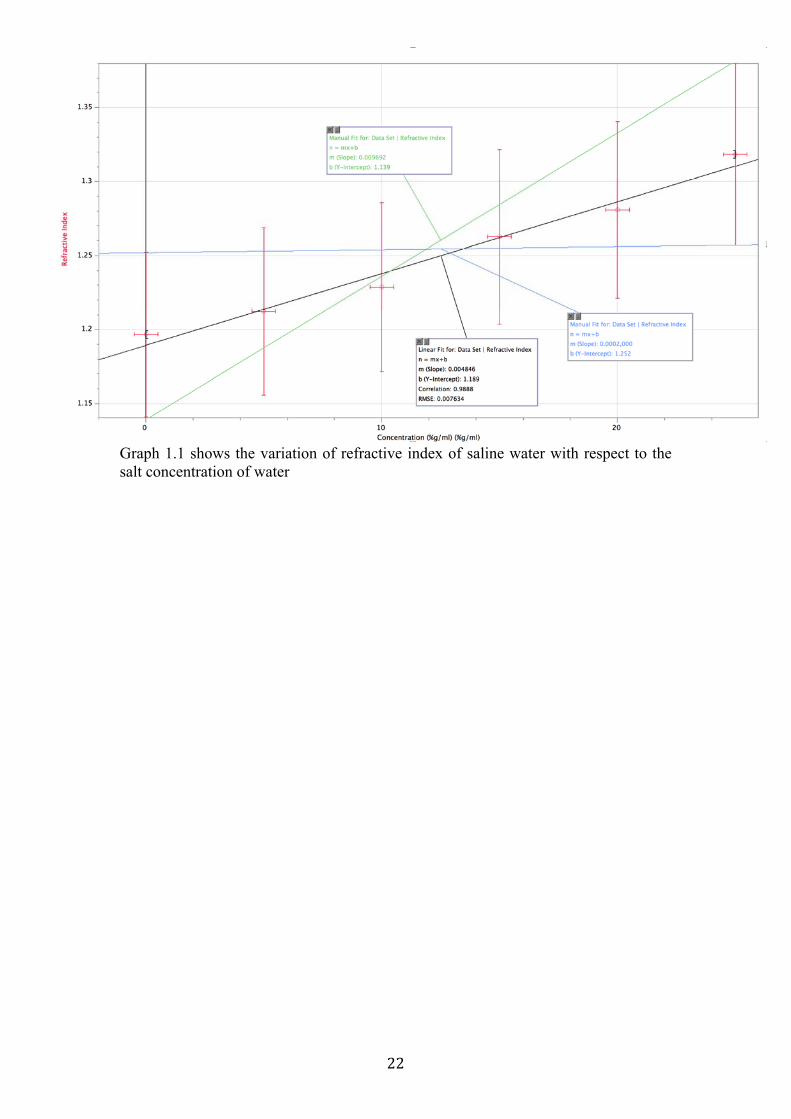
Graph 1.1 shows the variation of refractive index of saline water with respect to the salt concentration of water

PhysicsExtendedEssayCandidateNumber:001129‐0090
23
CONCLUSION AND EVALUATION
In this thesis, effect of salinity on the refractive index of water is discussed. In
order to show this effect several experiments and measurements are carried out and
relationship between salinity concentration of water and refractive index of water is
measured.
The relationship is found to be as, the salinity of water is increased, therefore
the refractive index is increased. We can prove this from the graph 1.1. The graphs
equation is like y = mx + n, which tells us that this is a linear line. Also the m value,
slope is positive and the angle between the graphic and the x-axis is acute angle.
These mean that the equation and the graph have a positive, linear, increasing
equation. So as the salt concentration in water increases, the refractive index
increases.
In reality we can observe this effect best in the seas and oceans. The salinity of
seas and oceans varies form sea to sea. This effects the light that is refracted from the
surface of the sea/ocean. The light amount that is passed through the sea surface
effects the living species. There are three main sea regions in which different amounts
of light reach and in which different kinds of fauna and flora can be found. These
three sea regions are: the sunlight zone, the twilight zone, and the midnight zone.
Each one of the three main zones have its own characteristics and is a whole different
sea world that the others. Besides these zones, the coast line is also often seen as
another sea region due to the way it can also show a specific sea activity. The sunlight
zone is the water region that is closer to the surface and therefore it is the one which
PhysicsExtendedEssayCandidateNumber:001129‐0090
24
receives the highest amount of light. The co-relation of water and light of this zone
allows more than 90% of sea species to live in it. Besides, the sunlight zone is the
only one in which plants can live due to the amount of light they receive in it. The
second sea region is the twilight zone. In this zone we can find sea animals such as
shrimps and squids. And the third sea region, called the midnight zone, is the deep
dark sea area where light doesn't reach. In this zone only about 1% of sea species live,
and animals such as sharks have their habitats in it. The temperature in the midnight
zone is almost freezing and water pressure is very high. [2] As seen in this quotation,
the zones are created by the sunlight intensity so they are directly effected by the
salinity.
In my hypothesis, I suggested that the relationship between salt concentration
and the refractive is direct correlation. After the experiment I carried out and the
measurement I made, I have observed that my hypothesis is correct and correlation
between them is direct. So the purpose of the experiment is achieved, and the
correlation is calculated.
There are several errors in the experiment that has effected the result,
Refractive index is directly effected by the temperature change. It is said to be
that as the temperature increase the refractive index increase. In my
experiment, before pouring the saline water into the semi-circular beaker, I
measured its temperature, after that the temperature of the water may be
changed. So this can effect the result I came across.
PhysicsExtendedEssayCandidateNumber:001129‐0090
25
In order to observe the refraction the water in the semi-circular beaker must be
stable. If not, there may be several different refractions so a constant, stable
refraction cannot be observed. In my experiment, because of the experiment
conditions the table I did the experiment on is almost stable. It still shakes if it
is touched. I tried to avoid this and waited for a little time to water get stable
but this can still effect my experiment results.
After refraction as I mentioned in my method a put a needle on the direction of
laser light. But the radius of the laser light is big so it prevented me from
making exact measurements. The needle I stick on the direction may vary on
the way of laser light. This may change the angles that are measured.
In my experiment I observed the relationship of salinity and refractive index,
so the salts that I add in the water must be mixed homogeneous. In order to
achieve this I mixed them with a special mixer and I heated it in order to make
the mixing process better. But when it cooled down I observed that some salt
particles are precipitated. So my concentration is changed and my experiment
is effected.
In this experiment the errors that are about variable temperature and precipitation
of salt caused systematic errors. Temperature has a huge impact on refractive
index. With considering this I tried to make the experiment at the same
temperature, 27ºC, but the room temperature is not stable so it changed the
temperature of the water I made experiment on. Salt concentration is the main
independent variable I used in this experiment. I tried to prepare 5%, 10%, 15%,

PhysicsExtendedEssayCandidateNumber:001129‐0090
26
20% and 25% concentrated saline water. But it is very hard to solve these salts in
the water. After a long mixing process, I mixed most of the salt. But after a while
I observed small salt particles which means they precipitated. Each of the datas
are faced these problems, such as temperature and salt precipitation. So they
caused a systematic error.
My other errors, such as holding the table I used stable and the radius of the laser
light I used are said to be random errors. In most of my trials I hold the table still
and I got accurate results but in my several trials while I was trying to open the
laser, the stableness of the table is broken and those trials faced this error. Also the
radius of the laser light is not a problem in all my trials. I put the needle at the side
of the laser light but in some trials, it is not easy to determine the side of the light
so my needle slided a little. This directly effected my experiment because I used
those needles to measure the angle.
In order to come across with better results, my experiment can be changed. There
are some ideas and suggestions to make it better. To begin with a stable
experiment area can be created, so this will prevent the shifting water level. A
better laser can be used which has a less radius in order to make the measurement
more accurate. In order to dissolve whole salt into the water it can be mixed more
times. This will prevent the precipitation and create a more accurate
concentration. In order to control the temperature change, the experiment can be
done in a closed system whose temperature can be controlled. So this will
decrease heat transfer and consequently the temperature change. Then the
refractive index can be measured without the effect of temperature.

PhysicsExtendedEssayCandidateNumber:001129‐0090
27
BIBLIOGRAPHY
1) Tsokos, K.A., Physics for the IB Diploma, Cambridge, Cambridge University
Press, 2011
2) “Discovery of Law of Refraction”. San Diego State University
12.Nov.2013 <http://mintaka.sdsu.edu/GF/explain/optics/discovery.html>
3) “Refraction of Light”. Georgia State University
13.Nov.2013. <http://hyperphysics.phy-astr.gsu.edu/hbase/geoopt/refr.html>
4) “Sea Life Depending On Water Light”. Dive Pilot
02.Jan.2014 <http://www.divepilot.com/diving-physics/sea-life-depending-on-
water-and-light.php>