Embed Size (px)
Citation preview

PHYSICO-CHEMICAL STUDIES OF AQUEOUS SYSTEMS
ABSTRACT THESIS
SUBMITTED FOR THE AWARD OF THE DEGREE OF
Siottor of ^IjilosiopI)? IN
CHEMISTRY
BY
TAUSIF ALTAMASH
Under the Supervision of
DR. RIYAZUDDEEIM
DEPARTMENT OF CHEMISTRY ALIGARH MUSLII^ UNIVERSITY
AUGARH (INDIA)
2009
ABSTRACT
Ultrasonic velocity (u), density (p) and viscosity coefficient (r|) values of
amino acid / peptide + 2M aqueous KCl / 2M aqueous KNO3 solutions
(amino acid / peptide: L-histidine/ L-glutamic acid / L-tryptophan /
glycylglycine) have been measured as a function of amino acid / peptide
molal concentration at temperatures: 298.15, 303.15, 308.15, 313.15, 318.15
and 323.15 K. The measured density values exhibit usual increasing trend of
variation with an increase in amino acid / peptide molal concentration and a
decreasing trend with an increase in temperature for the systems under
investigation. The ultrasonic velocity values have been found to be increased
with an increase in amino acid / peptide molal concentration and temperature
in all the solutions. The increase in ultrasonic velocity value with an increase
in amino acid / peptide molal concentration has been attributed to an overall
increase in cohesion in solution brought about by the solute-solute and
solute-solvent interactions in solutions. These interactions have been
discussed in terms of ion-ion, ion-zwitterion, ion-water dipole and
zwitterion-water dipole electrostatic interactions operative in the solutions.
It has been assumed that smaller in size but more compact clusters of water
are formed with an increase in temperature. Using the experimentally
measured data of u and p, the isentropic compressibility (KS), change in
isentropic compressibility (AKS), relative change in isentropic
compressibility (AKS/KQ), specific acoustic impedance (Z) and relative
association (RA) values have been computed. These parameters have been
used to examining the solute-solute and solute-solvent interactions in all the
systems.
The Ks values have been found to be decreased with an increase in
molal concentration of amino acid / peptide as well as temperature in all the
studied systems. The decrease in Kg values with an increase in temperature

has been attributed to the corresponding decrease of Kreiax (a relaxational part
of compressibility), which is dominant over the corresponding increase of KOO
(an instantaneous part of compressibility).The computed AKS and AKS/KQ
values have been fitted linearly with molal concentration of amino acid /
peptide. The AKS and (AKS/KQ) exhibit increasing trends of variation with an
increase in molal concentration of amino acid / peptide in the solutions.
However, an irregular trend of variation with temperature has been
observed. The specific acoustic impedance values exhibit an increasing trend
of variation with an increase in amino acid / peptide molal concentration and
temperature. These trends of variation have been ascribed to an overall
reduction in the repulsive forces with an increase in amino acid / peptide
molal concentration and temperature. The relative association values do not
show any remarkable change with variations in solute concentration and
temperature. This has been attributed to the presence of essentially weaker
interactions in the systems under investigation.
Density and ultrasonic velocity data also have been employed for the
calculation of isothermal compressibility values (KT) by using McGowan's;
and Pandey's and Vyas' relations. It is noteworthy that the values of KT
obtained from these two relations are quite close to each other in all the
systems investigated. The trends of variation of KJ values with an increase in
molal concentration of amino acid / peptide and temperature in 2M aqueous
KCl and 2M aqueous KNO3 solvent systems are in agreement with the trends
of variations of isentropic compressibility values. The internal pressure (Pi),
solubility parameter (6), pseudo-gruneisen parameter (F) values also have
been computed by using the KJ values obtained from McGowan's relation.
The computed values of internal pressure and solubility parameter exhibit an
irregular trend of variation with an increase in solute concentration. The
increase / decrease in Pi and d values with an increase in solute concentration
may be due to a corresponding increase / decrease in cohesive forces in all
the systems under investigation. The pseudo-gruneisen parameter values are
negative at all molal concentrations of solutions and at all studied
temperatures. A negative sign is an indication of strong intermolecular
interactions and a probable formation of intermolecular complex in the
solution.
The apparent molal volumes ((j)v) and apparent molal isentropic
compressibilities ((t)k) of amino acid / peptide: L-histidine, L-glutamic acid,
L-tryptophan and glycylglycine in 2M aqueous KCl and 2M aqueous KNO3
solutions have been calculated as a functions of amino acid / peptide molal
concentration at all temperatures of study by using density and isentropic
compressibility values. These (j)v and (j)k values have been used to obtain the
apparent molal volume at infinite dilution which is also known as partial
molal volume ((() ° ); and apparent molal isentropic compressibility at infinite
dilution which is also known as partial molal isentropic compressibility
((j)" ) for amino ecid / peptide in the 2M aqueous KCl and 2M aqueous
KNO3 solutions at all temperatures of investigation. The observed (|)° values
for the studied amino acid / peptide in said aqueous electrolytic medium
have been found to be positive and larger in magnitude than those of
correspondmg values in aqueous medium. The trend of variation (|)° values
with variatior in temperature have been discussed in terms of electrostriction
of water molecule occurring near the end groups of zwitterions. The increase
in (|)° values with an increase in temperature has been attributed to the
volume expansion of hydrated zwitterion of amino acid / peptide or a
reduction in electrostriction. The positive ^ ° values of L-histidine, L-
glutamic acid, L-tryptophan and glycylglycine in 2M aqueous solution of
KCl and 2M aqueous solution KNO3 at all temperatures indicate the strong
solute-solvent interactions in solutions. The (|)° values of L-histidine, L-
glutamic acid, L-tryptophan and glycylglycine in 2M aqueous solution of
KCl and 2M aqueous solution of KNO3 shows an irregular trend of variation
with an increase in temperature. The ^l values have been found to be
positive as well as negative in the systems under investigation. The negative
partial molal isentropic compressibility values indicate that the water
molecules around the amino acid / peptide molecules are less compressible
than the water molecule in the bulk solvent. This behaviour has been
discussed in terms of electrostatic forces operative between zwitterions and
ions of solutions. The negative and positive magnitudes of Sy and Sk values
have been explained in terms of weak and strong solute-solute interactions,
respectively.
The viscosity values cf L-histidine/ L-glutamic acid / L-tryptophan /
glycylglycine in 2M aqueous KCl and 2M aqueous KNO3 solutions exhibit
usual increasing trend with an increase in amino acid / peptide molal
concentration, and a decreasing trend with an increase in temperature in all
the systems under investigation. The trends of variation of calculated
specific viscosity (r|sp) values with an increase in molal concentration of
solute and temperature are similar to those of the viscosity values. The
relative viscosity (rjr) data, for all the systems have been fitted to the Jones-
Doles equation in order to evaluate the B-coefficient values. The (dB/dT)
values have been obtained from the B-coefficient values for all amino acids
/ peptide in 2M aqueous KCl and 2M aqueous KNO3 solutions. The
viscosity B-coefficient values and (dB/dT) values for (amino acid / peptide:
L-histidine/ L-glutamic acid / L-tryptophan / glycylglycine) have been found
to be positive and negative in sign, respectively. The computed viscosity B-
coefficient values have been compared with literature values, A good
agreement has been found between the observed and literature values. The
structure-making and structure-breaking effects of the amino acid / peptide
on 2M aqueous KCl and 2M aqueous KNO3 solvents have been discussed in
terms of the positive and negative signs of B-coefficient and (dB/dT) values.
PHYSICO-CHEMICAL STUDIES OF AQUEOUS SYSTEMS
1
THESIS
SUBMITTED FOR THE AWARD OF THE DEGREE OF
Bottor of $I)ilo!8^opt)p IN
CHEMISTRY
BY
TAUSIF ALTAMASH
Under the Supervision of
DR. RIYAZUDDEEN
DEPARTMENT OF CHEMISTRY ALIGARH MUSLIM UNIVERSITY
ALJGARH (INDIA)
2009

\^^ AB«^

DEPARTMENT OF CHEMISTRY ALIGARH MUSLIM UNIVERSITY ALlGARH-202002, INDIA
Phones; (E '^- • (0571)2703515 \ Int. : 3350, 3351
Dated ...^^}h.^::^..
CERTIFICATE
This is to certify that the work presented in this thesis entitled "Physico-
Chemical Studies of Aqueous Systems" is original, carried out by
Mr. Tausif Altamash, under my supervision and is suitable for submission
for the award of Ph.D. degree in Chemistry of this University.
(Dr. Riyazuddeen)
ACKNOWLEDGMENTS
At the inception, I bow my head before ALLAH Almighty; the Lord of the worlds who endow with me the enough vehemence to complete the task in the real time period.
My Vocabulary comes to a standstill just to find the words to thank my esteemed supervisor Dr. Riyazuddeen, Associate Professor, Dept. of Chemistry, AMU. More than a guide and an inspiration in the real senses, I find him always standing with me even in the sluggish times and cumbersome days of my research work. I thank him for his orgiastic interests and incessant support and pay my obeisance and gratitude for all his benevolences and favors.
I am also indebted to Prof. (Mrs.) Arunima Lai, the Chairman, Department of Chemistry, for providing me all the necessary facilities.
The deepest chamber of my heart goes ecstatic when I stands up to thank and remember my parents Mrs. Rukhsana Manzar and Mr. Manzar Kamal who, I believe, are the ever best and wonderful parents the world has witnessed.
How can I forget to remember my dearest younger sister and my Proud Ambareen, my sweet brother and my confidence Saifand my little angel, my smiles Anashiya at this juncture. I feel the blessings of my Dadaji (Late) Hafizur Rahman Ansari, my Nanaji Janab Abdul Mannan with (Late) Jameel Mamu and the help and supports of my uncles Janab Khursheed Kamal, Prof. Khalid Kamal Ansari and my friend like uncle Janab Firoz Kamal and his good wife Mrs. Husna Firoz. My Cousins had always encouraged and supported me and are thereby deserving my affections and accolades. My brother-in-Law Zaid Jalees deserves special thanks for being always standing ready for me.
The cumbersome process of the research work was made stupendous by the compassion and support of my Lab mates Imran Khan, Mohd. Amil Usmani, Jamal Akhter Siddiqui, Sadaf Afrin, Umaima Gazal, Shahzia Saleem and Nazia Malik who helped me going out of their ways and thus thereby deserving thanks and gratitudes from the core of my heairt.
My sincere thanks to Mr. Qutubuddin, glass blower of the department who was always co-operative when ever I felt need of his services.
I am feeling a sense of gratitude for Dr. Mohd. Zubair Ahsan, Prof M. Afzal Ansari and Mr. Anwer Husain Siddiqui who had been my guardian figure of all the years of my stay in Aligarh.
It is called that friends are the gems in our life who are the blessings from heaven and solace in disguise. First of all I wish to give special thanks to my dearest friend Sahab Shabbir, Advocate whose constant prayers and ardent supports helped me to fulfill this ambition. I thank hereby all my friends for filling my life with the colors of joy,
proudly naming them, Meraj Alam, Mohd. Vaseem, Ahmad Imran, Dr. Sarfaraz Nawaz, Dr. Mohd. Rafatullah, Mohd. Altaf, Zoheb Khalid, Kashif Mahfooz, M. Amir, Shahadat, Javed, Obaidullah, Qam.ruzzam.an, Fazeel, Akil, Rehan, Shamim., Shahzad, Zahid, Amitesh, Salma Tabassum, Khalida, Farah, Noorussaba, Sadaf Haneef; all my room mates and all friends from my home town Mau.
Last but not the least; I am highly thankful to Mohammad Shamim Ansari Advocate, Dr. A. Shahbir and Dr. Tariq Haleem and for their enquiring stimulus regarding the progress of my research work.
Q)JcM^
TAUSIF ALTAMASH ([email protected])
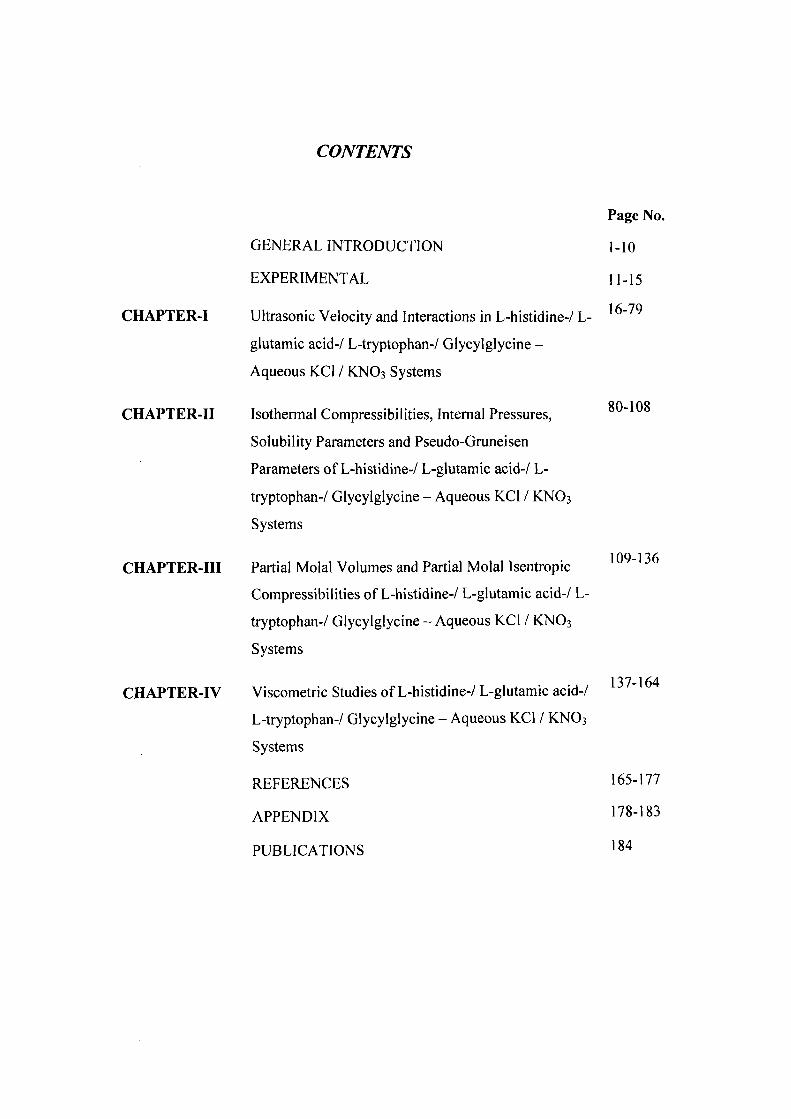
CONTENTS
CHAPTER-I
CHAPTER-II
CHAPTER-III
CHAPTER-IV
GENERAL INTRODUCTION
EXPERIMENTAL
Ultrasonic Velocity and Interactions in L-histidine-/ L-
glutamic acid-/ L-tryptophan-/ Glycylglycine -
Aqueous KCl / KNO3 Systems
Isothermal Compressibilities, Internal Pressures,
Solubility Parameters and Pseudo-Gruneisen
Parameters of L-histidine-/ L-glutamic acid-/ L-
tryptophan-/ Glycylglycine - Aqueous KCl / KNO3
Systems
Partial Molal Volumes and Partial Molal Isentropic
Compressibilities of L-histidine-/ L-glutamic acid-/ L-
tryptophan-/ Glycylglycine - Aqueous KCl / KNO3
Systems
Viscometric Studies of L-histidine-/ L-glutamic acid-/
L-tryptophan-/ Glycylglycine - Aqueous KCl / KNO3
Systems
REFERENCES
APPENDIX
PUBLICATIONS
Page No.
1-10
11-15
16-79
80-108
109-136
137-164
165-177
178-183
184
GENERAL INTRODUCTION
INTRODUCTION
Proteins are the ultimate nanotechnology devices. Inside our cells, these
molecular machines do all sorts of fantastic things and catalyze chemical reactions,
create the electrical signals in neurons, copy DNA, move vesicles around, transmit
information and generally get the job done inside our bodies. The three dimensional
structures of protein provide critical information about the molecules but they do not
provide any information about the thermodynamic stability of a molecule or the
energetic of its interactions with other substances [1]. A protein is a complex
molecule that performs certain functions. The range of protein functions is enormous,
some have a structural functions, like keratin, other proteins are located in a cell wall
to facilitate transport of small particles such as ions or water (porins), other proteins
catalyse reactions (enzymes), still other proteins regulate the function of other
proteins. Proteins are crucial part of muscles and other systems for converting
chemical energy into mechanical energy. They are also necessary for sight, hearing
and other senses. Many proteins are simply structural, providing the filamentous
architecture within the cells and the materials that are used in hair, nails, tendons and
bones of animals. Each protein has very different and unique physical properties.
Gurley et al. [2] have successfiilly extracted proteins from 150 million year
old fossil bones, indicating that some biomolecules may be stable over a diverce range
of temperature and pressure conditions for extended periods of time. In addition,
Haberstroth and Karl [3] have discovered free amino acids within the hydrothermal
vent habitats of the Guaymas Basin, located in the Gulf of California. Such
discoveries may also indicate the stability of certain biochemical molecules under
extreme condition in aqueous environments. Indeed, several authors have postulated
that life may have originated in oceanic hydrothermal vents [4-6]. Interactions of
proteins with their surrounding environment play an important role in their
conformational characteristics. These interactions are mainly those between the solute
and solvent molecules. Most of these interactions such as hydrogen bonding,
electrostatic interactions, hydrophobic interactions, etc., are non-covalent. The study
of these interactions provides an important insight into the conformational stability
and folding / unfolding behaviour of globular proteins [7]. Because proteins are large
complex molecules, a direct study of protein-electrolyte interactions is difficult. It is
therefore useful to investigate the solution behavior of model compounds such as

amino acids, peptides and their derivatives that constitute part of the protein structures
[8-11].
The nature and the arrangement of the amino acid side chain along the protein
backbone are responsible for the individual characteristics of the macromolecules, and
it has been recognized that all of the infomiation pertaining to the proteins is implicit
in the amino acid sequence. From the chemical point of view, proteins are linear,
heterogeneous polymers genetically mandated from twenty different building blocks
or amino acid residues linked by covalent peptide bonds (-CO-NH-) into the
polypeptide chain. In physiological conditions, the two terminals of amino acids are
charged both positive charge (amino group, NHs" ) and negative charge (carboxyl
group, COO"), and therefore the molecule has the properties of a "zwitterion". The
peptide bond is very stable and has unusual conformational properties. The peptide
bond is rigid and planar that three bonds separate sequential a carbons in a
polypeptide chain. The peptide C-N bonds are unable to rotate freely because of their
partial double bond nature. Rotation is permitted about the N-Ca and C-Ca bonds.
However, other single bonds in the backbone may also be hindered rotationally,
depending on the size and charge of the R groups.
All the amino acids (except for proline) have a carboxyl group and an amino
group. The smallest amino acid, glycine, has a hydrogen atom in place of a side chain.
All other amino acids have distinctive methyl groups. Because of the alpha carbon,
the other amino acids have four different constituents. The alpha carbon atom is an
asynametric center and mostly naturally occurring amino acids are in the L form. The
non-polar amino acids include: alanine, cysteine, glycine, isoleicine, leucine,
methionine, phenylalanine, proline, tryptophan, tyrosine and valine. The polar amino
acids include: arginine, asparagine, aspartic acid (or aspartate), glutamine, glutamic
acid (or glutamate), histidine, lysine, serine and threonine. Another sub-group of the
amino acids are those with ionisable side chain. These include: aspartate, glutamate,
histidine, cystine, lysine, tyrosine and arginine. These amino acids contribute to the
charge exhibited by peptides and proteins.
Histidine is an essential amino acid, manufactured in sufficient quantities in
adults, but children may at some times have storage of this important vitamin. It is
one of the basic (reference to pH factor) amino acids due to its aromatic nitrogen-
heterocyclic imidazole side chain. Histidine is an amino acid that is used to develop
and maintain healthy tissue in all parts of the body, particularly the myeline sheath

that coat nerve cells and ensure the transmission of massage from the brain to various
parts of the body. It may be useful for treatment of mental disorders. Research
suggests that histidine also acts as a natural detoxifier, protecting against radiation
damage and removing heavy metals from the system. It may even help prevent the
onset of AIDS. Histidine is crucial to the production of both red and white blood cells.
Histidine is also a precursor of histamine, a compound released by immune system
cells during an allergic reaction and for the production of gastric juices needed for
normal digestion.
Glutamic acid (non-essential), also called glutamate, is an excitatory
neurotransmitter that increases the firing of neurons in the central nervous system. It
is a major excitatory neurotransmitter in the brain and spinal cord. It is converted into
either glutamine or ganuna-aminobutyric acid. Glutamic acid is important in the
metabolism of sugar and fats, and aids in the transportation of potassium into spinal
fluid and blood-brain barrier. Although it does not pass the blood-brain barrier as
readily as glutamine does, it is found at high levels in the blood and may infiltrate the
brain in small amovmts. The brain can use glutamic acid as fuel.
Tryptophan is a simple amino acid that is essential as part of the diet. It is one
of the building blocks that the body needs to help the growth and repair of muscles
and is also essential in promoting a feeling of well being and alertness. Tryptophan is
found naturally in many foods including poultry, sunflower seeds, and red meat, as
well as a number of other foods. Tryptophan is utilized by the body in a number of
ways. Its main use is as a precursor for production of serotonin, a chemical
neurotransmitter that the brain uses in order to relax.
The effect of various neutral salts on the transition temperatures of proteins
and enzymes have been reported in the literature [12]. The effectiveness of various
neutral salts towards the destabilizing tendency of proteins has been classified in the
form of the series known as the Hofmeister series [13]. The peptide group is strongly
salted-in or stabilized by Nal, NaC104, NaSCN, NaCljCCOO; it is salted-in less
strongly by KF, LiCl, NaCl, KCl, CsCl, NaBr; whereas (CH3)4NBr and Na2S04 have
negligible salting-in effects. Harrington and Herskovits [14] in a report on the
subunits structure and dissociation of Lumbricus terrestris haemoglobin by salts have
pointed out that various neutral salts including sodium chloride tend to dissociate the
duodecarmeric structure of haemoglobin into its subunits. Nagy and Jencks [15] have
pointed out that electrolytes induce dissociation in the protein F-actin without causing

any conformational change or denaturation. They have suggested that salts interact
directly with the peptide groups of the protein and bring about its dissociation.
Thermodynamic studies of aqueous solutions of amino acids, peptides and
their derivatives containing functional groups similar to those existing in the more
complex proteins in order to mimic some expected common features of protein and
assist in understanding of the conformational stability and folding behaviour of
globular proteins, have been studied by a number of authors [16-20]. The
conformational transitions of biopolymers are extremely sensitive to subtle changes in
solvent medium [21-23].
Sound waves are made of high pressure and low pressure pulses travelling through a
medium. The high pressure areas (compression) are where the particles have been
squeezed together, the low pressure areas (rarefaction) are where the particles have
been spread apart. Ultrasound is the term applied to mechanical pressure waves with
frequencies above 20 KHz (beyond the audible range). The ultrasound wave can be
both emitted and received by a piezoelectric transducer. The piezoelectric transducer
is able to change electrical signals into mechanical waves, that is, transmitting
ultrasound (= reverse piezoelectric effect), and vice versa to change mechanical
pressure (reflected ultrasoimd waves, "echoes") into electrical signals (= direct
piezoelectric effect).
Ultrasonic investigation in aqueous solutions of electrolytes and non-
electrolytes with amino acids provide useful information in understanding the
behaviour of liquid systems, because intra-molecular and inter-molecular association,
complex formation and related structural changes affect the compressibility of the
system which in turn, produces corresponding variation in the ultrasonic velocity.
Ultrasonic velocity data as such provide little information about the nature and
magnitude of the various interactions [24-43] but its derived thermodynamic
parameters, namely, isentropic compressibility, change and relative change in
isentropic compressibility, specific acoustic impedance, relative association provide
important information about the nature and strength of various solute-solute and
solute-solvent interactions responsible for the behaviour of aqueous solutions and
non-aqueous solutions [25,44-53]. Ultrasonic velocity and its derived parameters data
also have been useful for gaining infonnation on the dynamics of systems [54-56],
physical nature of the aggregates occurring in the solutions [25,54,55] and structural
changes of solutes and solvents in solutions [57].
The Knowledge of isothermal compressibility and excess compressibility may
enable one to account for the extent and nature of interaction in mixtures [58-61]. The
excess compressibility values may further be used to evaluate theoretically the sound
velocity which describe equilibrium as well as non-equilibrium properties [62]. The
standard-state partial molar isothermal compressibility is a sensitive measure of
solute-solvent interactions and, as such, can be used to monitor solute hydration in
aqueous solution [63,64]. It is not easy to determine isothermal compressibility values
directly [64]. The precise measurements of ultrasonic velocity and density data have
been used to calculate the isentropic compressibility values rather than isothermal
compressibility. However, from the knowledge of coefficient of thermal expansion
and heat capacity, it is possible to convert isentropic compressibility into the more
useful thermodynamic quantity that is isothermal compressibility [65,66]. Moreover,
there is a direct link, through statistical thermodynamics, between the mean square
volume fluctuations of protein and its isothermal coefficient of compressibility [66].
Pandey and Vyas [67] proposed a relation for the calculation of isothermal
compressibility by combining the Mc-Gowan's relation [68] between isothermal
compressibility and surface tension, and that of Auerbach's relation [69] between
speed of sound and surface tension.
Isothermal compressibilities have been widely evaluated by many workers
[70-88] using hard sphere model for pure liquids, melts and mixtures. Isothermal
compressibility and excess isothermal compressibility values have been evaluated for
organic solvent mixtures by using the Flory's statistical theory. The excess isothermal
compressibility values have been discussed in terais of intennolecular interactions
operative between components of mixture [61]. Partial molar isothermal
compressibilities have been determined for aqueous solutions of amino acids, amino
acid derivatives, peptides and proteins [65,66,88,89]. Isothermal compressibilities of
amino acids in aqueous urea and sodium dodecyle sulphate solutions by employing
the Pandey and Vyas relation [67] have been deteraiined in our laboratory earlier
[25,49,90], Apparent molar isothermal compressibilities using ultrasonic velocity and
density data have been determined for aqueous solutions of nucleic bases [90]. The
isothermal compressibilities for binary liquid mixmres have been determined
experimentally as well as predicted theoretically by a number of methods and the
experimental results have been compared with those of predicted values. The theory
based on an equation of state for a mixture of hard convex particle, where allowance
can be made for the shape of the molecules has been found to be most appropriate. It
is observed that the attractive potential has little influence on the predicted
compressibility values [91]. Recently, the isothermal compressibilities have been
determined experimentally for the l-ethyl-3-methylimidazolium ethylsulfate and
methanol system [92]. The isothermal compressibility values have been evaluated for
the five normal alkane systems using molecular dynamics simulation method [93].
The role of internal pressure in liquid solution thermodynamics was
recognized many years ago by Hildebrand [94] following earlier work by Van Laar
[95]. The parameter has been used to study the intermolecular interactions
qualitatively in liquid systems. Barton [96,97] explored the usefulness of the
parameter for studying the intermolecular forces quantitatively. It has been found that
a comparison of the internal pressure values of individual liquid components with that
of mixture enables one to predict interactions in the mixture [98]. Using the density
and ultrasonic velocity data, the internal pressure values has been computed for pure
liquids, mixtures of organic solvents, electrolytes in aqueous and mixed aqueous
media [60,99-104]; and amino acids in aqueous urea, aqueous sodium dodecyl
sulphate solutions and aqueous electrolyte solutions [25,49,105-108]. The data have
been discussed in terms of intermolecular / interionic interactions between solute and
solvent. Palepu and Macdonald [109] determined the internal pressure values for
sodium and potassium halide in aqueous xylose solution. They discussed the results in
terms of structure-making and structure-breaking properties of the electrol34es. The
computed internal pressure values for gallic acid in aqueous methanol and acetone
solutions have been used to study the solute-solvent interactions [55]. Singh and
Kumar [110] have used internal pressure and cohesive energy density data for the
prediction of dielectric constant of the imidazolium-based ILs. The values of
parameter have been also computed for pure liquids using a statistical mechanical
equation of state, and a close agreement between the computed and experimental
values has been reported [111]. Amoros et al. [112] determined the internal pressure
values for pure liquids and they concluded that the internal pressure and the cohesive
energy density are both analogous manifestations of the cohesion property of liquids.
Recently, Dhondge et al. [87] discussed the extent of hydrogen bonding between
solute and solvent in terms of internal pressure data.
The solubility parameter is the square root of the cohesive energy density
value. The parameter has been extensively discussed reviewed by Barton [96,97].
Solubility parameter values for pure organic liquids and mixtures [60,102,113,114];
and for amino acids in mixed aqueous media [24,49] have been determined by a
number of workers. The applications of solubility parameters and cohesive energy
density data in industrial processes have been reported by a number of authors [115-
119]. Solubility parameter has played an important role m designing of
pharmaceutical dosage of drug. Solubility parameter data has also well correlation
with the permeability of drugs into body [120,121]. The successful application and
performance of a polymer material mainly requires the study of phase behaviour of it
in various solvent systems. Solubility parameter has been quite helpful for
understanding about the phase behaviour of polymeric systems containing many
constituents, like those used in the paint industry [118]. Solubility parameter has been
found to be a very useful tool for assessing the selection of proper compounding
ingredients [122] and solvents [123-125] for polymeric substances and paints.
The pseudo-gruneisen parameter, a dimensionless constant, is governed by the
molecular order and lattice behaviour of substances. A number of authors have
evaluate the parameter for solids, pure liquids, liquid mixtares and aqueous systems
[25,49,126-137]. Martinez et al. [136] computed the parameter value for carbonate
ions in water and in ice VII at different temperatures by employing the Raman
spectroscopy and appropriate equation of state. It has been observed that the pseudo-
gruneisen parameter of carbonate ion symmetric stretching mode is significantly
smaller in liquid water than in crystalline carbonates. Lopes et al. [129] discussed the
relationship between the bulk pseudo-gruneisen parameter of liquids and the
individual's mode parameters, characterizing the volume dependence of hindered
translational and rotational frequencies of the molecules in liquid phase, in terms of a
cell model in the quasi-harmonic approximation.
The volumetric characteristics of a substance viz., the partial molar volume
have proven to be reflective of and sensitive to solute-solvent interactions [139-150].
Hence, volumetric properties represent useful observable for studying the hydration
properties of proteins. In recognition of this fact, several laboratories have
investigated the volumetric properties of proteins in aqueous solutions and have
proposed different approaches for interpreting these macroscopic data in terms of
protein hydration [151-159]. Such interpretations are not straightforward and always
model-dependent. Despite the difficulties in interpreting the volumetric data for
systems as complex as proteins, experiments of this type have begun to provide
8
important data against which a number of models of protein hydration are evaluated
[160,161]. The microscopic interpretation of the measured volumetric properties in
terms of protein hydration is usually performed in conjugation with structural data on
the surface atomic groups [151,153,158]. Unfortunately, such structural data are not
always available, especially for the denatured states of proteins, which include molten
globule and unfolded states. Consequently, the microscopic interpretation of the
volumetric properties of denatured protein states remains highly speculative and
subjective m nature [154-157,159]. This limitation is serious and prevents data from
being used with confidence for analysis of hydration features of proteins as a function
of their conformational states. One of the main procedures for interpreting the
physico-chemical properties of protein solution is the comparative analysis of model
compounds, which contain the atomic group specific for proteins. Thus, the partial
molar volumes of protein have been compared with the volumes of amino acids and
peptides using a simple additive scheme [162,163,164]. Volumetric studies on amino
acids and peptides in aqueous electrolyte solutions reflect the combined effect of
various hydrophilic and hydrophobic interactions in these systems. Amino acids and
peptides are dipolar ions, albeit to varying degree in aqueous solutions [165-167] and
values of their apparent molal volumes reflect the electrostriction that occurs due to
their interaction with water.
The partial molar compressibility of the solute is sensitive to the nature and
extent of the intermolecular interactions between the solute and solvent and, as such,
can be used to characterize the hydration of globular proteins in aqueous solutions
[64,168,169]. Since the extent of protein hydration changes during the course of
protein unfolding from the native state, through compact intermediate states or
partially unfolded state to the fully unfolded state, compressibility measurements
provide usefiil means to characterize protein transitions [160,169-172]. The
compressibility of a protein can be considered, at least to a first approximation, to
comprise of two terms. One intrinsic compressibility of the protein, which is
essentially due to intra-chain interactions and the packing of the protein chain, while
the other term is due to the hydration of the various amino acids, functional groups
that are exposed to the solvent [169, 173].
Viscosity has been found to be a measure of the resistance of a fluid to flow.
The increase in viscosity due to the presence of particles arises from the fact that they
lie across the fluid streamlines and are subject to torsional forces. They tend to rotate
and then absorb energy. This energy absorption leads to an increased viscosity of the
solution [174]. It has been observed that viscous forces appear only when adjacent
parts of a fluid are moving with different viscosities. It is well known that a study of
the perturbation on the viscous flow of a solvent by an added solute yield valuable
and significant information on solute-solvent interactions. Viscometric studies are
important for studying transport properties of pure and mixed solutions.
The viscosity and its derived parameters such as relative viscosity, specific
viscosity and intrinsic viscosity have been used to study the shape and size of
macromolecules and the solute-solvent interactions in solutions [7,10,41,57,175-201].
The specific viscosity data are also used to calculate the hydrodynamic volume of
solute. The specific viscosity is dependent on solute concentration whereas the
intrinsic viscosity is independent of solute concentration and chacteristic of the solute
alone [202]. The solute-solvent interactions and the extent of solute hydration can
also be studied in terms of B-coefficient of Jones-Dole equation [203]. The B-
coefficient is a measure of effective solvodynamic volume of solvated ions and is
governed by size and shape effects of solute, and the structural effects induced by the
solute-solvent interactions [22,176-179,188-194,204-223]. The effect of solute size on
the B-coefficient is apparent from solvodynamic theories. A 'structure-building'
solute lowers the average effective kinetic energy of the solvent molecules and thus
increases the viscosity of the solution, and leads to a high B-coefficient values.
Because of the exponenfial relationship between viscosity and temperature [224], a
rise in temperature of the solution as a whole cause B-coefficient to fall. Such
behaviour has been used to identify 'structure making' solutes [225]. Conversely,
'structure breaking' solutes have rather low B-coefficients, which increase with an
increase in temperature [225,226].
In the case of electrolytes, the B-coefficient is a measure of the order or
disorder introduced by ions into their co-spheres [227]. A positive B-coefficient
indicates that the ions tend to order the solvent structure and increase the viscosity of
the solutions, whereas a negative B-coefficient indicates disordering and a decrease
of viscosity. The partitioning of the B-coefficient into their ionic components was
first proposed by Cox and Woefenden [228] and it was examined by Gumey [229]
and Kaminsky [230]. Martin and Tsangaris [226] studied the structure-making / -
breaking effect of dipolar molecules such as sarcosine, hydroxyproline, proline,
aminocaproic acid, glutathione, sulfamic acid, taurine, glycine, betaine, serine,

10
glycylglycine, and triglycine on water in terms of B-coefficient and its temperature
derivative, dB/dT, values. They found that the magnitude of dB/dT values are more
important than the B-coefficient values for explaining the structure-making / -
breaking effect of dipolar molecules on water.
An exhaustive literature survey reveals that a number of thermodynamic
properties of amino acids and peptides have been studied in aqueous medium but
some researchers [7,20,21,23,176-178,205-211,231-242] have attempted to
investigate the behaviour of these model compounds of proteins in aqueous
electrolyte solutions. Consequently, with a view to understanding the thermodynamic
behaviour of amino acid and peptide: L-histidine, L-glutamic acid, L-tryptophan and
glycylglycine in 2 M aqueous KCl and 2 M aqueous KNO3 solutions, the density (p),
ultrasonic velocity (u) and viscosity (r|) values as a function of amino acid / peptide
concentration and temperature: 298.15, 303.15, 308.15, 313.15, 318.15, 323.15 K
have been measured. Using the experimentally measured data, the isentropic
compressibility (KJ), change (AKS) and relative change (AKJ/KO) in isentropic
compressibility, specific acoustic impedance (Z), relative association (RA),
isothermal compressibility (KJ), internal pressure (Pi), solubility parameter (5),
pseudo-gruneisen parameter (F), apparent molal volume ((j)v), partial molal volume
(<t)° ), apparent molal isentropic compressibility (^k), partial molal isentropic
compressibility (<^l ), relative viscosity (rir), specific viscosity (risp) and B-coefficient
values have been evaluated. The experimental and computed values of these
parameters have been discussed in tenns of solute-solute and solute-solvent
interactions. It is expected that this study will be helpful in understanding the
thermodynamic behaviour of proteins in their native as well as in denatured state.
EXPERIMENTAL

MATERIALS AND SAMPLE PREPARATION
The amino acids / peptide: L-histidine, L-glutamic acid, L-tryptophan and
glycylglycine; and the salts: potassium chloride and potassium nitrate of high purity
(>99%), used in the present studies, were purchased from SRL (India) and E. Merck
(India), respectively. The amino acids and peptide were recyrstalysed twice in
(ethanol + water) mixtures, dried at 383.15 K and kept in vaccum desiccator over
P2O5 for at least 72 h before use. The salts were recyrstalysed twice in triply distilled
water, dried at 423.15 K for at least 3 h and then kept over P2O5 in a vaccum
desiccator at room temperature for a minimum of 48 h prior to their use. Stock
solutions of 2 M aqueous KCl and 2 M aqueous KNO3 were prepared in triply
distilled water and were used as solvents for the preparation of amino acids / pepide
solutions. Water used in the experiments was deionized and was degassed prior to
making solutions. The degree of degassing was sufficiently high to prevent formation
of bubbles in the measuring cell for ultrasonic velocity. The specific conductivity of
triply distilled water used was less than 18-10' i2''-cm''. All the solutions were made
by weight on the molality concentration scale within an accuracy of ± 1 x 10 molkg"
'. All the solutions were stored in special airtight bottles to avoid the exposure of
solutions to air and evaporation.
TEMPERATURE CONTROL
A thermostated paraffin bath was used to maintain the desired temperature in
the measurements of density and viscosity. The bath was made up of an immersion
heater (1.5 KW), a stirrer, a check thermometer (Germany), a contact thermometer
and a relay [Jumo type, NT 15.0, 220 V = lOA (Gennany)]. Thermal stability of the
thermostat was found to be within ± 0.01°.
DENSITY MEASUREMENT
Pyknometer consisting of a small bulb with flat bottom of approximately 3.5
ml capacity and a graduated stem was used for the density measurements. The volume
at each mark of the pyknometer was calibrated with triple distilled water. The
densities of pure water at various required temperatures were taken from literature for
calibration purpose [243]. The pyknometer was tested with the toluene. The densities
of toluene at various required temperatures were taken from the literature for testing
purpose [244]. In order to check the reproducibility of calibration, the same process

12
was repeated a number of times with different amounts of toluene. The reproducibility
of density values was found to be within ±0.0001 gm-cm" . All mass quantities were
corrected for buoyancy. The test solution was introduced into the calibrated
pyknometer, weighed and then it was immersed in the thermostated paraffin bath. The
bath used for measurements of density values was maintained at a desired temperature
(±0.01°) for about 30 min prior to recording of readings at each temperamre of study.
By recording the volume changes as a function of temperature, the densities of
solutions were determined at required temperatures. Several very close readings of
density calculated at each temperature were averaged.
VISCOSITY MEASUREMENT
Canon-Fenske viscometer was used for the viscosity measurement of various
solutions xmder study. The viscometer consists of three parallel arms with a common
base. The viscometer was calibrated with the triple distilled water. The viscosity
coefficient values of water at different temperatures were taken from literature for
calibration purpose [245]. The clean and dry viscometer was filled with test solution
and was clamped in the thermostated bath in a vertical position. The bath used for
measurements of viscosity values was maintained at a desired temperature (±0.01°)
for about 30 min prior to recording of readings at each temperature of study. In order
to avoid the absorption of moisture by solution, the open ends of the three arms of
viscometer were fitted with the anhydrous calcium chloride glass tubes through
rubber tubes. The solution was sucked into the measuring bulb and was allowed to
stand there for about two minutes by closing the calcium chloride tubes with rubber
corks and then the corks were removed for recoding the time of fall of solution from
the upper to lower end of the bulb. After taking several readings at the desired
temperature the average of the very close values of time of fall was taken.
The viscosity coefficient is defined as the following Poiseuille's equation,
r| = jtgh ptrVSvI (1)
where g, h, p, r, 1 and t are acceleration due to gravity, height of the column in the
viscometer, density of the liquid, radius of the viscometer's capillary, length and time
of fall for the liquid of volume v through the capillary, respectively. The above
equation can also be written as

13
Ti = pPt (2)
where P = 7ighr'*/8vl is constant for the given viscometer. The viscosity value of the
test solution was calculated using the reported viscosity values of pure water at
various temperatures. Equation (3) was employed for the calculation of viscosity of
solutions.
ni=(piti/p2t2)xri2 (3)
where r\i, pi and ti are the viscosity coefficient, density and time of fall of the
solution, respectively, whereas the TI2, pi and tj are the viscosity coefficient, density
and time of fall of the solvent at the given temperatures respectively. The
reproducibility in viscosity measurements was found to be within ± 0.003x10"^ Nm"
ULTRASONIC VELOCITY MEASUREMENT
An ultrasonic interferometer (Mittal's model: M-77) was used for the
measurement of ultrasound velocity at a frequency of 4 MHz in the temperature
range: 298.15 to 323.15 K. Water firom ultra-thermostat (Type U-10) was circulated
through the brass jacket surrounding the cell and the quartz crystal. The jacket was
well insulated and the temperature of the solution under study was maintained to an
accuracy of ±0.01°. The water bath used for measurements of ultrasonic velocity
values was maintained at a desired temperature (±0.01°) for about 30 min prior to
recording of readings at each temperature of study. The instrument was calibrated
with the triple distilled water. The ultrasonic velocity values of water at different
temperatures were taken from literature [246] for calibration purpose.
WORKING PRINCIPLE
An ultrasonic interferometer is a simple and direct device to determine the
ultrasonic velocity in liquids with a high degree of accuracy. The principle used in the
measurement of velocity (u) is based on the accurate determination of the wavelength
(A.) in the medium. Ultrasonic waves of known frequency (f) are produced by a quartz
plate fixed at the bottom of the cell. A movable metallic plate kept parallel to the
quartz plate reflects these waves. If the separation between these two plates is exactly
a whole multiple of the ultrasound wavelength, standing waves are formed in the
medium. This acoustic resonance gives rise to an electrical reaction on the generator

14
driving the quartz plate and the anode current of the generator becomes maximum.If
the distance is now increased or decreased and the variation is exactly one half
wavelength {XI2) or multiple of it, anode current again becomes maximum. The
velocity can be obtained by using the relation,
u = X X f (4)
DESCRIPTION
The ultrasonic interferometer consists of two parts (i) the high frequency
generator and (ii) the measuring cell. The "high frequency generator" is designed to
excite the quartz plate fixed at the bottom of the measuring cell and its resonant
frequency to generate ultrasonic waves in the liquid filled in the "measuring cell". A
micrometer to observe the change in current and two controls for the purpose of
sensitivity regulation and initial adjustments of micrometer are provided on the panel
of the high frequency generator. The "measuring cell" is a specially designed double
walled cell for maintaining a constant temperature of the liquid during experiment. A
fine micrometer screw has been provided at the top, which can lower or raise the
reflector plate in the liquid in the cell through a known distance. It has quartz plate
fixed at its bottom. Instrument was adjusted in the following manner:
1. The cell was inserted in the square base socket and clamped to it with the help
of a screw provided on one of its sides.
2. The curled cap of the cell was unscrewed and removed from the double walled
construction of the cell. In the middle portion of it the experimental liquid was
poured and screwed the curled cap.
3. Water was circulated through the two chutes in the double wall construction in
order to maintain the desired temperature.
4. The cell was connected with the high frequency generator by a co-axial cable
provided with the instrument.
For the initial adjustment, two knobs are provided on high frequency generator,
one is marked with 'Adj' and the other with 'Gain'. With knob marked 'Adj' the
position of needle on the ammeter was adjusted and the knob marked 'Gain' was used
to increase the sensitivity of the instrument for greater deflection. The ammeter was
used to record the maximum deflections by adjusting the micrometer.
15
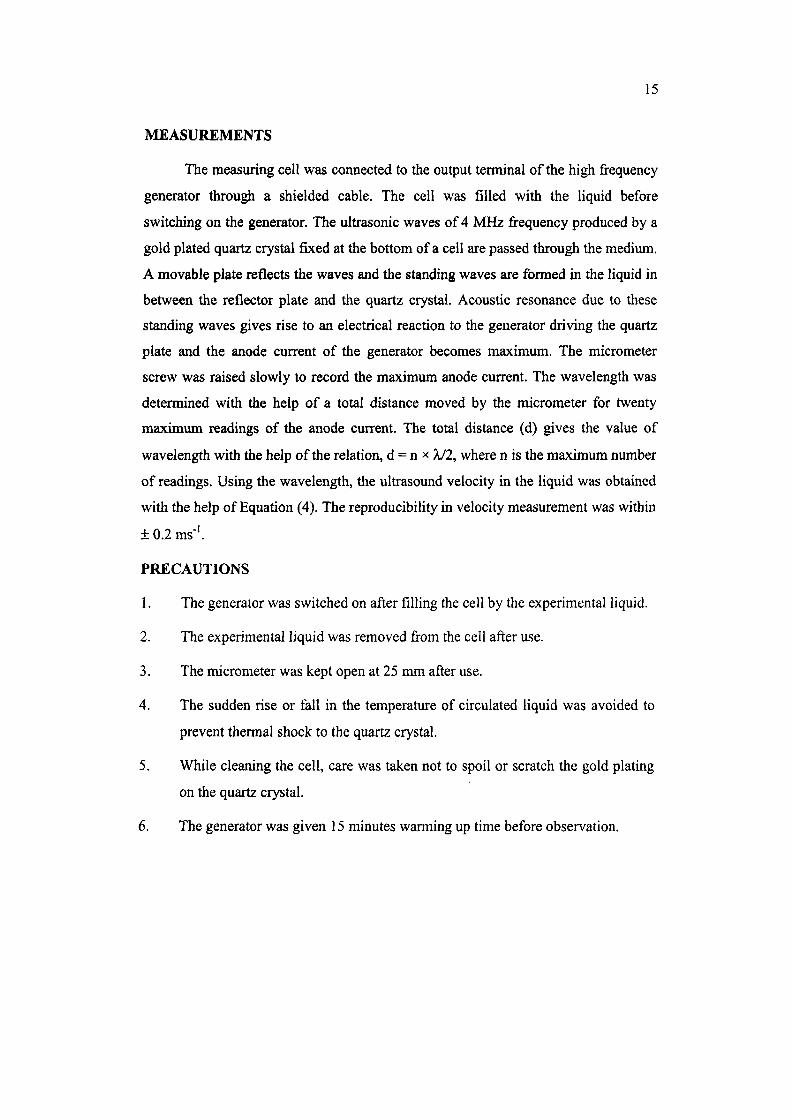
MEASUREMENTS
The measuring cell was connected to the output terminal of the high frequency
generator through a shielded cable. The cell was filled with the liquid before
switching on the generator. The ultrasonic waves of 4 MHz frequency produced by a
gold plated quartz crystal fixed at the bottom of a cell are passed through the medium.
A movable plate reflects the waves and the standing waves are formed in the liquid in
between the reflector plate and the quartz crystal. Acoustic resonance due to these
standing waves gives rise to an electrical reaction to the generator driving the quartz
plate and the anode current of the generator becomes maximum. The micrometer
screw was raised slowly to record the maximum anode current. The wavelength was
determined with the help of a total distance moved by the micrometer for twenty
maximum readings of the anode current. The total distance (d) gives the value of
wavelength with the help of the relation, d = n x X/2, where n is the maximum number
of readings. Using the wavelength, the ultrasound velocity in the liquid was obtained
with the help of Equation (4). The reproducibility in velocity measurement was within
± 0.2 ms-'.
PRECAUTIONS
1. The generator was switched on after filling the cell by the experimental liquid.
2. The experimental liquid was removed from the cell after use.
3. The micrometer was kept open at 25 mm after use.
4. The sudden rise or fall in the temperature of circulated liquid was avoided to
prevent thermal shock to the quartz crystal.
5. While cleaning the cell, care was taken not to spoil or scratch the gold plating
on the quartz crystal.
6. The generator was given 15 minutes warming up time before observation.
CHAPTER-I
Ultrasonic Velocity and Interactions in L-histidine-/L-
glutamic acid-/L-tryptophan-/ Glycylglycine - Aqueous
KCl/KNO3 Systems

INTRODUCTION
Ultrasonic method fined extensive applications owing to their ability of
characterizing the physico-chemical behaviour of liquid systems from velocity data
[247]. A number of researchers have employed the ultrasonic technique to evaluate
the thermodynamic properties of amino acids [21,57,185,212,233,248,249], peptides
[21,183,156,212,250,251] and proteins [156,186,252,25'3] in aqueous medium,
aqueous urea solutions, organic solvents and mixed aqueous solutions in order to
study zwitterions-ions and zwitterions-water dipoles interactions in solutions.
The ultrasonic velocity data and its derived thermodynamic parameters such as
isentropic compressibility, change in isentropic compressibility, relative change in
isentropic compressibility, specific acoustic impedance and relative association
provide fioiitful qualitative and quantitative information regarding the nature and
strength of interactions in solutions [34-36].
The variation of ultrasonic velocity values with variations in solute
concentration and temperature depends upon the nature of interactions between solute
and solvent. All pure liquids except water and heavy water are found to have negative
temperature coefficients of ultrasonic velocity. Randall [254] found that water has
large positive coefficient of ultrasonic velocity at room temperature. The velocity of
sound in a liquid usually refers to longitudinal type of wave mode. The rate of
propagation depends upon the type of wave, the elastic properties of medium, the
density of the medium and the frequency. The propagation velocity of ultrasound
wave in normal liquids decreases with an increase in temperature but in water the
velocity attains a maximum value of 1557 ms"' at 74°C and above this temperature the
ultrasonic velocity diminishes [255]. This abnormal property of water may be
attributed to its peculiar liquid structure. On addition of salt in water, the velocity of
solution increases or decreases with an increase in temperature depending upon its
ionic concentration and the type of ion-water dipole interactions. The isentropic
compressibility of water attains maximum value at 64°C. This behaviour of water is
also apparently due to its peculiar structure [255].
The interaction studies of bio-molecules in the presence of metal ions can
provide the further insight and application in the field of research through ultrasonic
velocity data [256]. Nandi and Robinson [257] studied the salting-in / salting-out
effect of several salts on biological macromolecule and concluded that the salts
interact directly with the peptide group. Salt-inducted electrostatic forces are known
17
to play a vital role in modifying the protein structure by affecting properties like,
solubility, denaturation and activity of enzymes [258-260]. The trends of variation of
ultrasonic velocity with solute concentrations and temperature depends on the
equilibrium properties of amino acids/ peptides in aqueous electrolytic solutions.
Their equilibrium properties in solutions are determined by the relative magnitude of
electrostriction caused by the polar terminal groups, the structure enforcing influence
of the hydrophobic alkyl groups and the extent of interaction between ions and
hydrophilic groups within the solutions.
In this study, the ultrasonic velocity and density values of L-histidine / L-
glutamic acid / L-tryptophan / glycylglycine + 2 M aqueous KCl / 2 M aqueous KNO3
solutions as functions of amino acid / peptide concentration and temperature: 298.15,
303.15, 308.15, 313.15, 318.15, 323.15 K have been measured experimentally. Using
u and p data, the isentropic compressibility, change in isentropic compressibility,
relative change in isentropic compressibility, acoustic impedance and relative
association values have been evaluated with a view to investigating the zwitterions-
ions zwitterions-water dipoles, ions-water dipoles and ions-ions interaction operative
in the systems.
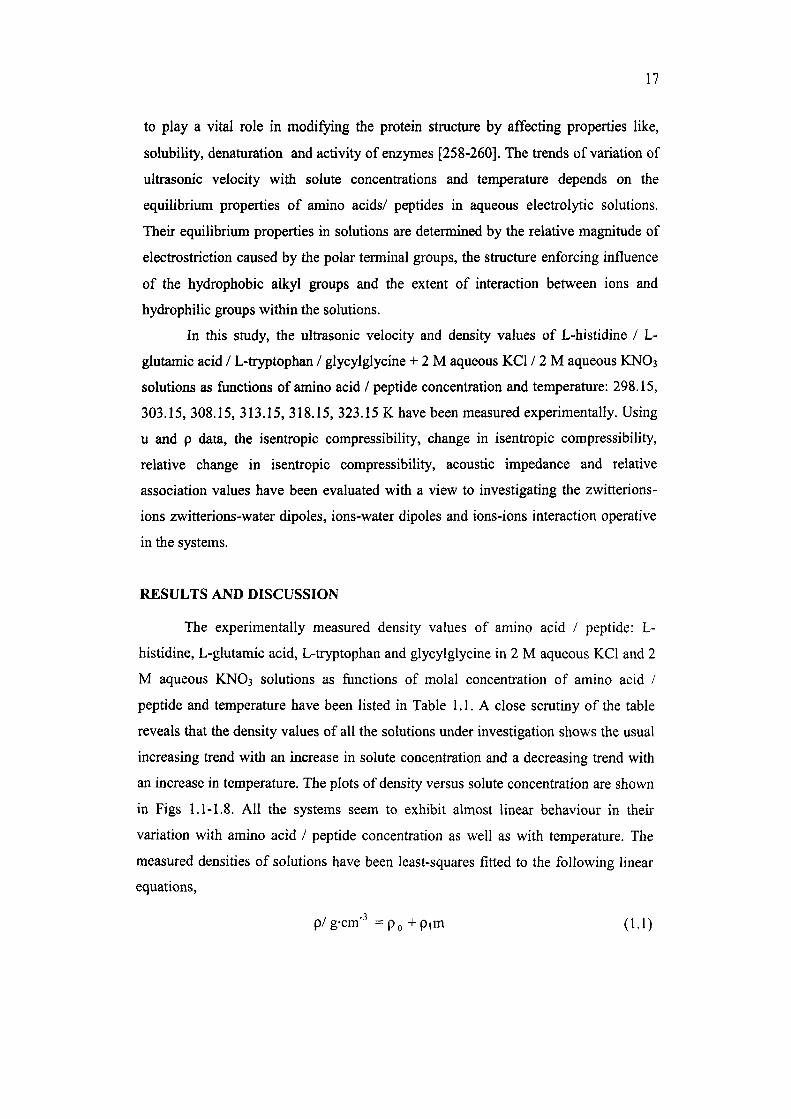
RESULTS AND DISCUSSION
The experimentally measured density values of amino acid / peptide: L-
histidine, L-glutamic acid, L-tryptophan and glycylglycine in 2 M aqueous KCl and 2
M aqueous KNO3 solutions as functions of molal concentration of amino acid /
peptide and temperature have been listed in Table 1.1. A close scrutiny of the table
reveals that the density values of all the solutions under investigation shows the usual
increasing trend with an increase in solute concentration and a decreasing trend with
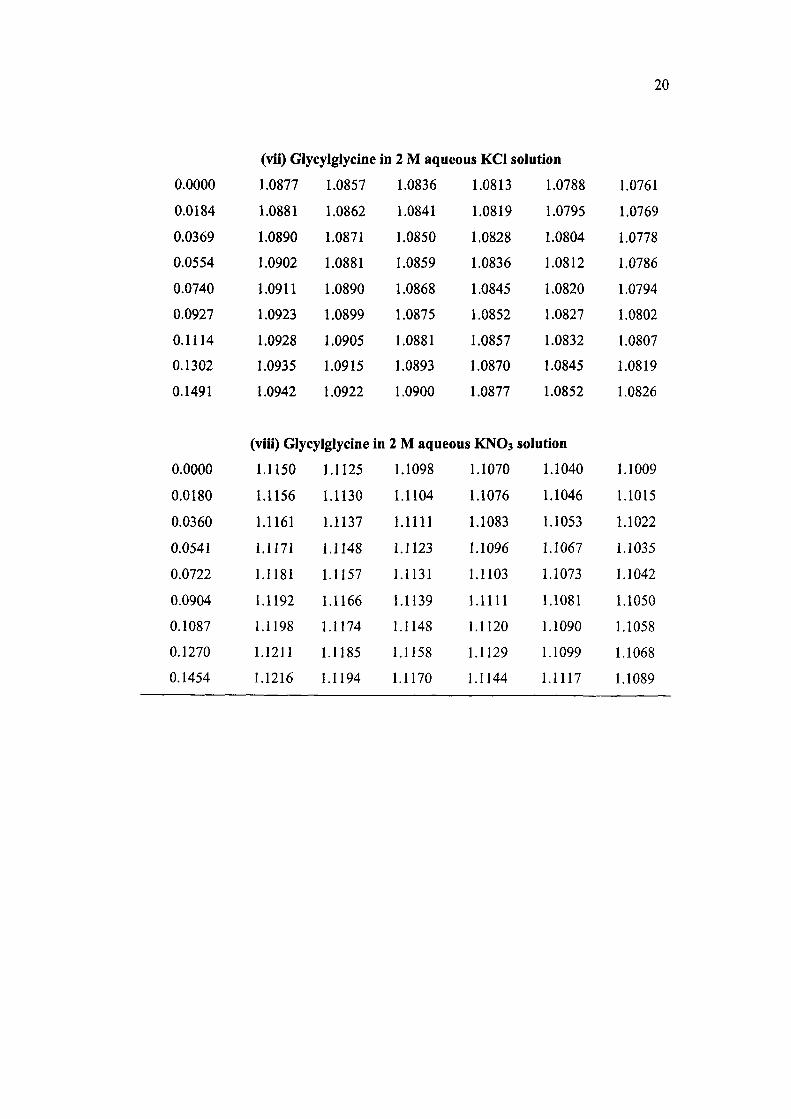
an increase in temperature. The plots of density versus solute concentration are shown
in Figs 1.1-1.8. All the systems seem to exhibit almost linear behaviour in their
variation with amino acid / peptide concentration as well as with temperature. The
measured densities of solutions have been least-squares fitted to the following linear
equations,
p/g-cm'^ =po+pim (1.1)
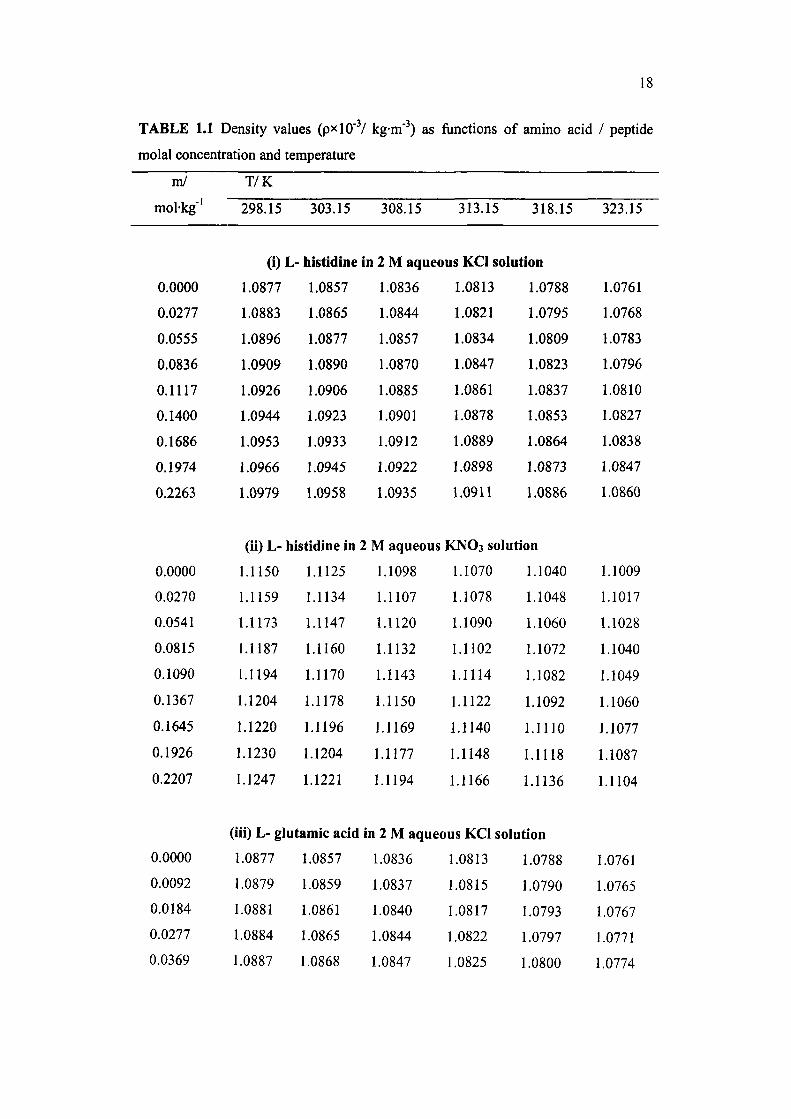
TABLE 1.1 Density values (pxlO'^/ kg-m"'') as functions of amino acid / peptide
molal concentration and temperature
ml
mol-kg"'
0.0000
0.0277
0.0555
0.0836
0.1117
0.1400
0.1686
0.1974
0.2263
0.0000
0.0270
0.0541
0.0815
0.1090
0.1367
0.1645
0.1926
0.2207
T/K
298.15
(i)L-
1.0877
1.0883
1.0896
1.0909
1.0926
1.0944
1.0953
1.0966
1.0979
303.15
• histidine
1.0857
1.0865
1.0877
1.0890
1.0906
1.0923
1.0933
1.0945
1.0958
(ii) L- histidine in
1.1150
1.1159
1.1173
1.1187
1.1194
1.1204
1.1220
1.1230
1.1247
1.1125
1.1134
1.1147
1.1160
1.1170
1.1178
1.1196
1.1204
1.1221
308.15 313.15 318.15
in 2 M aqueous KCI solution
1.0836
1.0844
1.0857
1.0870
1.08.85
1.0901
1.0912
1.0922
1.0935
2 M aqueous
1.1098
1.1107
1.1120
1.1132
1.1143
1.1150
1.1169
1.1177
1.1194
1.0813
1.0821
1.0834
1.0847
1.0861
1.0878
1.0889
1.0898
1.0911
1.0788
1.0795
1.0809
1.0823
1.0837
1.0853
1.0864
1.0873
1.0886
KNO3 solution
1.1070
1.1078
1.1090
1.1102
1.1114
1.1122
1.1140
1.1148
1.1166
1.1040
1.1048
1.1060
1.1072
1.1082
1.1092
1.1110
1.1118
1.1136
323.15
1.0761
1.0768
1.0783
1.0796
1.0810
1.0827
1.0838
1.0847
1.0860
1.1009
1.1017
1.1028
1.1040
1.1049
1.1060
1.1077
1.1087
1.1104
(iii) L- glutamic acid in 2 M aqueous KCI solution
0.0000 1.0877 1.0857 1.0836 1.0813 1.0788 1.0761
0.0092 1.0879 1.0859 1.0837 1.0815 1.0790 1.0765
0.0184 1.0881 1.0861 1.0840 1.0817 1.0793 1.0767
0.0277 1.0884 1.0865 1.0844 1.0822 1.0797 1.0771
0.0369 1.0887 1.0868 1.0847 1.0825 1.0800 1.0774

19
0.0462
0.0555
1.0893
1.0902
1.0875
1.0883
1.0855
1.0862
1.0833
1.0839
1.0808
1.0815
1.0781
1.0788
(iv) L- glutamic acid in 2 M aqueous KNO3 solution
0.0000
0.0090
0.0180
0.0270
0.0360
0.0450
0.0541
1.1150
1.1155
1.1160
1.1166
1.1171
1.1174
1.1184
1.1125
1.1130
1.1135
1.1141
1.1147
1.1149
1.1159
1.1098
1.1104
1.1108
1.1114
1.1120
1.1122
1.1132
1.1070
1.1076
1.1080
1.1086
1.1092
1.1094
1.1104
1.1040
1.1047
1.1050
1.1056
1.1062
1.1064
1.1074
1.1009
1.1016
1.1019
1.1026
1.1032
1.1034
1.1042
(v) L- tryptophan in 2 M aqueous KCl solution
0.0000
0.0092
0.0138
0.0184
0.0231
0.0277
0.0323
0.0370
1.0877
1.0879
1.0881
1.0882
1.0886
1.0890
1.0894
1.0895
1.0857
1.0860
1.0862
1.0864
1.0867
1.0870
1.0873
1.0874
1.0836
1.0838
1.0841
1.0843
1.0846
1.0847
1.0851
1.0853
1.0813
1.0816
1.0819
1.0821
1.0823
1.0824
1.0828
1.0829
1.0788
1.0791
1.0794
1.0796
1.0798
1.0799
1.0803
1.0805
1.0761
1.0764
1.0767
1.0770
1.0771
1.0773
1.0777
1.0779
(vi) L- tryptophan in 2 M aqueous KNO3 solution
0.0000
0.0090
0.0135
0.0180
0.0225
0.0270
0.0315
0.0361
1.1150
I.II53
1.1156
1.1157
1.1161
1.1163
1.1164
1.1169
1.1125
1.1127
1.1131
1.1133
1.1135
1.1138
1.1139
1.1143
1.1098
1.1100
1.1104
1.1106
1.1108
1.1111
1.1113
1.1115
1.1070
1.1072
1.1076
1.1078
1.1080
1.1083
1.1084
1.1086
1.1040
1.1042
1.1046
1.1048
1.1050
1.1053
1.1054
1.1056
1.1009
I.IOII
1.1015
1.1017
1.1018
1.1021
1.1023
1.1024
20
0.0000
0.0184
0.0369
0.0554
0.0740
0.0927
0.1114
0.1302
0.1491
(vii) Glycylglycine in 2 M aqueous KCl solution
1.0877
1.0881
1.0890
1.0902
1.0911
1.0923
1.0928
1.0935
1.0942
1.0857
1.0862
1.0871
1.0881
1.0890
1.0899
1.0905
1.0915
1.0922
1.0836
1.0841
1.0850
1.0859
1.0868
1.0875
1.0881
1.0893
1.0900
1.0813
1.0819
1.0828
1.0836
1.0845
1.0852
1.0857
1.0870
1.0877
1.0788
1.0795
1.0804
1.0812
1.0820
1.0827
1.0832
1.0845
1.0852
1.0761
1.0769
1.0778
1.0786
1.0794
1.0802
1.0807
1.0819
1.0826
(viii) Glycylglycine in 2 M aqueous KNO3 solution
0.0000
0.0180
0.0360
0.0541
0.0722
0.0904
0.1087
0.1270
0.1454
1.1150
1.1156
1.1161
1.1171
1.1181
1.1192
1.1198
1.1211
1.1216
1.1125
1.1130
1.1137
1.1148
1.1157
1.1166
1.1174
1.1185
1.1194
1.1098
1.1104
1.1111
1.1123
1.1131
1.1139
1.1148
1.1158
1.1170
1.1070
1.1076
1.1083
1.1096
1.1103
1.1111
1.1120
1.1129
1.1144
1.1040
1.1046
1.1053
1.1067
1.1073
1.1081
1.1090
1.1099
1.1117
1.1009
1.1015
1.1022
1.1035
1.1042
1.1050
1.1058
1.1068
1.1089
21
^
X Q.
1.075-
0.00 0.03 0.06 0.09 0.12 0.15 0.18 0.21 0.24
m / molkg
Fig 1.1 Plot of density versus molal concentration of L- histidine in 2 M
aqueous KCl solution.
^
X Q.
Fig 1.2
1.095 0.00 0.03 0.06 0.09 0.12 0.15 0.18 0.21 0.24
m / mol-kg"'
Plot of density versus molal concentration of L- histidine in 2 M
aqueous KNO3 solution.

22
1.100
1.075-
0.00 0.01 0.02 0.03 0.04 0.05 0.06
m / mol-kg"'
Fig 1.3 Plot of density versus molal concentration of L- glutamic acid in 2 M
aqueous KCl solution.
^
X
a.
1.128
1.124
1.120
1.116-
1.112-
1.108-
1.104-
1.100-
1.096
• • •
•
• -4
298.15 K 303.15 K 308.15 K 313.15 K 318.15K 323.15 K
0.00 0.01 0.02 0.03 m / mol-kg"'
0.04 0.05
Fig 1.4 Plot of density versus molal concentration of L- glutamic acid in 2 M
aqueous KNO3 solution.
23
X
1.076-
1.072
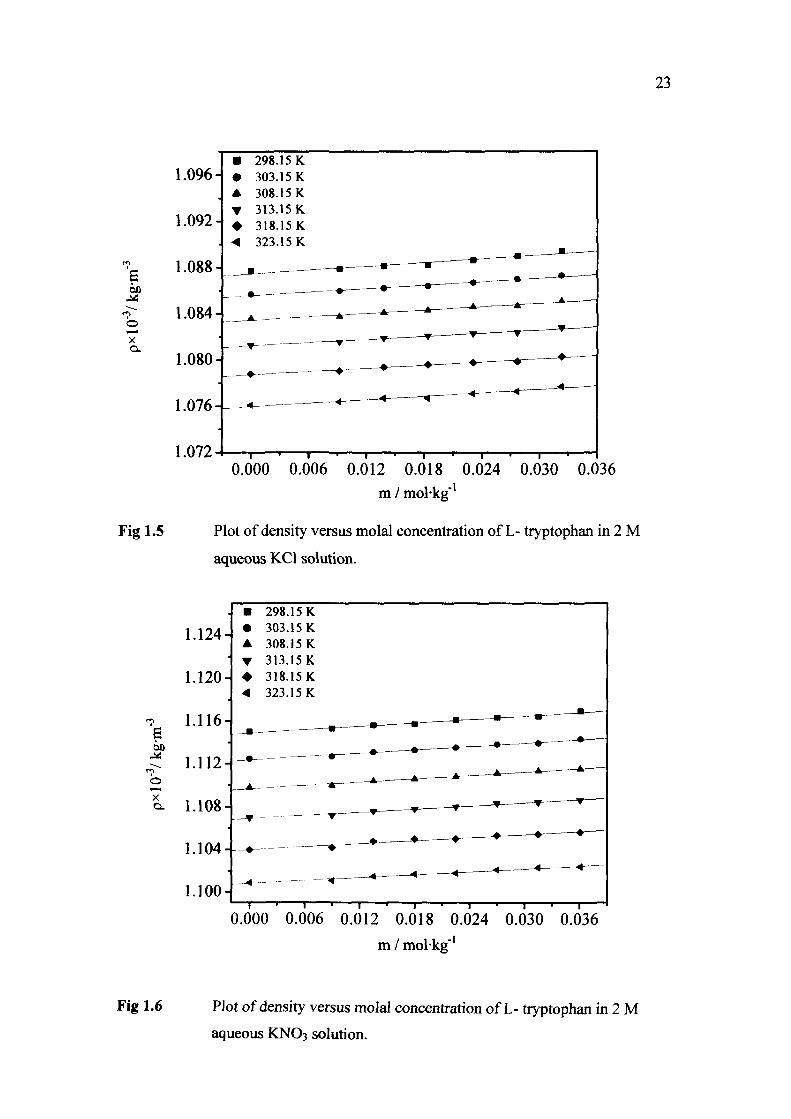
Fig 1.5
0.000 0.006 0.012 0.018 0.024 0.030 0.036 -1
m / molkg"
Plot of density versus molal concentration of L- tryptophan in 2 M
aqueous KCl solution.
CL 1.108-
1.100-
0.000 0.006 0.012 0.018 0.024 0.030 0.036
m / molkg"'
Fig 1.6 Plot of density versus molal concentration of L- tryptophan in 2 M
aqueous KNO3 solution.

24
60
X Q.
Fig 1.7
1.080-
1.075-
0.00 0.02 0.04 0.06 0.08 0.10 0.12 0.14 0.16
m / mol-kg"'
Plot of density versus molal concentration of Glycylglycine in 2 M
aqueous KCl solution.
1.135 • 298.15 K • 303.15 K
1.130-1 A 308.15K • 313.15K • 318.15K < 323.15 K
1.125-
io 1.120H
X Q.
Fig 1.8
T • 1 ' 1 « 1 ' 1 1 1 1 1 1 1 1
0.00 0.02 0.04 0.06 0.08 0.10 0.12 0.14 0.
m/ molkg"^
Plot of density versus molal concentration of Glycylglycine in 2 M
aqueous KNO3 solution.

25
p/g-cm-^ =Po + P 1 T (1.2)
where p^, Pi,Po, pj; m and T are the fitted coefficients, molal concentration of
solution and temperature, respectively. The least-squares fitted coefficients of the
above linear equations alongwith the standard deviations are listed in Tables 1.2 and
1.3, respectively. The smaller magnitude of standard deviations of these least square-
fitted values support the tendency of density values to exhibit linear behaviour with
variation in molal concentration of solute as well as with temperature. The density
values of all the studied systems have been found to be higher than those of water at
all temperatures of study as envisaged [243]. These values show a usual decreasing
trends of variation with an increase in temperature. The density values of 2 M
aqueous KNO3 solution (l.I150xlO^ kgm"^ at 298.15 K) are higher than those of 2 M
aqueous KCl solution (1.0877xl0\ kg-m" at 298.15 K) at all temperatures of study.
Soto et al. [237] have reported the similar trend of variation of density value of
glycine in 1.0m aqueous KNO3 and 1.0m aqueous KCl solutions.
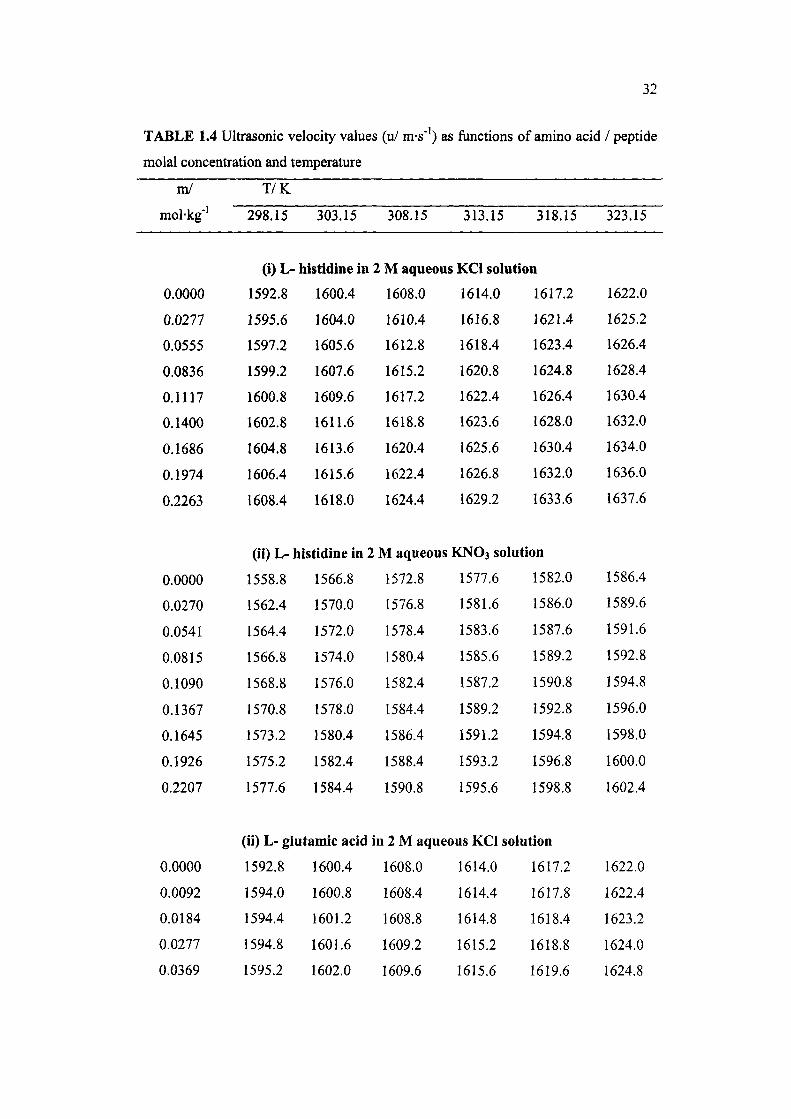
The ultrasonic velocity values of the L-histidine/ L-glutamic acid/ L-
tryptophan/ glycylglycme + 2 M aqueous KCl / 2M aqueous KNO3 systems have been
measured experimentally as functions of molal concentration of amino acid / peptide
and temperature: 298.15, 303.15, 308.15, 313.15, 318.15 and 323.15 K. The measured
values have been listed in Table 1.4. The plots of ultrasonic velocity versus amino
acid / peptide molal concentration are shown in Fig. 1.8-1.16. The ultrasonic velocity
data have been least-squares fitted to the following equations,
u/m-s"' =uo+uim (1.3)
u/m-s''=uo'+urT (1.4)
where UQ, ui, Uo', ui'; m and T are the fitted coefficients, molal concentrafion of
solution and temperature, respectively. The fitted coefficients alongwith their standard
deviadons are listed in the Table 1.5 and 1.6, respectively. A close scrudny of the
Table 1.4 reveals that the ultrasonic velocity values increase with an increase in molal
concentration of amino acid/ peptide in the 2 M aqueous KCl / 2 M aqueous KNO3
solution. This behaviour may be attributed to over all increase of cohesion brought
about by the solute-solute and solute-solvent interactions in solutions. Amino acid and
peptide molecules in aqueous solution essentially behave as zwitterions having NH3"*
and COO~groups at two ends of the molecule. The K , Cr and NO3" ions furnished by
26
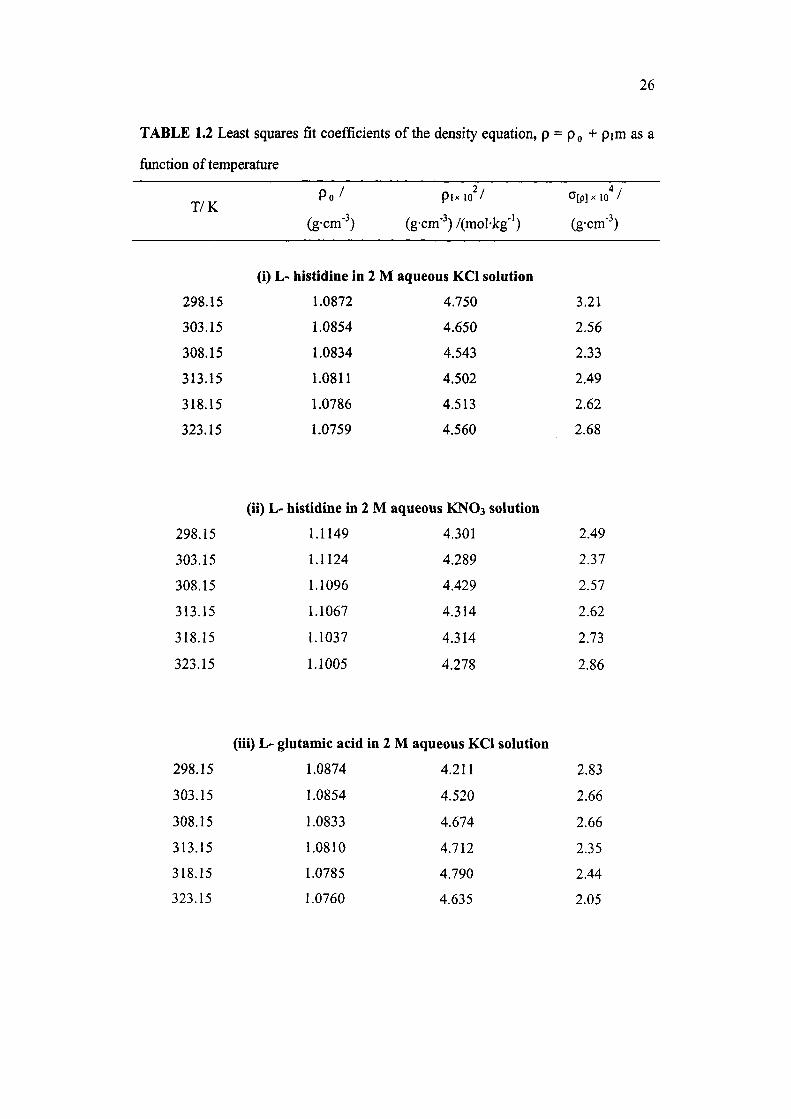
TABLE 1.2 Least squares fit coefficients of the density equation, p = Po + p i m a s a
function of temperature
T/K Po / PlxlO / <7[p]x 10 /
(g-cm"^) (g-cm"^) /(mol-kg'') (g-cm"^)
(i) L- histidine in 2 M aqueous KCl solution
298.15 L0872 4.750 3.21
303.15 1.0854 4.650 2.56
308.15 1.0834 4.543 2.33
313.15 1.0811 4.502 2.49
318.15 1.0786 4.513 2.62
323.15 1.0759 4.560 2.68
(ii) L- histidine in 2 M aqueous KNO3 solution
298.15 1.1149 4.301 2.49
303.15 1.1124 4.289 2.37
308.15 1.1096 4.429 2.57
313.15 1.1067 4.314 2.62
318.15 1.1037 4.314 2.73
323.15 1.1005 4.278 2.86
(iii) L- glutamic acid in 2 M aqueous KCl solution
298.15 1.0874 4.211 2.83
303.15 1.0854 4.520 2.66
308.15 1.0833 4.674 2.66
313.15 1.0810 4.712 2.35
318.15 1.0785 4.790 2.44
323.15 1.0760 4.635 2.05

27
(iv) L- glutamic acid in 2 M aqueous KNO3 solution
298.15
303.15
308.15
313.15
318.15
323.15
1.1149
1.1125
1.1098
1.1070
1.1040
1.1010
5.986
6.025
5.946
5.946
5.867
5.866
1.47
1.52
1.56
1.56
1.69
1.37
(v) L- tryptophan in 2 M aqueous KCl solution
298.15
303.15
308.15
313.15
318.15
323.15
1.0875
1.0856
1.0835
1.0813
1.0787
1.0760
5.400
4.960
4.808
4.471
4.629
5.004
1.78
0.87
0.94
0.67
0.71
1.14
(vi) L- tryptophan in 2 M aqueous KNO3 solution
298.15 1.1149 5.145 1.05
303.15 1.1124 5.044 0.92
308.15 1.1097 4.999 0.78
313.15 1.1069 4.721 0.83
318.15 1.1040 4.565 1.40
323.15 1.1008 4.459 0.82
(vii) Glycylglycine in 2 M aqueous KCl solution
298.15 1.0875 4.641 2.65
303.15 1.0856 4.516 1.35
308.15 1.0834 4.383 1.41
313.15 1.0812 4.320 1.52
318.15 1.0788 4.266 1.49
323.15 1.0761 4.329 1.20

28
(viii) Glycylglycine in 2 M aqueous KNO3 solution
298.15 1.1147 4.807 2.33
303.15 1.1122 4.862 1.62
308.15 1.1095 4.954 1.78
313.15 1.1067 4.991 2.38
318.15 1.1037 5.092 3.23
323.15 1.1005 5.193 4.09
29
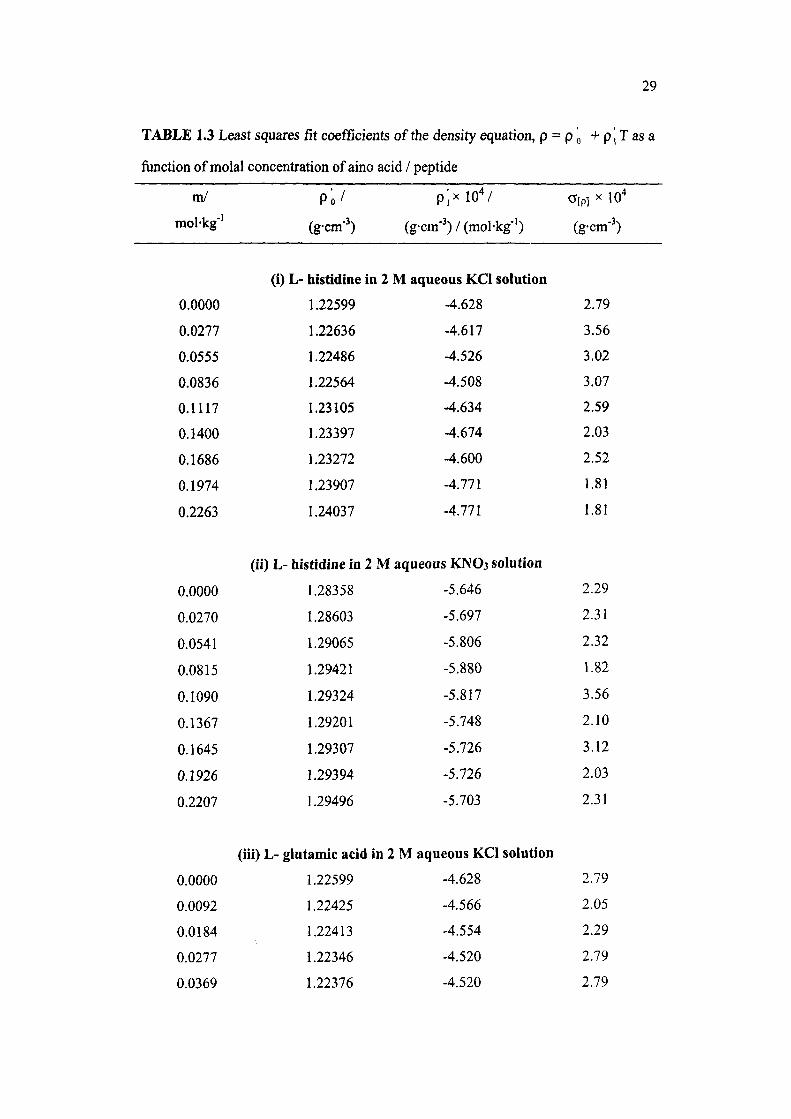
TABLE 1.3 Least squares fit coefScients of the density equation, p = Po +piTasa
function of molal concentration of aino acid / peptide
m/
mol'kg"'
0.0000
0.0277
0.0555
0.0836
0.1117
0.1400
0.1686
0.1974
0.2263
P o /
(g-cm'^)
(i) L- histidine in
1.22599
1.22636
1.22486
1.22564
1.23105
1.23397
1.23272
1.23907
1.24037
(g-
p i x l o V
cm-^) / (mol-kg-')
2 M aqueous KCI solution
-4.628
-4.617
-4.526
-4.508
-4.634
-4.674
-4.600
-4.771
-4.771
0[p] X lO"
(g-cm-^)
2.79
3.56
3.02
3.07
2.59
2.03
2.52
1.81
1.81
(ii) L- histidine in 2 M aqueous KNO3 solution
0.0000
0.0270
0.0541
0.0815
0.1090
0.1367
0.1645
0.1926
0.2207
1.28358
1.28603
1.29065
1.29421
1.29324
1.29201
1.29307
1.29394
1.29496
-5.646
-5.697
-5.806
-5.880
-5.817
-5.748
-5.726
-5.726
-5.703
2.29
2.31
2.32
1.82
3.56
2.10
3.12
2.03
2.31
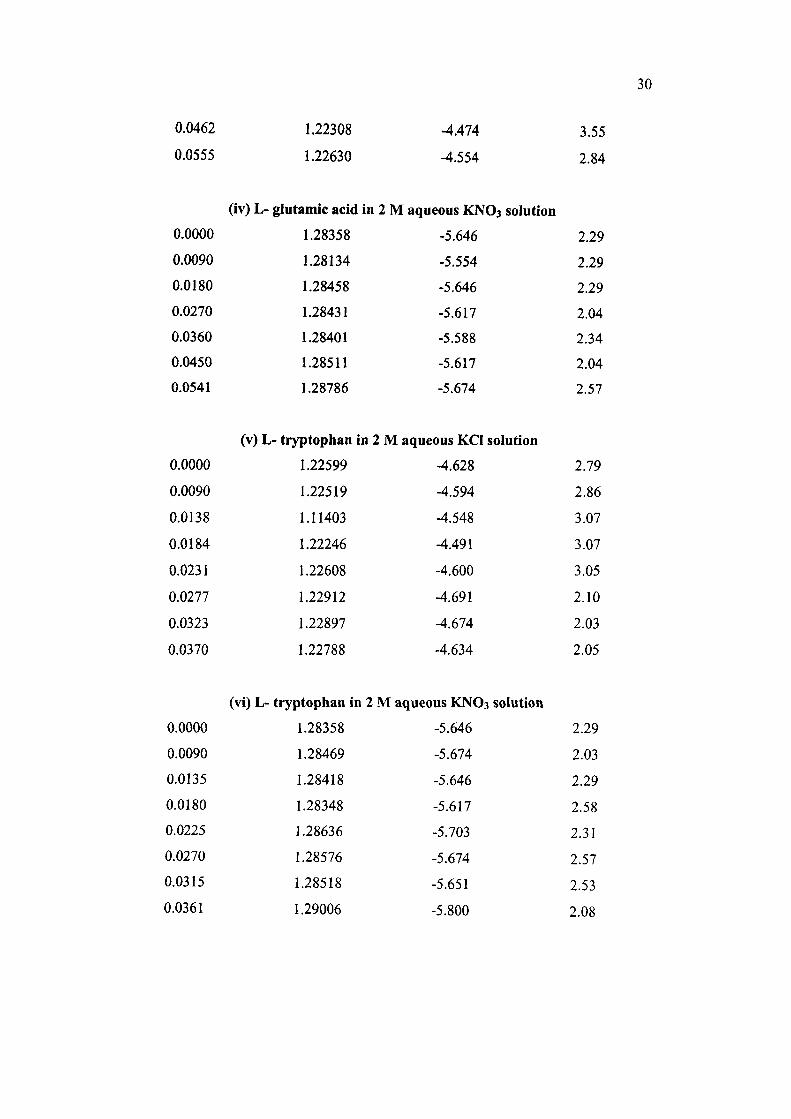
(iii) L- glutamic acid in 2 M aqueous KCi solution
0.0000 1.22599 -4.628 2.79
0.0092 1.22425 -4.566 2.05
0.0184 1.22413 -4.554 2.29
0.0277 1.22346 -4.520 2.79
0.0369 1.22376 -4.520 2.79
30
0.0462
0.0555
1.22308
1.22630
-4.474
-4.554
3.55
2.84
(iv) L- glutamic acid in 2 M aqueous KNO3 solution
0.0000
0.0090
0.0180
0.0270
0.0360
0.0450
0.0541
1.28358
1.28134
1.28458
1.28431
1.28401
1.28511
1.28786
-5.646
-5.554
-5.646
-5.617
-5.588
-5.617
-5.674
2.29
2.29
2.29
2.04
2.34
2.04
2.57
(v) L- tryptoplian in 2 M aqueous KCI solution
0.0000
0.0090
0.0138
0.0184
0.0231
0.0277
0.0323
0.0370
1.22599
1.22519
1.11403
1.22246
1.22608
1.22912
1.22897
1.22788
-4.628
-4.594
-4.548
-4.491
-4.600
-4.691
-4.674
-4.634
2.79
2.86
3.07
3.07
3.05
2.10
2.03
2.05
(vi) L- tryptophan in 2 M aqueous KNO3 solution
0.0000
0.0090
0.0135
0.0180
0.0225
0.0270
0.0315
0.0361
1.28358
1.28469
1.28418
1.28348
1.28636
1.28576
1.28518
1.29006
-5.646
-5.674
-5.646
-5.617
-5.703
-5.674
-5.651
-5.800
2.29
2.03
2.29
2.58
2.31
2.57
2.53
2.08

31
(vii) Glycylglycine in 2 M aqueous KCI solution
0.0000
0.0184
0.0369
0.0554
0.0740
0.0927
0.1114
0.1302
0.1491
1.22599
1.22178
1.22268
1.22839
1.23067
1.23612
1.23737
1.23227
1.22664
-4.628
-4.474
-4.474
-4.628
-4.674
-4.823
-4.845
-4.646
-4.446
2.79
2.57
5.57
1.81
2.03
0.66
0.78
2.29
4.48
(viii) Glycylglycine in 2 M aqueous KNO3 solution
0.0000
0.0180
0.0360
0.0541
0.0722
0.0904
0.1087
0.1270
0.1454
1.28358
1.28363
1.28253
1.27931
1.28453
1.28859
1.28710
1.29204
1.27384
-5.646
-5.628
-5.571
-5.428
-5.571
-5.674
-5.600
-5.726
-5.097
2.29
2.26
2.79
3.33
2.79
2.03
3.05
2.03
2.31
32
TABLE 1.4 Ultrasonic velocity values (u/ m-s"') as functions of amino acid / peptide
molal concentration and temperature
mol-kg"' 298.15 303.15 308.15 313.15 318.15 323.15
(i) L- histidine in 2 M aqueous KCl solution
0.0000
0.0277
0.0555
0.0836
0.1117
0.1400
0.1686
0.1974
0.2263
0.0000
0.0270
0.0541
0.0815
0.1090
0.1367
0.1645
0.1926
0.2207
1592.8
1595.6
1597.2
1599.2
1600.8
1602.8
1604.8
1606.4
1608.4
(ii)L.l
1558.8
1562.4
1564.4
1566.8
1568.8
1570.8
1573.2
1575.2
1577.6
1600.4
1604.0
1605.6
1607.6
1609.6
1611.6
1613.6
1615.6
1618.0
histidine in
1566.8
1570.0
1572.0
1574.0
1576.0
1578.0
1580.4
1582.4
1584.4
1608.0
1610.4
1612.8
1615.2
1617.2
1618.8
1620.4
1622.4
1624.4
2 M aqueous
1572.8
1576.8
1578.4
1580.4
1582.4
1584.4
1586.4
1588.4
1590.8
1614.0
1616.8
1618.4
1620.8
1622.4
1623.6
1625.6
1626.8
1629.2
1617.2
1621.4
1623.4
1624.8
1626.4
1628.0
1630.4
1632.0
1633.6
K N O 3 solution
1577.6
1581.6
1583.6
1585.6
1587.2
1589.2
1591.2
1593.2
1595.6
1582.0
1586.0
1587.6
1589.2
1590.8
1592.8
1594.8
1596.8
1598.8
1622.0
1625.2
1626.4
1628.4
1630.4
1632.0
1634.0
1636.0
1637.6
1586.4
1589.6
1591.6
1592.8
1594.8
1596.0
1598.0
1600.0
1602.4
(ii) L- glutamic acid in 2 M aqueous KCI solution
0.0000 1592.8 1600.4 1608.0 1614.0 1617.2 1622.0
0.0092 1594.0 1600.8 1608.4 1614.4 1617.8 1622.4
0.0184 1594.4 1601.2 1608.8 1614.8 1618.4 1623.2
0.0277 1594.8 1601.6 1609.2 1615.2 1618.8 1624.0
0.0369 1595.2 1602.0 1609.6 1615.6 1619.6 1624,8

33
0.0462
0.0555
1596.0
1596.4
1602.4
1603.2
1610.0
1610.4
1616.0
1616.8
1620.0
1620.4
1625.6
1626 A
(iv) L- glutamic acid in 2 M aqueous KNO3 solution
0.0000
0.0090
0.0180
0.0270
0.0360
0.0450
0.0541
1558.8
1559.2
1560.4
1561.2
1562.0
1562.8
1563.6
1566.8
1567.6
1568.8
1569.2
1570.4
1571.2
1572.2
1572.8
1573.2
1574.4
1575.6
1576.8
1577.6
1578.0
1577.6
1578.8
1579.6
1580.8
1582.0
1583.2
1584.0
1582.0
1583.6
1584.8
1585.6
1586.4
1587.6
1588.4
1586.4
1587.2
1588.0
1588.8
1589.0
1590.4
1591.2
(v) L- tryptophan in 2 M aqueous KCl solution
0.0000
0.0090
0.0138
0.0184
0.0231
0.0277
0.0323
0.0370
0.0000
0.0090
0.0135
0.0180
0.0225
0.0270
0.0315
0.0361
1592.8
1593.6
1594.0
1594.4
1595.2
1596.0
1596.8
1597.6
1600.4
1601.6
1602.0
1603.2
1604.0
1604.8
1605.6
1606.4
(vi) L- tryptoplian in
1558.8
1560.8
1561.2
1562.0
1562.6
1563.2
1564.0
1564.8
1566.8
1567.6
1568.0
1568.4
1569.2
1570.0
1570.8
1571.6
1608.0
1608.8
1609.6
1610.0
1610.4
1610.8
1611.6
1612.0
1614.0
1614.8
1615.2
1615.6
1616.0
1616.8
1617.6
1618.4
2 M aqueous K N O 3 s
1572.8
1573.0
1573.6
1574.8
1575.6
1576.0
1576.8
1578.0
1577.6
1578.0
1578.4
1579.2
1580.0
1580.8
1581.2
1582.0
1617.2
1620.0
1620.4
1620.8
1621.6
1622.4
1622.8
1623.6
solution
1582.0
1582.8
1583.2
1584.0
1584.4
1585.2
1586.0
1586.8
1622.0
1623.6
1624.0
1624.4
1625.2
1626.0
1626.4
1627.6
1586.4
1586.8
1587.2
1587.6
1588.4
1589.2
1590.0
1590.8
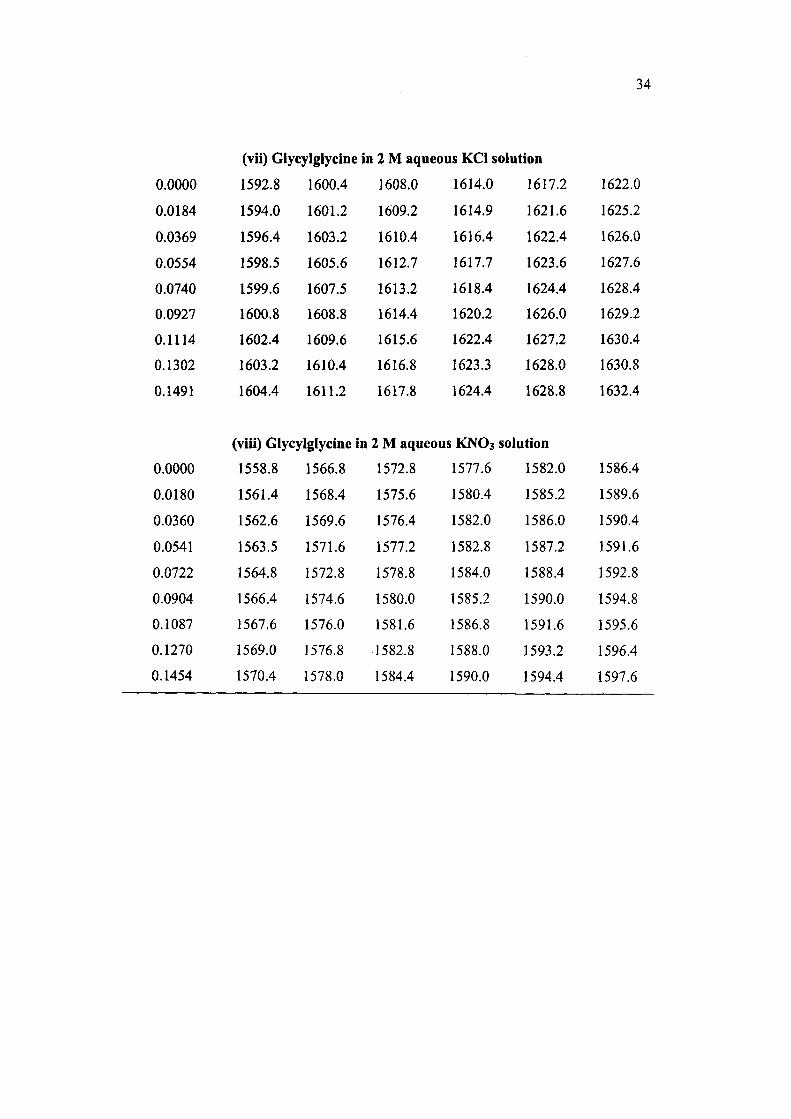
34
0.0000
0.0184
0.0369
0.0554
0.0740
0.0927
0.1114
0.1302
0.1491
(vii) Glycylglycine in 2 M aqueous KCI solution
1592.8
1594.0
1596.4
1598.5
1599.6
1600.8
1602.4
1603.2
1604.4
1600.4
1601.2
1603.2
1605.6
1607.5
1608.8
1609.6
1610.4
1611.2
1608.0
1609.2
1610.4
1612.7
1613.2
1614.4
1615.6
1616.8
1617.8
1614.0
1614.9
1616.4
1617.7
1618.4
1620.2
1622.4
1623.3
1624.4
1617.2
1621.6
1622.4
1623.6
1624.4
1626.0
1627.2
1628.0
1628.8
1622.0
1625.2
1626.0
1627.6
1628.4
1629.2
1630.4
1630.8
1632.4
(viii) Glycylglycine in 2 M aqueous KNO3 solution
0.0000
0.0180
0.0360
0.0541
0.0722
0.0904
0.1087
0.1270
0.1454
1558.8
1561.4
1562.6
1563.5
1564.8
1566.4
1567.6
1569.0
1570.4
1566.8
1568.4
1569.6
1571.6
1572.8
1574.6
1576.0
1576.8
1578.0
1572.8
1575.6
1576.4
1577.2
1578.8
1580.0
1581.6
1582.8
1584.4
1577.6
1580.4
1582.0
1582.8
1584.0
1585.2
1586.8
1588.0
1590.0
1582.0
1585.2
1586.0
1587.2
1588.4
1590.0
1591.6
1593.2
1594.4
1586.4
1589.6
1590.4
1591.6
1592.8
1594.8
1595.6
1596.4
1597.6

35
t/2
s
Fig 1.9
1660
1650-
1640-
1600-
1590-
• 298.15 K • 303.15 K A 308.15 K • 313.15 K • 318.15 K < 323.15 K
0.00 0.03 0.06 0.09 0.12 0.15 0.18 0.21 0.24 m / mol-kg"'
Plot of ultrasonic velocity versus molal concentration of L- histidine in
2 M aqueous KCl solution.
6
0.00 0.03 0.06 0.09 0.12 0.15 0.18 0.21 0.24 m / molkg"'
Fig 1.10 Plot of ultrasonic velocity versus molal concentration of L- histidine in
2 M aqueous KNO3 solution.
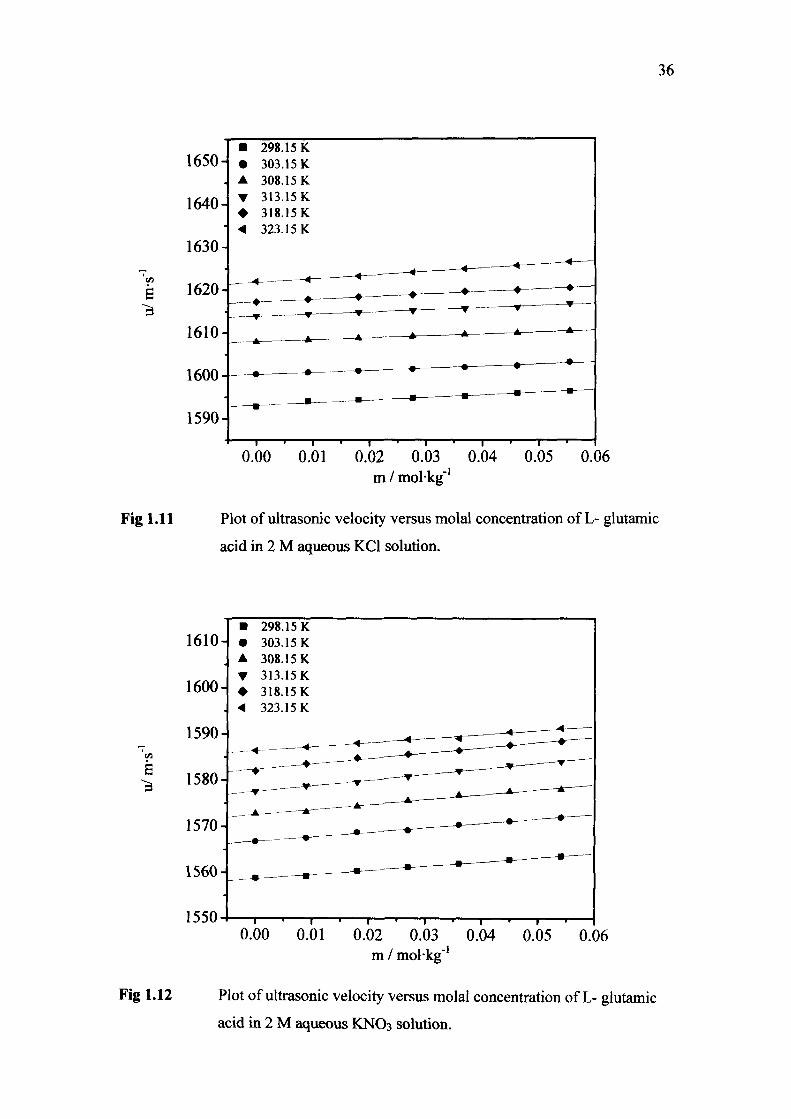
36
S
1650-
1640-
1630-
1590-
• •
298.15 K 303.15 K 308.15 K 313.15K 318.15 K 323.15 K
0.00 0.01 0.02 0.03 0.04 0.05 0.06 m / molkg"'
Fig 1.11 Plot of ultrasonic velocity versus molal concentration of L- glutamic
acid in 2 M aqueous KCl solution.
S
1610-
1600-
1590-
1580-
1570-
1560-
1550
• • •4
298.15 K 303.15 K 308.15 K 313.15K 318.15 K 323.15 K
0.00 0.01 0.02 0.03 0.04 0.05 0.06 m / molkg"'
Fig 1.12 Plot of ultrasonic velocity versus molal concentration of L- glutamic
acid in 2 M aqueous KNO3 solution.

37
S
1650-
1640-
1630-
1620
1610-
1600-
1590-
• • • -4
298.15 K 303.15 K 308.15 K 313.15 K 318.15 K 323.15 K
0.000 0.006 0.012 0.018 0.024 0.030 0.036 m / molkg'
Fig 1.13 Plot of ultrasonic velocity versus molal concentration of L- tryptophan
in 2 M aqueous KCl solution.
1610-1
1600
1590-1
1580
1570-
1560-
1550
• • •4
298.15 K 303.15 K 308.15 K 313.15 K 318.15 K 323.15 K
0.000 0.006 0.012 0.018 0.024 0.030 0.036 m / molkg"'
Fig 1.14 Plot of ultrasonic velocity versus molal concentration of L- tryptophan
in 2 M aqueous KNO3 solution.

38
Vi
1590-
0.00 0.02 0.04 0.06 0.08 0.10 0.12 0.14 0.16 m / molkg'
Fig 1.15 Plot of ultrasonic velocity versus molal concentration of
Glycylglycine in 2 M aqueous KCl solution.
6
1620
1610
1600
1560-
1550
• T • •4
298.15 K 303.15 K 308.15 K 313.15K 318.15K 323.15 K
Fig 1.16
0.00 0.02 0.04 0.06 0.08 0.10 0.12 0.14 0.16 m / molkg'
Plot of ultrasonic velocity versus molal concentration of
Glycylglycine in 2 M aqueous KNO3 solution.
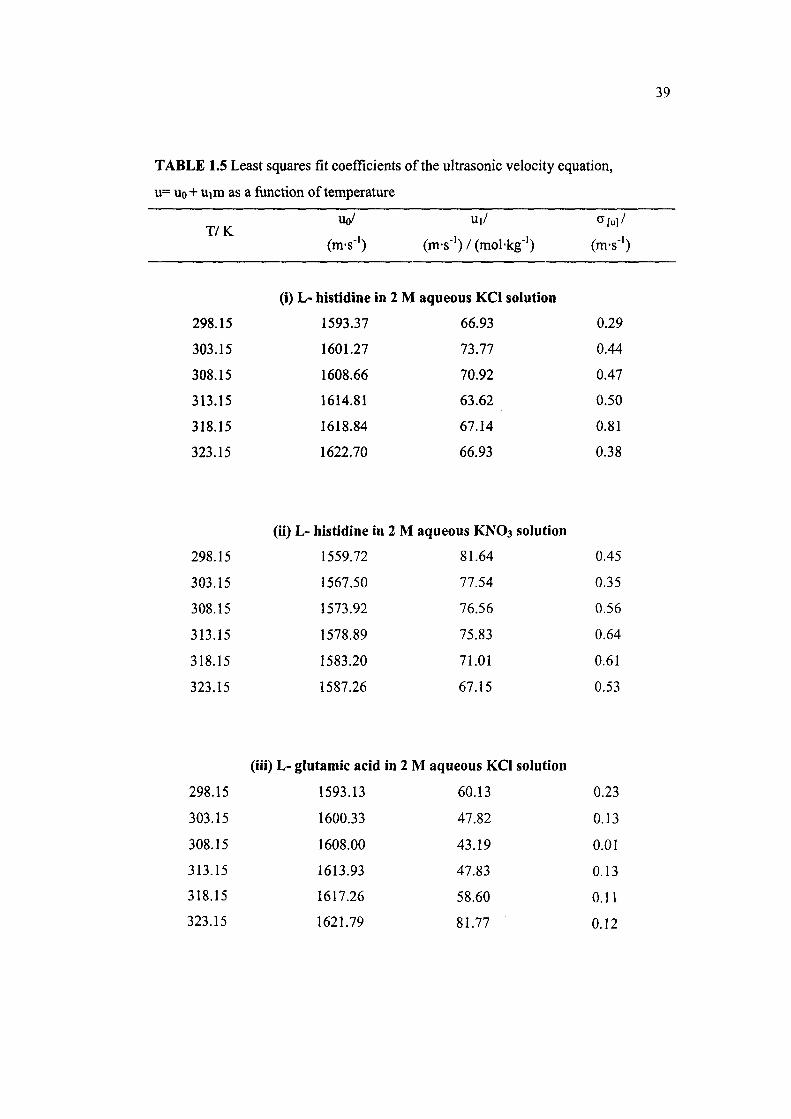
39
TABLE 1.5 Least squares fit coefficients of the ultrasonic velocity equation,
u= uo+Uim as a function of temperature
T/K Uo/ U|/
(m-s-') (m-s-') / (mol-kg-') (m-s-')
(i) L- histidine in 2 M aqueous KCI solution
298.15 1593.37 66.93 0.29
303.15 1601.27 73.77 0.44
308.15 1608.66 70.92 0.47
313.15 1614.81 63.62 0.50
318.15 1618.84 67.14 0.81
323.15 1622.70 66.93 0.38
(ii) L- histidine in 2 M aqueous KNO3 solution
298.15 1559.72 81.64 0.45
303.15 1567.50 77.54 0.35
308.15 1573.92 76.56 0.56
313.15 1578.89 75.83 0.64
318.15 1583.20 71.01 0.61
323.15 1587.26 67.15 0.53
(iii) L- glutamic acid in 2 M aqueous KCI solution
298.15 1593.13 60.13 0.23
303.15 1600.33 47.82 0.13
308.15 1608.00 43.19 0.01
313.15 1613.93 47.83 0.13
318.15 1617.26 58.60 0.11
323.15 1621.79 81.77 0.12
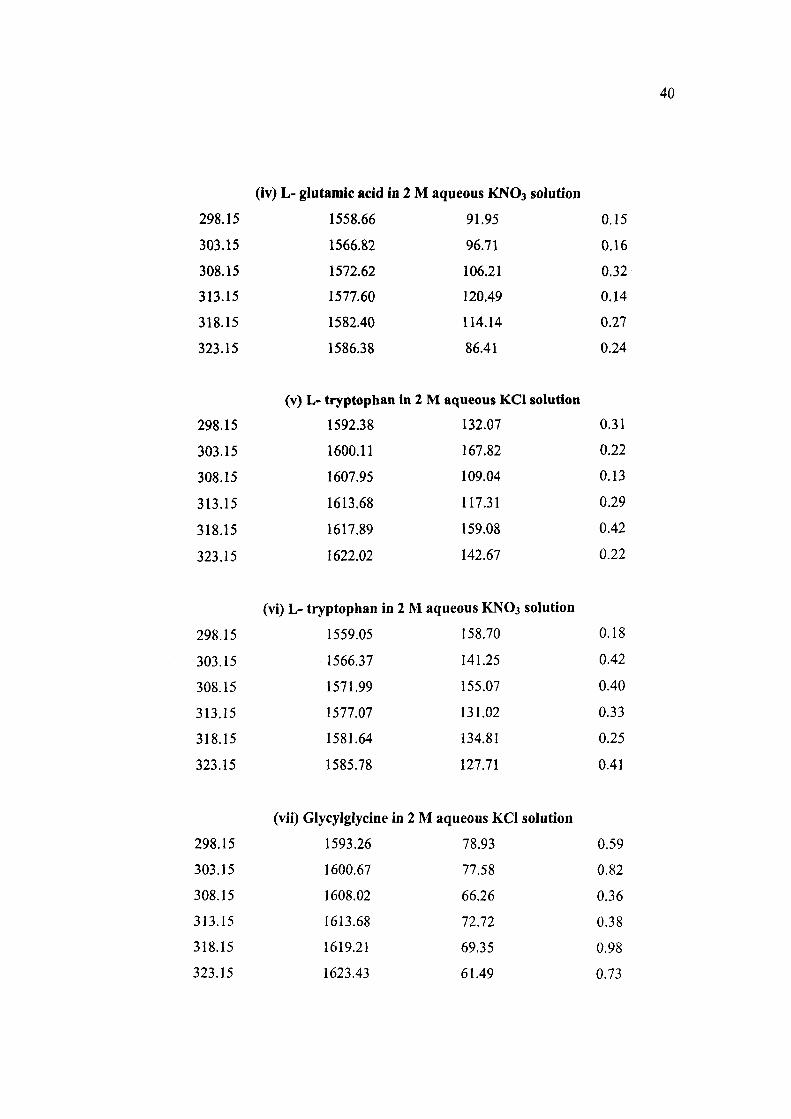
40
(iv) L- glutamic acid in 2 M aqueous KNO3 solution
298.15 1558.66 91.95 0.15
303.15 1566.82 96.71 0.16
308.15 1572.62 106.21 0.32
313.15 1577.60 120.49 0.14
318.15 1582.40 114.14 0.27
323.15 1586.38 86.41 0.24
(v) L- tryptophan in 2 M aqueous KCI solution
298.15
303.15
308,15
313.15
318.15
323.15
1592.38
1600.11
1607.95
1613.68
1617.89
1622.02
132.07
167.82
109.04
117.31
159.08
142.67
0.31
0.22
0.13
0.29
0.42
0.22
(vi) L- tryptophan in 2 M aqueous KNO3 solution
298.15 1559.05 158.70 0.18
303.15 1566.37 141.25 0.42
308.15 1571.99 155.07 0.40
313.15 1577.07 131.02 0.33
318.15 1581.64 134.81 0.25
323.15 1585.78 127.71 0.41
(vii) Glycylglycine in 2 M aqueous KCI solution
298.15 1593.26 78.93 0.59
303.15 1600.67 77.58 0.82
308.15 1608.02 66.26 0.36
313.15 1613.68 72.72 0.38
318.15 1619.21 69.35 0.98
323.15 1623.43 61.49 0.73
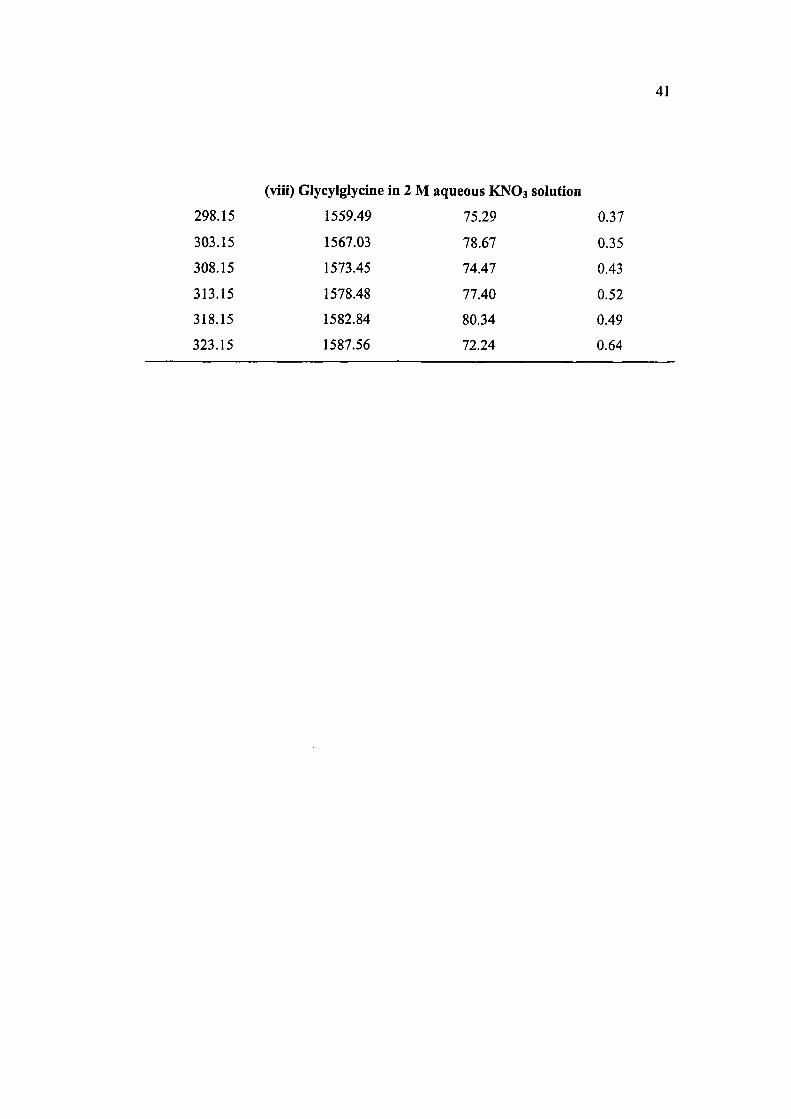
41
(viii) Glycylglycine in 2 M aqueous KNO3 solution
298.15 1559.49 75.29 0.37
303.15 1567.03 78.67 0.35
308.15 1573.45 74.47 0.43
313.15 1578.48 77.40 0.52
318.15 1582.84 80.34 0.49
323.15 1587.56 72.24 0.64
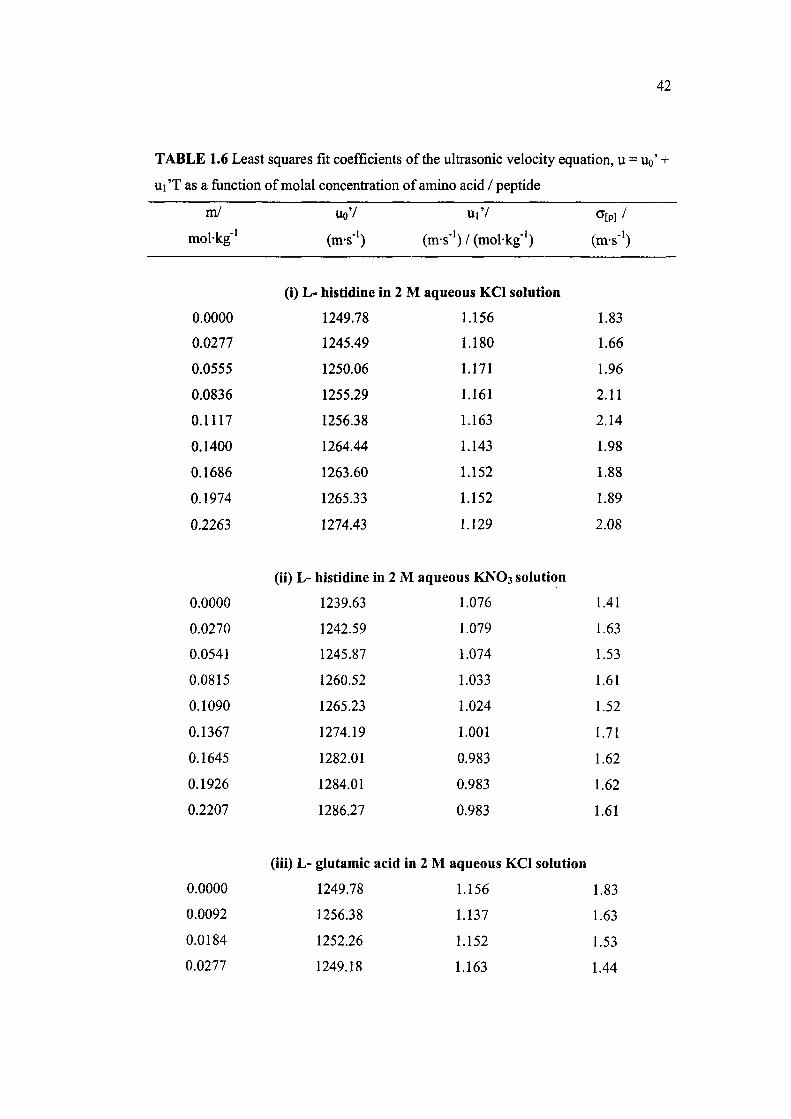
42
TABLE 1.6 Least squares fit coefficients of the ultrasonic velocity equation, u = uo' +
ui 'T as a function of molal concentration of amino acid / peptide
m/
mol-kg"'
Uo'/
(m-s-') (m-s-') / (mol-kg-')
a[p] /
(m-s-')
(i) L- histidine in 2 M aqueous KCl solution
0.0000
0.0277
0.0555
0.0836
0.1117
0.1400
0.1686
0.1974
0.2263
1249.78
1245.49
1250.06
1255.29
1256.38
1264.44
1263.60
1265.33
1274.43
1.156
1.180
1.171
1.161
1.163
1.143
1.152
1.152
1.129
1.83
1.66
1.96
2.11
2.14
1.98
1.88
1.89
2.08
(ii) L- Iiistidine in 2 M aqueous KNO3 solution
0.0000
0.0270
0.0541
0.0815
0.1090
0.1367
0.1645
0.1926
0.2207
1239.63
1242.59
1245.87
1260.52
1265.23
1274.19
1282.01
1284.01
1286.27
1.076
1.079
1.074
1.033
1.024
1.001
0.983
0.983
0.983
1.41
1.63
1.53
1.61
1.52
1.71
1.62
1.62
1.61
(iii) L- glutamic acid in 2 M aqueous KCl solution
0.0000 1249.78 1.156 1.83
0.0092 1256.38 1.137 1.63
0.0184 1252.26 1.152 1.53
0.0277 1249.18 1.163 1.44
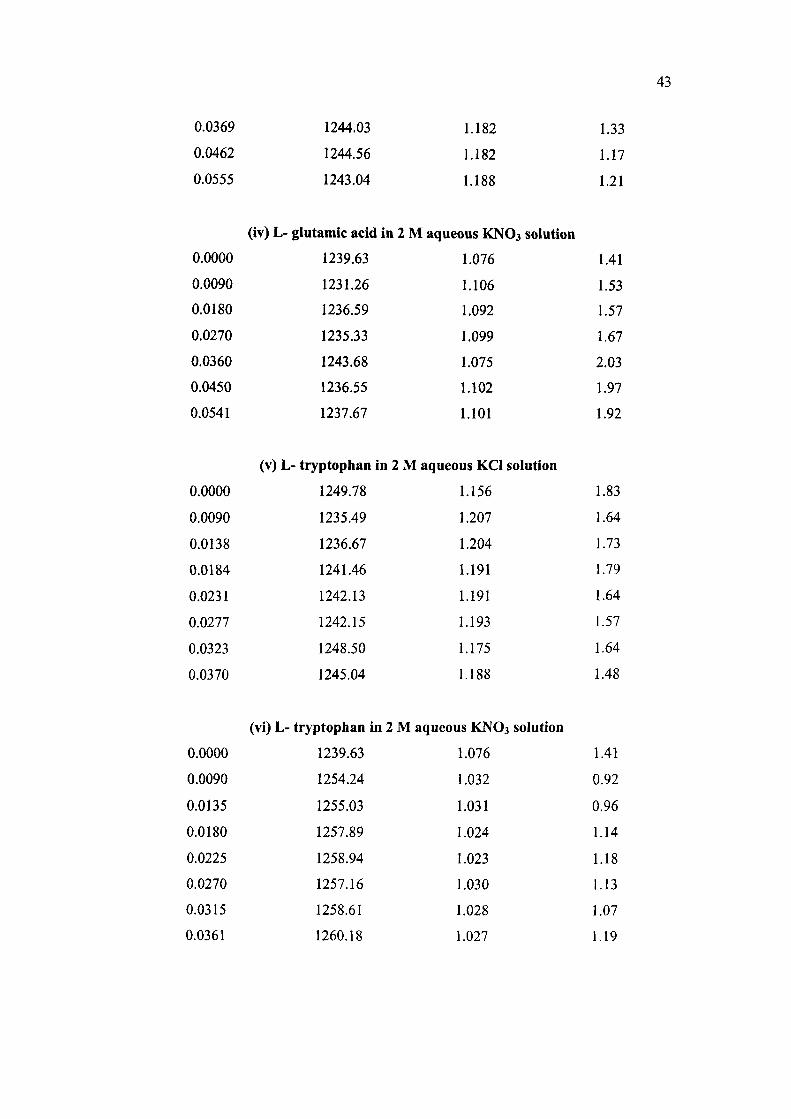
43
0.0369
0.0462
0.0555
1244.03
1244.56
1243.04
1.182
1.182
1.188
1.33
1.17
1.21
(iv) L- glutamic acid in 2 M aqueous KNO3 solution
0.0000
0.0090
0.0180
0.0270
0.0360
0.0450
0.0541
1239.63
1231.26
1236.59
1235.33
1243.68
1236.55
1237.67
1.076
1.106
1.092
1.099
1.075
1.102
1.101
1.41
1.53
1.57
1.67
2.03
1.97
1.92
(v) L- tryptophan in 2 M aqueous KCl solution
0.0000
0.0090
0.0138
0.0184
0.0231
0.0277
0.0323
0.0370
1249.78
1235.49
1236.67
1241.46
1242.13
1242.15
1248.50
1245.04
1.156
1.207
1.204
1.191
1.191
1.193
1.175
1.188
1.83
1.64
1.73
1.79
1.64
1.57
1.64
1.48
(vi) L- tryptophan in 2 M aqueous KNO3 solution
0.0000
0.0090
0.0135
0.0180
0.0225
0.0270
0.0315
0.0361
1239.63
1254.24
1255.03
1257.89
1258.94
1257.16
1258.61
1260.18
1.076
1.032
1.031
1.024
1.023
1.030
1.028
1.027
1.41
0.92
0.96
1.14
1.18
1.13
1.07
1.19
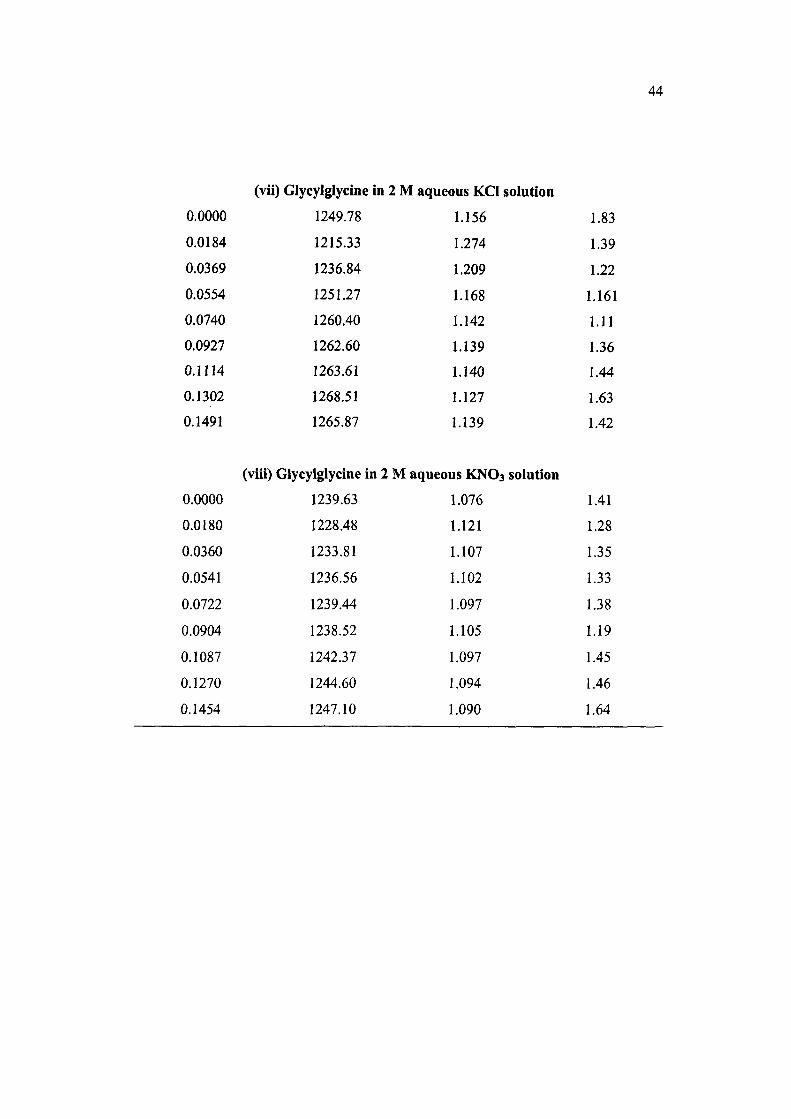
44
(vii) Glycylglycine in 2 M aqueous KCl solution
0.0000
0.0184
0.0369
0.0554
0.0740
0.0927
0.1114
0.1302
0.1491
1249.78
1215.33
1236.84
1251.27
1260.40
1262.60
1263.61
1268.51
1265.87
1.156
1.274
1.209
1.168
1.142
1.139
1.140
1.127
1.139
1.83
1.39
1.22
1.161
1.11
1.36
1.44
1.63
1.42
(viii) Glycylglycine in 2 M aqueous KNO3 solution
0.0000
0.0180
0.0360
0.0541
0.0722
0.0904
0.1087
0.1270
0.1454
1239.63
1228.48
1233.81
1236.56
1239.44
1238.52
1242.37
1244.60
1247.10
1.076
1.121
1.107
1.102
1.097
1.105
1.097
1.094
1.090
1.41
1.28
1.35
1.33
1.38
1.19
1.45
1.46
1.64
45
KCl and KNO3 in solutions may interact electrostatically with NHs" and COO' groups
of zwitterions. The water dipoles may also strongly aligned to the K^ / CVINO3" ion
and NH3V COO" zwitterion end groups electroststically. These interactions
comprehensively introduce the cohesion into solutions under study. These cohesive
forces may get further enhanced on successive addition of amino acid / peptide
amount in the solutions. The added amount of amino acid/ peptide zwitterions may
occupy cavities of water clusters which may lead to the formation of denser structure
of aqueous electrolyte solutions [54]. Hirata and Arakrawa [261], Magazu et al [262],
Rohman and Mahiuddin [263], Ragouvamane and Rao [31], and Ernst and
Manikowski [264] have reported similar increasing trends of variation of ultrasonic
velocity with an increase in solute concentration of tetraalkylammonium salts-water,
a,a-trehalose-water, sodimn nitrate / sodium thiosulphate-water, amino acids-
ethanol water system and aqueous solutions of nickel chloride and nickel bromide,
respectively. The ultrasonic velocity values increase with an increase in temperature.
The rise in temperature may cause the thermal rupture of ice-like open structure
forming to close packed structure of water. It seems that the cohesion factor
dominates over thermal expansion factor in solutions with an increase in temperature.
The isentropic compressibility, change in isentropic compressibility and
relative change in isentropic compressibility values of the amino acid / peptide + 2 M
aqueous KCl / 2 M aqueous KNO3 solutions have been calculated from the ultrasonic
velocity and density values using the following expressions [265,266],
1
P" (1.5)
AKS= Ko-Ks = A + Bm (1.6)
Kr=AKs/Ko = A ' + B'm (1.7)
where KQ and KS are the isentropic compressebilities of solvent and solution,
respectively. The A and B are the intercept and slope value of AKS versus m plot,
respectively. Kr represents the relative change in isentropic compressibility values
whereas A' and B' stand for the intercept and slope values of (AKJ/KO) versus m plot,
respectively.
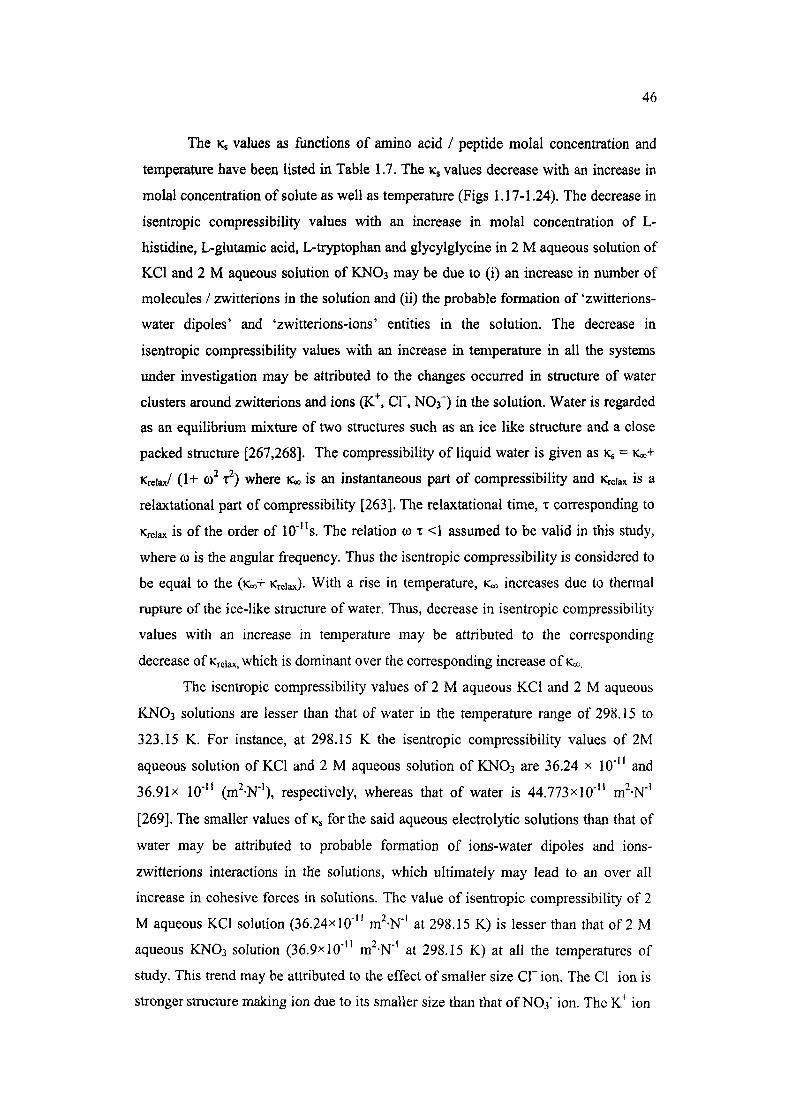
46
The Ks values as functions of amino acid / peptide molal concentration and
temperature have been listed in Table 1.7. The Kg values decrease with an increase in
molal concentration of solute as well as temperature (Figs 1.17-1.24). The decrease in
isentropic compressibility values with an increase in molal concentration of L-
histidine, L-glutamic acid, L-tryptophan and glycylglycine in 2 M aqueous solution of
KCl and 2 M aqueous solution of KNO3 may be due to (i) an increase in number of
molecules / zwitterions in the solution and (ii) the probable formation of 'zwitterions-
water dipoles' and 'zwitterions-ions' entities in the solution. The decrease in
isentropic compressibility values with an increase in temperature in all the systems
xmder investigation may be attributed to the changes occurred in structure of water
clusters around zwitterions and ions (K*. CI", NOf) in the solution. Water is regarded
as an equilibrium mixture of two structures such as an ice like structure and a close
packed structure [267,268]. The compressibility of liquid water is given as Ks = K00+
Kreiax/ (1+ 0) T ) whcrc Koo is an instantaneous part of compressibility and Kreiax is a
relaxtational part of compressibility [263]. The relaxtational time, x corresponding to
Kreiax is of the Order of 10'"s. The relation co T <1 assumed to be valid in this study,
where co is the angular frequency. Thus the isentropic compressibility is considered to
be equal to the (KOO+ Krdax)- With a rise in temperature, K<» increases due to thennal
rupture of the ice-like structure of water. Thus, decrease in isentropic compressibility
values with an increase in temperature may be attributed to the con"esponding
decrease of KreUx, which is dominant over the corresponding increase of K*.
The isentropic compressibility values of 2 M aqueous KCl and 2 M aqueous
KNO3 solutions are lesser than that of water in the temperature range of 298.15 to
323.15 K. For instance, at 298.15 K the isentropic compressibility values of 2M
aqueous solution of KCl and 2 M aqueous solution of KNO3 are 36.24 x 10"" and
36.9 Ix 10"" (m -N"'), respectively, whereas that of water is 44.773x10"" m -N"'
[269]. The smaller values of KJ for the said aqueous electrolytic solutions than that of
water may be attributed to probable formation of ions-water dipoles and ions-
zwitterions interactions in the solutions, which ultimately may lead to an over all
increase in cohesive forces in solutions. The value of isentropic compressibility of 2
M aqueous KCl solution (36.24x10"" m -N"' at 298.15 K) is lesser than that of 2 M
aqueous KNO3 solution (36.9x10"" m -N"' at 298.15 K) at all the temperatures of
study. This trend may be attributed to the effect of smaller size CI" ion. The CI" ion is
stronger structure making ion due to its smaller size than that of NO3" ion. The K ion
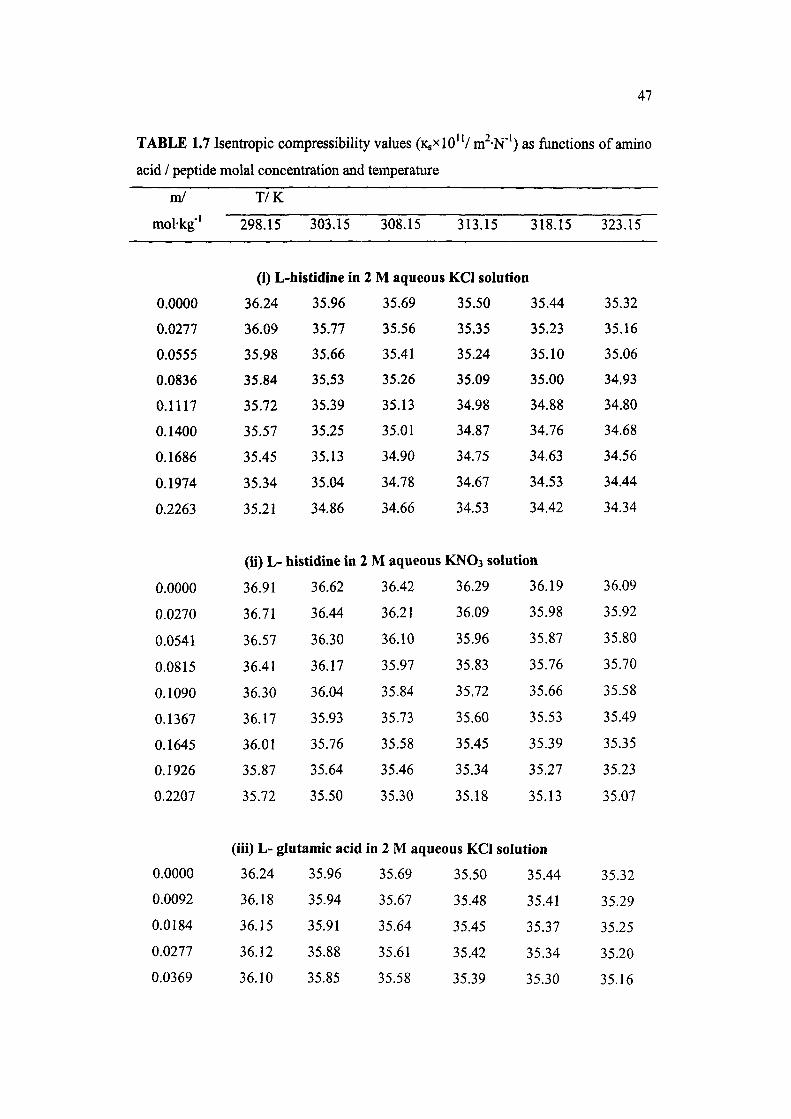
47
TABLE 1.7 Isentropic compressibility values (KSXIO'V m -N"') as functions of amino
acid / peptide molal concentration and temperature
ml
mol-kg"'
0.0000
0.0277
0.0555
0.0836
0.1117
0.1400
0.1686
0.1974
0.2263
0.0000
0.0270
0.0541
0.0815
0.1090
0.1367
0.1645
0.1926
0.2207
T/K
298.15 303.15
(i) L-histidine in
36.24
36.09
35.98
35.84
35.72
35.57
35.45
35.34
35.21
(u)L-!
36.91
36.71
36.57
36.41
36.30
36.17
36.01
35.87
35.72
35.96
35.77
35.66
35.53
35.39
35.25
35.13
35.04
34.86
histidine in
36.62
36.44
36.30
36.17
36.04
35.93
35.76
35.64
35.50
308.15
12 M aqueous
35.69
35.56
35.41
35.26
35.13
35.01
34.90
34.78
34.66
2 M aqueous
36.42
36.21
36.10
35.97
35.84
35.73
35.58
35.46
35.30
313.15 318.15
KCl solutioii
35.50
35.35
35.24
35.09
34.98
34.87
34.75
34.67
34.53
35.44
35.23
35.10
35.00
34.88
34.76
34.63
34.53
34.42
KNO3 solution
36.29
36.09
35.96
35.83
35.72
35.60
35.45
35.34
35.18
36.19
35.98
35.87
35.76
35.66
35.53
35.39
35.27
35.13
323.15
35.32
35.16
35.06
34.93
34.80
34.68
34.56
34.44
34.34
36.09
35.92
35.80
35.70
35.58
35.49
35.35
35.23
35.07
(iii) L- glutamic acid in 2 M aqueous KCl solution
0.0000
0.0092
0.0184
0.0277
0.0369
36.24
36.18
36.15
36.12
36.10
35.96
35.94
35.91
35.88
35.85
35.69
35.67
35.64
35.61
35.58
35.50
35.48
35.45
35.42
35.39
35.44
35.41
35.37
35.34
35.30
35.32
35.29
35.25
35.20
35.16
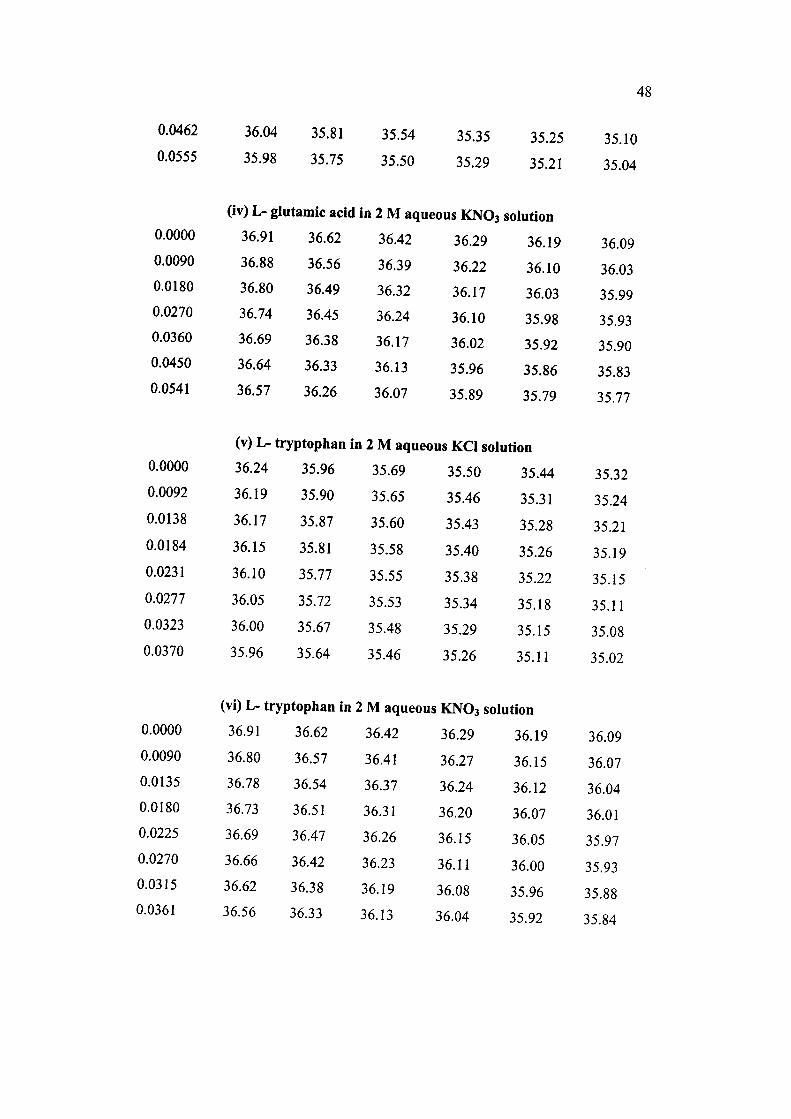
48
0.0462
0.0555
36.04
35.98
35.81
35.75
35.54
35.50
35.35
35.29
35.25
35.21
35.10
35.04
0.0000
0.0090
0.0180
0.0270
0.0360
0.0450
0.0541
36.91
36.88
36.80
36.74
36.69
36.64
36.57
36.62
36.56
36.49
36.45
36.38
36.33
36.26
36.29
36.22
36.17
36.10
36.02
35.96
35.89
36.19
36.10
36.03
35.98
35.92
35.86
35.79
36.09
36.03
35.99
35.93
35.90
35.83
35.77
(iv) L- glutamic acid in 2 M aqueous KNO3 solution
36.42
36.39
36.32
36.24
36.17
36.13
36.07
(v) L- tryptoplian in 2 M aqueous KCl solution
0.0000 36.24 35.96 35.69 35.50 35.44 35.32
0.0092 36.19 35.90 35.65 35.46 35.31 35.24
0.0138 36.17 35.87 35.60 35.43 35.28 35.21
0.0184 36.15 35.81 35.58 35.40 35.26 35.19
0.0231 36.10 35.77 35.55 35.38 35.22 35.15
0.0277 36.05 35.72 35.53 35.34 35.18 35.11
0.0323 36.00 35.67 35.48 35.29 35.15 35.08
0.0370 35.96 35.64 35.46 35.26 35.11 35.02
(vi) L- tryptophan in 2 M aqueous KNO3 solution
36.42
36.41
36.37
36.31
36.26
36.23
36.19
36.13
0.0000
0.0090
0.0135
0.0180
0.0225
0.0270
0.0315
0.0361
36.91
36.80
36.78
36.73
36.69
36.66
36.62
36.56
36.62
36.57
36.54
36.51
36.47
36.42
36.38
36.33
36.29
36.27
36.24
36.20
36.15
36.11
36.08
36.04
36.19
36.15
36.12
36.07
36.05
36.00
35.96
35.92
36.09
36.07
36.04
36.01
35.97
35.93
35.88
35.84
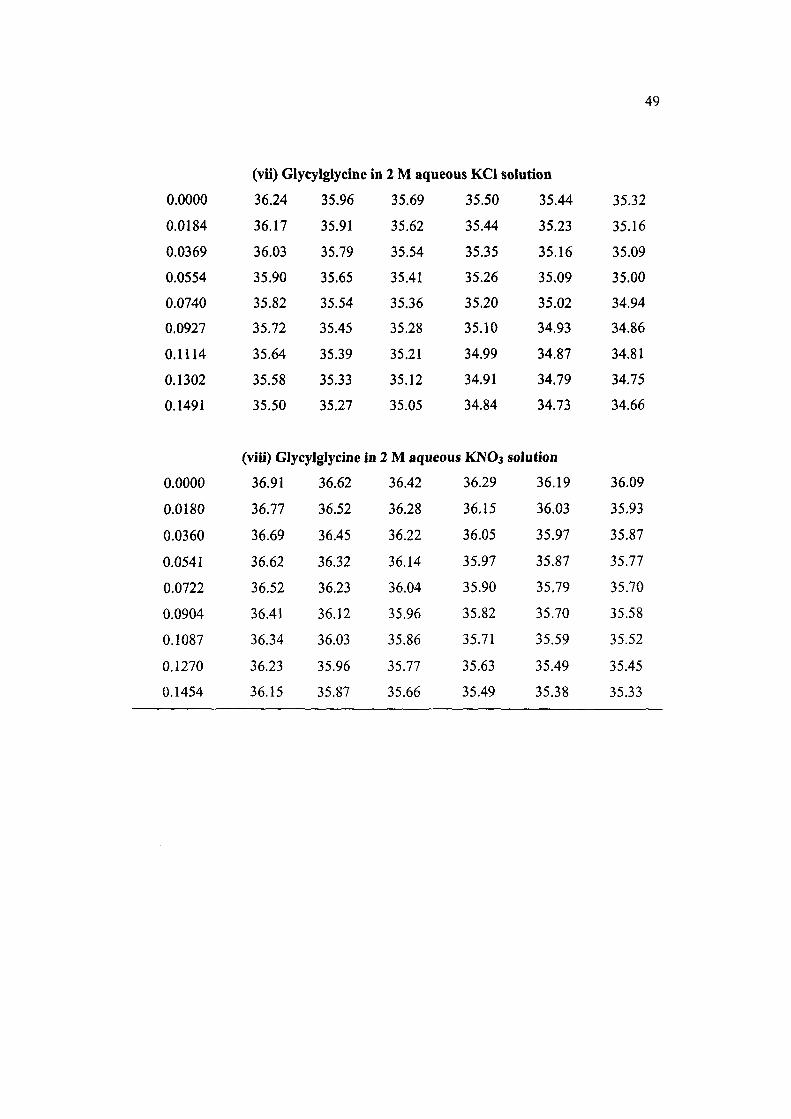
49
(vii) Glycylglycine in 2 M aqueous KCl solution
0.0000
0.0184
0.0369
0.0554
0.0740
0.0927
0.1114
0.1302
0.1491
36.24
36.17
36.03
35.90
35.82
35.72
35.64
35.58
35.50
35.96
35.91
35.79
35.65
35.54
35.45
35.39
35.33
35.27
35.69
35.62
35.54
35.41
35.36
35.28
35.21
35.12
35.05
35.50
35.44
35.35
35.26
35.20
35.10
34.99
34.91
34.84
35.44
35.23
35.16
35.09
35.02
34.93
34.87
34.79
34.73
35.32
35.16
35.09
35.00
34.94
34.86
34.81
34.75
34.66
(viii) Glycylglycine in 2 M aqueous KNO3 soJution
0.0000
0.0180
0.0360
0.0541
0.0722
0.0904
0.1087
0.1270
0.1454
36.91
36.77
36.69
36.62
36.52
36.41
36.34
36.23
36.15
36.62
36.52
36.45
36.32
36.23
36.12
36.03
35.96
35.87
36.42
36.28
36.22
36.14
36.04
35.96
35.86
35.77
35.66
36.29
36.15
36.05
35.97
35.90
35.82
35.71
35.63
35.49
36.19
36.03
35.97
35.87
35.79
35.70
35.59
35.49
35.38
36.09
35.93
35.87
35.77
35.70
35.58
35.52
35.45
35.33
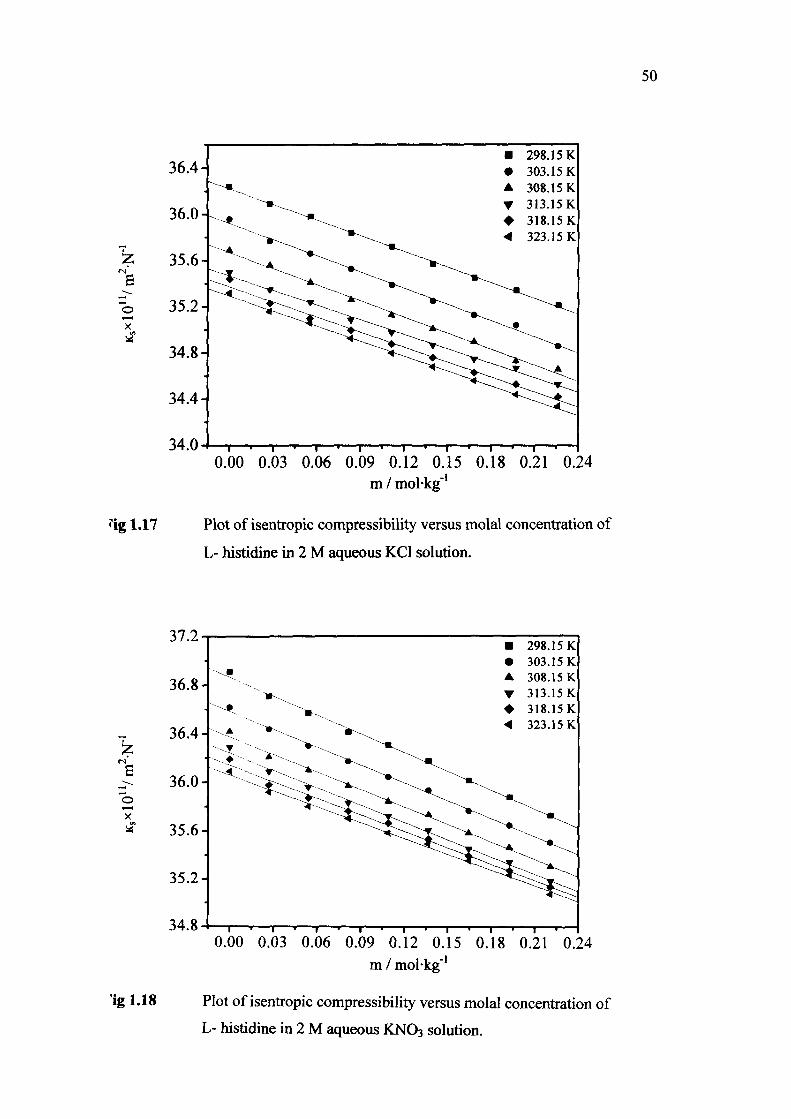
50
X
34.0
• 298.15 K • 303.15 K A 308.15 K
0.00 0.03 0.06 0.09 0.12 0.15 0.18 0.21 0.24 m / mol-kg"'
•"ig 1.17 Plot of isentropic compressibility versus molal concentration of
L- histidine in 2 M aqueous KCl solution.
37.2
s
X
36.8-
36.4-
36.0-
35.6-
35.2-
34.8
• 298.15 K • 303.15 K A 308.15 K • 313.15 K • 318.15 K < 323.15 K
ig 1.18
0.00 0.03 0.06 0.09 0.12 0.15 0.18 0.21 0.24 m / mol-kg"'
Plot of isentropic compressibility versus molal concentration of
L- histidine in 2 M aqueous KNO3 solution.
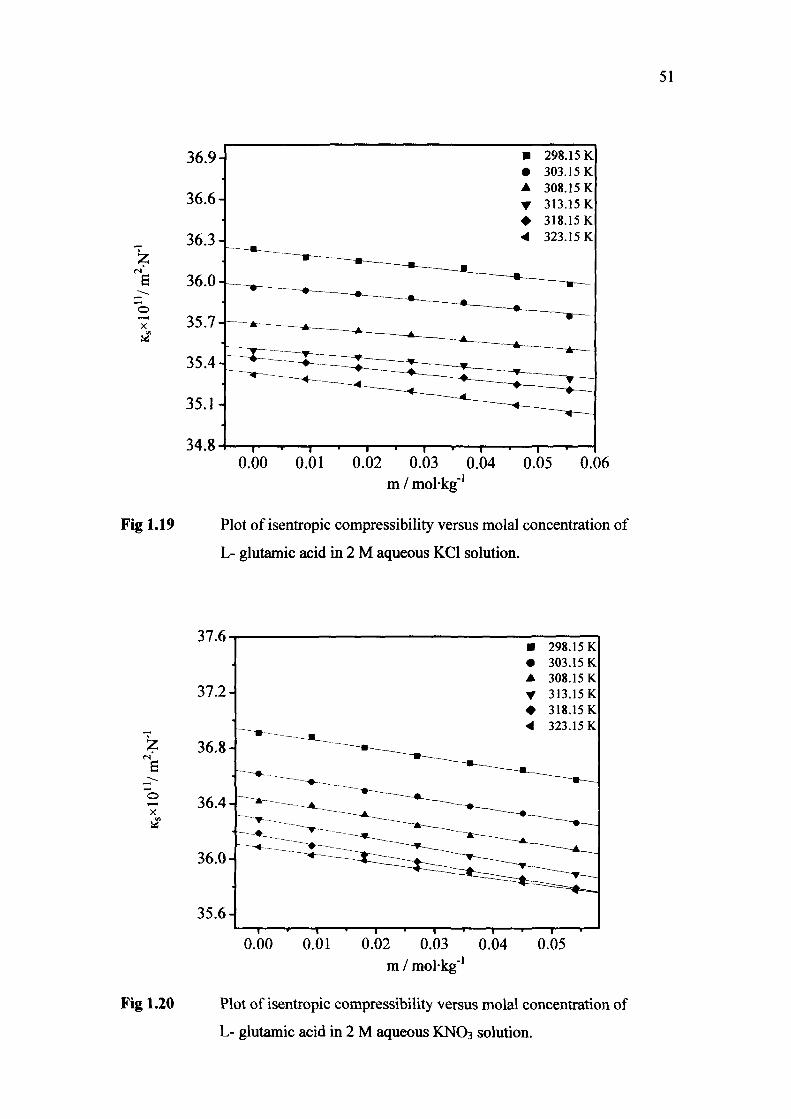
B
X
0.00 0.01 0.02 0.03 0.04 0.05 0.06 m / molkg"'
Fig 1.19 Plot of isentropic compressibility versus molal concentration of
L- glutamic acid in 2 M aqueous KCl solution.
37.6
e
Fig 1.20
37.2-
36.8-
36.4-
36.0-
35.6-
• 298.15 K • 303.15 K A 308.15 K
T •
313.15 K 318.15 K 323.15 K
0.00 0.01 0.02 0.03 0.04 m / molkg"'
0.05
Plot of isentropic compressibility versus molal concentration of
L- glutamic acid in 2 M aqueotis KNO3 solution.
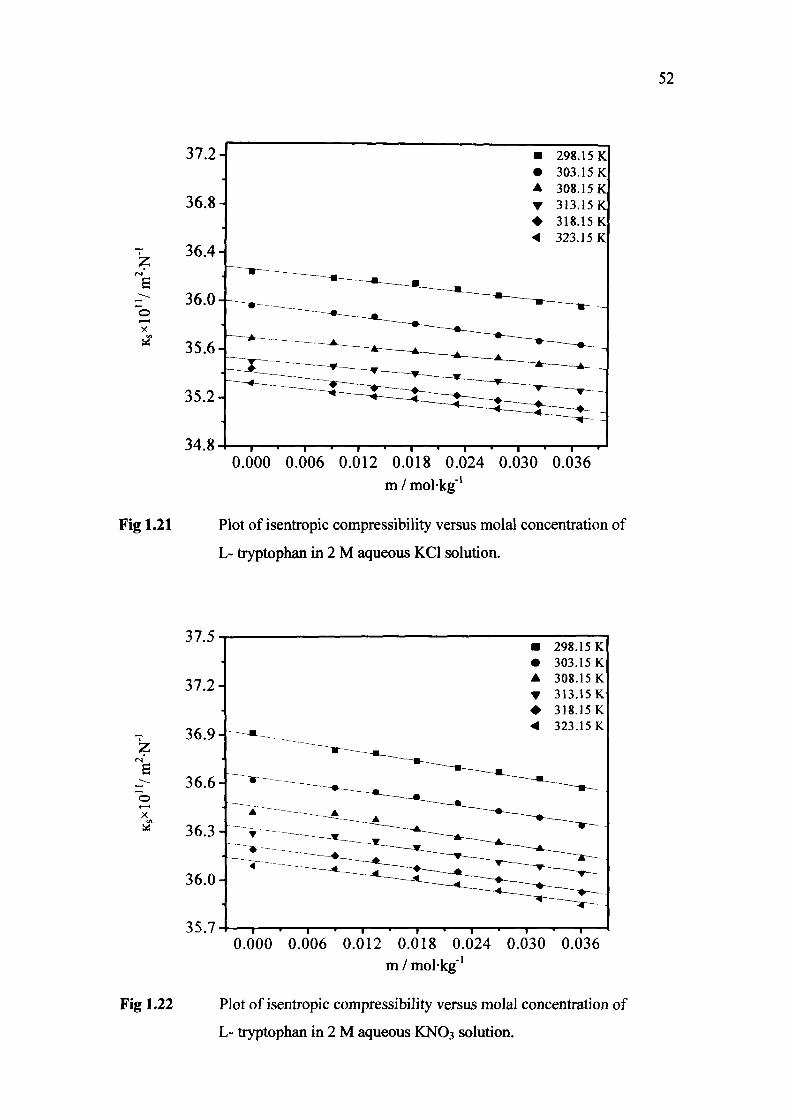
e
0.000 0.006 0.012 0.018 0.024 0.030 0.036 m / molkg"'
Plot of isentropic compressibility versus molal concentration of
L- tryptophan in 2 M aqueoiis KCl solution.
37.5
be!
Fig 1.22
37.2-
36.9-
36.6-
36.3-
36.0-
35.7
• 298.15 K • 303.15 K A 308.15 K T 313.15 K • 318.15 K -^ 323.15 K
0.000 0.006 0.012 0.018 0.024 0.030 0.036 m / molkg''
Plot of isentropic compressibility versus molal concentration of
L- tryptophan in 2 M aqueous KNO3 solution.
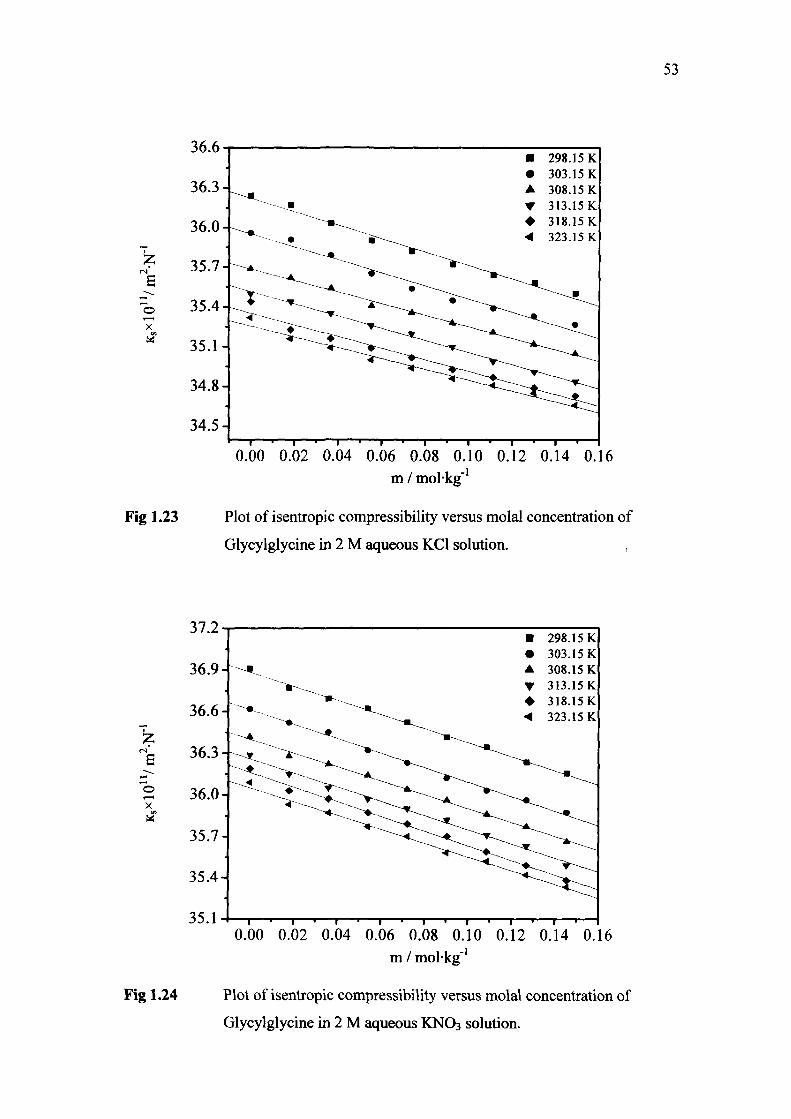
53
e
X
34.8-
34.5-
298.15 K 303.15 K 308.15 K
0.00 0.02 0.04 0.06 0.08 0.10 0.12 0.14 0.16 m / molkg''
Fig 1.23 Plot of isentropic compressibility versus molal concentration of
Glycylglycine in 2 M aqueous KCl solution.
a
X (A
35.1
• 298.15 K • 303.15 K A 308.15 K • 313.15 K • 318.15 K < 323.15 K
Fig 1.24
0.00 0.02 0.04 0.06 0.08 0.10 0.12 0.14 0.16 m / mol-kg"'
Plot of isentropic compressibility versus molal concentration of
Glycylglycine in 2 M aqueous KNO3 solution.
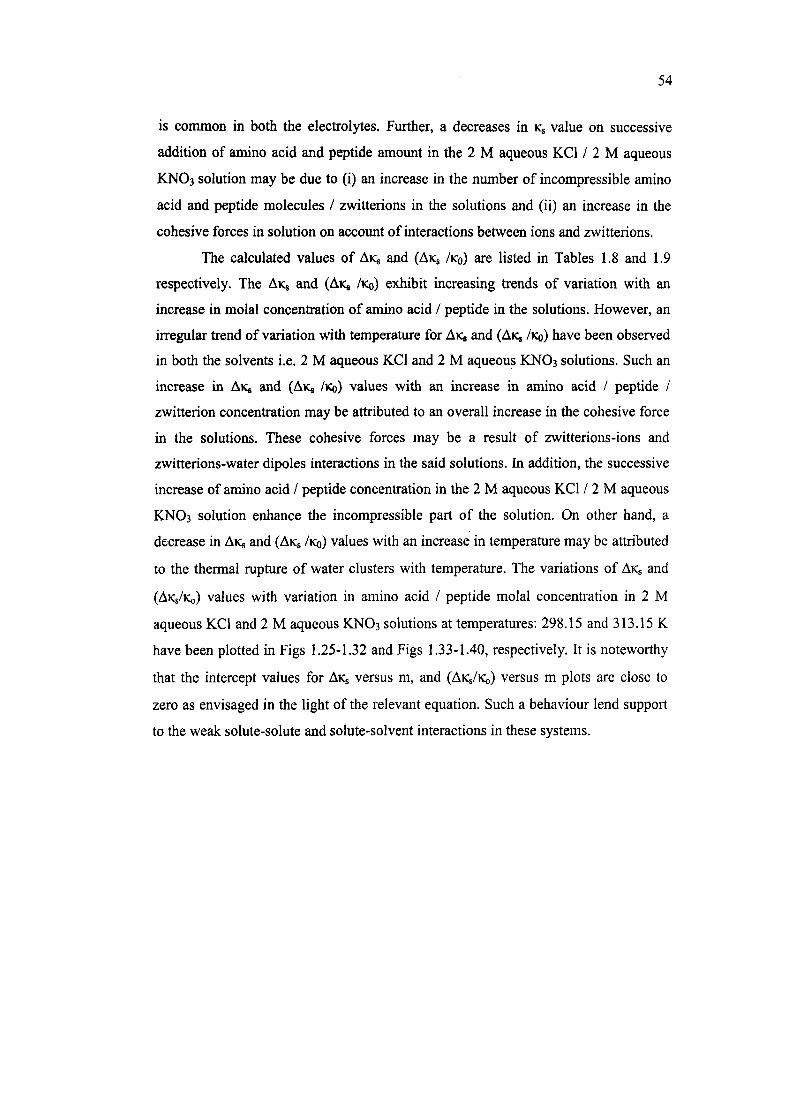
54
is common in both the electrolytes. Further, a decreases in KJ value on successive
addition of amino acid and peptide amoimt in the 2 M aqueous KCl / 2 M aqueous
KNO3 solution may be due to (i) an increase in the number of incompressible amino
acid and peptide molecules / zwitterions in the solutions and (ii) an increase in the
cohesive forces in solution on accoimt of interactions between ions and zwitterions.
The calculated values of AKS and (AKS /KO) are listed in Tables 1.8 and 1.9
respectively. The AKS and (AKJ /KQ) exhibit increasing trends of variation with an
increase in molal concentration of amino acid / peptide in the solutions. However, an
irregular trend of variation with temperature for AKJ and (AKJ /KQ) have been observed
in both the solvents i.e. 2 M aqueous KCl and 2 M aqueous KNO3 solutions. Such an
increase in AKJ and (AKJ /KO) values with an increase in amino acid / peptide /
zwitterion concentration may be attributed to an overall increase in the cohesive force
in the solutions. These cohesive forces may be a result of zwitterions-ions and
zwitterions-water dipoles interactions in the said solutions. In addition, the successive
increase of amino acid / peptide concentration in the 2 M aqueous KCl / 2 M aqueous
KNO3 solution enhance the incompressible part of the solution. On other hand, a
decrease in AKS and (AKS /KQ) values with an increase in temperature may be attributed
to the thennal rupture of water clusters with temperature. The variations of AKS and
(AKS/KO) values with variation in amino acid / peptide molal concentration in 2 M
aqueous KCl and 2 M aqueous KNO3 solutions at temperatures: 298.15 and 313.15 K
have been plotted in Figs 1.25-1.32 and Figs 1.33-1.40, respectively. It is noteworthy
that the intercept values for AKJ versus m, and (AKS/KQ) versus m plots are close to
zero as envisaged in the light of the relevant equation. Such a behaviour lend support
to the weak solute-solute and solute-solvent interactions in these systems.

TABLE 1.8 Change in isentropic compressibility values (AKSXIO'V m^ -N'') as
functions of amino acid / peptide molal concentration and temperature
55
m/
mol-kg"'
0.0277
0.0555
0.0836
0.1117
0.1400
0.1686
0.1974
0.2263
0.0270
0.0541
0.0815
0.1090
0.1367
0.1645
0.1926
0.2207
T/K
298.15
(i)L-
0.147
0.262
0.395
0.522
0.670
0.788
0.900
1.030
303.15
histidine
0.188
0.298
0.429
0.570
0.712
0.832
0.957
1.102
(ii) L- histidine in
0.199
0.339
0.497
0.612
0.737
0.899
1.022
1.185
0.179
0.314
0.448
0.572
0.689
0.855
0.971
1.115
308.15 313.15 318.15
in 2 M aqueous KCI solution
0.132
0.281
0.428
0.564
0.685
0.789
0.907
1.034
2 M aqueous
0.214
0.330
0.460
0.586
0.699
0.849
0.964
1.125
0.149
0.261
0.408
0.522
0.628
0.749
0.829
0.972
0.215
0.338
0.444
0.558
0.678
0.815
0.912
1.021
KNO3 solution
0.209
0.339
0.469
0.580
0.695
0.842
0.956
1.119
0.208
0.320
0.431
0.535
0.656
0.803
0.917
1.0621
323.15
0.162
0.262
0.391
0.521
0.644
0.764
0.877
0.986
0.171
0.297
0.390
0.508
0.597
0.740
0.861
1.020
(iii) L- glutamic acid in 2 M aqueous KCI solution
0.0092
0.0184
0.0277
0.0369
0.0462
0.0555
0.061
0.086
0.114
0.142
0.198
0.255
0.025
0.049
0.080
0.108
0.149
0.211
0.021
0.049
0.079
0.107
0.151
0.191
0.024
0.048
0.082
0.109
0.153
0.208
0.033
0.069
0.099
0.144
0.188
0.228
0.030
0.072
0.120
0.164
0.221
0.279
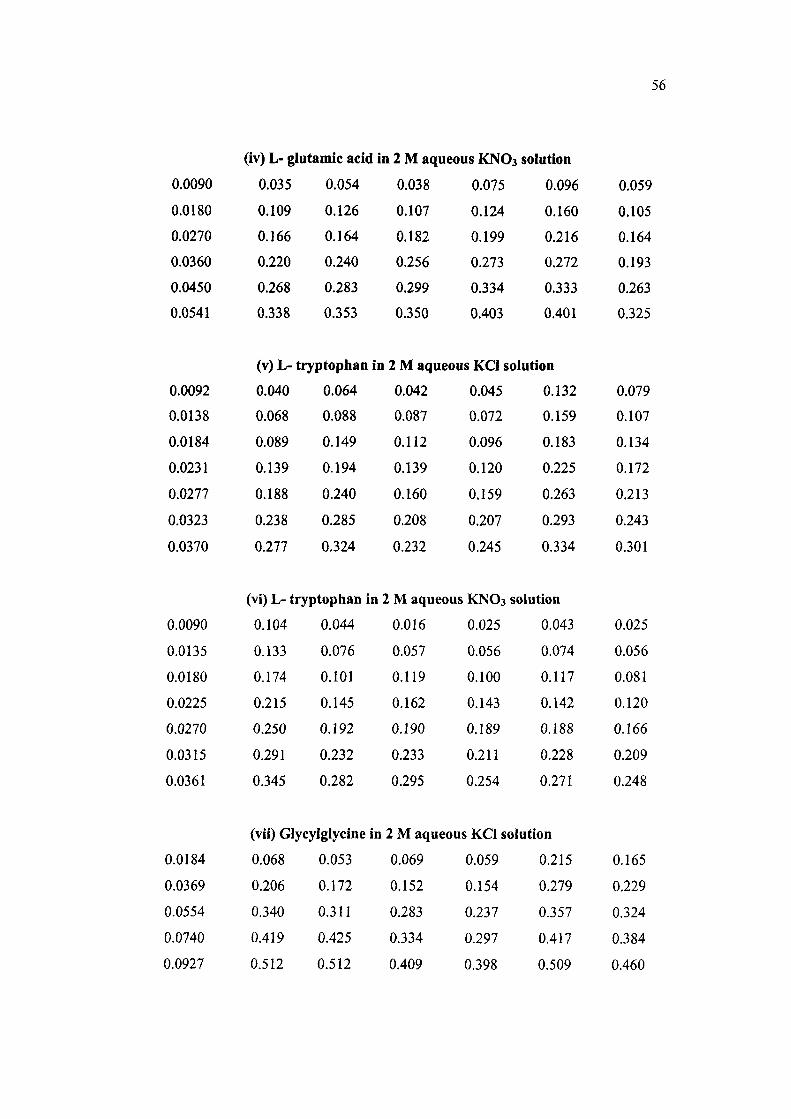
56
0.0090
0.0180
0.0270
0.0360
0.0450
0.0541
(iv) L- glutamic acid
0.035
0.109
0.166
0.220
0.268
0.338
0.054
0.126
0.164
0.240
0.283
0.353
in 2 M aqueous KNO3 solution
0.038
0.107
0.182
0.256
0.299
0.350
0.075
0.124
0.199
0.273
0.334
0.403
0.096
0.160
0.216
0.272
0.333
0.401
0.059
0.105
0.164
0.193
0.263
0.325
(v) L- tryptophan in 2 M aqueous KCl solution
0.0092
0.0138
0.0184
0.0231
0.0277
0.0323
0.0370
0.0090
0.0135
0.0180
0.0225
0.0270
0.0315
0.0361
0.040
0.068
0.089
0.139
0.188
0.238
0.277
0.064
0.088
0.149
0.194
0.240
0.285
0.324
(vi) L- tryptophan in
0.104
0.133
0.174
0.215
0.250
0.291
0.345
0.044
0.076
0.101
0.145
0.192
0.232
0.282
0.042
0.087
0.112
0.139
0.160
0.208
0.232
0.045
0.072
0.096
0.120
0.159
0.207
0.245
2 M aqueous KNO3
0.016
0.057
0.119
0.162
0.190
0.233
0.295
0.025
0.056
0.100
0.143
0.189
0.211
0.254
0.132
0.159
0.183
0.225
0.263
0.293
0.334
solution
0.043
0.074
0.117
0.142
0.188
0.228
0.271
0.079
0.107
0.134
0.172
0.213
0.243
0.301
0.025
0.056
0.081
0.120
0.166
0.209
0.248
(vii) Glycylglycine in 2 M aqueous KCl solution
0.0184 0.068 0.053 0.069 0.059 0.215 0.165
0.0369 0.206 0.172 0.152 0.154 0.279 0.229
0.0554 0.340 0.311 0.283 0.237 0.357 0.324
0.0740 0.419 0.425 0.334 0.297 0.417 0.384
0.0927 0.512 0.512 0.409 0.398 0.509 0.460

57
0.1114
0.1302
0.1491
0.600
0.658
0.734
0.566
0.634
0.692
0.481
0.572
0.638
0.509
0.590
0.659
0.576
0.652
0.709
0.512
0.567
0.658
(viii) Glycylglycine in 2 M aqueous KNO3 solution
0.0180
0.0360
0.0541
0.0722
0.0904
0.1087
0.1270
0.1454
0.143
0.215
0.290
0.384
0.494
0.570
0.677
0.757
0.091
0.170
0.298
0.383
0.495
0.585
0.657
0.740
0.149
0.209
0.284
0.383
0.464
0.566
0.652
0.763
0.148
0.244
0.323
0.400
0.471
0.581
0.664
0.801
0.165
0.225
0.324
0.398
0.496
0.596
0.697
0.808
0.165
0.224
0.320
0.396
0.512
0.573
0.641
0.761
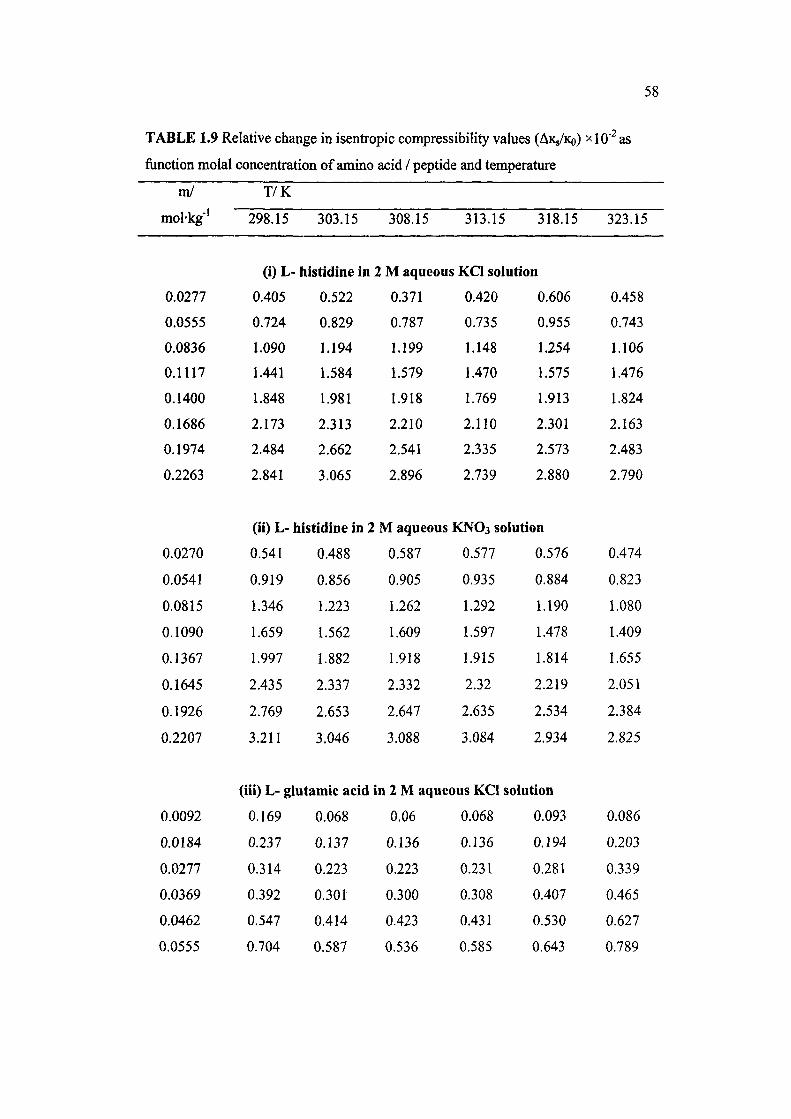
58
TABLE 1.9 Relative change in isentropic compressibility values (AKS/KQ) X 10' as
function molal concentration of amino acid / peptide and temperature
ml
mol-kg"'
0.0277
0.0555
0.0836
0.1117
0.1400
0.1686
0.1974
0.2263
0.0270
0.0541
0.0815
0.1090
0.1367
0.1645
0.1926
0.2207
T/K
298.15
(i)L.
0.405
0.724
1.090
1.441
1.848
2.173
2.484
2.841
(n)L-l
0.541
0.919
1.346
1.659
1.997
2.435
2.769
3.211
303.15 308.15
histidine in 2 M aqueous
0.522
0.829
1.194
1.584
1.981
2.313
2.662
3.065
histidine in
0.488
0.856
1.223
1.562
1.882
2.337
2.653
3.046
0.371
0.787
1.199
1.579
1.918
2.210
2.541
2.896
2 M aqueous
0.587
0.905
1.262
1.609
1.918
2.332
2.647
3.088
313.15 318.15
i KCl solution
0.420
0.735
1.148
1.470
1.769
2.110
2.335
2.739
0.606
0.955
1.254
1.575
1.913
2.301
2.573
2.880
KNO3 solution
0.577
0.935
1.292
1.597
1.915
2.32
2.635
3.084
0.576
0.884
1.190
1.478
1.814
2.219
2.534
2.934
323.15
0.458
0.743
1.106
1.476
1.824
2.163
2.483
2.790
0.474
0.823
1.080
1.409
1.655
2.051
2.384
2.825
(iii) L- glutamic acid in 2 M aqueous KCl solution
0.0092
0.0184
0.0277
0.0369
0.0462
0.0555
0.169
0.237
0.314
0.392
0.547
0.704
0.068
0.137
0.223
0.301
0.414
0.587
0.06
0.136
0.223
0.300
0.423
0.536
0.068
0.136
0.231
0.308
0.431
0.585
0.093
0.194
0.281
0.407
0.530
0.643
0.086
0.203
0.339
0.465
0.627
0.789
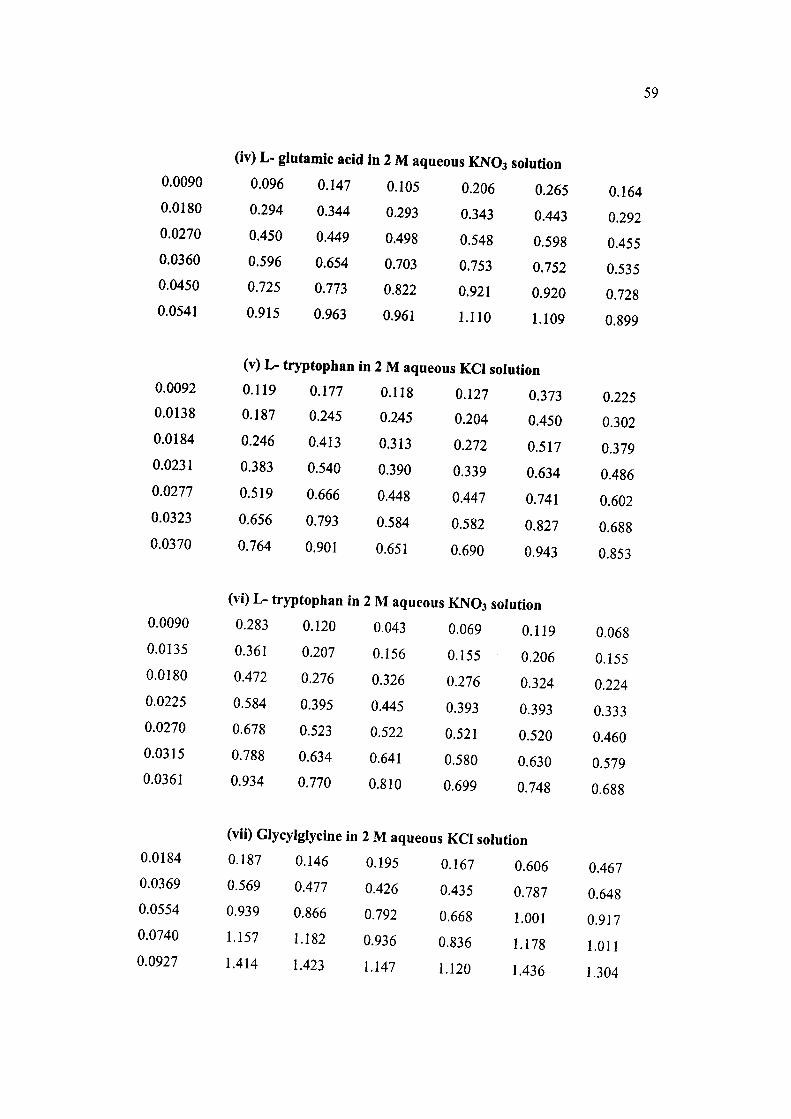
59
(iv) L- glutamic acid in 2 M aqueous KNO3 solution 0.0090
0.0180
0.0270
0.0360
0.0450
0.0541
0.096
0.294
0.450
0.596
0.725
0.915
0.147
0.344
0.449
0.654
0.773
0.963
0.105
0.293
0.498
0.703
0.822
0.961
0.206
0.343
0.548
0.753
0.921
1.110
0.265
0.443
0.598
0.752
0.920
1.109
0.164
0.292
0.455
0.535
0.728
0.899
(v) L- tryptophan in 2 M aqueous KCl solution 0.0092
0.0138
0.0184
0.0231
0.0277
0.0323
0.0370
0.119
0.187
0.246
0.383
0.519
0.656
0.764
0.177
0.245
0.413
0.540
0.666
0.793
0.901
0.118
0.245
0.313
0.390
0.448
0.584
0.651
0.127
0.204
0.272
0.339
0.447
0.582
0.690
0.373
0.450
0.517
0.634
0.741
0.827
0.943
0.225
0.302
0.379
0.486
0.602
0.688
0.853
(vi) L- tryptophan in 2 M aqueous KNO3 solution 0.0090
0.0135
0.0180
0.0225
0.0270
0.0315
0.0361
0.283
0.361
0.472
0.584
0.678
0.788
0.934
0.120
0.207
0.276
0.395
0.523
0.634
0.770
0.043
0.156
0.326
0.445
0.522
0.641
0.810
0.069
0.155
0.276
0.393
0.521
0.580
0.699
0.119
0.206
0.324
0.393
0.520
0.630
0.748
0.068
0.155
0.224
0.333
0.460
0.579
0.688
(vii) Glycylglycine in 2 M aqueous KCl solution 0.0184
0.0369
0.0554
0.0740
0.0927
0.187
0.569
0.939
1.157
1.414
0.146
0.477
0.866
1.182
1.423
0.195
0.426
0.792
0.936
1.147
0.167
0.435
0.668
0.836
1.120
0.606
0.787
1.001
1.178
1.436
0.467
0.648
0.917
1.011
1.304
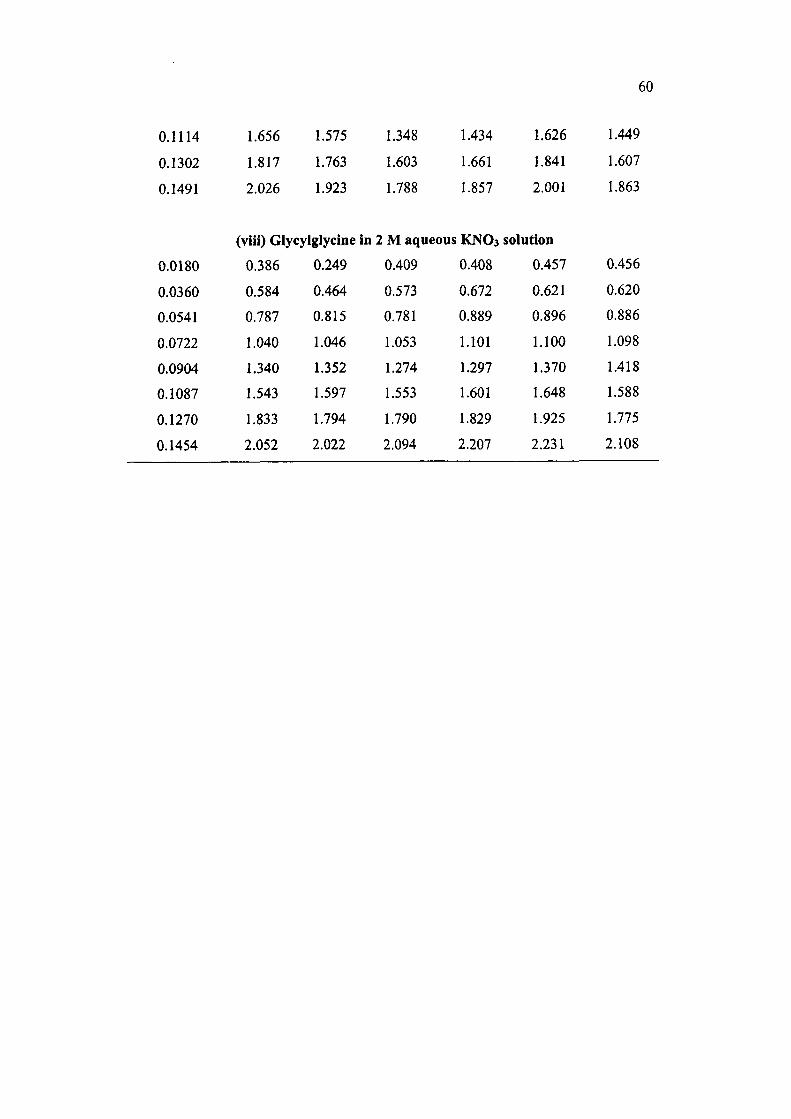
60
0.1114 1.656 1.575 1.348 1.434 1.626 1.449
0.1302 1.817 1.763 1.603 1.661 1.841 1.607
0.1491 2.026 1.923 1.788 1.857 2.001 1.863
(viii) Glycylglycine in 2 M aqueous KNO3 solution
0.0180
0.0360
0.0541
0.0722
0.0904
0.1087
0.1270
0.1454
0.386
0.584
0.787
1.040
1.340
1.543
1.833
2.052
0.249
0.464
0.815
1.046
1.352
1.597
1.794
2.022
0.409
0.573
0.781
1.053
1.274
1.553
1.790
2.094
0.408
0.672
0.889
1.101
1.297
1.601
1.829
2.207
0.457
0.621
0.896
1.100
1.370
1.648
1.925
2.231
0.456
0.620
0.886
1.098
1.418
1.588
1.775
2.108

61
1.2
s
X
<1
• 298.15 K • 313.15 K
0.03 0.06 0.09 0.12 0.15 0.18 0.21 0.24 m / molkg"'
Fig 1.25 Plot of change in isentropic compressibility versus molal concentration
of L- histidine in 2 M aqueous KCl solution.
1.4
o X
• 298.15 K • 313.15 K
Fig 1.26
0.03 0.06 0.09 0.12 0.15 0.18 0.21 0.24 m / molkg"'
Plot of change in isentropic compressibility versus molal
concentration of L- histidine in 2 M aqueous KNO3 solution.

62
X
0.30
0.25-
0.20-
0.15-
0.10-
m / molkg''
• 298.15 K • 313.15 K
0.01 0.02 0.03 0.04 0.05 0.06
Fig 1.27 Plot of change in isentropic compressibility versus molal concentration
of L- glutamic acid in 2 M aqueous KCl solution.
6
us <
298.15 K 313.15K
0.01 0.02 0.03 0.04 m / molkg'
0.05
Fig 1.28 Plot of change in isentropic compressibility versus molal concentration
of L- glutamic acid in 2 M aqueous KNO3 solution.
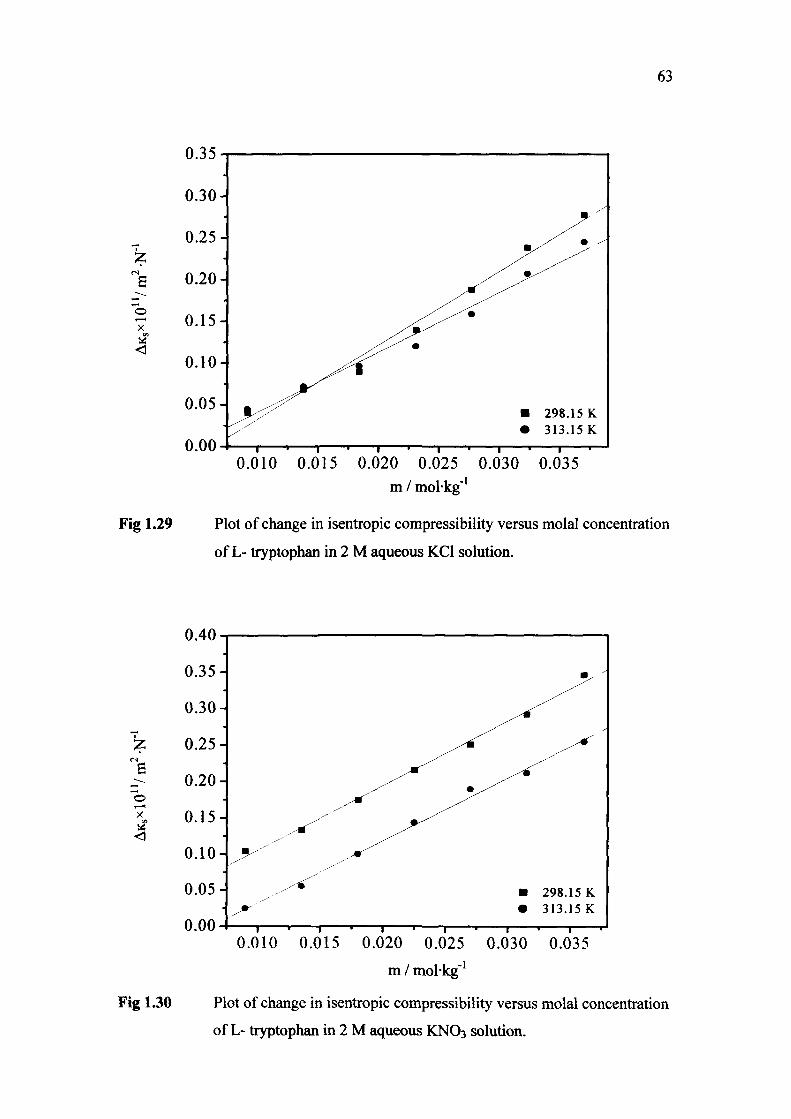
63
X
<
0.30-
0.25-
0.20-
0.15-
0.10-
0.05-
0.00 J J^^ ' 1 ' 1 —
.y^^^^^ •
— 1 — 1 — 1 1 —
^m
—,
m X * ^
•-^""^
• 298.15 K • 313.15 K
1 ' 1 ' —
0.010 0.015 0.020 0.025 0.030 0.035 m / molkg''
Fig 1.29 Plot of change in isentropic compressibility versus molal concentration
of L- tryptophan in 2 M aqueous KCl solution.
0.40
"b X
<3
0.35-
0.30-
• 298.15 K • 313.15 K
Fig 1.30
0.010 0.015 0.020 0.025 0.030 0.035
m / mol-kg"'
Plot of change in isentropic compressibility versus molal concentration
of L- tryptophan in 2 M aqueous KNO3 solution.

64
e "o
X Vi
<
Fig 1.31
0.9
0.8
0.7
0.6
0.5
0.4
0.3
0.2
0.1
0.0 • ^ '
298.15 K 313.15K
0.02 0.04 0.06 0.08 0.10 0.12 0.14 0.16 m / molkg*
Plot of change in isentropic compressibility versus molal concentration
of Glycylglycine in 2 M aqueous KCl solution.
s
Fig 1.32
• 298.15 K • 313.15 K
0.02 0.04 0.06 0.08 0.10 0.12 0.14
m / molkg"'
Plot of change in isentropic compressibility versus molal concentration
of Glycylglycine in 2 M aqueous KNO3 solution.

65
3.0-
2.5-
2.0-
1.5-
1.0-
0.5-
0.0 J
y"^ 1 1 1 1 1 1 r-—
/ / ^
• 298.15 K • 313.15K
Fig 1.33
0.03 0.06 0.09 0.12 0.15 0.18 0.21 0.24 m / molkg"'
Plot of relative change in isentropic compressibility versus molal
concentration of L- histidine in 2 M aqueous KCl solution.
3.5
X o
hi <
298.15 K 313.15 K
Fig 1.34
0.03 0.06 0.09 0.12 0.15 0.18 0.21 0.24
m / molkg'^
Plot of relative change in isentropic compressibility versus molal
concentration of L- histidine in 2 M aqueous KNO3 solution.

66
o X o
Fig 135
0.7-
0.6-
0.5-
0.4-
0.3-
0.2-
0.1-
0.0-
0.1 J
, / • '
1 1
^ "
1
^x-^B
• • » 1
m ^
^ m
1
• .
^ ^ * , /
^ ^
• 298.15 K • 313.15K
1 1 i
0.01 0.02 0.05 0.06 0.03 0.04
m / mol-kg"'
Plot of relative change in isentropic compressibility versus molal
concentration of L- glutamic acid in 2 M aqueous KCl solution.
o X o
.
1.0-
0.8-
0.6-
0.4-
0.2-
0.0- 1 — •••-!-
y''^
y ^ y ^
• 298.15 K • 313.15K
1 1 1 1 1 '
0.01 0.02 0.05
Fig 1.36
0.03 0.04
m / molkg''
Plot of relative change in isentropic compressibility versus molal
concentration of L- glutamic acid in 2 M aqueous KNO3 solution.
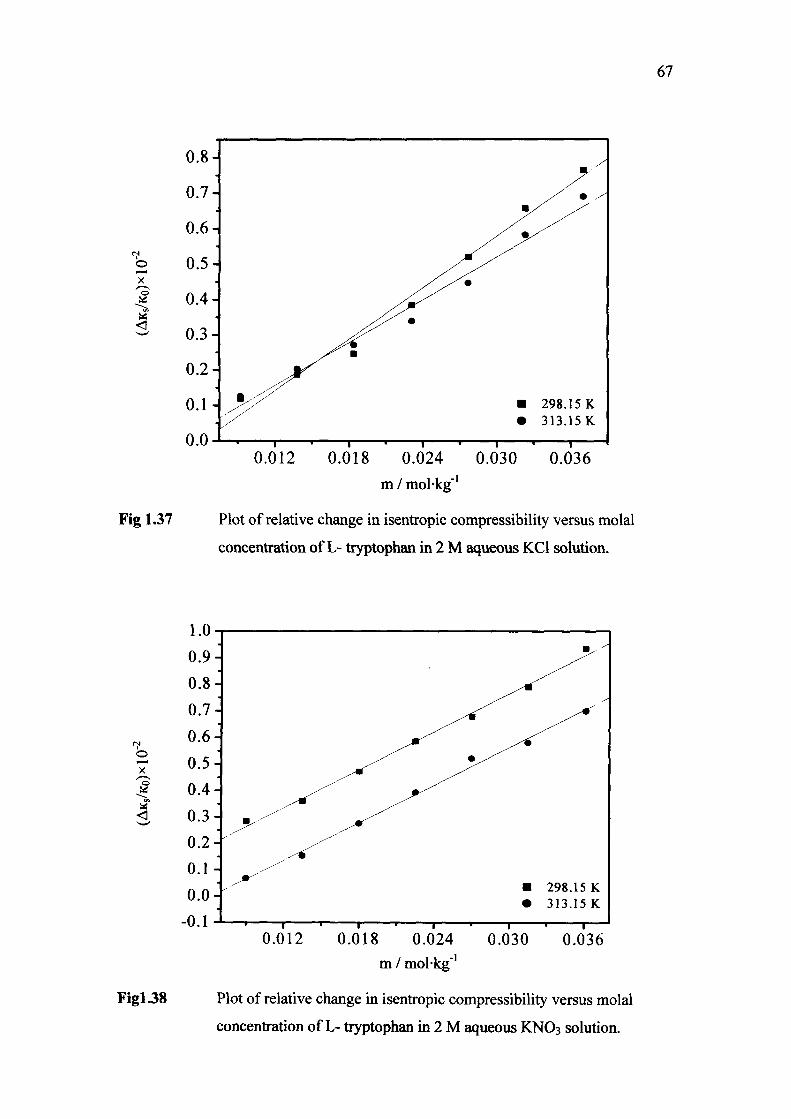
67
b
Fig 1.37
0.8-
0.7-
0.6-
0.5-
0.4-
0.3-
0.2-
0.1-
0.0 J
K^-y
'—' 1 '
y ^ •
' 1
^ •
•• 1
/ ^
y
/ / %X^^
• 298.15 K • 313.15K
— I 1 1 1
0.012 0.018 0.024 0.030 0.036
m / mol-kg"'
Plot of relative change in isentropic compressibility versus molal
concentration of L- tryptophan in 2 M aqueous KCl solution.
1.0
o X
? <1
Figl.38
298.15 K 313.15K
0.012 0.018 0.024
m / molkg"' 0.030 0.036
Plot of relative change in isentropic compressibility versus molal
concentration of L- tryptophan in 2 M aqueous KNO3 solution.
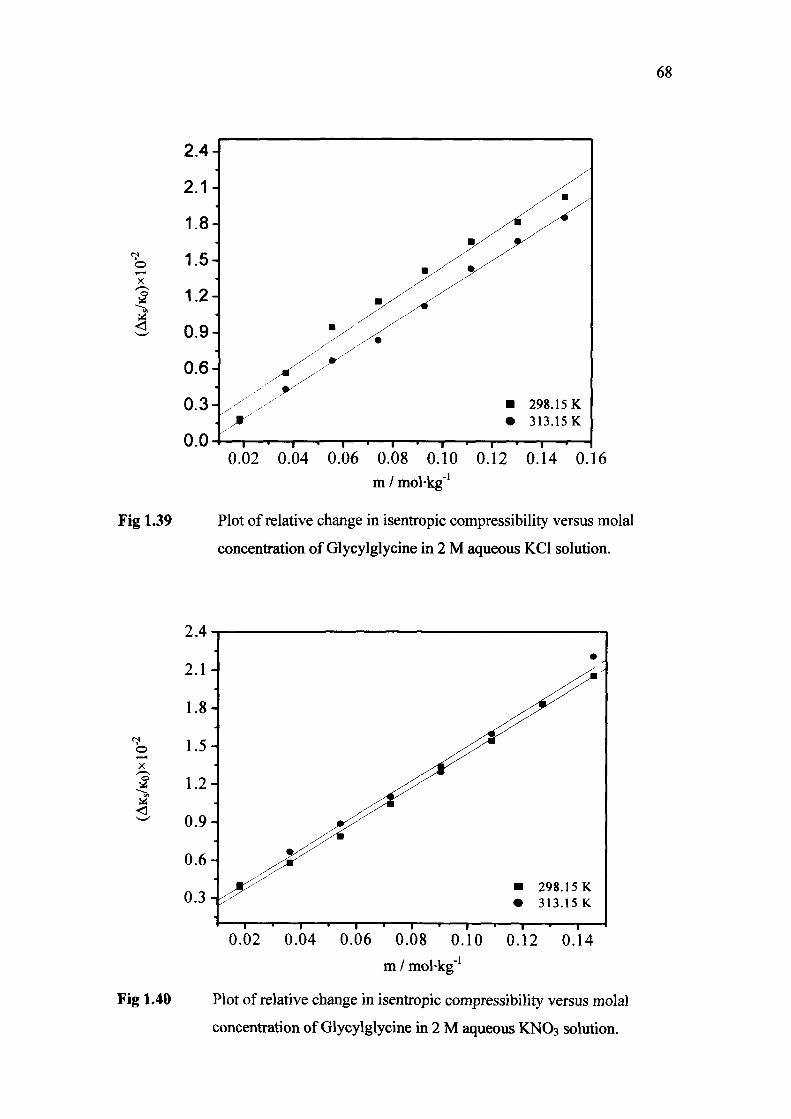
68
o
?
2.4-
2.1-
1.8-
1.5-
1.2-
0.9-
0.6-
0.3-
o.oJ
y #^ X y-^
X ^—1—'—1
w y'^
yy'
— , — 1 —
my^
^ ^
my'
My^
• /
y^m -
• 298.15 K • 313.15 K
1 ' 1 •
Fig 1.39
0.02 0.04 0.06 0.08 0.10 0.12 0.14 0.16 m / molkg"'
Plot of relative change in isentropic compressibility versus molal
concentration of Glycylglycine in 2 M aqueous KCl solution.
2.4
2 .1 -
N
O
X
<J
1.8
1.5
1.2
0.9
0.6-
0.3
Fig 1.40
0.02 0.04 0.06 0.08 0.10 0.12 0.14
m / mol-kg"'
Plot of relative change in isentropic compressibility versus molal
concentration of Glycylglycine in 2 M aqueous KNO3 solution.
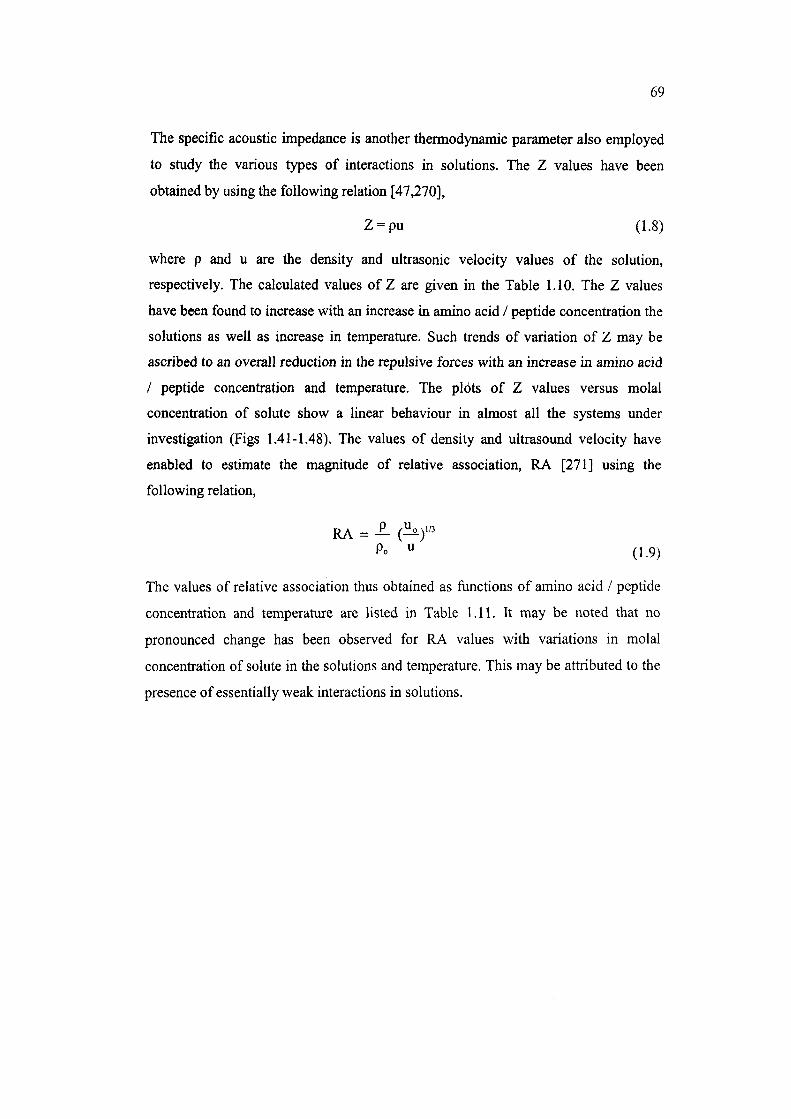
69
The specific acoustic impedance is another thermodynamic parameter also employed
to study the various types of interactions in solutions. The Z values have been
obtained by using the following relation [47,270],
Z = pu (1.8)
where p and u are the density and ultrasonic velocity values of the solution,
respectively. The calculated values of Z are given in the Table 1.10. The Z values
have been found to increase with an increase in amino acid / peptide concentration the
solutions as well as increase in temperature. Such trends of variation of Z may be
ascribed to an overall reduction in the repulsive forces with an increase in amino acid
/ peptide concentration and temperature. The plots of Z values versus molal
concentration of solute show a linear behaviour in almost all the systems under
investigation (Figs 1.41-1.48). The values of density and ultrasound velocity have
enabled to estimate the magnitude of relative association, RA [271] using the
following relation,
RA = A (^)"3
Po " (1.9)
The values of relative association thus obtained as functions of amino acid / peptide
concentration and temperature are listed in Table 1.11. It may be noted that no
pronounced change has been observed for RA values with variations in molal
concentration of solute in the solutions and temperature. This may be attributed to the
presence of essentially weak interactions in solutions.

70
TABLE 1.10 Specific acoustic impedance values (Z xlO'Vkg-m'^s'') as
functions of amino acid / peptide molal concentration and temperature
ra/
mol-kg''
0.0000
0.0277
0.0555
0.0836
0.1117
0.1400
0.1686
0.1974
0.2263
0.0000
0.0270
0.0541
0.0815
0.1090
0.1397
0.1645
0.1926
0.2207
T/K
298.15
(i)L.
1732.5
1736.5
1740.3
1744.6
1749.0
1754.1
1757.1
1761.6
1765.9
303.15
• histidine
1737.5
1742.7
1746.4
1750.7
1755.4
1760.3
1764.1
1768.3
1773.0
(ii) L-histidine in
1738.1
1743.5
1747.9
1752.8
1756.1
1759.9
1765.1
1768.9
1774.3
1743.1
1748.0
1752.3
1756.6
1760.6
1763.9
1769.4
1772.9
1777.8
308.15 313.15 318.15
in 2 M aqueous KCI solution
1742.4
1746.3
1751.0
1755.7
1760.3
1764.6
1768.2
1772.0
1776.3
2 M aqueous
1745.5
1751.3
1755.2
1759.3
1763.3
1766.6
1771.8
1775.3
1780.7
1745.2
1749.5
1753.4
1758.1
1762.1
1766.1
1770.1
1772.9
1777.6
1744.6
1750.5
1754.7
1758.5
1762.5
1766.8
1771.3
1774.5
1778.3
K N O 3 solution
1746.4
1752.1
1756.2
1760.3
1764.0
1767.5
1772.6
1776.1
1791.6
1746.5
1752.2
1755.9
1759.6
1762.9
1766.7
1771.8
1775.3
1780.4
323.15
1745.4
1750.0
1753.7
1758.0
1762.4
1767.0
1770.9
1774.6
1778.4
1746.5
1751.3
1755.2
1758.4
1762.1
1765.2
1770.1
1773.9
1779.3
(iii) L- glutamic acid in 2 M aqueous KCI solution
0.0000 1732.5 1737.5 1742.4 1745.2 1744.6 1745.4
0.0092 1734.1 1738.3 1743.0 1746.0 1745.6 1746.5
0.0184 1734.9 1739.1 1743.9 1746.7 1746.7 1747.7
0.0277 1735.8 1740.1 1745.0 1748.0 1747.8 1749.2
0.0369 1736.7 1741.0 1745.9 1748.9 1749.2 1750.5
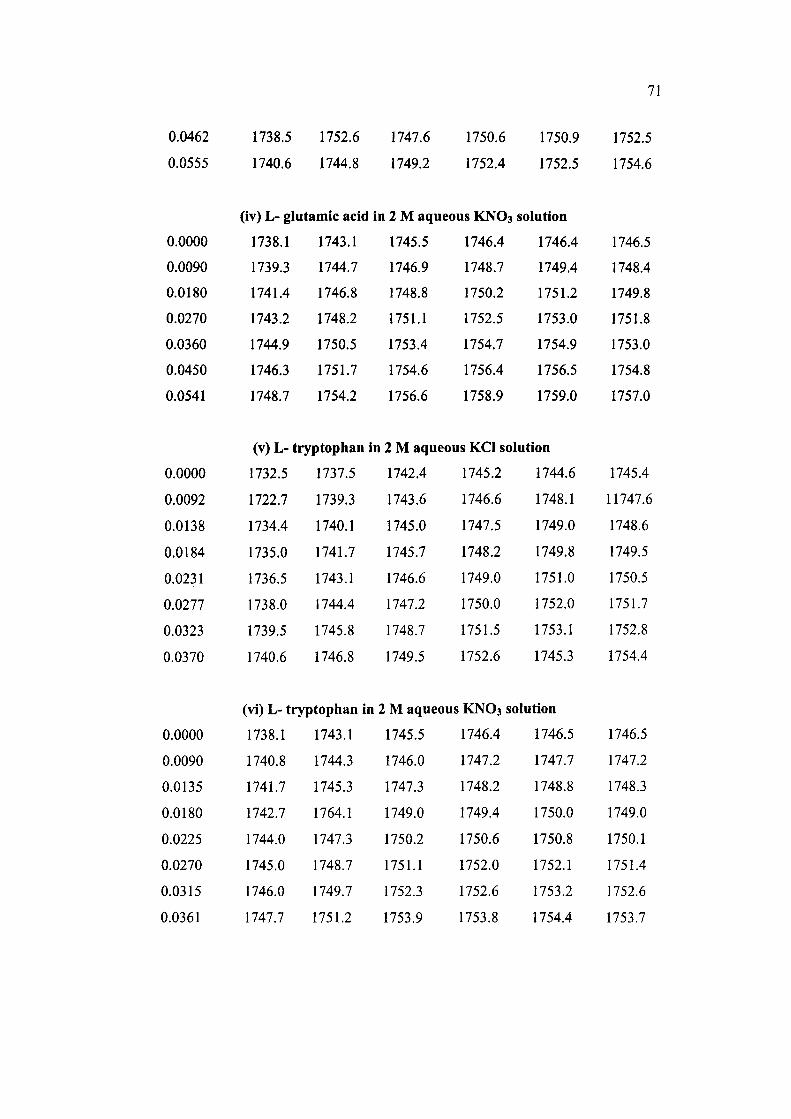
71
0.0462
0.0555
1738.5
1740.6
1752.6
1744.8
1747.6
1749.2
1750.6
1752.4
1750.9
1752.5
1752.5
1754.6
(iv) L- glutamic acid in 2 M aqueous KNO3 solution
0.0000
0.0090
0.0180
0.0270
0.0360
0.0450
0.0541
0.0000
0.0092
0.0138
0.0184
0.0231
0.0277
0.0323
0.0370
1738.1
1739.3
1741.4
1743.2
1744.9
1746.3
1748.7
1743.1
1744.7
1746.8
1748.2
1750.5
1751.7
1754.2
(v) L- tryptopiian in
1732.5
1722.7
1734.4
1735.0
1736.5
1738.0
1739.5
1740.6
1737.5
1739.3
1740.1
1741.7
1743.1
1744.4
1745.8
1746.8
1745.5
1746.9
1748.8
1751.1
1753.4
1754.6
1756.6
1746.4
1748.7
1750.2
1752.5
1754.7
1756.4
1758.9
1746.4
1749.4
1751.2
1753.0
1754.9
1756.5
1759.0
12 M aqueous KCl solution
1742.4
1743.6
1745.0
1745.7
1746.6
1747.2
1748.7
1749.5
1745.2
1746.6
1747.5
1748.2
1749.0
1750.0
1751.5
1752.6
1744.6
1748.1
1749.0
1749.8
1751.0
1752.0
1753.1
1745.3
1746.5
1748.4
1749.8
1751.8
1753.0
1754.8
1757.0
1745.4
11747.6
1748.6
1749.5
1750.5
1751.7
1752.8
1754.4
(vi) L- tryptophan in 2 M aqueous KNO3 solution
0.0000
0.0090
0.0135
0.0180
0.0225
0.0270
0.0315
0.0361
1738.1
1740.8
1741.7
1742.7
1744.0
1745.0
1746.0
1747.7
1743.1
1744.3
1745.3
1764.1
1747.3
1748.7
1749.7
1751.2
1745.5
1746.0
1747.3
1749.0
1750.2
1751.1
1752.3
1753.9
1746.4
1747.2
1748.2
1749.4
1750.6
1752.0
1752.6
1753.8
1746.5
1747.7
1748.8
1750.0
1750.8
1752.1
1753.2
1754.4
1746.5
1747.2
1748.3
1749.0
1750.1
1751.4
1752.6
1753.7
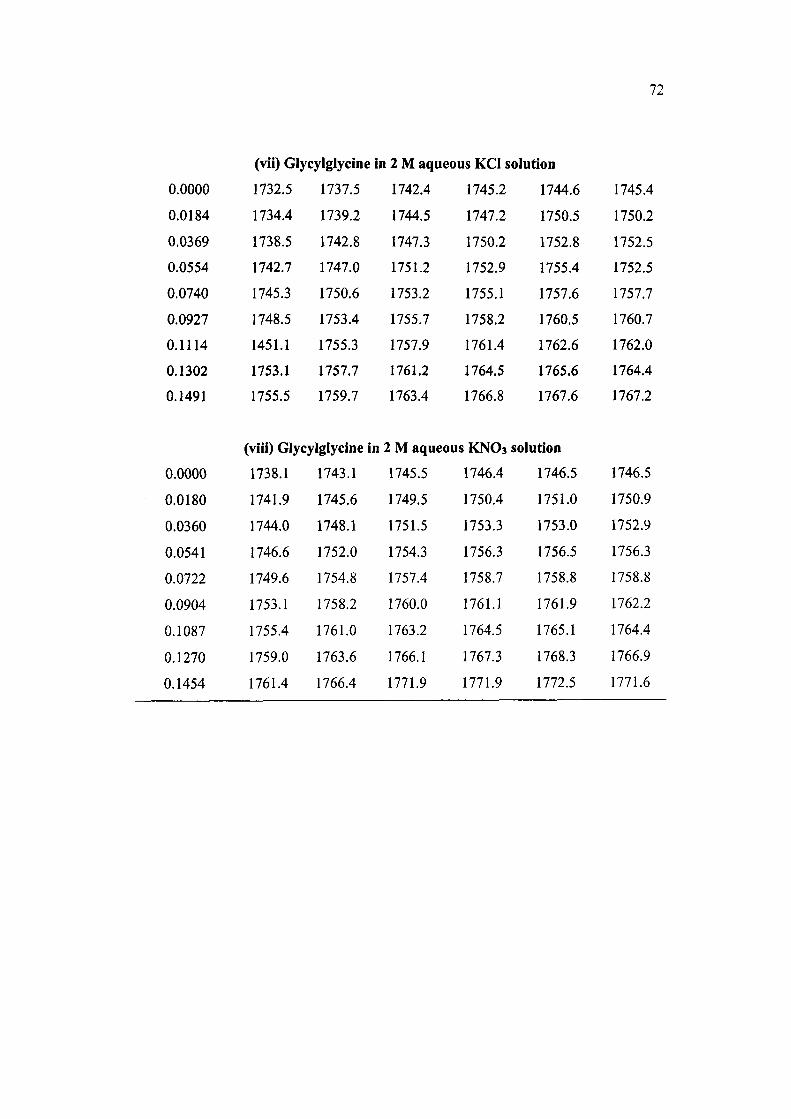
72
0.0000
0.0184
0.0369
0.0554
0.0740
0.0927
0.1114
0.1302
0.1491
(vii) Giycyiglycine
1732.5
1734.4
1738.5
1742.7
1745.3
1748.5
1451.1
1753.1
1755.5
1737.5
1739.2
1742.8
1747.0
1750.6
1753.4
1755.3
1757.7
1759.7
in 2 M aqueous KCl solution
1742.4
1744.5
1747.3
1751.2
1753.2
1755.7
1757.9
1761.2
1763.4
1745.2
1747.2
1750.2
1752.9
1755.1
1758.2
1761.4
1764.5
1766.8
1744.6
1750.5
1752.8
1755.4
1757.6
1760.5
1762.6
1765.6
1767.6
1745.4
1750.2
1752.5
1752.5
1757.7
1760.7
1762.0
1764.4
1767.2
(viii) Giycyiglycine in 2 M aqueous KNO3 solution
0.0000
0.0180
0.0360
0.0541
0.0722
0.0904
0.1087
0.1270
0.1454
1738.1
1741.9
1744.0
1746.6
1749.6
1753.1
1755.4
1759.0
1761.4
1743.1
1745.6
1748.1
1752.0
1754.8
1758.2
1761.0
1763.6
1766.4
1745.5
1749.5
1751.5
1754.3
1757.4
1760.0
1763.2
1766.1
1771.9
1746.4
1750.4
1753.3
1756.3
1758.7
1761.1
1764.5
1767.3
1771.9
1746.5
1751.0
1753.0
1756.5
1758.8
1761.9
1765.1
1768.3
1772.5
1746.5
1750.9
1752.9
1756.3
1758.8
1762.2
1764.4
1766.9
1771.6
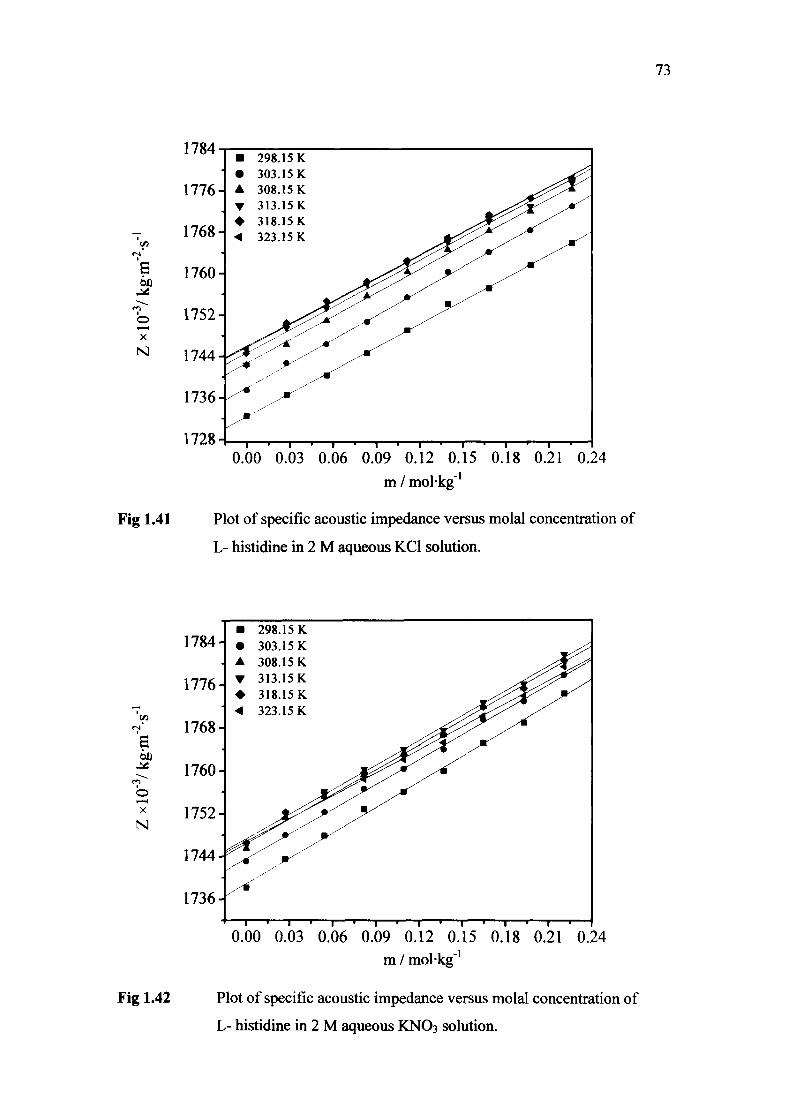
73
00
I
o X
N
Fig 1.41
1728-1 0.00 0.03 0.06 0.09 0.12 0.15 0.18 0.21 0.24
-1 m / mol-kg"
Plot of specific acoustic impedance versus molal concentration of
L- histidine in 2 M aqueous KCl solution.
o X
N
Fig 1.42
1784-
1776-
1768-
1760-
1752-
1744-
1736-
• • • • • <
^
^
298.15 K 303.15 K ^ ^
308.15 K ,y^;^^^^^ 313.15K / - ^ ^ ^ ^ " ^ ^ 318.15 K w:;^^^^^^^ 323.15 K z:::;^^^^^^^!^'^^
^ ^ ^ ^ \ ^
M ^ ^ ^
^^^^X^^ "X^^^
— I T 1 1 1 1 1 1 1 1 1 1 1 1 1
0.00 0.03 0.06 0.09 0.12 0.15 0.18 0.21 0.24 m / mol-kg"'
Plot of specific acoustic impedance versus molal concentration of
L- histidine in 2 M aqueous KNO3 solution.
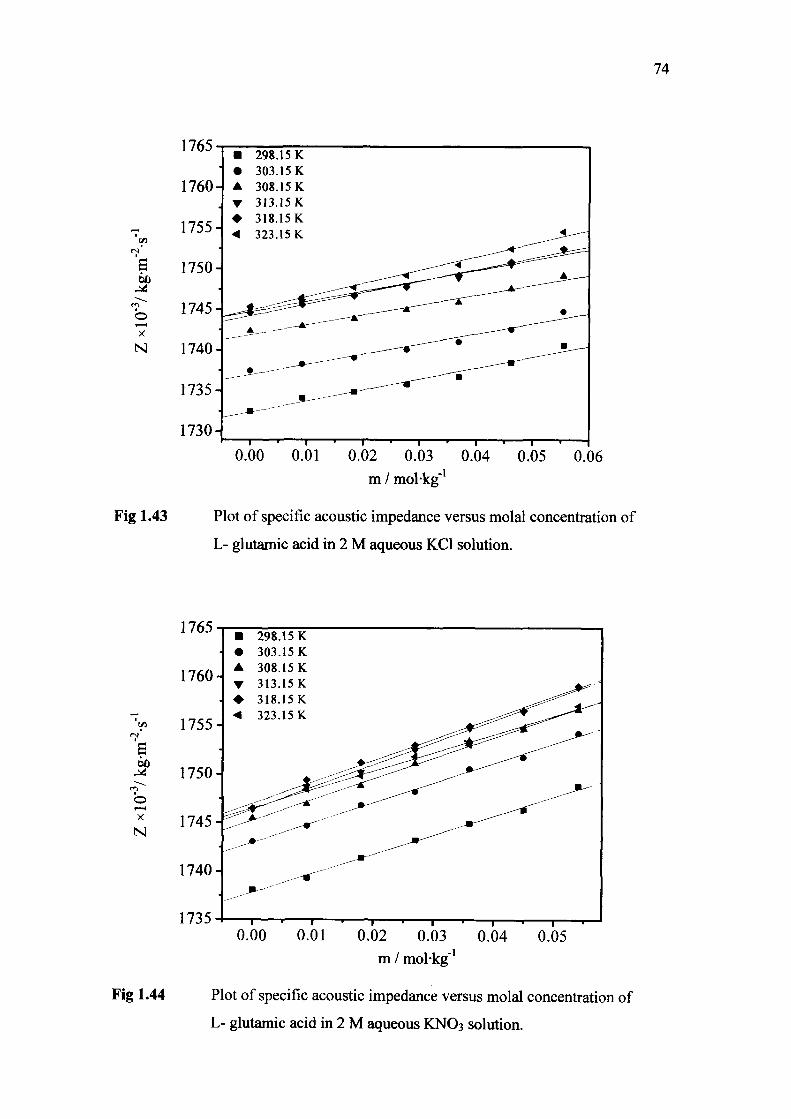
74
60
o X
N
Fig 1.43
1730-
0.00 0.01 0.02 0.03 0.04 -1
0.05 0.06 m / molkg"
Plot of specific acoustic impedance versus molal concentration of
L- glutamic acid in 2 M aqueous KCl solution.
60
X
N
Fig 1.44
1765
1760
• 298.15 K • 303.15 K A 308.15 K • 313.15K
0.00 0.01 0.02 0.03 0.04 m / molkg"'
0.05
Plot of specific acoustic impedance versus molal concentration of
L- glutamic acid in 2 M aqueous KNO3 solution.

75
M
X
N
Fig 1.45
1760-
1755-
1730-
• 298.15 K • 303.15 K A 308.15 K T 313.15K
0.000 0.006 0.012 0.018 0.024 0.030 0.036 m / mol-kg"*
Plot of specific acoustic impedance versus molal concentration of
L- tryptophan in 2 M aqueous KCl solution.
60
X
N
Fig 1.46
1760
1755-
1750-
2 1745
1740-
1735
298.15 K 303.15 K 308.15 K 313.15K
0.000 0.006 0.012 0.018 0.024 0.030 0.036 m / mol-kg"'
Plot of specific acoustic impedance versus molal concentration of
L- tryptophan in 2 M aqueous KNO3 solution.
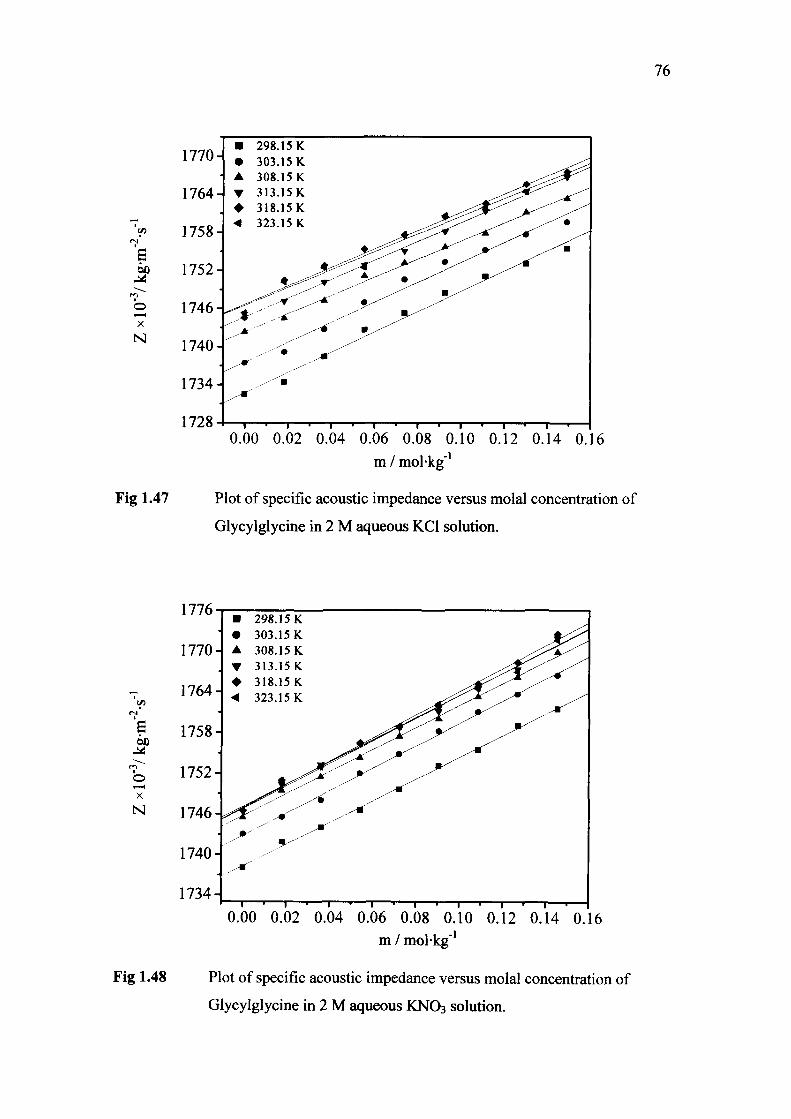
76
o X
N
1770-
1764-
1758-
1752-
1746-
1740-
1734-
1728 J
• • •
•
• <
,-*'
/ - *
' 1
298.15 K 303.15 K 308.15 K 313.15K 318.15K 323.15 K
. '''i
_,-•'-''•
^ ^
I • ( — ' — 1
^"^ ^ - ^ m
^,---^
' 1 •
Fig 1.47
0.00 0.02 0.04 0.06 0.08 0.10 0.12 0.14 0.16 m / mol-kg"'
Plot of specific acoustic impedance versus molal concentration of
Glycylglycine in 2 M aqueous KCl solution.
O X
N
1734-0.00 0.02 0.04 0.06 0.08 0.10 0.12 0.14 0.16
- I
Fig 1.48
m / molkg"
Plot of specific acoustic impedance versus molal concentration of
Glycylglycine in 2 M aqueous KNO3 solution.
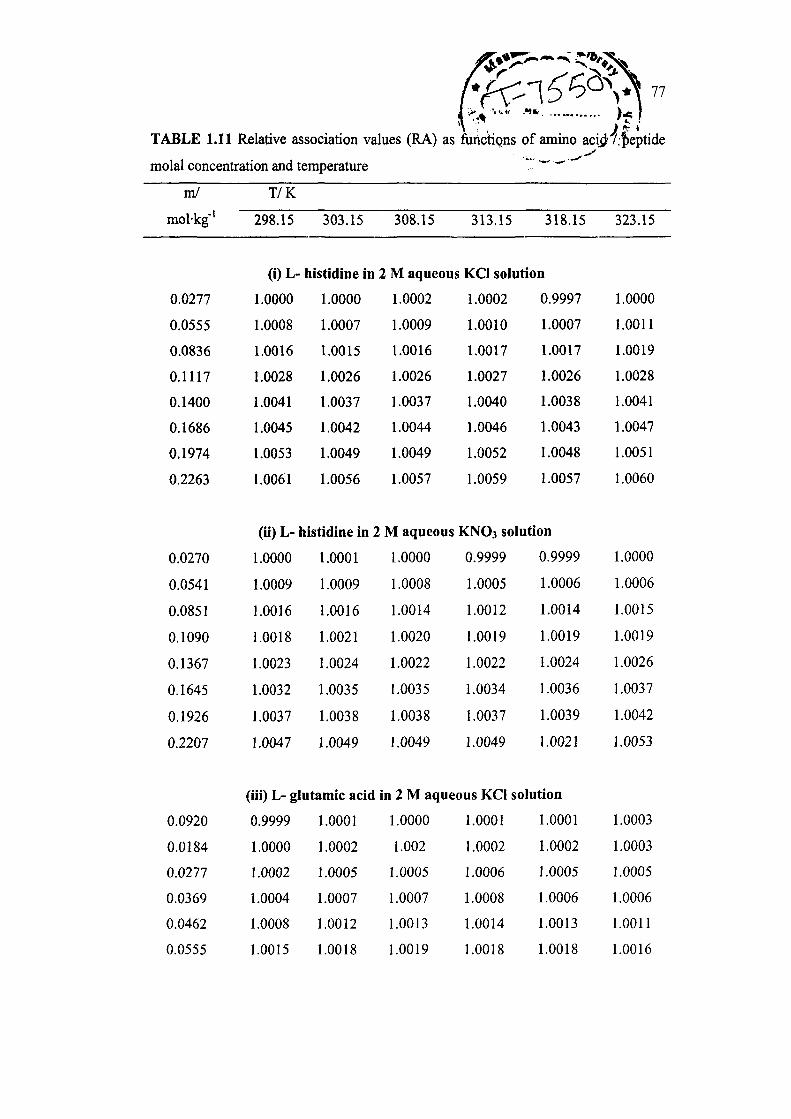
TABLE 1.11 Relative association values (RA) as flirictiQns of amino aciiJ /;f)eptide
molal concentration and temperature " ' " "
m/
mol-kg"'
0.0277
0.0555
0.0836
0.1117
0.1400
0.1686
0.1974
0.2263
T/K
298.15
(i)L-
1.0000
1.0008
1.0016
1.0028
1.0041
1.0045
1.0053
1.0061
303.15
histidine in
1.0000
1.0007
1.0015
1.0026
1.0037
1.0042
1.0049
1.0056
308.15
2 M aqueous
1.0002
1.0009
1.0016
1.0026
1.0037
1.0044
1.0049
1.0057
313.15 318.15
KCl solution
1.0002
1.0010
1.0017
1.0027
1.0040
1.0046
1.0052
1.0059
0.9997
1.0007
1.0017
1.0026
1.0038
1.0043
1.0048
1.0057
323.15
1.0000
1.0011
1.0019
1.0028
1.0041
1.0047
1.0051
1.0060
(ii) L- liistidine in 2 M aqueous KNO3 solution
0.0270
0.0541
0.0851
0.1090
0.1367
0.1645
0.1926
0.2207
1.0000
1.0009
1.0016
1.0018
1.0023
1.0032
1.0037
1.0047
1.0001
1.0009
1.0016
1.0021
1.0024
1.0035
1.0038
1.0049
1.0000
1.0008
1.0014
1.0020
1.0022
1.0035
1.0038
1.0049
0.9999
1.0005
1.0012
1.0019
1.0022
1.0034
1.0037
1.0049
0.9999
1.0006
1.0014
1.0019
1.0024
1.0036
1.0039
1.0021
1.0000
1.0006
1.0015
1.0019
1.0026
1.0037
1.0042
1.0053
(iii) L- glutamic acid in 2 M aqueous KCI solution
1.0000 1.0001 1.0001 1.0003
1.002 1.0002 1.0002 1.0003
1.0005 1.0006 1.0005 1.0005
1.0007 1.0008 1.0006 1.0006
1.0013 1.0014 1.0013 1.0011
1.0019 1.0018 1.0018 1.0016
0.0920
0.0184
0.0277
0.0369
0.0462
0.0555
0.9999
1.0000
1.0002
1.0004
1.0008
1.0015
1.0001
1.0002
1.0005
1.0007
1.0012
1.0018
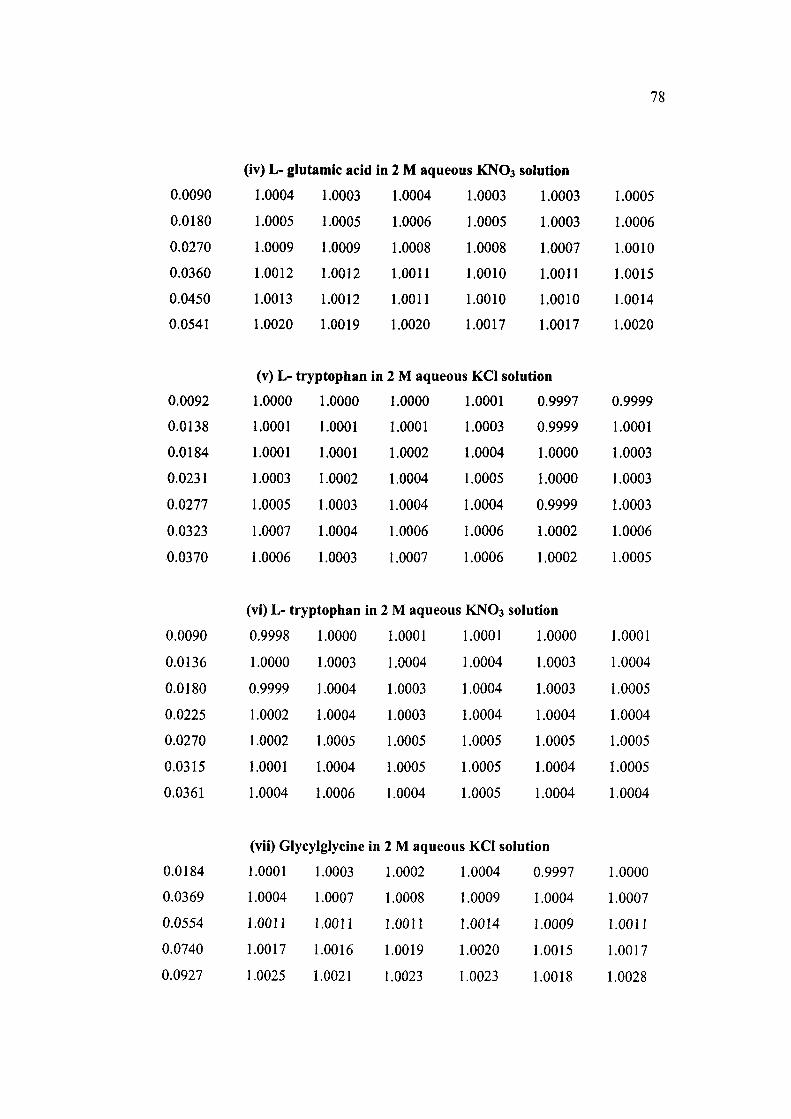
78
0.0090
0.0180
0.0270
0.0360
0.0450
0.0541
(iv) L- glutamic acid
1.0004
1.0005
1.0009
1.0012
1.0013
1.0020
1.0003
1.0005
1.0009
1.0012
1.0012
1.0019
in 2 M aqueous KNO3
1.0004
1.0006
1.0008
1.0011
1.0011
1.0020
1.0003
1.0005
1.0008
1.0010
1.0010
1.0017
solution
1.0003
1.0003
1.0007
1.0011
1.0010
1.0017
1.0005
1.0006
1.0010
1.0015
1.0014
1.0020
(v) L- tryptophan in 2 M aqueous KCl solution
0.0092
0.0138
0.0184
0.0231
0.0277
0.0323
0.0370
1.0000
1.0001
1.0001
1.0003
1.0005
1.0007
1.0006
1.0000
1.0001
1.0001
1.0002
1.0003
1.0004
1.0003
1.0000
1.0001
1.0002
1.0004
1.0004
1.0006
1.0007
1.0001
1.0003
1.0004
1.0005
1.0004
1.0006
1.0006
0.9997
0.9999
1.0000
1.0000
0.9999
1.0002
1.0002
0.9999
1.0001
1.0003
1.0003
1.0003
1.0006
1.0005
(vi) L- tryptophan in 2 M aqueous KNO3 solution
0.0090
0.0136
0.0180
0.0225
0.0270
0.0315
0.0361
0.9998
1.0000
0.9999
1.0002
1.0002
1.0001
1.0004
1.0000
1.0003
1.0004
1.0004
1.0005
1.0004
1.0006
1.0001
1.0004
1.0003
1.0003
1.0005
1.0005
1.0004
1.0001
1.0004
1.0004
1.0004
1.0005
1.0005
1.0005
1.0000
1.0003
1.0003
1.0004
1.0005
1.0004
1.0004
1.0001
1.0004
1.0005
1.0004
1.0005
1.0005
1.0004
(vii) Glycylglycine in 2 M aqueous KCI solution
0.0184 1.0001 1.0003 1.0002 1.0004 0.9997 1.0000
0.0369 1.0004 1.0007 1.0008 1.0009 1.0004 1.0007
0.0554 1.0011 1.0011 1.0011 1.0014 1.0009 1.0011
0.0740 1.0017 1.0016 1.0019 1.0020 1.0015 1.0017
0.0927 1.0025 1.0021 1.0023 1.0023 1.0018 1.0028

79
0.1117
0.1302
0.1491
0.0180
0.0360
0.0541
0.0722
0.0904
0.1087
0.1270
0.1454
1.0027
1.0031
1.0035
1.0025
1.0032
1.0037
(viii) Glycylglycine in
1.0000
1.0002
1.0009
1.0015
1.0021
1.0024
1.0033
1.0034
1.0001
1.0005
1.0010
1.0016
1.0020
1.0024
1.0033
1.0038
1.0026
1.0034
1.0039
1.0023
1.0033
1.0038
1.0020
1.0030
1.0035
2 M aqueous KNO3 solution
0.9999
1.0004
1.0013
1.0017
1.0022
1.0026
1.0033
1.0040
0.9999
1.0002
1.0012
1.0016
1.0021
1.0025
1.0031
1.0041
0.9999
1.0003
1.0013
1.0016
1.0020
1.0025
1.0030
1.0043
1.0025
1.0036
1.0039
0.9999
1.0003
1.0013
1.0016
1.0019
1.0025
1.0032
1.0049

CHAPTER-II
Isothermal Compressibilities, Internal Pressures,
Solubility Parameters and Pseudo-Gruneisen
Parameters of L-histidine-/L-glutamic acid-/L-
tryptophan-/ Glycylglycine - Aqueous KCI/KNO3
Systems

INTRODUCTION
Isothermal compressibility is a sensitive measure of solute-solvent interactions
and can be used to monitor solute hydration in aqueous solutions [63,64]. However, it
is not an easy task to determine isothermal compressibilities directly [64], but through
ultrasonic velocity, density, and heat capacity at constant pressure measurements, it
can be determined indirectly [65,66]. McGowan [68], and Pandey and Vyas [67] have
proposed an indirect method to determine isothermal compressibility value, by using
ultrasonic velocity and density data. Isothermal compressibility has been widely
evaluated by many workers [70-77] using several equations of state for pure liquids.
A careful survey of literature shows that some attempts [60,61,85,272-274] have been
made to evaluate the isothermal compressibility for binary liquid mixtures. Few
authors [65,89,275-277] have determined the isothermal compressibility values of
aqueous solutions of amino acids, peptides and proteins.
Internal pressure has been found to be an important parameter in the theory of
liquid state. Internal pressure, a fundamental property of the liquid state has been
studied initially by Hildebrand et al [278,279] and subsequently by several other
researchers [96,103,280-284]. The internal pressure is an useful parameter for
understanding the structure-making and structure-breaking effect of a non-electrolyte
in a solution [284]. Dunlop et al [285] determined the internal pressure of different
liquid mixtures and compared it with their cohesive energy density values. Stavely et
al. [98] predicted interactions in liquid mixtures by comparing the internal pressure
data to those of pure liquid components. Suryanarayana [282] suggested an indirect
method to evaluating internal pressure using the viscosity, density and ultrasonic
velocity data. This approach has been extensively used for studying the internal
pressure of pure liquids, liquid mixtures, electrolytic and non-electrolytic solutions
[282,284,285-291]. Pandey et al. [104] extended the method for estimating the
internal pressure of ternary liquid systems.
Solubility parameter measures the cohesive energy density of solutions.
Hildebrand and Scott [278,279] introduced this parameter in the theory of solutions.
The solubility parameter is the square root of the cohesive energy density and its
numerical value indicates the solvency behavior of a specific solvent. The solubility
parameter has been also useful for assessing the compressibilities of various

81
substances and it serves as an efficient guide in the selection of proper compounding
ingredients [122], and solvents for a polymeric substance [123] and a paint [124].
Pseudo-gruneisen parameter has been studied by several workers
[125,127,133,135,136,292-294] for investigating the quasi-crystalline behaviour and
internal structure of liquids. A number of authors [25,53,127-136,291,292,295] have
determined the pseudo-gruneisen parameter for aqueous and non-aqueous systems.
In this chapter, the isothermal compressibilities employing the Mc-Gowan's
and Pandey's relations, the internal pressures, the solubility parameters and pseudo-
gruneisen parameters of L-histidine/ L-glutamic acid/ L-tryptophan / glycylglycine in
2 M aqueous KCl / 2 M aqueous KNO3 solution at different temperatures from 298.15
to 323.15 K, have been evaluated using the experimental values of ultrasonic velocity
and density. These computed values have been used to study the interactions
operative in the systems under investigation.
RESULTS AND DISCUSSION
The isothermal compressibility values of L- histidine/ L- glutamic acid/ L-
tryptophan/ glycylglycine + 2 M aqueous KCl / 2 M aqueous KNO3 systems have
been calculated using the experimental density and ultrasonic velocity data. Mc-
Gowan [86] suggested the following relationship between isothennal compressibility
and surface tension (a),
KTa^'^=1.33x 10-* (2.1)
The Auerbach relationship [296] between ultrasonic velocity and surface tension is as
follows:
u = (o/6.4x lO^pf^ (2.2)
By combining the Mc-Gowan [6S] relationship between the isothermal
compressibility and surface tension (equation 2.1), and that of Auerbach relationship
[296] between the ultrasonic velocity and surface tension (equation 2.2) the following
expression is obtained for the computation of experimental isothermal compressibility
values,
-4 ..3/2„^3/2 KTI = 1.33 X 10"7 (6.4 x 10" u '"p) '" (2.3)

82
On replacing the arbitrary constant in denominator of the above expression (2.1), by
temperature term, Pandey et al [25,26] suggested another relation for the evaluation of
isothermal compressibility,
KT7=17.1xlO-'/r' ' 'u^p'"^ (2.4)
The computed isothermal compressibility values KJI and KT2 have been listed in Table
2.1 and 2.2, respectively. The KJI values, plotted as a function of molal concentration
of amino acid / peptide at all temperatures of study, as shown in (Figs 2.1-2.8) exhibit
linear trends of variation for all the studied systems.
A close scrutiny of the Tables 2,1 and 2.2 reveals that the isothermal
compressibility values decrease with an increase in the molal concentration of amino
acid / peptide in the 2 M aqueous KCl and 2 M aqueous KNO3 solutions as well as
with an increase in temperature between 298.15 and 323.15 K. These trends of
variation of isothermal compressibilities with variation in solute concentration and
temperature are similar to the variation of isentropic compressibility values with
successive increase in amino acid and peptide molal concentration and temperature
for these systems studied in the previous chapter. The KTI values of 2 M aqueous KCl
and 2 M aqueous KNO3 solutions are 45.18 and 45.70 (10"'^/ m^-N"'), respectively at
298.15 K. The isothermal compressibility of 2 M aqueous KNO3 is larger than that of
2M aqueous KCl solution at 298.15 K. On addition of 0.0277m L-histidine, 0.0092m
L-glutamic acid, 0.0092m L-tryptophan and 0.0184m glycylglycine in 2 M aqueous
KCl solution at 298.15 K, the KTI values become as 44.96, 45.09, 45.12 and 45.08
(10''^/ m^-N"'), respectively. Similarly on addition of 0.0270m L-histidine, 0.0090m
L-glutamic acid, 0.0090m L-tryptophan and 0.0180m glycylglycine in 2M aqueous
KNO3 solution at 298.15 K, the KH values become as 45.40, 45.64, 45.55 and 45.49
(10"'V m^-N"'), respectively. The decrease in KTI values with an increase in solute
concentration seems to be a result of a corresponding decrease in free volume and the
average kinetic energy of constituents of solutions. A decrease in KJI values with an
increase in temperature may be attributed to the formation of more incompressible
hydrated entities in solutions. Millero et at. [58] have reported similar trends of
variation of isothermal compressibility as functions of solute concentration and
temperature for aqueous NaCl, Na2S04, MgS04, MgCb solutions. On addition of an
amount of an electrolyte in solution, more water molecules may electrostricted,

83
TABLE 2.1 Isothermal compressibility values (KTI^IO'^/ m^-N'') as functions of
amino acid / peptide molal concentration and temperature
in/ TVK
mol-kg' 298.15 303.15 308.15 313.15 318.15 323.15
(i) L- histidine in 2 M aqueous KCI solution
0.0000
0.0277
0.0555
0.0836
0.1170
0.1400
0.1686
0.1974
0.2263
0.0000
0.0270
0.0541
0.0815
0.1090
0.1367
0.1645
0.1926
0.2207
45.18
44.96
44.78
44.58
44.37
44.14
43.96
43.79
43.59
(ii)L-
45.70
45.40
45.19
44.95
44.78
44.59
44.34
44.16
43.91
44.82
44.55
44.37
44.17
43.95
43.73
43.54
43.35
43.13
histidine in
45.33
45.06
44.85
44.65
44.46
44.29
44.03
43.86
43.63
44.48
44.28
44.05
43.82
43.61
43.42
43.26
43.08
42.88
2 M aqueous
45.10
44.79
44.61
44.41
44.22
44.05
43.81
43.64
43.40
44.25
44.02
43.85
43.62
43.44
43.27
43.08
42.96
42.74
44.20
43.89
43.70
43.53
43.35
43.15
42.95
42.80
42.63
KNO3 solution
44.96
44.66
44.46
44.26
44.09
43.92
43.69
43.52
43.27
44.86
44.56
44.39
44.22
44.06
43.87
43.64
43.47
43.25
44.07
43.84
43.67
43.47
43.27
43.07
42.89
42.72
42.55
44.77
44.52
44.33
44.18
44.00
43.86
43.64
43.46
43.21
(iii) L- glutamic acid in 2 M aqueous KCI solution
0.0000 45.18 44.82 44.48 44.25 44.20 44.07
0.0092 45.09 44.78 44.44 44.21 44.15 44.02
0.0184 45.05 44.75 44.40 44.17 44.10 43.96
0.0277 45.01 44.70 44.35 44.12 44.05 43.89
0.0369 44.97 44.65 44.31 44.07 43.98 43.82
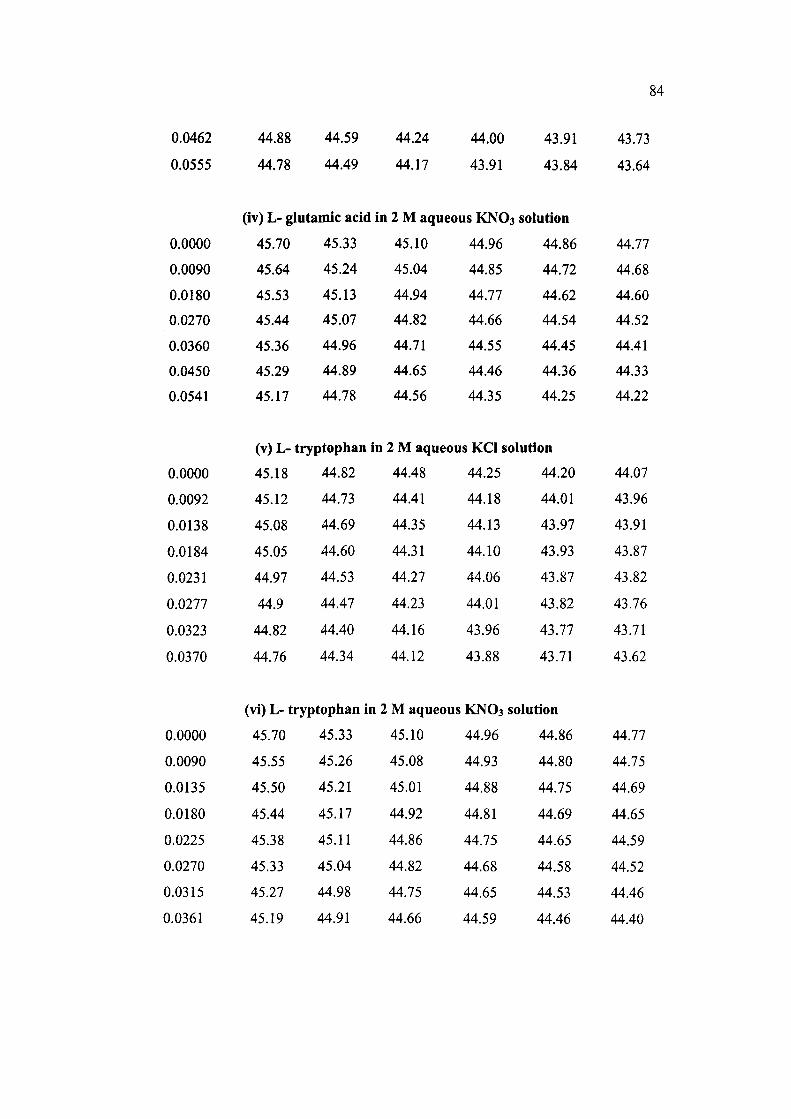
84
0.0462
0.0555
44.88
44.78
44.59
44.49
44.24
44.17
44.00
43.91
43.91
43.84
43.73
43.64
(iv) L- glutamic acid in 2 M aqueous KNO3 solution
0.0000
0.0090
0.0180
0.0270
0.0360
0.0450
0.0541
0.0000
0.0092
0.0138
0.0184
0.0231
0.0277
0.0323
0.0370
0.0000
0.0090
0.0135
0.0180
0.0225
0.0270
0.0315
0.0361
45.70
45.64
45.53
45.44
45.36
45.29
45.17
(v)L-.
45.18
45.12
45.08
45.05
44.97
44.9
44.82
44.76
45.33
45.24
45.13
45.07
44.96
44.89
44.78
45.10
45.04
44.94
44.82
44.71
44.65
44.56
44.96
44.85
44.77
44.66
44.55
44.46
44.35
44.86
44.72
44.62
44.54
44.45
44.36
44.25
tryptophan in 2 M aqueous KCi solution
44.82
44.73
44.69
44.60
44.53
44.47
44.40
44.34
(vi) L- tryptophan in
45.70
45.55
45.50
45.44
45.38
45.33
45.27
45.19
45.33
45.26
45.21
45.17
45.11
45.04
44.98
44.91
44.48
44.41
44.35
44.31
44.27
44.23
44.16
44.12
44.25
44.18
44.13
44.10
44.06
44.01
43.96
43.88
44.20
44.01
43.97
43.93
43.87
43.82
43.77
43.71
2 M aqueous KNO3 solution
45.10
45.08
45.01
44.92
44.86
44.82
44.75
44.66
44.96
44.93
44.88
44.81
44.75
44.68
44.65
44.59
44.86
44.80
44.75
44.69
44.65
44.58
44.53
44.46
44.77
44.68
44.60
44.52
44.41
44.33
44.22
44.07
43.96
43.91
43.87
43.82
43.76
43.71
43.62
44.77
44.75
44.69
44.65
44.59
44.52
44.46
44.40

85
0.0000
0.0184
0.0369
0.0554
0.0740
0.0927
0.1114
0.1302
0.1491
(vii) Glycylglycine in
45.18
45.08
44.87
44.66
44.54
44.39
44.26
44.17
44.05
44.82
44.74
44.56
44.35
44.18
44.04
43.96
43.85
43.76
1 2 M aqueous KCi solution
44.48
44.37
44.24
44.04
43.96
43.84
43.73
43.59
43.49
44.25
44.15
44.01
43.88
43.78
43.63
43.47
43.33
43.23
44.20
43.89
43.79
43.67
43.57
43.43
43.33
43.20
43.11
44.07
43.83
43.73
43.58
43.48
43.36
43.29
43.19
43.05
(viii) Glycylglycine in 2 M aqueous KNO3 solution
0.0000
0.0180
0.0360
0.0541
0.0722
0.0904
0.1087
0.1270
0.1454
45.70
45.49
45.38
45.26
45.11
44.94
44.83
44.66
44.54
45.33
45.19
45.07
44.88
44.74
44.58
44.44
44.32
44.19
45.10
44.88
44.79
44.67
44.52
44.39
44.24
44.10
43.93
44.96
44.75
44.60
44.47
44.36
44.25
44.08
43.95
43.74
44.86
44.62
44.53
44.37
44.26
44.11
43.96
43.81
43.63
44.77
44.53
44.44
44.29
44.17
44.00
43.90
43.79
43.59
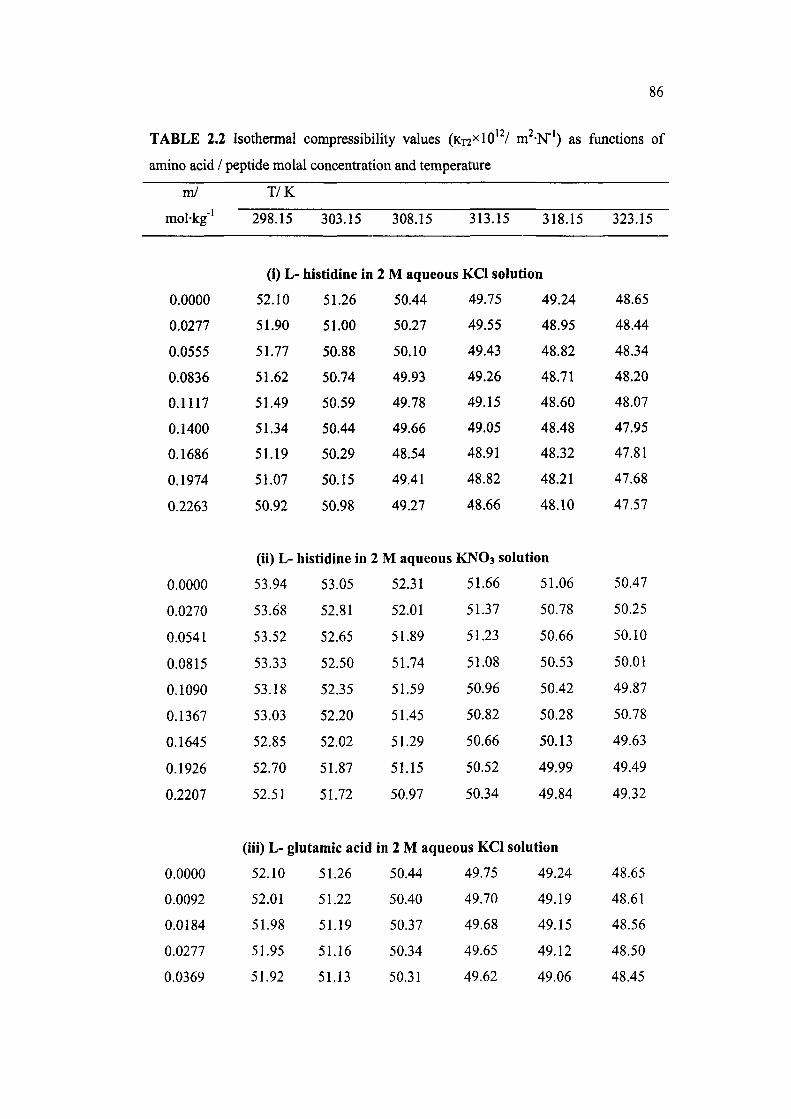
86
TABLE 2.2 Isothermal compressibility values (KT2^10'^/ m -N"') as functions of
amino acid / peptide molal concentration and temperature
m/
mol-kg''
0.0000
0.0277
0.0555
0.0836
0.1117
0.1400
0.1686
0.1974
0.2263
0.0000
0.0270
0.0541
0.0815
0.1090
0.1367
0.1645
0.1926
0.2207
T/K
298.15 303.15 308.15
(i) L- histidine in 2 M aqueous
52.10
51.90
51.77
51.62
51.49
51.34
51.19
51.07
50.92
(u)L-l
53.94
53.68
53.52
53.33
53.18
53.03
52.85
52.70
52.51
51.26
51.00
50.88
50.74
50.59
50.44
50.29
50.15
50.98
liistidine in
53.05
52.81
52.65
52.50
52.35
52.20
52.02
51.87
51.72
50.44
50.27
50.10
49.93
49.78
49.66
48.54
49.41
49.27
2 M aqueous
52.31
52.01
51.89
51.74
51.59
51.45
51.29
51.15
50.97
313.15 318.15
i KCi solution
49.75
49.55
49.43
49.26
49.15
49.05
48.91
48.82
48.66
49.24
48.95
48.82
48.71
48.60
48.48
48.32
48.21
48.10
KNO3 solution
51.66
51.37
51.23
51.08
50.96
50.82
50.66
50.52
50.34
51.06
50.78
50.66
50.53
50.42
50.28
50.13
49.99
49.84
323.15
48.65
48.44
48.34
48.20
48.07
47.95
47.81
47.68
47.57
50.47
50.25
50.10
50.01
49.87
50.78
49.63
49.49
49.32
(iii) L- glutamic acid in 2 M aqueous KCI solution
0.0000 52.10 51.26 50.44 49.75 49.24 48.65
0.0092 52.01 51.22 50.40 49.70 49.19 48.61
0.0184 51.98 51.19 50.37 49.68 49.15 48.56
0.0277 51.95 51.16 50.34 49.65 49.12 48.50
0.0369 51.92 51.13 50.31 49.62 49.06 48.45

87
0.0462
0.0555
51.86
51.80
51.09
51.03
50.27
50.24
49.58
49.52
49.03
48.99
48.39
48.33
(iv) L- glutamic acid in 2 M aqueous KNO3 solution
0.0000
0.0090
0.0180
0.0270
0.0360
0.0450
0.0541
0.0000
0.0092
0.0138
0.0184
0.0231
0.0277
0.0323
0.0370
0.0000
0.0090
0.0135
0.0180
0.0225
0.0270
0.0315
0.0361
53.94
53.90
53.81
53.75
53.68
53.62
53.55
53.05
52.97
52.88
52.85
52.76
52.70
52.63
52.31
52.26
52.17
52.08
51.99
51.94
51.90
51.66
52.56
51.50
51.41
51.33
51.25
51.18
51.06
50.93
50.85
50.79
50.73
50.65
50.58
(v) L- tryptophan in 2 M aqueous KCl solution
52.10
52.03
52.00
51.98
51.92
51.86
51.80
51.75
51.26
51.17
51.14
51.06
51.00
50.95
50.89
50.84
(vi) L- tryptophan in
53.94
53.80
53.76
53.71
53.66
53.61
53.56
53.50
53.05
52.98
52.95
52.91
52.86
52.80
52.76
52.68
50.44
50.38
50.32
50.29
50.26
50.24
50.18
50.15
49.75
49.68
49.65
49.62
49.59
49.54
49.49
49.44
2 M aqueous KNO3 !
52.31
52.28
52.23
52.15
52.09
52.06
52.00
51.92
51.66
51.62
51.59
51.53
51.48
51.42
51.39
51.34
49.24
49.05
49.02
49.00
48.94
48.89
48.86
48.81
solution
51.06
50.99
50.96
50.91
50.88
50.82
50.77
50.71
50.47
50.40
50.34
50.28
50.26
50.17
50.11
48.65
48.54
48.51
48.48
48.43
48.38
48.35
48.28
50.47
50.43
50.40
50.37
50.32
50.27
50.21
50.16

88
(vii) Giycylglycine in 2 M aqueous KCI solution
0.0000
0.0184
0.0369
0.0554
0.0740
0.0927
0.1114
0.1302
0.1491
0.0000
0.0180
0.0360
0.0541
0.0722
0.0904
0.1087
0.1270
0.1454
52.10
52.00
51.83
51.68
51.49
51.50
51.39
51.32
51.24
51.26
51.19
51.05
50.88
50.74
50.65
50.59
50.52
50.46
(viii) Giycylglycine in
53.94
53.75
53.66
53.58
53.48
53.35
53.26
53.14
53.04
53.05
52.92
52.83
52.68
52.58
52.45
52.34
52.27
52.18
50.44
50.35
50.26
50.10
50.05
49.97
49.89
49.79
49.72
49.75
49.67
49.56
49.47
49.41
49.29
49.15
49.08
49.00
49.24
48.95
48.89
48.80
48.74
48.64
48.56
48.49
48.43
2 M aqueous KNO3 solution
52.31
52.10
52.03
51.96
51.84
51.75
51.64
51.54
51.42
51.66
51.46
51.34
51.27
51.18
51.09
50.97
50.88
50.73
51.06
50.83
50.77
50.67
50.59
50.47
50.36
50.24
50.14
48.65
48.43
48.37
48.27
48.21
48.15
48.07
48.03
47.92
50.47
50.25
50.19
50.09
50.01
49.87
49.81
49.74
49.64
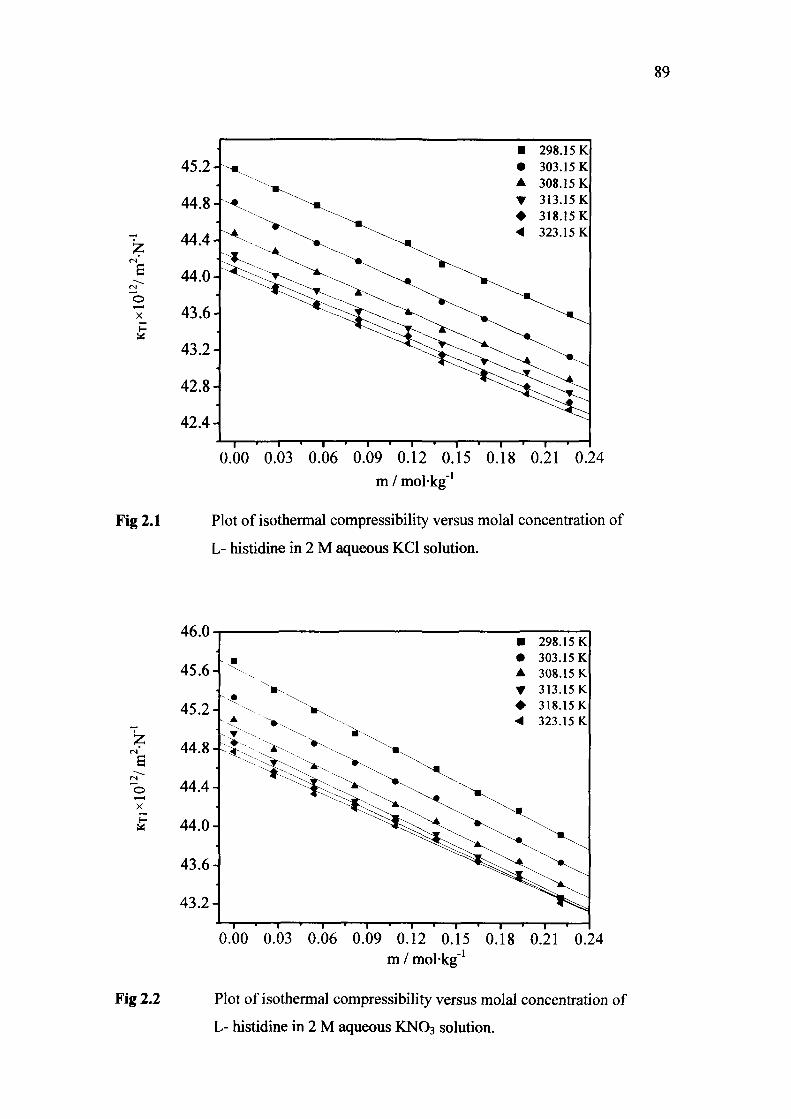
89
B
Fig 2.1
42.8-
42.4-
• 298.15 K • 303.15 K A 308.15 K
0.00 0.03 0.06 0.09 0.12 0.15 0.18 0.21 0.24 m / mol-kg"'
Plot of isothermal compressibility versus molal concentration of
L- histidine in 2 M aqueous KCl solution.
46.0
(N
X H
Fig 2.2
43.2-
0.00 0.03 0.06 0.09 0.12 0.15 0.18 0.21 0.24 m / molkg"'
Plot of isothermal compressibility versus molal concentration of
L- histidine in 2 M aqueous KNO3 solution.

90
"o X
Fig 2.3
46.0
45.6
45.2
44.8
44.4
44.0
43.6-
m / molkg"
• 298.15 K • 303.15 K A 308.15 K • 313.15 K • 318.15 K • 323.15 K
0.00 0.01 0.02 0.03 0.04 0.05 0.06
Plot of isothermal compressibility versus molal concentration of
L- glutamic acid in 2 M aqueous KCl solution.
\ .
\ N
O
X
46.4
46.0
45.6
45.2
44.8
Fig 2.4
44.4-
44.0
298.15 K 303.15 K 308.15 K 313.15K 318.15 K 323.15 K
0.00 0.01 0.02 0.03 0.04 0.05
m / molkg '
Plot of isothermal compressibility versus molal concentration of
L- glutamic acid in 2 M aqueous KNO3 solution.
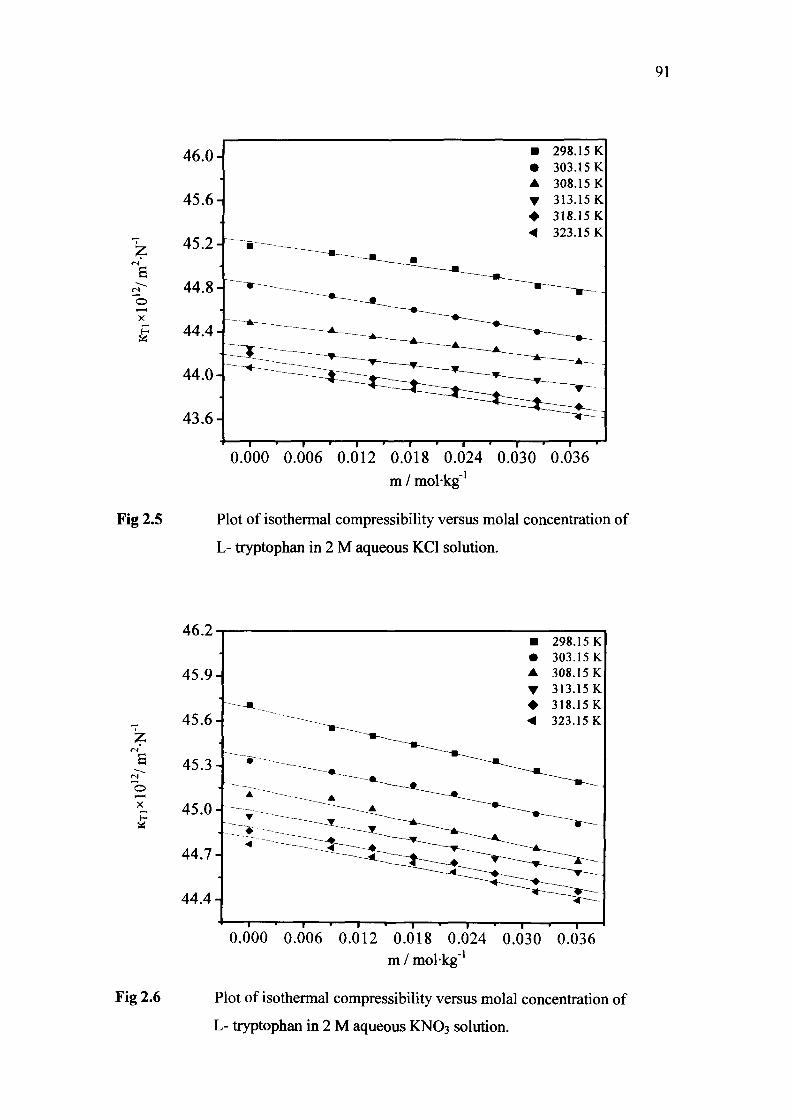
91
o X
Fig 2.5
43.6-
• • • T • <
298.15 K 303.15 K 308.15 K 313.15 K 318.15 K 323.15 K
0.000 0.006 0.012 0.018 0.024 0.030 0.036 m / molkg"*
Plot of isothermal compressibility versus molal concentration of
L- tryptophan in 2 M aqueous KCl solution.
46.2
a "o
X H
Fig 2.6
45.9-
45.6-
45.3-
45.0-
44.7-
44.4-
298.15 K 303.15 K 308.15 K 313.15K 318.15K 323.15 K
0.000 0.006 0.012 0.018 0.024 0.030 0.036 m / molkg"'
Plot of isothermal compressibility versus molal concentration of
L- tryptophan in 2 M aqueous KNO3 solution.

92
B
o X
s
45.2
44.8
44.4
44.0
43.6
Fig 2.7
43.2-
42.8
• 298.15 K • 303.15 K A 308.15 K
0.00 0.02 0.04 0.06 0.08 0.10 0.12 0.14 0.16 m / molkg"'
Plot of isothermal compressibility versus molal concentration of
Glycylglycine in 2 M aqueous KCl solution.
45.9
Fig 2.8
45.6-
4 5 . 3 - " ^
45.0
44.7-
44.4-
44.1-
43.8-
43.5-
• 298.15 K • 303.15 K A 308.15 K • 313.15 K • 318.15 K
0.00 0.02 0.04 0.06 0.08 0.10 0.12 0.14 0.16 m / molkg"'
Plot of isothermal compressibility versus molal concentration of
Glycylglycine in 2 M aqueous KNO3 solution.

93
resulting in the decrease of bulk water amount, causing the decrease in isothermal
compressibility. A number of workers [297-299] have attributed such type of behavior
for isothermal compressibility with variation in temperature to the presence of
structured water aggregations at the given temperature. Thus, a decrease in isothermal
compressibility values with an increase in temperature in all the systems under
investigation may be explained in tenns of the changes occurred in structure of water
clusters around zwitterions and ions (K , CI", NO3") in solutions.
The internal pressure of all the systems under investigation have been
computed using the following relation [60],
Pi= ( T U T / K T O - P (2.5)
where at is the coefficient of thermal expansion (Appendix: Table Al), T is absolute
temperature and P is atmospheric pressure, which is neglected considering the
accuracy of the measurements [86] in the above expression and it may be written as
follows,
Pi = (TaT/KTi) (2.6)
Thermal expansion coefficient values have been computed from the measured values
of density as a function of temperature, employing the following relation [19],
aT=-l/p(ap/5T)p (2.7)
The computed Pi values have been given in the Table 2.3 and the plots of Pj
versus molal concentration of amino acid / peptide are displayed in Figs 2.9-2.16. The
computed values of internal pressure exhibit an iiTegular trend of variation with an
increase in solute concentration. The increase / decrease in Pj values with an increase
in solute concentration may be due to a corresponding increase / decrease in cohesive
forces in all the systems under investigation. The Pi values of 2 M aqueous KCl and 2
M aqueous KNO3 solutions are 2.808 and 3.304 (lOV N-m' ), respectively, at 298.15
K. It has been also observed from data that Pj values of an amino acid / peptide in 2M
aqueous KNO3 solution is larger than that in 2 M aqueous KCl solution at all the
temperatures of study. On addition of 0.0277m L-histidine, 0.0092m L- glutamic acid,
0.0092m L- tryptophan and 0.0184m glycylglycine in 2M aqueous KCl solution at
298.15 K, the Pi values become as 2.813, 2.775, 2.791 and 2.720 (lOV N-m" ),
respectively. Similarly, on addition of 0.0270m L-histidine, 0.0090m L-glutamic acid,

94
TABLE 2.3 Internal pressure values (Pi xlO' / N-m' ) as functions of amino acid /
peptide molal concentration and temperature _ _ _
mol-kg"' 298.15 303.15 308.15 313.15 318.15 323.15
(i) L- histidine in 2 M aqueous KCl solution
0.0000
0.0277
0.0555
0.0836
0.1117
0.1400
0.1686
0.1974
0.2263
2.808
2.813
2.765
2.764
2.850
2.885
2.848
2.963
2.973
2.883
2.892
2.842
2.841
2.931
2.967
2.929
3.048
3.060
2.957
2.963
2.916
2.916
3.008
3.043
3.003
3.125
3.135
3.029
3.035
2.983
2.984
3.076
3.110
3.070
3.191
3.204
3.088
3.100
3.048
3.045
3.139
3.175
3.137
3.262
3.271
3.154
3.161
3.105
3.104
3.202
3.239
3.198
3.328
3.337
(ii) L-histidine in 2 M aqueous KNO3 solution
0.0000
0.0270
0.0541
0.0815
0.1090
0.1367
0.1645
0.1926
0.2207
3.304
3.352
3.428
3.466
3.460
3.431
3.431
3.442
3.443
3.394
3.442
3.520
3.577
3.551
3.520
3.521
3.532
3.531
3.476
3.529
3.606
3.665
3.638
3.606
3.605
3.617
3.617
3.552
3.606
3.687
3.747
3.717
3.685
3.684
3.696
3.696
3.626
3.681
3.762
3.821
3.790
3.758
3.757
3.769
3.767
3.701
3.753
3.837
3.895
3.866
3.829
3.827
3.840
3.840
(iii) L-glutamic acid in 2 M aqueous KCl solution
0.0000 2.808 2.883 2.957 3.029 3.088 3.154
0.0092 2.775 2.846 2.921 2.990 3.049 3.113
0.0184 2.770 2.841 2.926 2.985 3.044 3.109
0.0277 2.751 2.821 2.896 2.965 3.024 3.109
0.0369 2.753 2.823 2.898 2.967 3.027 3.093
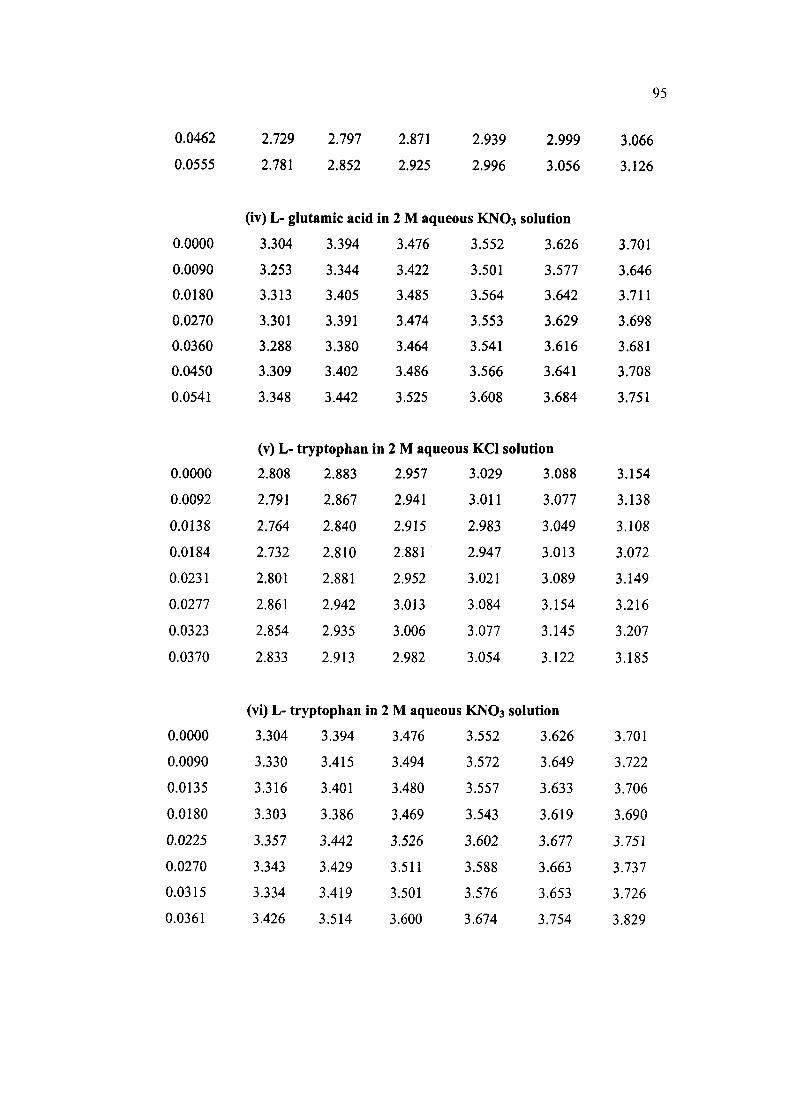
95
0.0462
0.0555
2.129
2.781
2.797
2.852
2.871
2.925
2.939
2.996
2.999
3.056
3.066
3.126
(iv) L- glutamic acid in 2 M aqueous KNO3 solution
3.476
3.422
3.485
3.474
3.464
3.486
3.525
(v) L- tryptophan in 2 M aqueous KCl solution
0.0000
0.0090
0.0180
0.0270
0.0360
0.0450
0.0541
3.304
3.253
3.313
3.301
3.288
3.309
3.348
3.394
3.344
3.405
3.391
3.380
3.402
3.442
3.552
3.501
3.564
3.553
3.541
3.566
3.608
3.626
3.577
3.642
3.629
3.616
3.641
3.684
3.701
3.646
3.711
3.698
3.681
3.708
3.751
0.0000
0.0092
0.0138
0.0184
0.0231
0.0277
0.0323
0.0370
0.0000
0.0090
0.0135
0.0180
0.0225
0.0270
0.0315
0.0361
2.808
2.791
2.764
2.732
2.801
2.861
2.854
2.833
2.883
2.867
2.840
2.810
2.881
2.942
2.935
2.913
(vi) L- tryptophan in
3.304
3.330
3.316
3.303
3.357
3.343
3.334
3.426
3.394
3.415
3.401
3.386
3.442
3.429
3.419
3.514
2.957
2.941
2.915
2.881
2.952
3.013
3.006
2.982
3.029
3.011
2.983
2.947
3.021
3.084
3.077
3.054
2 M aqueous KNO3
3.476
3.494
3.480
3.469
3.526
3.511
3.501
3.600
3.552
3.572
3.557
3.543
3.602
3.588
3.576
3.674
3.088
3.077
3.049
3.013
3.089
3.154
3.145
3.122
solution
3.626
3.649
3.633
3.619
3.677
3.663
3.653
3.754
3.154
3.138
3.108
3.072
3.149
3.216
3.207
3.185
3.701
3.722
3.706
3.690
3.751
3.737
3.726
3.829

96
0.0000
0.0184
0.0369
0.0554
0.0740
0.0927
0.1114
0.1302
0.1491
0.0000
0.0180
0.0360
0.0541
0.0722
0.0904
0.1087
0.1270
0.1454
(vii) Glycylglycine in 2 M aqueous KCI solution
2.808
2.720
2.730
2.834
2.868
2.965
2.987
2.868
2.872
2.883
2.791
2.800
2.908
2.945
3.046
3.064
2.943
2.947
(viii) Glycylglycine in
3.304
3.307
3.280
3.201
3.293
3.293
3.326
3.409
3.042
3.394
3.392
3.365
3.289
3.383
3.456
3.419
3.501
3.123
2.957
2.866
2.872
2.982
3.015
3.117
3.138
3.015
3.020
3.029
2.933
2.940
3.048
3.083
3.190
3.215
3.088
3.094
2 M aqueous KNO3
3.476
3.480
3.450
3.367
3.464
3.536
3.499
3.585
3.200
3.552
3.556
3.529
3.445
3.542
3.614
3.577
3.665
3.274
3.088
3.004
3.009
3.119
3.154
3.263
3.285
3.154
3.159
solution
3.626
3.633
3.601
3.517
3.617
3.693
3.654
3.746
3.344
3.154
3.063
3.068
3.182
3.218
3.326
3.347
3.213
3.221
3.701
3.708
3.675
3.590
3.691
3.771
3.727
3.817
3.407

s
b X
Fig 2.9
0.00 0.03 0.06 0.09 0.12 0.15
m / molkg '
0.18 0.21 0.24
Plot of internal pressure versus molal concentration of L- histidine in
2 M aqueous KCl solution.
b X
Fig 2.10
4.3 •
4.2 •
4.1
4.0
3.9
3.8
3.7
3.6
3.5'
3.4
3.3
•
298.15 K 303.15 K 308.15 K 313.15K 318.15 K 323.15 K
0.00 0.03 0.06 0.09 0.12 0.15 m / molkg'*
0.18 0.21 0.24
Plot of internal pressure versus molal concentration of L- histidine in
2 M aqueous KNO3 solution.
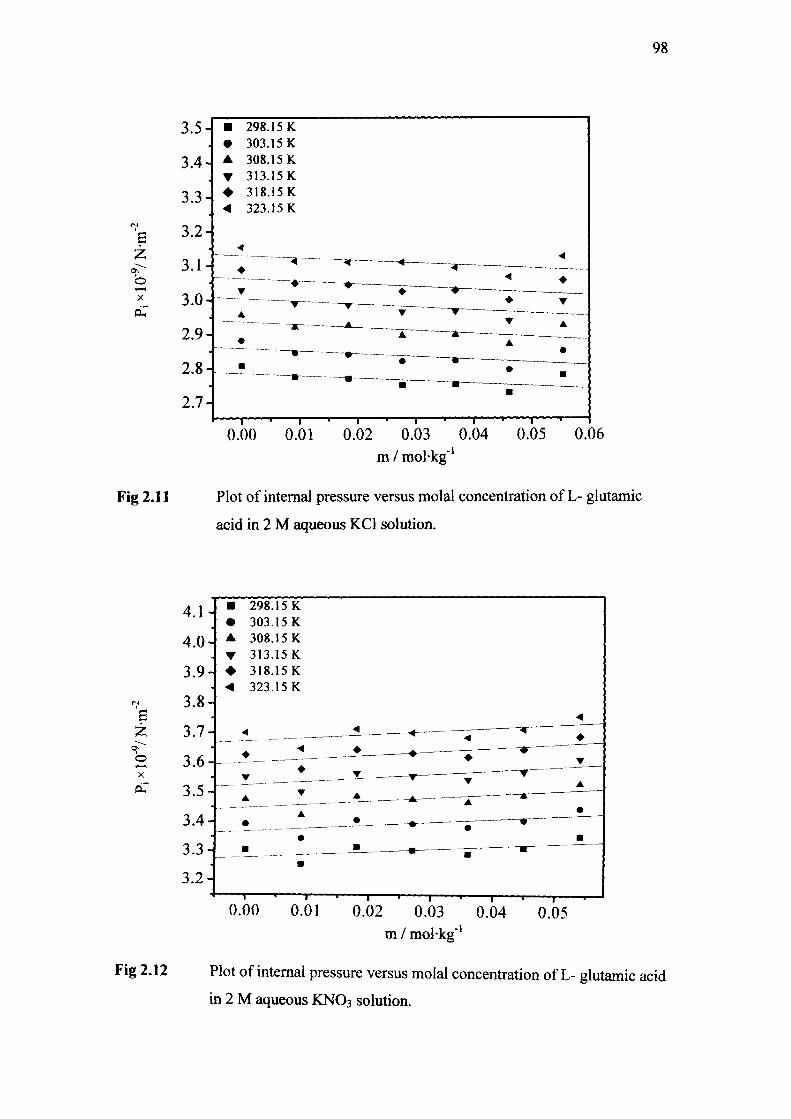
98
B j
OS
o X
Fig 2.11
3.5-
3.4-
3.3-
3.2-
3.1-
3.0-
2.9-
2.8-
2.7-
• • -4
298.15 K 303.15 K 308.15 K 313.15K 318.15K 323.15 K
0.00 0.01 0.02 0.03 0.04 0.05 0.06 m / molkg''
Plot of internal pressure versus molal concentration of L- glutamic
acid in 2 M aqueous KCl solution.
OS
o X
Fig 2.12
4.1
4.0-
3.9-] •
298.15 K 303.15 K 308.15 K 313.15K 318.15K 323.15 K
0.00 0.01 0.03 0.02 0.03 0.04 m / molkg"'
0.05
Plot of internal pressure versus molal concentration of L- glutamic acid
in 2 M aqueous KNO3 solution.
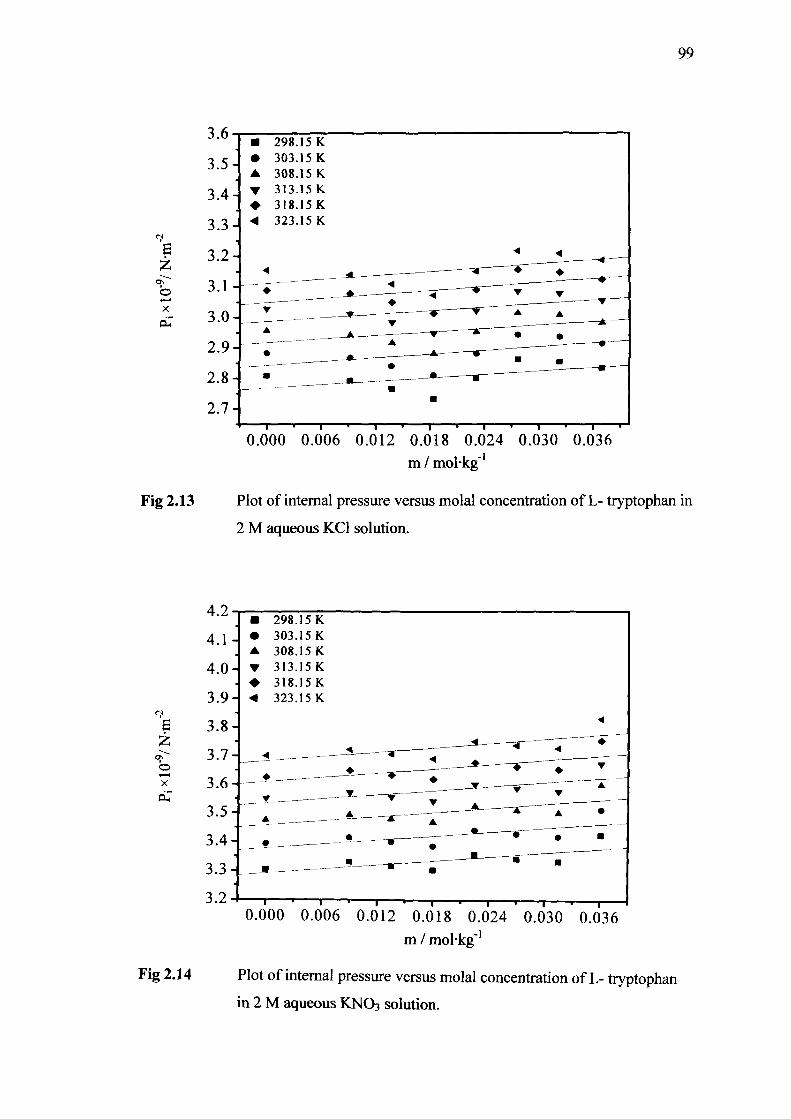
99
e z I
o X
Fig 2.13
3.6
3.5-
3.4-
3.3-
2.7-
• •
298.15 K 303.15 K 308.15 K 313.15K 318.15K 323.15 K
0.000 0.006 0.012 0.018 0.024 0.030 0.036 m / mol-kg"'
Plot of internal pressure versus molal concentration of L- tryptophan in
2 M aqueous KCl solution.
a
o X
Fig 2.14
4.2
4.1
4.0-1 •
3.9-1 <
298.15 K 303.15 K 308.15 K 313.15K 318.15 K 323.15 K
0.000 0.006 0.012 0.018 0.024 0.030 0.036 m / molkg'
Plot of internal pressure versus molal concentration of L- tryptophan
in 2 M aqueous KNO3 solution.

100
b X
3.5-1
3.4
3.3-
3.2-
3.1-
3.0-
2.9-
2.8-
2.7-
Fig 2.15
• 298.15 K • 303.15 K A 308.15 K T 313.15K • 318.15K < 323.15 K
1 1 1 1 1 1 1 . 1 1 1 1 1 1 1 r-
0.00 0.02 0.04 0.06 0.08 0.10 0.12 0.14 0.16 m / molkg"'
Plot of internal pressure versus molal concentration of Glycylglycine
in 2 M aqueous KCl solution.
S
z b X
Fig 2.16
0.00 0.02 0.04 0.06 0.08 0.10 0.12 0.14 0.16 m / molkg"'
Plot of internal pressure versus molal concentration of Glycylglycine
in 2 M aqueous KNO3 solution.
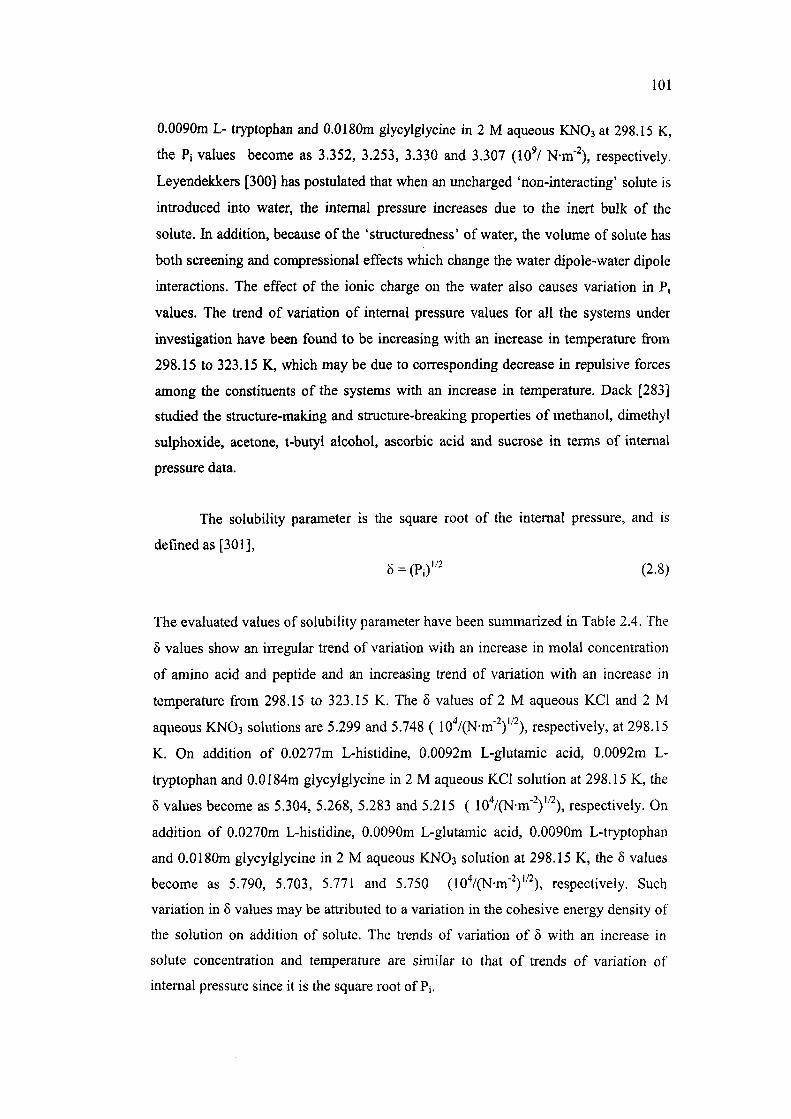
101
0.0090m L- tryptophan and 0.0180m glycylglycine in 2 M aqueous KNO3 at 298.15 K,
the Pi values become as 3.352, 3.253, 3.330 and 3.307 (10 / N-m" ), respectively.
Leyendekkers [300] has postulated that when an uncharged 'non-interacting' solute is
introduced into water, the internal pressure increases due to the inert bulk of the
solute. In addition, because of the 'structuredness' of water, the volume of solute has
both screening and compressional effects which change the water dipole-water dipole
interactions. The effect of the ionic charge on the water also causes variation in Pi
values. The trend of variation of internal pressure values for all the systems under
investigation have been found to be increasing with an increase in temperature from
298.15 to 323.15 K, which may be due to corresponding decrease in repulsive forces
among the constituents of the systems with an increase in temperature. Dack [283]
studied the structure-making and structure-breaking properties of methanol, dimethyl
sulphoxide, acetone, t-butyl alcohol, ascorbic acid and sucrose in terms of internal
pressure data.
The solubility parameter is the square root of the internal pressure, and is
defined as [301],
8 = (Pi)'' (2.8)
The evaluated values of solubility parameter have been summarized in Table 2.4. The
6 values show an irregular trend of variation with an increase in molal concentration
of amino acid and peptide and an increasing trend of variation with an increase in
temperature from 298.15 to 323.15 K. The 5 values of 2 M aqueous KCl and 2 M
aqueous KNO3 solutions are 5.299 and 5.748 ( 10''/(N-m" )' ), respectively, at 298.15
K. On addition of 0.0277m L-histidine, 0.0092m L-glutamic acid, 0.0092m L-
tryptophan and 0.0184m glycylglycine in 2 M aqueous KCl solution at 298.15 K, the
5 values become as 5.304, 5.268, 5.283 and 5.215 ( 10 /(N-m" )" ), respectively. On
addition of 0.0270m L-histidine, 0.0090m L-glutamic acid, 0.0090m L-tryptophan
and 0.0180m glycylglycine in 2 M aqueous KNO3 solution at 298.15 K, the 8 values
become as 5.790, 5.703, 5.771 and 5.750 (10 /(N-m" )" ), respectively. Such
variation in 5 values may be attributed to a variation in the cohesive energy density of
the solution on addition of solute. The trends of variation of 8 with an increase in
solute concentration and temperature are similar to that of trends of variation of
internal pressure since it is the square root of Pj.

102
TABLE 2.4 Solubility parameter values (8 xio"* /(N-ra" )" ) as functions of amino
acid / peptide molal concentration and temperature
ml
mol-kg''
0.0000
0.0277
0.0555
0.0836
0.1117
0.1400
0.1686
0.1974
0.2263
0.0000
0.0270
0.0541
0.0815
0.1090
0.1367
0.1645
0.1926
0.2207
T/K
298.15 303.15
(i) L-histidine in
5.299
5.304
5.258
5.257
5.338
5.371
5.337
5.443
5.452
5.370
5.377
5.331
5.330
5.414
5.447
5.412
5.521
5.532
(ii) L-histidine in
5.748
5.790
5.855
5.904
5.882
5.857
5.858
5.867
5.868
5.826
5.867
5.933
5.981
5.959
5.933
5.934
5.943
5.942
308.15
[ 2 M aqueous
5.440
5.443
5.400
5.400
5.485
5.516
5.480
5.590
5.599
2 M aqueous
5.895
5.940
6.005
6.054
6.031
6.005
6.004
6.014
6.014
313.15 318.15
KCI solution
5.504
5.509
5.462
5.462
5.546
5.576
5.541
5.649
5.660
5.557
5.568
5.521
5.518
5.602
5.635
5.600
5.711
5.719
KNO3 solution
5.960
6.005
6.072
6.121
6.097
6.071
6.070
6.079
6.080
6.022
6.067
6.134
6.181
6.157
6.130
6.129
6.139
6.138
323.15
5.616
5.622
5.573
5.571
5.658
5.691
5.655
5.768
5.777
6.084
6.126
6.195
6.241
6.218
6.188
6.187
6.197
6.197
(iii) L- glutamic acid in 2 M aqueous KCI solution
0.0000
0.0092
0.0184
0.0277
0.0369
5.299
5.268
5.263
5.245
5.247
5.370
5.335
5.330
5.312
5.314
5.440
5.405
5.400
5.381
5.383
5.504
5.468
5.463
5.445
5.447
5.557
5.522
5.517
5.499
5.502
5.616
5.579
5.576
5.558
5.562
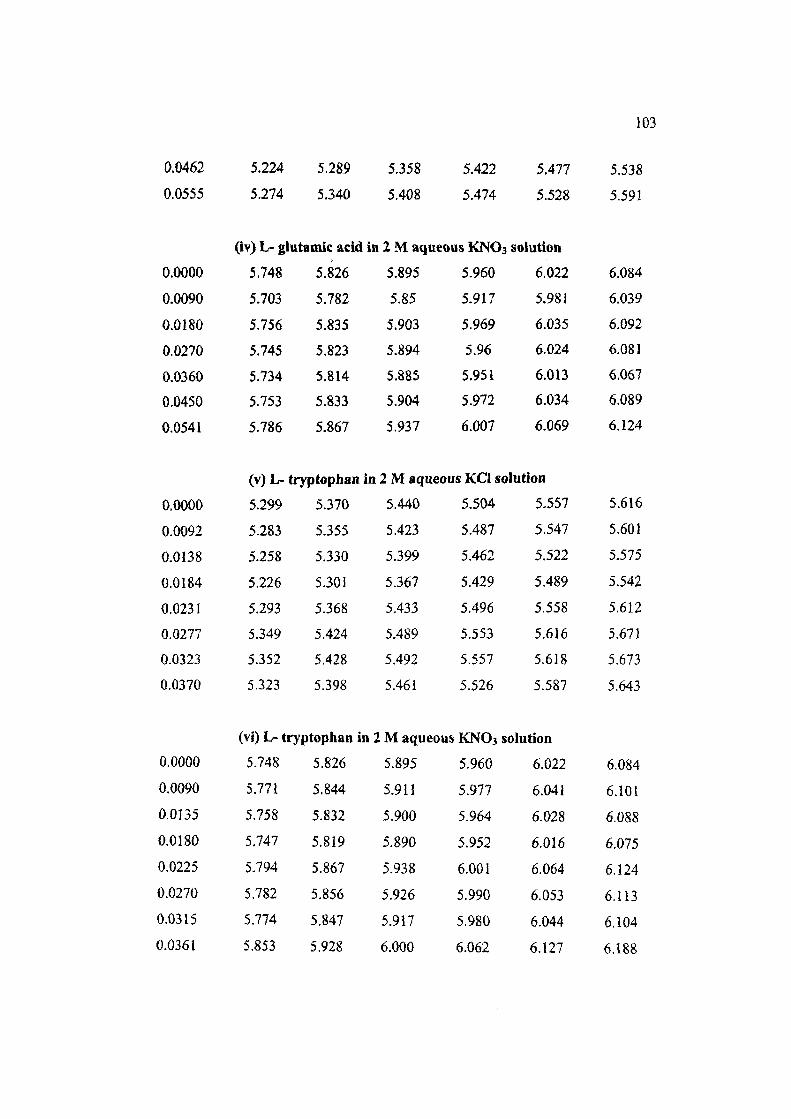
103
0.0462
0.0555
0.0000
0.0090
0.0180
0.0270
0.0360
0.0450
0.0541
5.224
5.274
5.289
5.340
(iv) L- glutamic acid in
5.748
5.703
5.756
5.745
5.734
5.753
5.786
5.826
5.782
5.835
5.823
5.814
5.833
5.867
5.358
5.408
5.422
5.474
12 M aqueous KNOj
5.895
5.85
5.903
5.894
5.885
5.904
5.937
5.960
5.917
5.969
5.96
5.951
5.972
6.007
5.477
5.528
solution
6.022
5.981
6.035
6.024
6.013
6.034
6.069
5.538
5.591
6.084
6.039
6.092
6.081
6.067
6.089
6.124
(v) L- tryptophan io 2 M aqueous KCl solution
0.0000
0.0092
0.0138
0.0184
0.0231
0.0277
0.0323
0.0370
5.299
5.283
5.258
5,226
5.293
5.349
5.352
5.323
5.370
5.355
5.330
5.301
5.368
5.424
5.428
5.398
5.440
5.423
5.399
5.367
5.433
5.489
5.492
5.461
5.504
5.487
5.462
5.429
5.496
5.553
5.557
5.526
5.557
5.547
5.522
5.489
5.558
5.616
5.618
5.587
5.616
5.601
5.575
5.542
5.612
5.671
5.673
5.643
(vi) L- tryptophan in 2 M aqueous KNO3 solution
0.0000
0.0090
0.0135
0,0180
0.0225
0.0270
0.0315
0.0361
5.748
5.771
5.758
5.747
5.794
5.782
5.774
5.853
5.826
5.844
5.832
5.819
5.867
5.856
5.847
5.928
5.895
5.911
5.900
5.S90
5.938
5.926
5.917
6.000
5.960
5.977
5.964
5.952
6.001
5.990
5.980
6.062
6.022
6.041
6.028
6.016
6.064
6.053
6.044
6.127
6,084
6.101
6.088
6.075
6.124
6.113
6.104
6.188
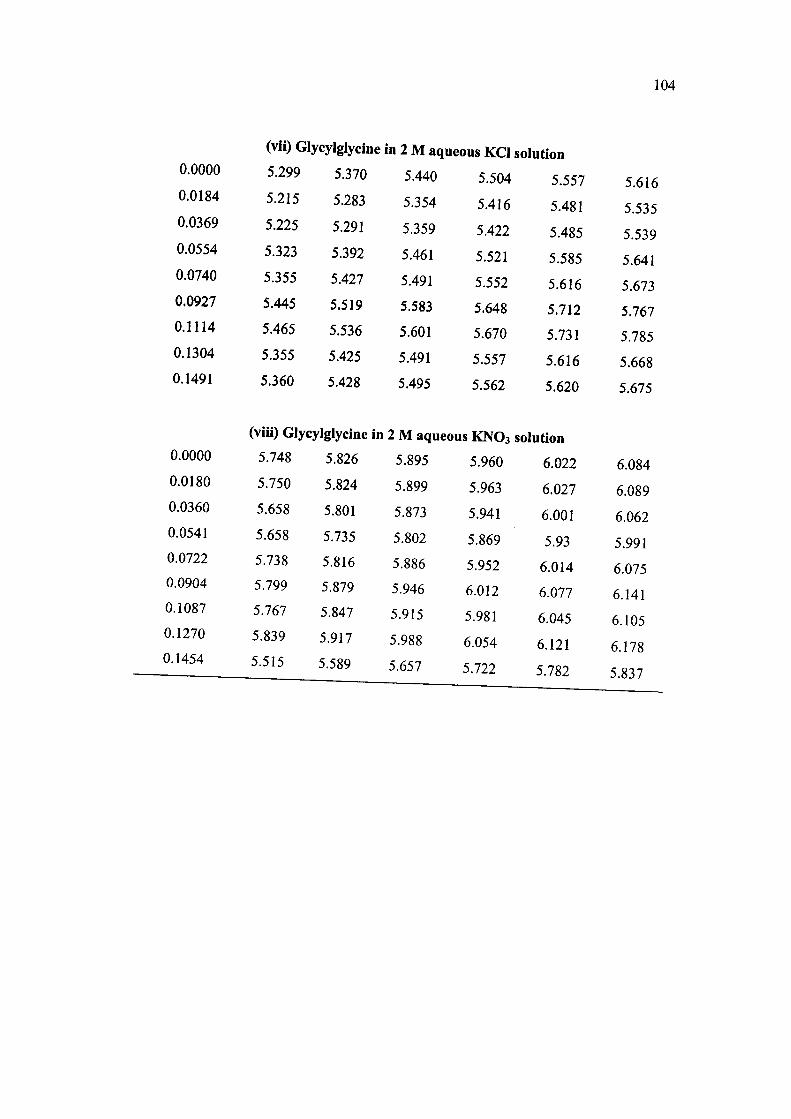
104
0.0000
0.0184
0.0369
0.0554
0.0740
0.0927
0.1114
0.1304
0.1491
0.0000
0.0180
0.0360
0.0541
0.0722
0.0904
0.1087
0.1270
0.1454
(vii) Glycylglycine
5.299
5.215
5.225
5.323
5.355
5.445
5.465
5.355
5.360
5.370
5.283
5.291
5.392
5.427
5.519
5.536
5.425
5.428
(viu) Glycylglycine in
5.748
5.750
5.658
5.658
5.738
5.799
5.767
5.839
5.515
5.826
5.824
5.801
5.735
5.816
5.879
5.847
5.917
5.589
in 2 M aqueous KCI solution
5.440
5.354
5.359
5.461
5.491
5.583
5.601
5.491
5.495
5.504
5.416
5.422
5.521
5.552
5.648
5.670
5.557
5.562
2 M aqueous KNO3 i
5.895
5.899
5.873
5.802
5.886
5.946
5.915
5.988
5.657
5.960
5.963
5.941
5.869
5.952
6.012
5.981
6.054
5.722
5.557
5.481
5.485
5.585
5.616
5.712
5.731
5.616
5.620
solution
6.022
6.027
6.001
5.93
6.014
6.077
6.045
6.121
5.782
5.616
5.535
5.539
5.641
5.673
5.767
5.785
5.668
5.675
6.084
6.089
6.062
5.991
6.075
6.141
6.105
6.178
5.837

105
The pseudo-gruneisen parameter measures the degree of molecular / ionic
association in a solution. The following relation is employed for the computation of
pseudo-gruneisen parameter,
r = ( Y - l ) / a T T (2.9)
where y is the specific heat ratio. The values of y have been computed employing the
following expression,
y = Cp/Cv = KTi/Ks (2.10)
where KJ (= 1/ p.u^ ) is the isentropic compressibility. The computed values of y have
been listed in Table A2 of appendix. The computed values of pseudo-gruneisen
parameter have been listed in Table 2.5. The pseudo-gruneisen parameter values are
negative at all molal concentrations of solutions and at all studied temperatures. A
negative sign is an indication of strong intermolecular interactions and a probable
formation of intermolecular complex in the solution. The T values for 2M aqueous
KCl and 2M aqueous KNO3 solutions are -7.881 and -6.623, respectively, at 298.15
K. On addition of 0.0277m L- histidine, 0.0092 m L-glutamic acid, 0.0092 m L-
tryptophan and 0.0184 m glycylglycine in 2 M aqueous KCl solution at 298.15 K, the
values become as -7.905, -7.991, -7.941 and -8.155, respectively. On addition of
0.0270m L-histidine, 0.0090 m L-glutamic acid, 0.0090 m L-tryptophan and 0.0180 m
glycylglycine in 2 M aqueous KNO3 solution at 298.15 K, the T values become as -
6.589, -6.735, -6.592 and -6.647, respectively. The T values of 2 M aqueous KCl
solution are smaller than those of 2M aqueous KNO3 solution at all the temperatures
of study. The f values also exhibit an irregular trend of variation with an increase in
solute concentration. The decreasing trend of pseudo-gruneisen parameter with an
increase in temperature may be due to a corresponding increase in the kinetic energy
of molecules, which in turn, increases the thermal motion of solute molecules and
disrupts the molecular association.
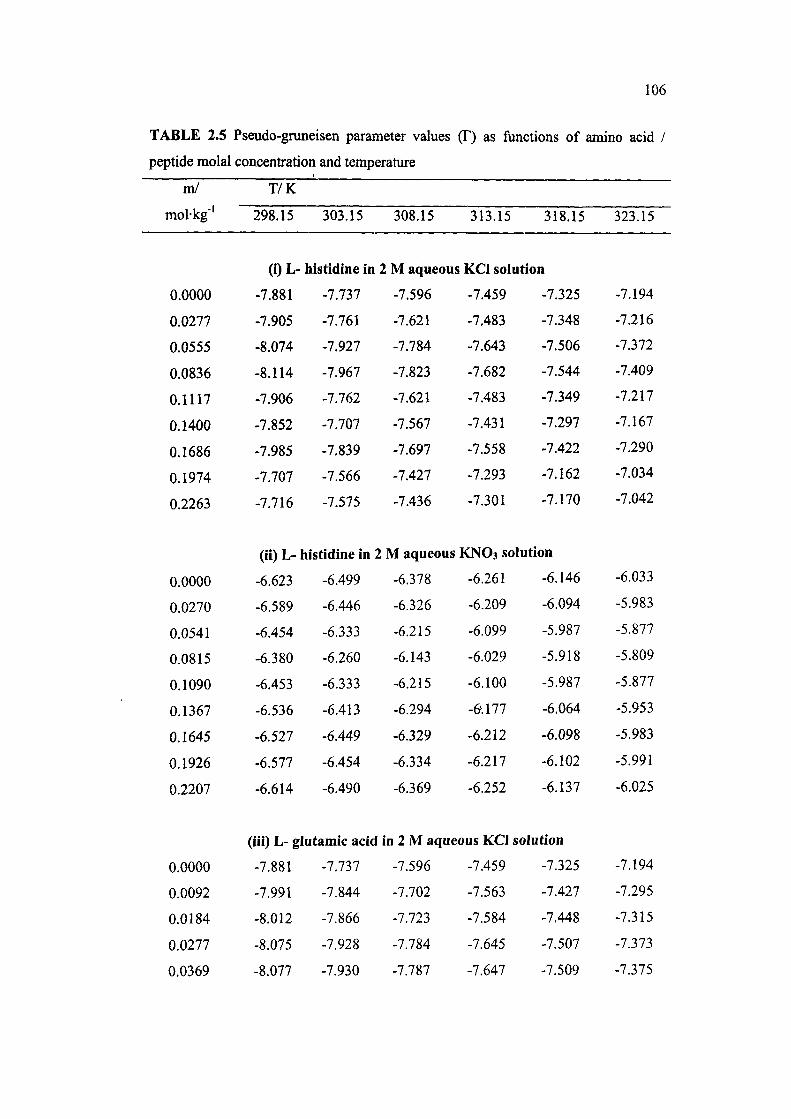
106
TABLE 2.5 Pseudo-gruneisen parameter values (T) as functions of amino acid /
peptide molal concentration and temperature
ml T/K
mol-kg-' 298.15 303.15 308.15 313.15 318.15 323.15
(i) L- histidine in 2 M aqueous KCI solution
0.0000
0.0277
0.0555
0.0836
0.1117
0.1400
0.1686
0.1974
0.2263
-7.881
-7.905
-8.074
-8.114
-7.906
-7.852
-7.985
-7.707
-7.716
-7.737
-7.761
-7.927
-7.967
-7.762
-7.707
-7.839
-7.566
-7.575
-7.596
-7.621
-7.784
-7.823
-7.621
-7.567
-7.697
-7.427
-7.436
-7.459
-7.483
-7.643
-7.682
-7.483
-7.431
-7.558
-7.293
-7.301
-7.325
-7.348
-7.506
-7.544
-7.349
-7.297
-7.422
-7.162
-7.170
-7.194
-7.216
-7.372
-7.409
-7.217
-7.167
-7.290
-7.034
-7.042
(ii) L- histidine in 2 M aqueous KNO3 solution
0.0000
0.0270
0.0541
0.0815
0.1090
0.1367
0.1645
0.1926
0.2207
-6.623
-6.589
-6.454
-6.380
-6.453
-6.536
-6.527
-6.577
-6.614
-6.499
-6.446
-6.333
-6.260
-6.333
-6.413
-6.449
-6.454
-6.490
-6.378
-6.326
-6.215
-6.143
-6.215
-6.294
-6.329
-6.334
-6.369
-6.261
-6.209
-6.099
-6.029
-6.100
-0.177
-6.212
-6.217
-6.252
-6.146
-6.094
-5.987
-5.918
-5.987
-6.064
-6.098
-6.102
-6.137
-6.033
-5.983
-5.877
-5.809
-5.877
-5.953
-5.983
-5.991
-6.025
(iii) L- glutamic acid in 2 M aqueous KCI solution
0.0000 -7.881 -7.737 -7.596 -7.459 -7.325 -7.194
0.0092 -7.991 -7.844 -7.702 -7.563 -7.427 -7.295
0.0184 -8.012 -7.866 -7.723 -7.584 -7.448 -7.315
0.0277 -8.075 -7.928 -7.784 -7.645 -7.507 -7.373
0.0369 -8.077 -7.930 -7.787 -7.647 -7.509 -7.375
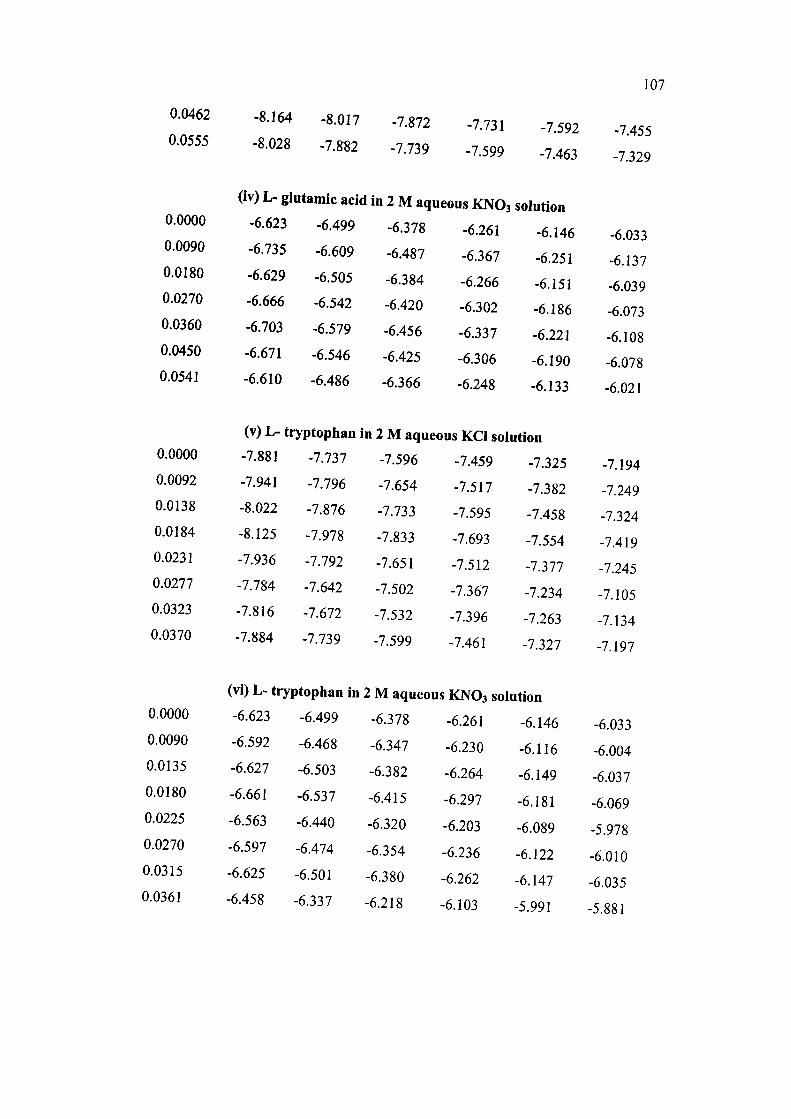
107
0.0462
0.0555
-8.164
-8.028
-8.017
-7.882
-7.872
-7.739
-7.731
-7.599
-7.592
-7.463
-7.455
-7.329
(iv) L- glutamic acid in 2 M aqueous KNO3 solution 0.0000
0.0090
0.0180
0.0270
0.0360
0.0450
0.0541
0.0000
0.0092
0.0138
0.0184
0.0231
0.0277
0.0323
0.0370
0.0000
0.0090
0.0135
0.0180
0.0225
0.0270
0.0315
0.0361
-6.623
-6.735
-6.629
-6.666
-6.703
-6.671
-6.610
-6.499
-6.609
-6.505
-6.542
-6.579
-6.546
-6.486
-6.378
-6.487
-6.384
-6.420
-6.456
-6.425
-6.366
-6.261
-6.367
-6.266
-6.302
-6.337
-6.306
-6.248
-6.146
-6.251
-6.151
-6.186
-6.221
-6.190
-6.133
(v) L- tryptophan in 2 M aqueous KCl solution
-7.881
-7.941
-8.022
-8.125
-7.936
-7.784
-7.816
-7.884
-7.737
-7.796
-7.876
-7.978
-7.792
-7.642
-7.672
-7.739
(vi) L- tryptoplian in
-6.623
-6.592
-6.627
-6.661
-6.563
-6.597
-6.625
-6.458
-6.499
-6.468
-6.503
-6.537
-6.440
-6.474
-6.501
-6.337
-7.596
-7.654
-7.733
-7.833
-7.651
-7.502
-7.532
-7.599
-7.459
-7.517
-7.595
-7.693
-7.512
-7.367
-7.396
-7.461
-7.325
-7.382
-7.458
-7.554
-7.377
-7.234
-7.263
-7.327
2 M aqueous KNO3 solution
-6.378
-6.347
-6.382
-6.415
-6.320
-6.354
-6.380
-6.218
-6.261
-6.230
-6.264
-6.297
-6.203
-6.236
-6.262
-6.103
-6.146
-6.116
-6.149
-6.181
-6.089
-6.122
-6.147
-5.991
-6.033
-6.137
-6.039
-6.073
-6.108
-6.078
-6.021
-7.194
-7.249
-7.324
-7.419
-7.245
-7.105
-7.134
-7.197
-6.033
-6.004
-6.037
-6.069
-5.978
-6.010
-6.035
-5.881
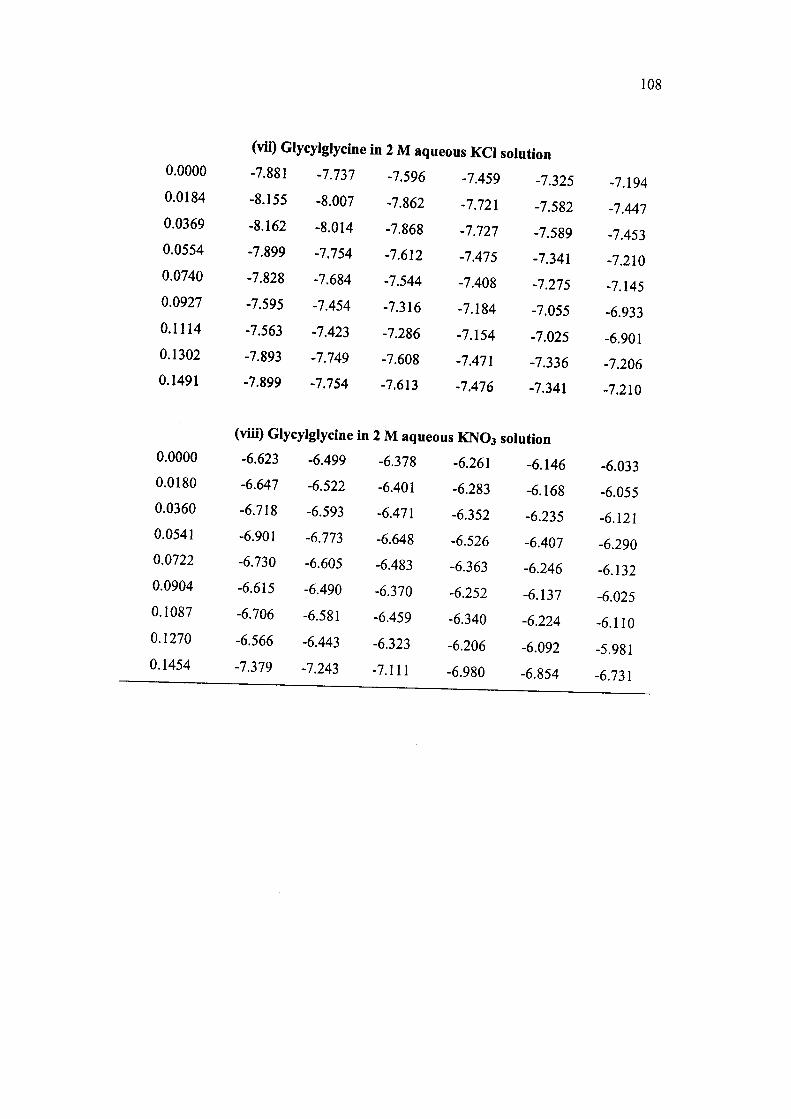
108
0.0000
0.0184
0.0369
0.0554
0.0740
0.0927
0.1114
0.1302
0.1491
0.0000
0.0180
0.0360
0.0541
0.0722
0.0904
0.1087
0.1270
0.1454
(vii) Glycylglycine
-7.881
-8.155
-8.162
-7.899
-7.828
-7.595
-7.563
-7.893
-7.899
-7.737
-8.007
-8.014
-7.754
-7.684
-7.454
-7.423
-7.749
-7.754
(viii) Glycylglycine in
-6.623
-6.647
-6.718
-6.901
-6.730
-6.615
-6.706
-6.566
-7.379
-6.499
-6.522
-6.593
-6.773
-6.605
-6.490
-6.581
-6.443
-7.243
in 2 M aqueous KCl solution
-7.596
-7.862
-7.868
-7.612
-7.544
-7.316
-7.286
-7.608
-7.613
-7.459
-7.721
-7.727
-7.475
-7.408
-7.184
-7.154
-7.471
-7.476
-7.325
-7.582
-7.589
-7.341
-7.275
-7.055
-7.025
-7.336
-7.341
2 M aqueous KNO3 solution
-6.378
-6.401
-6.471
-6.648
-6.483
-6.370
-6.459
-6.323
-7.111
-6.261
-6.283
-6.352
-6.526
-6.363
-6.252
-6.340
-6.206
-6.980
-6.146
-6.168
-6.235
-6.407
-6.246
-6.137
-6.224
-6.092
-6.854
-7.194
-7.447
-7.453
-7.210
-7.145
-6.933
-6.901
-7.206
-7.210
-6.033
-6.055
-6.121
-6.290
-6.132
-6.025
-6.110
-5.981
-6.731
CHAPTER-III
Partial Molal Volumes and Partial Molal Isentropic
Compressibilities of L-histidine-/ L-glutamic acid-/ L-
tryptophan-/ Glycylglycine - Aqueous KCI/KNO3
Systems
INTRODUCTION
The knowledge of water-protein-protein modal compound interactions are
necessary to understand the role of water solvated to soluble organics in the living
cells since the most biological macromolecules are physiologically active in aqueous
medium. The volumetric properties are known to be sensitive to the degree and nature
of solute solvation [269,302-304]. Since amino acids / peptides are zwitterions in
aqueous solutions [165-166], their volume and compressibility properties should
reflect structural interactions with water molecule as in the case of electrolytes [249].
Amino acid and peptide molecules on dissolving in aqueous medium cause a decrease
in the volume of water due to the contraction of water structure near the terminal
groups of zwitterions and this contraction is termed as elecrostriction [180]. The
apparent molal volume and the apparent molal isentropic compressibility values are
known to be sensitive to interactions between solute and solvent, these values have
been used to obtain the information regarding the structural and interaction
phenomena associated with solvation process [305,306].
The apparent molal volume and apparent molal isentropic compressibility at
infinite dilution are known as partial molal volume and partial molal isentropic
compressibility. Partial molal volume is a thermodynamic quantity, which provides an
important information about solute-solvent interactions in a solution. Moreover, its
temperature-dependence may be quite useful in characterizing the structural hydration
effect, as the intrinsic volume of the solute is almost independent of temperature
[18,89,307]. A number of researchers studied the partial molal volume of amino acids
and peptides in aqueous medium [18,175188,308-312], in aqueous electrolytic
systems [7,8,20,22,176,178,185,206-209,211,232,234,235,237,238-241,315-318] as
well as in organic solvents [7,177,179,204,233,318].
Partial molal isentropic compressibility is another thermodynamic parameter
for investigating the behaviour of solutes in the solution. The partial molal isentropic
compressibility is a measure of the resistance offered against compression, which the
solute imparts towards the solvent and thus gives an idea about solute-solvent
interactions [22,319]. Many researchers have explored the partial molal isentropic
compressibilities of amino acids / peptides in aqueous medium [47,212,269,320-322],
aqueous electrolytes [8,22,208,242,317,323-325] and organic solvents
[47,54,249,310]. Partial molal isentropic is independent of the solute-solute
interactions.
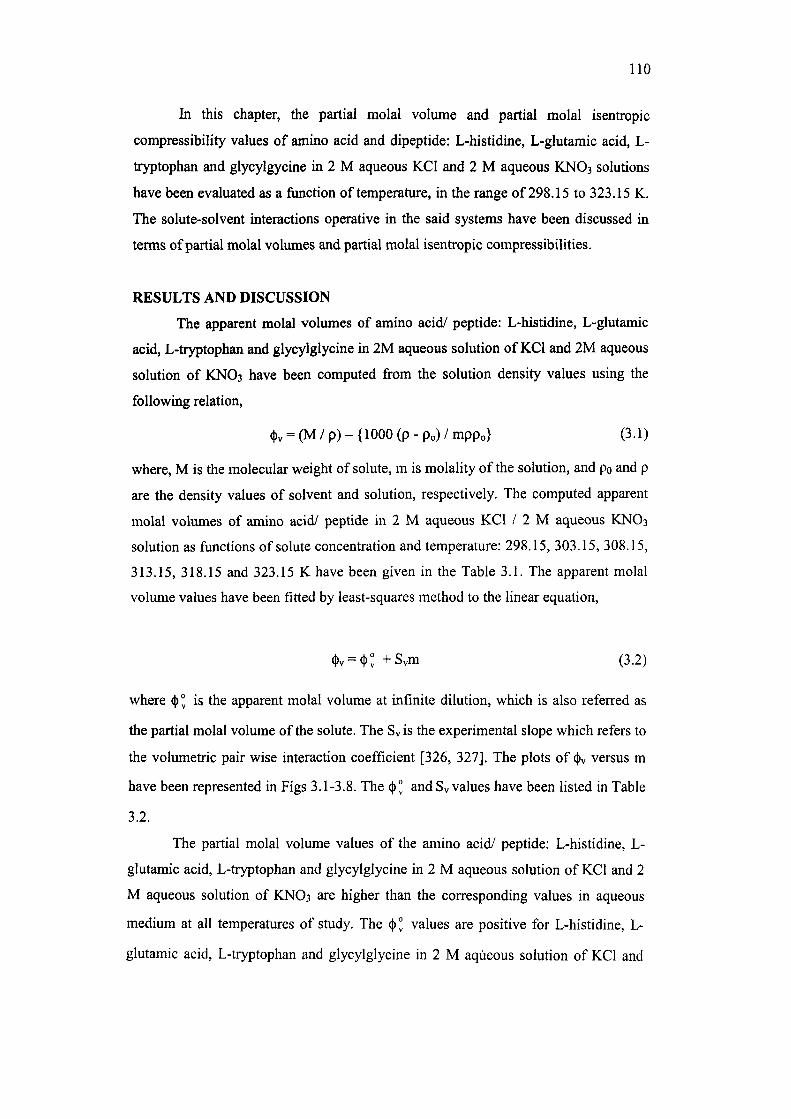
110
In this chapter, the partial molal volume and partial molal isentropic
compressibility values of amino acid and dipeptide: L-histidine, L-glutamic acid, L-
tryptophan and glycylgycine in 2 M aqueous KCl and 2 M aqueous KNO3 solutions
have been evaluated as a function of temperature, in the range of 298.15 to 323.15 K.
The solute-solvent interactions operative in the said systems have been discussed in
terms of partial molal volumes and partial molal isentropic compressibilities.
RESULTS AND DISCUSSION
The apparent molal volumes of amino acid/ peptide: L-histidine, L-glutamic
acid, L-tryptophan and glycylglycine in 2M aqueous solution of KCl and 2M aqueous
solution of KNO3 have been computed from the solution density values using the
following relation,
(l)v = (M/p)-{1000(p-po)/mppo} (3.1)
where, M is the molecular weight of solute, m is molality of the solution, and po and p
are the density values of solvent and solution, respectively. The computed apparent
molal volumes of amino acid/ peptide in 2 M aqueous KCl / 2 M aqueous KNO3
solution as functions of solute concentration and temperature: 298.15, 303.15, 308.15,
313.15, 318.15 and 323.15 K have been given in the Table 3.1. The apparent molal
volume values have been fitted by least-squares method to the linear equation,
(t)v = (t): +Svm (3.2)
where (|)° is the apparent molal volume at infinite dilution, which is also referred as
the partial molal volume of the solute. The Sv is the experimental slope which refers to
the volumetric pair wise interaction coefficient [326, 327]. The plots of (^^ versus m
have been represented in Figs 3.1-3.8. The (j)" and Sv values have been listed in Table
3.2.
The partial molal volume values of the amino acid/ peptide: L-histidine, L-
glutamic acid, L-tryptophan and glycylglycine in 2 M aqueous solution of KCl and 2
M aqueous solution of KNO3 are higher than the corresponding values in aqueous
medium at all temperatures of study. The (j) ° values are positive for L-histidine, L-
glutamic acid, L-tryptophan and glycylglycine in 2 M aqiieous solution of KCl and
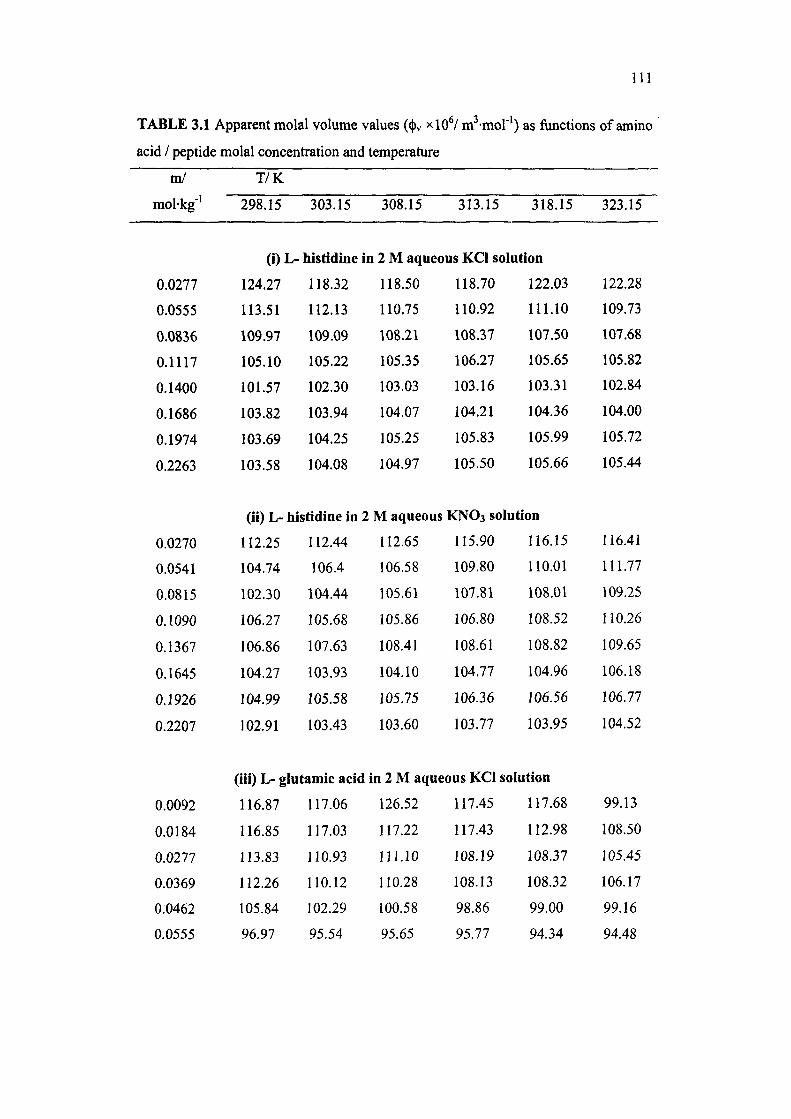
I l l
TABLE 3.1 Apparent molal volume values (<t)v xlO / m^-mor') as functions of amino
acid / peptide molal concentration and temperature
m/
mol-kg"'
0.0277
0.0555
0.0836
0.1117
0.1400
0.1686
0.1974
0.2263
0.0270
0.0541
0.0815
0.1090
0.1367
0.1645
0.1926
0.2207
T/K
298.15
(i)L-
124.27
113.51
109.97
105.10
101.57
103.82
103.69
103.58
303.15
histidine
118.32
112.13
109.09
105.22
102.30
103.94
104.25
104.08
(ii) L- histidine in
112.25
104.74
102.30
106.27
106.86
104.27
104.99
102.91
112.44
106.4
104.44
105.68
107.63
103.93
105.58
103.43
308.15 313.15 318.15
in 2 M aqueous KCl solution
118.50
110.75
108.21
105.35
103.03
104.07
105.25
104.97
2 M aqueous
112.65
106.58
105.61
105.86
108.41
104.10
105.75
103.60
118.70
110.92
108.37
106.27
103.16
104.21
105.83
105.50
122.03
111.10
107.50
105.65
103.31
104.36
105.99
105.66
K N O 3 solution
115.90
109.80
107.81
106.80
108.61
104.77
106.36
103.77
116.15
110.01
108.01
108.52
108.82
104.96
106.56
103.95
323.15
122.28
109.73
107.68
105.82
102.84
104.00
105.72
105.44
116.41
111.77
109.25
110.26
109.65
106.18
106.77
104.52
(iii) L- glutamic acid in 2 M aqueous KCl solution
0.0092
0.0184
0.0277
0.0369
0.0462
0.0555
116.87
116.85
113.83
112.26
105.84
96.97
117.06
117.03
110.93
110.12
102.29
95.54
126.52
117.22
111.10
110.28
100.58
95.65
117.45
117.43
108.19
108.13
98.86
95.77
117.68
112.98
108.37
108.32
99.00
94.34
99.13
108.50
105.45
106.17
99.16
94.48
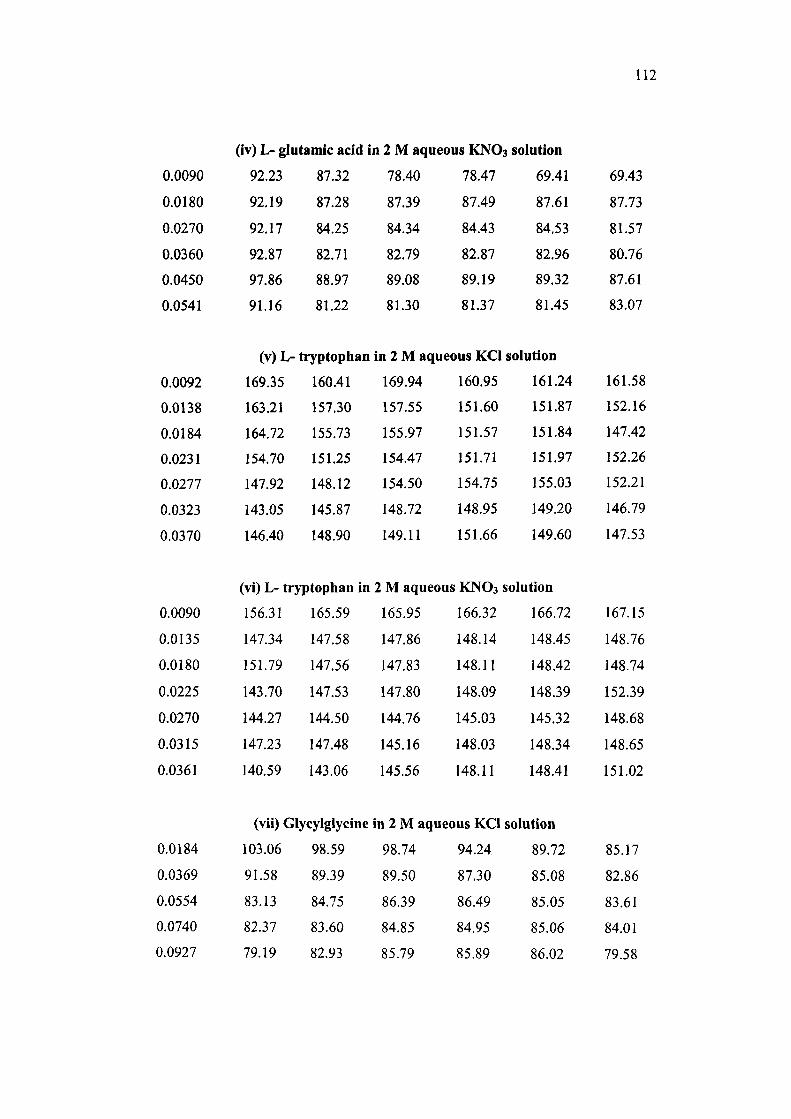
112
0.0090
0.0180
0.0270
0.0360
0.0450
0.0541
(iv) L- glutamic acid
92.23
92.19
92.17
92.87
97.86
91.16
87.32
87.28
84.25
82.71
88.97
81.22
in 2 M aqueous K N O 3 solution
78.40
87.39
84.34
82.79
89.08
81.30
78.47
87.49
84.43
82.87
89.19
81.37
69.41
87.61
84.53
82.96
89.32
81.45
69.43
87.73
81.57
80.76
87.61
83.07
(v) L- tryptophan in 2 M aqueous KCl solution
0.0092
0.0138
0.0184
0.0231
0.0277
0.0323
0.0370
169.35
163.21
164.72
154.70
147.92
143.05
146.40
160.41
157.30
155.73
151.25
148.12
145.87
148.90
169.94
157.55
155.97
154.47
154.50
148.72
149.11
160.95
151.60
151.57
151.71
154.75
148.95
151.66
161.24
151.87
151.84
151.97
155.03
149.20
149.60
161.58
152.16
147.42
152.26
152.21
146.79
147.53
(vi) L- tryptoplian in 2 M aqueous KNO3 solution
0.0090
0.0135
0.0180
0.0225
0.0270
0.0315
0.0361
156.31
147.34
151.79
143.70
144.27
147.23
140.59
165.59
147.58
147.56
147.53
144.50
147.48
143.06
165.95
147.86
147.83
147.80
144.76
145.16
145.56
166.32
148.14
148.11
148.09
145.03
148.03
148.11
166.72
148.45
148.42
148.39
145.32
148.34
148.41
167.15
148.76
148.74
152.39
148.68
148.65
151.02
(vii) Glycylglycine in 2 M aqueous KCl solution
0.0184 103.06 98.59 98.74 94.24 89.72 85.17
0.0369 91.58 89.39 89.50 87.30 85.08 82.86
0.0554 83.13 84.75 86.39 86.49 85.05 83.61
0.0740 82.37 83.60 84.85 84.95 85.06 84.01
0.0927 79.19 82.93 85.79 85.89 86.02 79.58
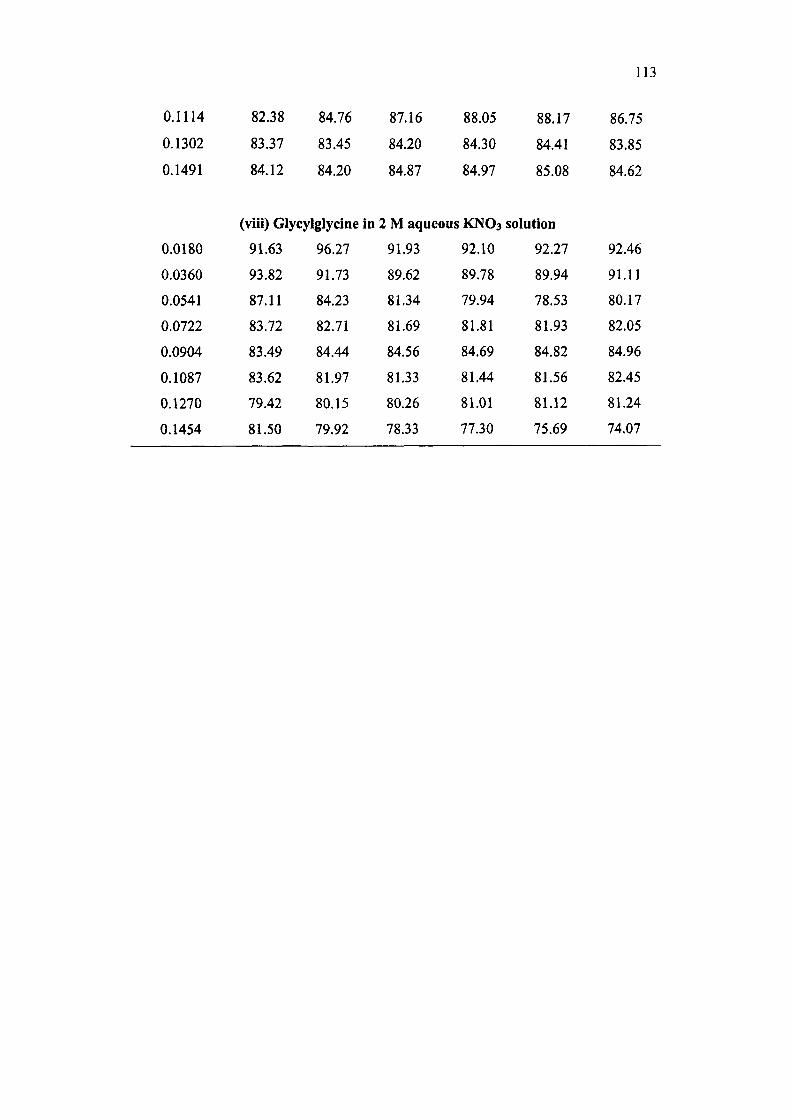
113
0.1114
0.1302
0.1491
82.38
83.37
84.12
84.76
83.45
84.20
87.16
84.20
84.87
88.05
84.30
84.97
88.17
84.41
85.08
86.75
83.85
84.62
(viii) Glycylglycine in 2 M aqueous KNO3 solution
0.0180
0.0360
0.0541
0.0722
0.0904
0.1087
0.1270
0.1454
91.63
93.82
87.11
83.72
83.49
83.62
79.42
81.50
96.27
91.73
84.23
82.71
84.44
81.97
80.15
79.92
91.93
89.62
81.34
81.69
84.56
81.33
80.26
78.33
92.10
89.78
79.94
81.81
84.69
81.44
81.01
77.30
92.27
89.94
78.53
81.93
84.82
81.56
81.12
75.69
92.46
91.11
80.17
82.05
84.96
82.45
81.24
74.07
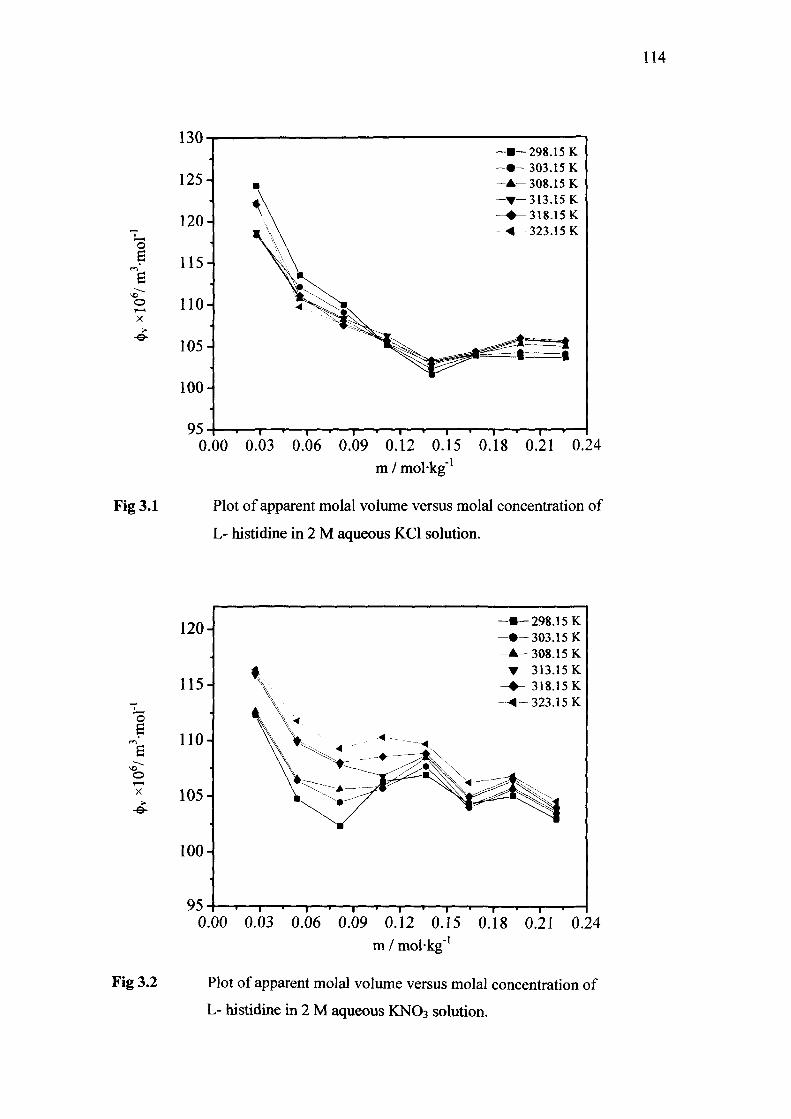
114
"o B B o 1 — t
X
> -&-
130
125
120
115
110
105
100
Fig 3.1
95
•—298.15 K •-303.15 K A - 308.15 K T-313.15 K •-318.15 K - 323.15 K
0.00 0.03 0.06 0.09 0.12 0.15 0.18 0.21 0.24 m / molkg"'
Plot of apparent molal volume versus molal concentration of
L- histidine in 2 M aqueous KCl solution.
o
e
o X
Fig 3.2
120-
115-
110-
105-
100-
95
-•-298.15 K -•-303.15 K -A-308.15 K -T-313.15 K -•-318.15K -<-^ 323.15 K
0.00 0.03 0.06 0.09 0.12 0.15 0.18 0.21 0.24
m / molkg '
Plot of apparent molal volume versus molal concentration of
L- histidine in 2 M aqueous KNO3 solution.

115
o
a O
Fig 3.3
140
130-
120-
110-
100
90-1
80
-•-298.15 K -•-303.15 K -A-308.15 K -•-313.15 K -•-318.15K —^-323.15 K
0.01 0.02 0.03 0.04 m / molkg*
0.05 0.06
Plot of apparent molal volume versus molal concentration of
L- glutamic acid in 2 M aqueous KCl solution.
-
o
a VO
o T^^
X
> -e-
115
110
105
100
95
90
85
80
Fig 3.4
75-
70-
65
•-298.15 K •-303.15 K A-308.15 K •-313.15 K •-318.15K ^-323.15 K
0.01 0.02 0.03 m / mol-kg'
0.04 0.05 0.06
Plot of apparent molal volimie versus molal concentration of
L- glutamic acid in 2 M aqueous KNO3 solution.
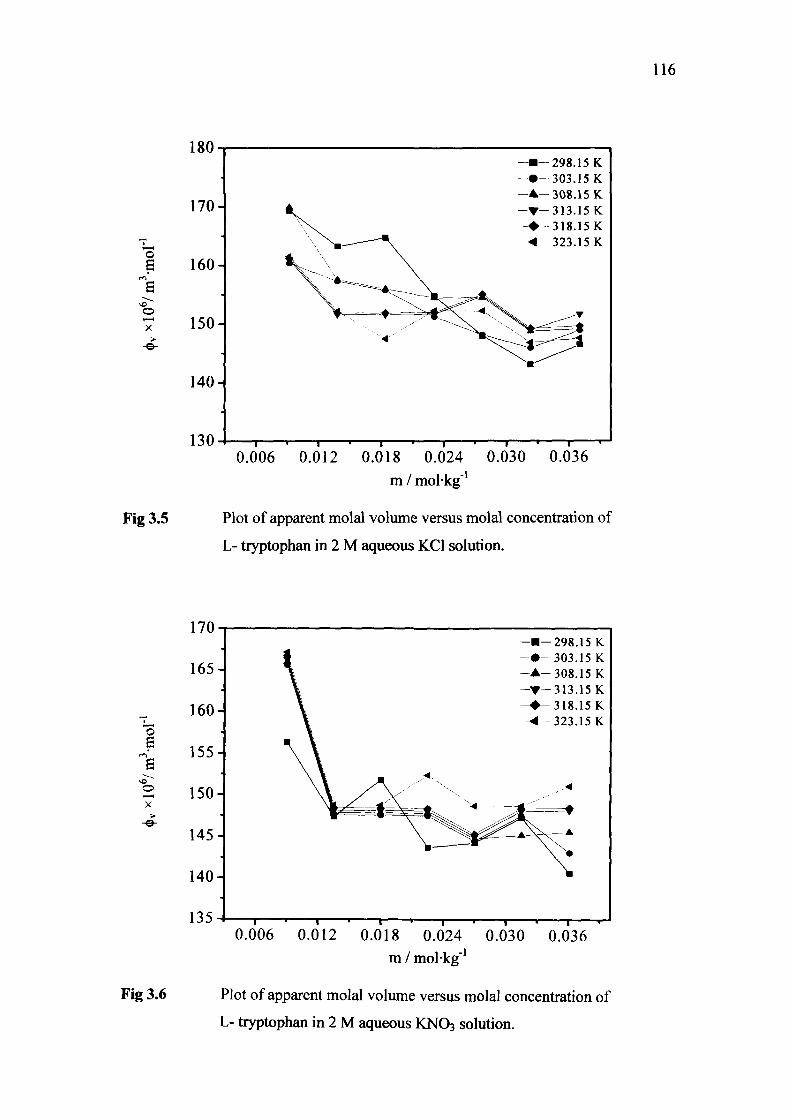
116
o S
O
X >
-e-
Fig 3.5
180
170-
160-
150-
140-
130 0.006
—•—298.15K - • - 3 0 3 . 1 5 K - A - 3 0 8 . 1 5 K - • - 3 1 3 . 1 5 K - • - 3 1 8 . 1 5 K ^ < 323.15K
0.012 0.018 0.024 m / mol-kg"*
0.030 0.036
Plot of apparent molal volume versus molal concentration of
L- tryptophan in 2 M aqueous KCl solution.
o S
o X
Fig 3.6
170
165
160
155
150
145
140
135-
•—298.15 K •-303.15 K A-308.15 K •-313.15 K
318.15 K 323.15 K
0.006 0.012 0.018 0.024 0.030 0.036 m / molkg"'
Plot of apparent molal volume versus molal concentration of
L- tryptophan in 2 M aqueous KNO3 solution.
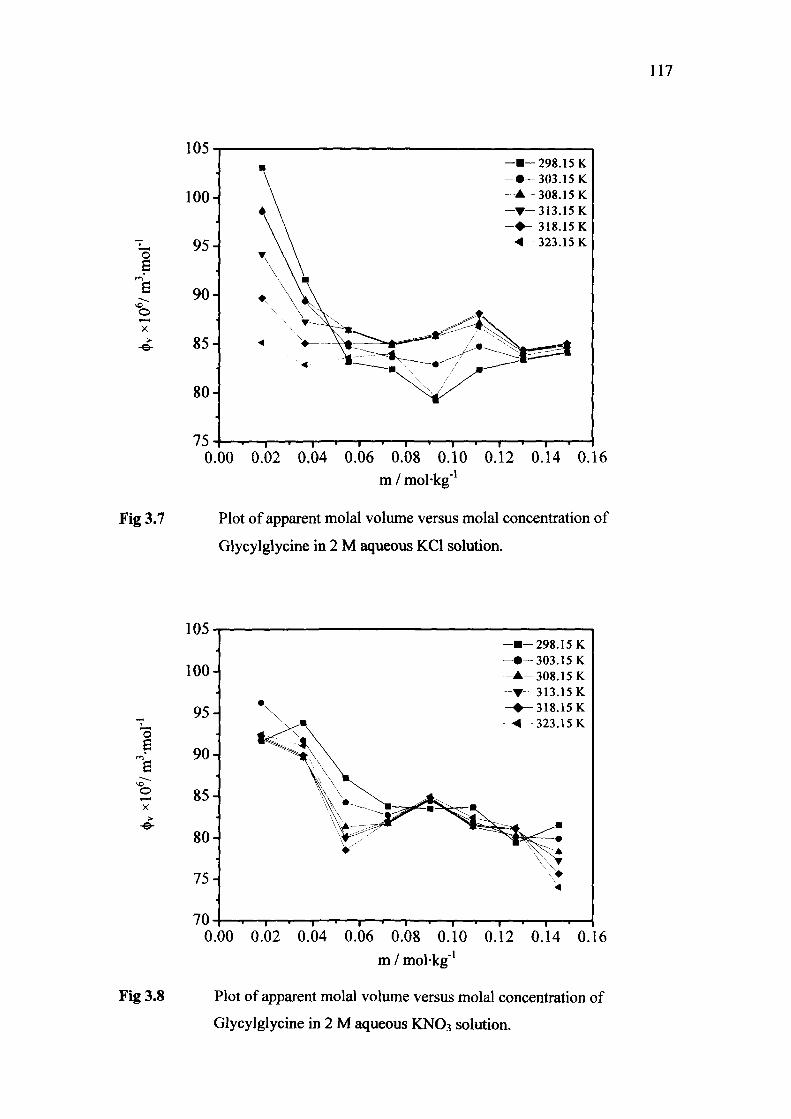
117
o 6
o X
> -e-
Fig 3.7
105
100
95
90
85
80
75
- • - 2 9 8 . 1 5 K - • - 3 0 3 . 1 5 K -A-308 .15 K - • - 3 1 3 . 1 5 K - • - 3 1 8 . 1 5 K —<-323.15 K
0.00 0.02 0.04 0.06 0.08 0.10 0.12 0.14 0.16 m / mol-kg"'
Plot of apparent molal volume versus molal concentration of
Glycylglycine in 2 M aqueous KCl solution.
S
o O X
-e-
105
100
95
90
85
80
Fig 3.8
75
70
-•-298.15 K -•-303.15 K -A-308.15 K -T-313.15 K -•--318.15K
323.15 K
0.00 0.02 0.04 0.06 0.08 0.10 0.12 0.14 0.16 m / molkg'^
Plot of apparent molal volume versus molal concentration of
Glycylglycine in 2 M aqueous KNO3 solution.
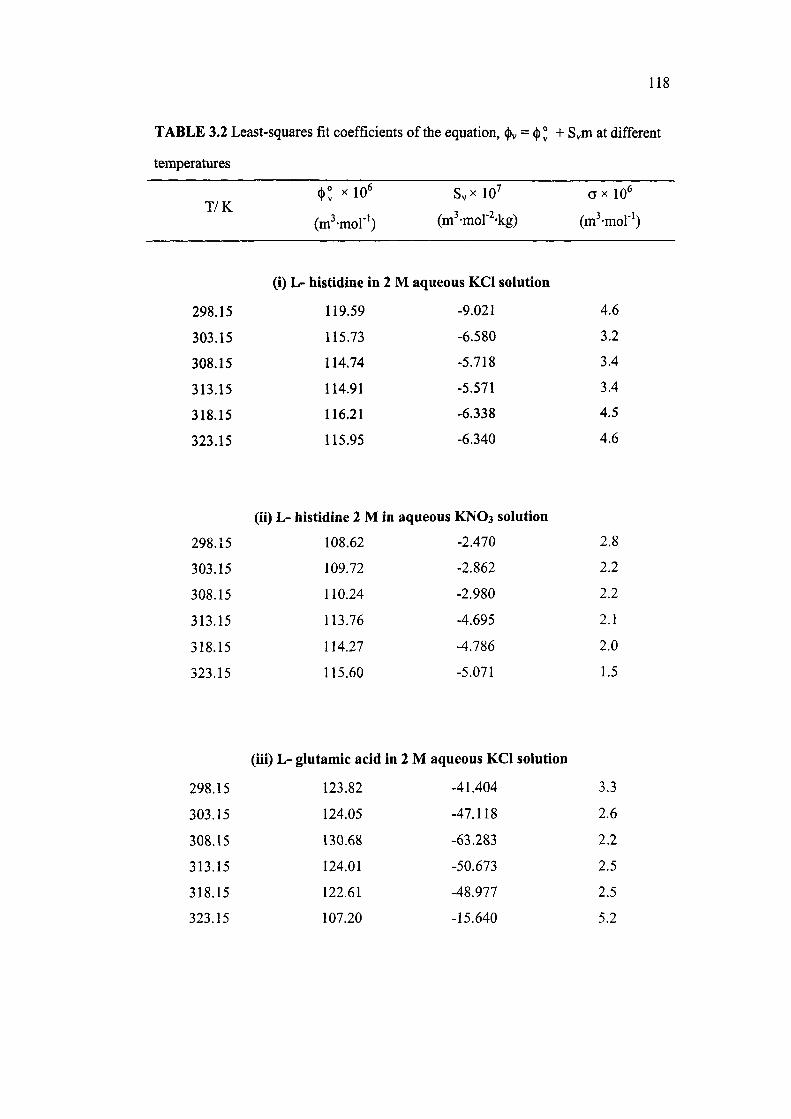
118
TABLE 3.2 Least-squares fit coefficients of the equation, v = <|)v + Sym at different
temperatures
T/K <^l X 10"
(m -mol"')
SvX 10'
(m^-mor 'kg)
a x 10"
(m^-mol'')
(i) L- histidine in 2 M aqueous KCl solution
298.15 119.59 -9.021 4.6
303.15 115.73 -6.580 3.2
308.15 114.74 -5.718 3.4
313.15 114.91 -5.571 3.4
318.15 116.21 -6.338 4.5
323.15 115.95 -6.340 4.6
(ii) L- histidine 2 M in aqueous KNO3 solution
298.15 108.62 -2.470 2.8
303.15 109.72 -2.862 2.2
308.15 110.24 -2.980 2.2
313.15 113.76 -4.695 2.1
318.15 114.27 -4.786 2.0
323.15 115.60 -5.071 1.5
(iii) L- glutamic acid in 2 M aqueous KCl solution
298.15 123.82 -41.404 3.3
303.15 124.05 -47.118 2.6
308.15 130.68 -63.283 2.2
313.15 124.01 -50.673 2.5
318.15 122.61 -48.977 2.5
323.15 107.20 -15.640 5.2
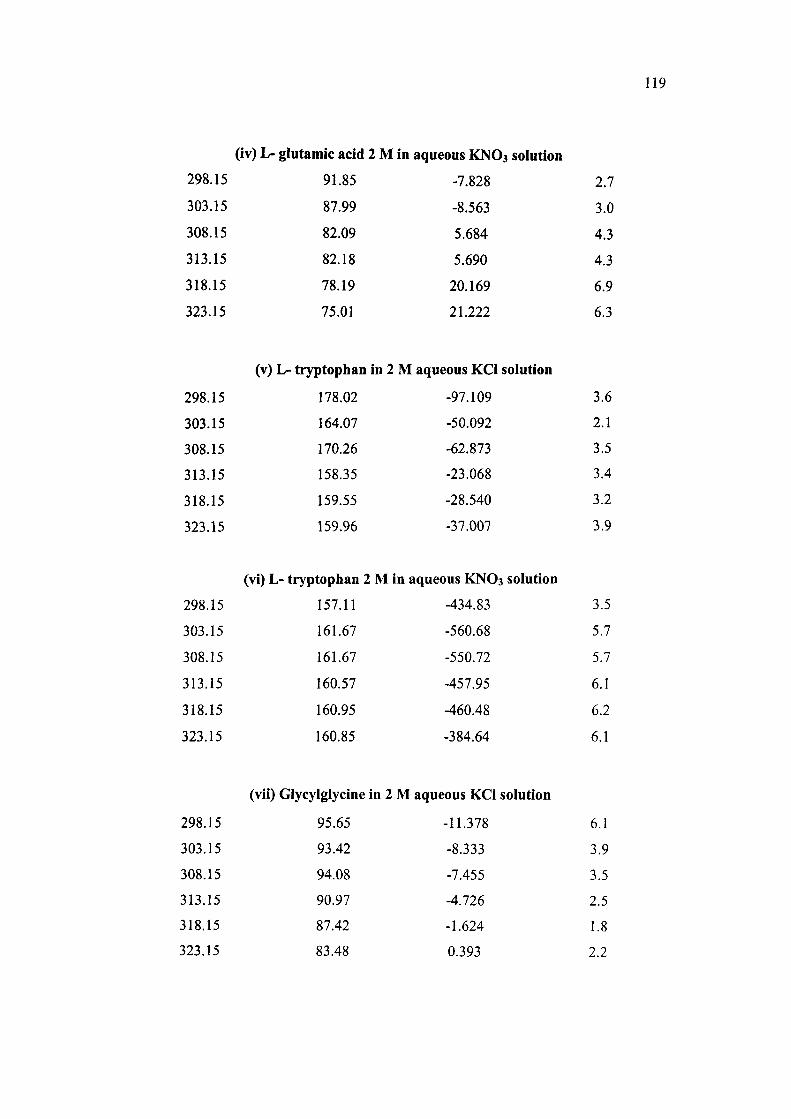
119
(iv) L- glutamic acid 2 M in aqueous KNO3 solution
298.15
303.15
308.15
313.15
318.15
323.15
91.85
87.99
82.09
82.18
78.19
75.01
-7.828
-8.563
5.684
5.690
20.169
21.222
2.7
3.0
4.3
4.3
6.9
6.3
(v) L- tryptophan in 2 M aqueous KCl solution
298.15 178.02 -97.109 3.6
303.15 164.07 -50.092 2.1
308.15 170.26 -62.873 3.5
313.15 158.35 -23.068 3.4
318.15 159.55 -28.540 3.2
323.15 159.96 -37.007 3.9
(vi) L- ttyptophan 2 M in aqueous KNO3 solution
298.15 157.11 -434.83 3.5
303.15 161.67 -560.68 5.7
308.15 161.67 -550.72 5.7
313.15 160.57 -457.95 6.1
318.15 160.95 -460.48 6.2
323.15 160.85 -384.64 6.1
(vii) Glycyiglycine in 2 M aqueous KCl solution
298.15 95.65 -11.378 6.1
303.15 93.42 -8.333 3.9
308.15 94.08 -7.455 3.5
313.15 90.97 -4.726 2.5
318.15 87.42 -1.624 1.8
323.15 83.48 0.393 2.2
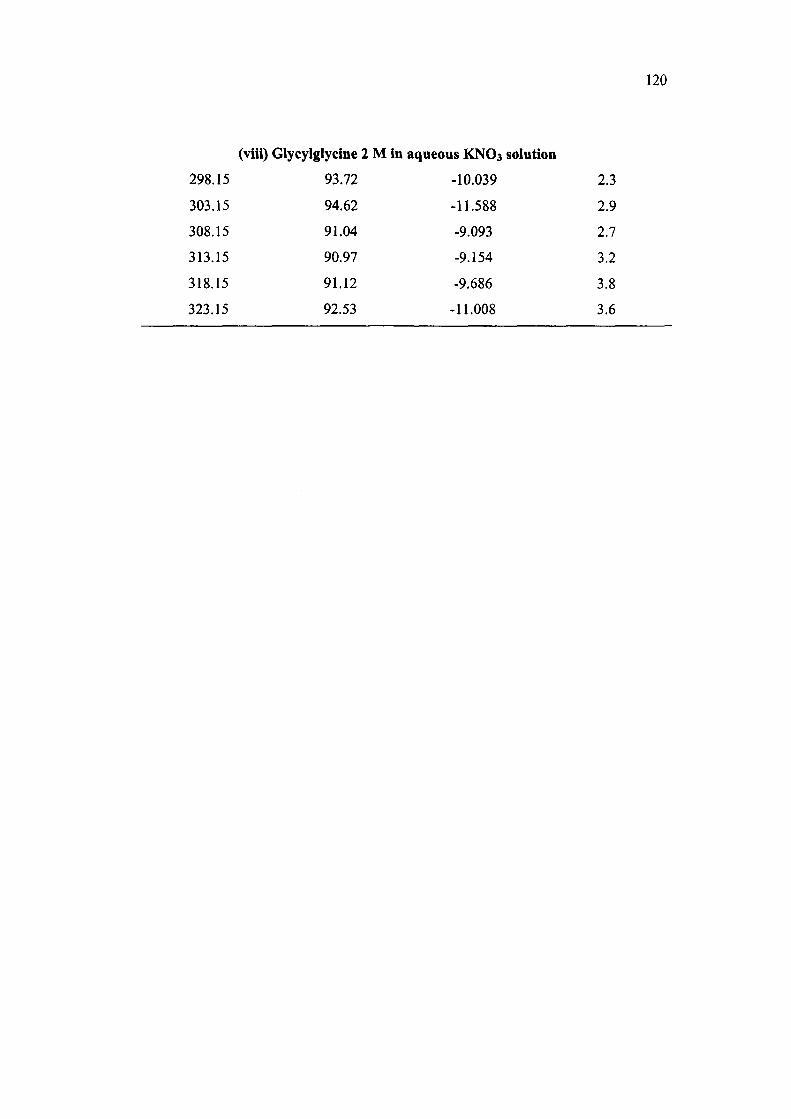
120
(viii) Glycylglycine 2 M in aqueous KNO3 solution
298.15 93.72 -10.039 2.3
303.15 94.62 -11.588 2.9
308.15 91.04 -9.093 2.7
313.15 90.97 -9.154 3.2
318.15 91.12 -9.686 3.8
323.15 92.53 -11.008 3.6

121
2M aqueous solution of KNO3 at all temperatures of study thereby showing the strong
solute-solvent interactions. The 0° values for L-histidine, L-glutamic acid, L-
tryptophan and glycylglycine in 2 M aqueous solution of KCl and 2 M aqueous
solution of KNO3 shows an irregular trend of variation with an increase in
temperature. At neutral pH, the amino acid and peptide molecules exist as zwitterions
in solutions [183,238-240,242]. The electrostriction of water molecules occurs near
the terminal groups of zwitterions, NHa" and COO". The presence of KCl and KNO3
may affect the hydration sphere of charged terminal groups of zwitterions. As a result
of K*-COO", Cr-NHj"^ and NOa'-NHs"^ interactions, the hydrated zwitterions may
relax water molecule to the bulk water which in turn, may cause an increase in the
volume. The increase in (t)° values with an increase in temperature may be attributed
to the volume expansion of hydrated zwitterions of amino acid/ peptide or reduction
in electrostriction. An increase in temperature might cause relax of water molecules
rather than their binding to charged terminal groups.
The (t)° values of L- histidine in 2 M aqueous KCl and 2 M aqueous KNO3
solutions at 298.15 K have been found to be 119.59 and 108.62 (cm^-mol"'),
respectively, while in aqueous medium it has been reported at 298.15 K as 98.81±0.04
[238] and 98.96±0.05 [239] (cm^-mol"'). It has been reported as 101.84±0.04 [238]
and 101.80±0.05 [239] (cm -mo!"') in 2ni aqueous NaCl solution and 98.68±0.06
[238] (cm''-mor') in 0.15m aqueous DMSO solution. The (j)" value of L- histidine in
2m aqueous NaCl + 0.15m DMSO solution has been reported [238] as 101.84±0.08
(cm' -mol'') at 298.15 K. The (j)" value of L-histidine in 0.20m aqueous
tetramethylammonium bromide at 298.15 K has been reported [328] as 107.112
(cm^-mol''). The (()° values of L- histidine in 2 M aqueous KCl and 2 M aqueous
KNO3 solutions at 308.15 K have been found to be 114.74 and 110.24 (cm'-mol"'),
respectively, while in aqueous medium at the same temperature it has been reported as
[322] 100.35±0.99 (cm^-mol"'). The (j)" values of L-glutamic acid in 2 M aqueous
KCl and 2 M aqueous KNO3 solutions at 298.15 K have been found to be 123.82 and
91.85 (cm -mol"'), respectively, whereas the <j)° value in aqueous medium at 298.15
has been reported as 89.64 [18] and 89.65±0.02 [142] (cm^-mol"'), respectively. It has
been reported [142] in 1.0m aqueous sodium acetate, 1.0m aqueous sodium

122
propionate and 0.5m aqueous sodium butyrate at 298.15 K, as 94.15±0.02,
95.24±0.01 and 95.46±0.01 (cra^-mol'') respectively, It has been reported [329] in
1.0m aqueous lithium acetate dehydrate, 1.0m aqueous magnesium acetate tetra-
hydrate and 1.0m aqueous calcium acetate at 298.15 K as 93.76±0.01, 95.08±0.01 and
94.57±0.01 (cm -mor ), respectively. The (j)" values of L- tryptophan in 2 M aqueous
KCl and 2 M aqueous KNO3 solutions at 298.15 K have been found to be 178.02 and
157.11 (cm^-mol"'), respectively, while (j)" values of D- tryptophan [269], L-
tryptophan [330,331] and DL- tryptophan [332] in aqueous medium at 298.15 K have
been reported as 143.91, (144.24, 143.38) and 143.8 (cm^-mol''), respectively. The
(|)° values of L- tryptophan in 2 M aqueous KCl and 2 M aqueous KNO3 solutions at
303.15 K have been found to be 164.07 and 161.67 (cm^-mol''), respectively whereas
the ^l value of L-tryptophan in 0.005m aqueous ZnCh at 303.15 K, has been
reported [333] as 161.59 (cm^-mol"').
The (|)° values of glycylglycine in 2 M aqueous KCl and 2 M aqueous KNO3
solutions at 298.15 K have been found to be 95.65 and 93.72 (cm^-mol"'),
respectively, while in aqueous medium at 298.15 K it has been reported as 76.28±0.02
[238] and 76.36±0.02 (cm -mol"') [239]. It has been reported in 2.0117m aqueous KCl
solution as 80.54±0.025 (cm -mol"') [240], and in 2m aqueous NaCl as 80.61±0.05
(cm -mol"') [238] and 80.16±0.04 (cm -mol"') [239]. The (|)" values of glycylglycine
in 0.15m aqueous DMSO and 2m aqueous NaCl + 0.15m aqueous DMSO, have been
reported [238] as 76.26±0.02 and 80.60±0.03 (cm^-mol"'), respectively. It has been
reported in 1.5m aqueous sodium sulphate solution at 298.15 K as 84.38 (cm -mol")
[242]. The (|)° values of glycylglycine in 2 M aqueous KCl and 2 M aqueous KNO3
solutions at 308.15 K have been found to be 94.08 and 91.04 (cm^mol"'),
respectively. The (j)" value of glycylglycine has been reported at 308.15 K in aqueous
medium as 77.10 (cm^-mol'') [238], whereas it has been reported at 308.15 K in
2.0117m aqueous KCl solution as 8].34±0.043 (cm -mol"') [240]. G. Lin et al. [241]
reported (j)" values of glycylglycine in 0.4797m aqueous NaF, 2.08221m aqueous
NaCl and 1.9809m aqueous NaBr at 298.15 K as 78.22±0.03, 80.066±0.066 and
79.94±0.02 (cm^-mol"'), respectively , and at 308.15 K these have been reported as
78.87±0.04, 81.17±0.03 and 80.62±0.01 (cm^-mor'), respectively. The observed
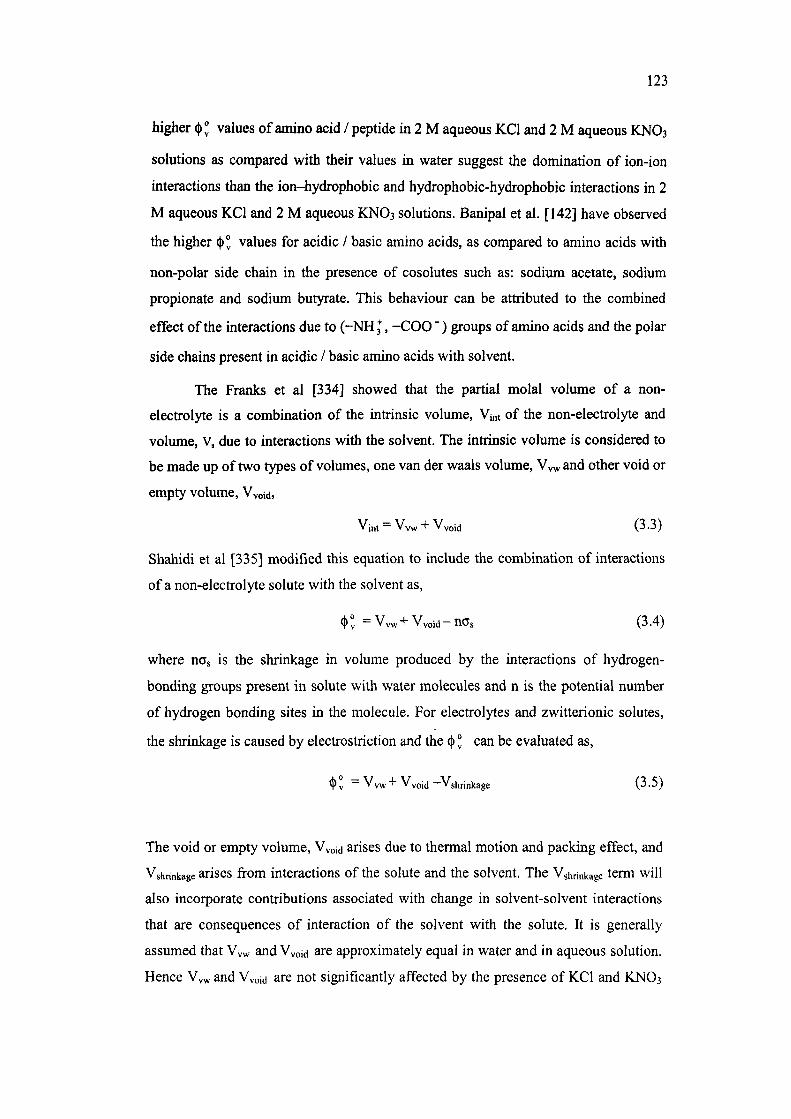
123
higher <|)° values of amino acid /peptide in 2 M aqueous KCl and 2 M aqueous KNO3
solutions as compared with their values in water suggest the domination of ion-ion
interactions than the ion-hydrophobic and hydrophobic-hydrophobic interactions in 2
M aqueous KCl and 2 M aqueous KNO3 solutions. Banipal et al. [142] have observed
the higher (j)" values for acidic / basic amino acids, as compared to amino acids with
non-polar side chain in the presence of cosolutes such as: sodium acetate, sodium
propionate and sodium butyrate. This behaviour can be attributed to the combined
effect of the interactions due to (-NH3, -COO") groups of amino acids and the polar
side chains present in acidic / basic amino acids with solvent.
The Franks et al [334] showed that the partial molal volume of a non-
electrolyte is a combination of the intrinsic volume, Vint of the non-electrolyte and
volume, Vs due to interactions with the solvent. The intrinsic volume is considered to
be made up of two types of volumes, one van der waals volume, Vvwand other void or
empty volume, Vvoid,
Vi„t = Vvw + Vvoid (3.3)
Shahidi et al [335] modified this equation to include the combination of interactions
of a non-electrolyte solute with the solvent as,
(t>: =Vvw+Vvoid-nas (3.4)
where nOs is the shrinkage in volume produced by the interactions of hydrogen-
bonding groups present in solute with water molecules and n is the potential number
of hydrogen bonding sites in the molecule. For electrolytes and zwitterionic solutes,
the shrinkage is caused by electrostriction and the (j) ° can be evaluated as,
<!> V = Vvw + Vvoid -Vshrinkage ( 3 . 5 )
The void or empty volume, Vvoid arises due to thermal motion and packing effect, and
Vshrinkage ariscs from interactions of the solute and the solvent. The Vghnnkagc term will
also incorporate contributions associated with change in solvent-solvent interactions
that are consequences of interaction of the solvent with the solute. It is generally
assumed that Vvw and Vvoid are approximately equal in water and in aqueous solution.
Hence Vvw and Vvoid are not significantly affected by the presence of KCl and KNO3

124
so that the positive volume of transfer for L-histidine, L-glutaraic acid, L-tryptophan
and glycylglycine can be rationalized in terms of a decrease in the volume of
shrinkage. In other words, some water molecules in the vicinity of said amino acid/
peptide molecule may be released to the bulk water in the presence of KCI and KNO3.
This brings about an increase in the volume of solvent, thereby reducing the
interactions between the amino acid/ peptide molecule and water molecules. At
infinite dilution, solute-solute interactions vanish, therefore, the (j)" provides an
information regarding solute-solvent interactions [336]. The information concerning
solute - solute interactions is given by Sy. The trends of variation of Sy of the amino
acid / peptide with temperature in both the solvents are irregular. The positive values
of Sv for the studied amino acid/ peptide in 2 M aqueous KCI and 2 M aqueous KNO3
solutions at all the temperatures of study indicate the presence of stronger ion-ion and
zwitterion-zwitterion interactions than those of apolar-apolar interactions, varying
with the change of temperature, nature of amino acid / peptide molecule and the
nature of the solvent. The positive partial molal volumes of all the amino acids and
peptide at the experimental temperatures indicate the presence of strong K'^-COO',
CI ~ -NH 3 and NH 3 -NO J interactions at infinite dilution. The negative values of Sv
shows that the operative interactions are week in nature.
The apparent molal isentropic compressibilities have been calculated using the
relation,
(^ = [ { 1 0 0 0 (Ks - Ko)} /mpo] + Ks(|)v ( 3 . 6 )
In the above mentioned equation, m is the molality of the solution, po is the density of
solvent (kg-m' ), and KS (= 1/ p-u ) and KQ (= 1/ p-uo ) are the isentropic
compressibilities of solution and solvent, respectively. The computed values of (t)k of
the amino acids and peptide in 2 M aqueous KCI and 2 M aqueous KNO3 systems as
functions of solute concentration and temperature: 298.15, 303.15, 308.15, 313.15,
318.15 and 323.15 K have been listed in the Table 3.3. The plots of (j)k versus solute
concentration have been represented in Figs 3.9-3.16. The values of (^ have been
least-square fitted to the equation.
(|)k = (|)° +Skm (3.7)
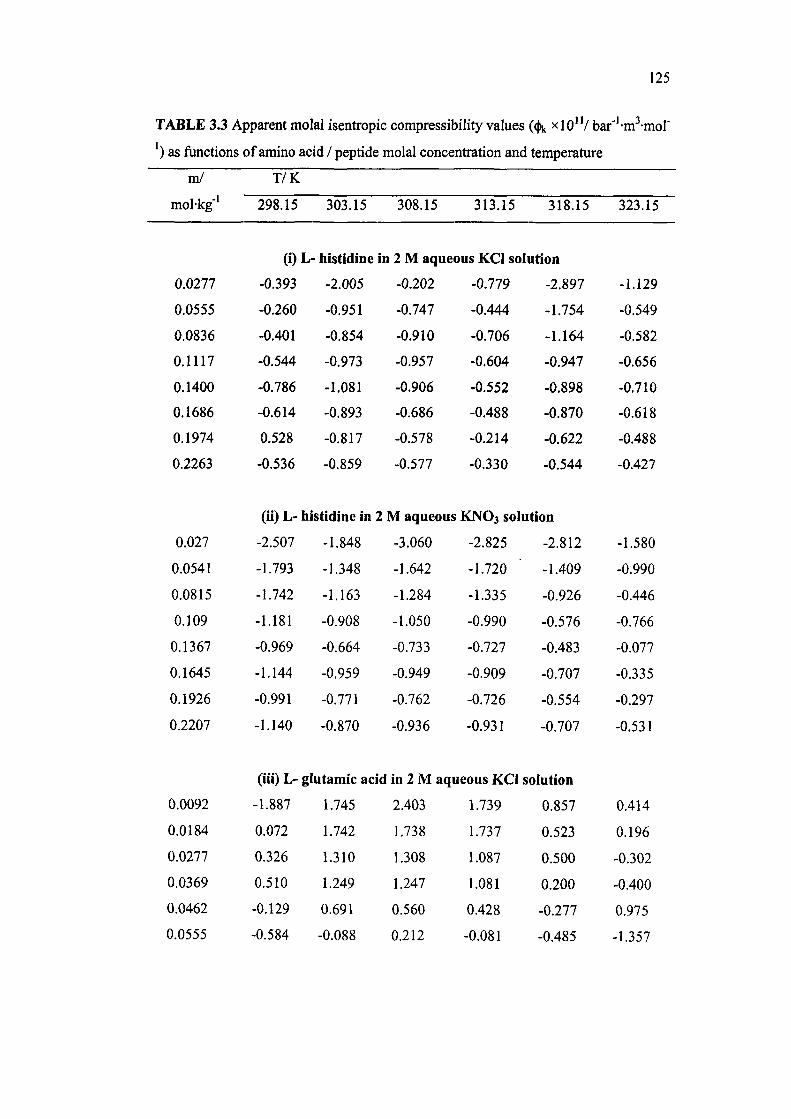
125
TABLE 3.3 Apparent molal isentropic compressibility values {^ xlo'V bar'''m^-mor
') as functions of amino acid / peptide molal concentration and temperature
m/
mol-kg''
0.0277
0.0555
0.0836
0.1117
0.1400
0.1686
0.1974
0.2263
0.027
0.0541
0.0815
0.109
0.1367
0.1645
0.1926
0.2207
T/K
298.15
(i)L-
-0.393
-0.260
-0.401
-0.544
-0.786
-0.614
0.528
-0.536
303.15
histidine
-2.005
-0.951
-0.854
-0.973
-1.081
-0.893
-0.817
-0.859
(ii) L- histidine in
-2.507
-1.793
-1.742
-1.181
-0.969
-1.144
-0.991
-1.140
-1.848
-1.348
-1.163
-0.908
-0.664
-0.959
-0.771
-0.870
308.15 313.15 318.15
in 2 M aqueous KCl solution
-0.202
-0.747
-0.910
-0.957
-0,906
-0.686
-0.578
-0.577
2 M aqueous
-3.060
-1.642
-1.284
-1.050
-0.733
-0.949
-0.762
-0.936
-0.779
-0.444
-0.706
-0.604
-0.552
-0.488
-0.214
-0.330
-2.897
-1.754
-1.164
-0.947
-0.898
-0.870
-0.622
-0.544
K N O 3 solution
-2.825
-1.720
-1.335
-0.990
-0.727
-0.909
-0.726
-0.931
-2.812
-1.409
-0.926
-0.576
-0.483
-0.707
-0.554
-0.707
323.15
-1.129
-0.549
-0.582
-0.656
-0.710
-0.618
-0.488
-0.427
-1.580
-0.990
-0.446
-0.766
-0.077
-0.335
-0.297
-0.531
(iii) L- glutamic acid in 2 M aqueous KCl solution
0.0092
0.0184
0.0277
0.0369
0.0462
0.0555
-1.887
0.072
0.326
0.510
-0.129
-0.584
1.745
1.742
1.310
1.249
0.691
-0.088
2.403
1.738
1.308
1.247
0.560
0.212
1.739
1.737
1.087
1.081
0.428
-0.081
0.857
0.523
0.500
0.200
-0.277
-0.485
0.414
0.196
-0.302
-0.400
0.975
-1.357
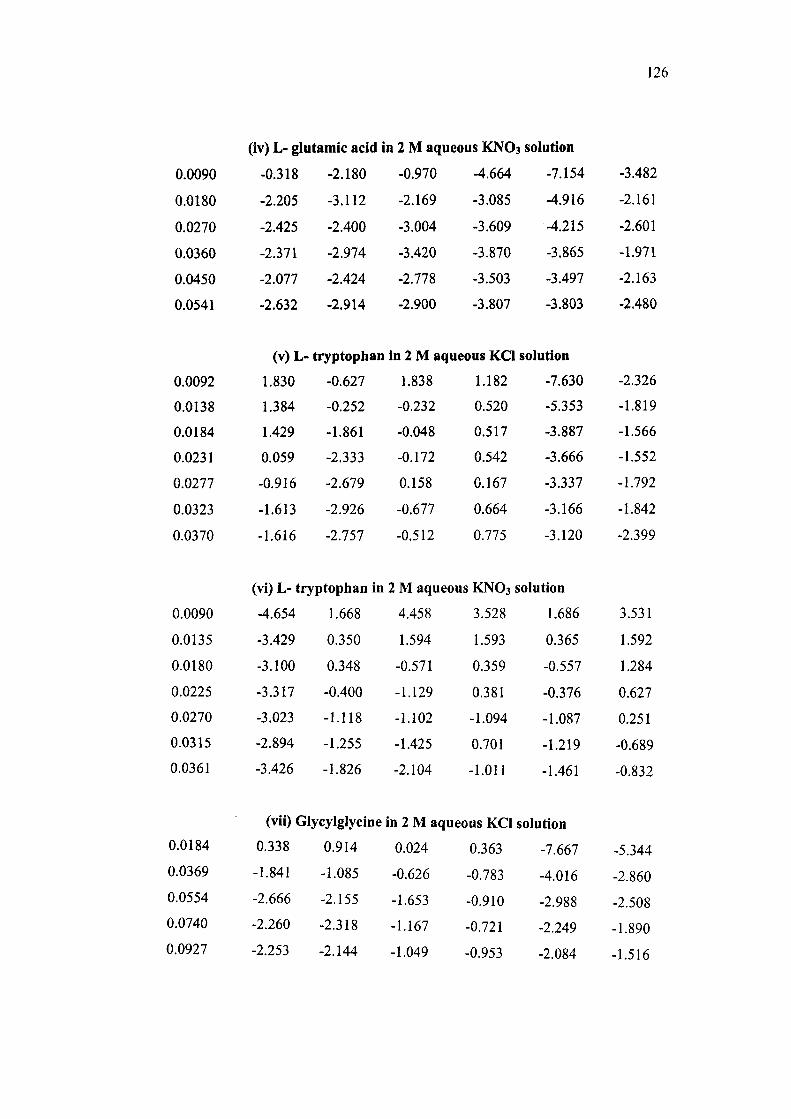
126
0.0090
0.0180
0.0270
0.0360
0.0450
0.0541
(iv) L- glutamic acid
-0.318
-2.205
-2.425
-2.371
-2.077
-2.632
-2.180
-3.112
-2.400
-2.974
-2.424
-2.914
in 2 M aqueous KNO3 solution
-0.970
-2.169
-3.004
-3.420
-2.778
-2.900
-4.664
-3.085
-3.609
-3.870
-3.503
-3.807
-7.154
-4.916
-4.215
-3.865
-3.497
-3.803
-3.482
-2.161
-2.601
-1.971
-2.163
-2.480
(v) L- tryptophan in 2 M aqueous KCl solution
0.0092 1.830 -0.627 1.838 1.182 -7.630 -2.326
0.0138 1.384 -0.252 -0.232 0.520 -5.353 -1.819
0.0184 1.429 -1.861 -0.048 0.517 -3.887 -1.566
0.0231 0.059 -2.333 -0.172 0.542 -3.666 -1.552
0.0277 -0.916 -2.679 0.158 0.167 -3.337 -1.792
0.0323 -1.613 -2.926 -0.677 0.664 -3.166 -1.842
0.0370 -1.616 -2.757 -0.512 0.775 -3.120 -2.399
(vi) L- tryptophan in 2 M aqueous KNO3 solution
0.0090
0.0135
0.0180
0.0225
0.0270
0.0315
0.0361
-4.654
-3.429
-3.100
-3.317
-3.023
-2.894
-3.426
1.668
0.350
0.348
-0.400
-1.118
-1.255
-1.826
4.458
1.594
-0.571
-1.129
-1.102
-1.425
-2.104
3.528
1.593
0.359
0.381
-1.094
0.701
-1.011
1.686
0.365
-0.557
-0.376
-1.087
-1.219
-1.461
3.531
1.592
1.284
0.627
0.251
-0.689
-0.832
(vii) Glycylglycine in 2 M aqueous KCl solution
0.0184
0.0369
0.0554
0.0740
0.0927
0.338
-1.841
-2.666
-2.260
-2.253
0.914
-1.085
-2.155
-2.318
-2.144
0.024
-0.626
-1.653
-1.167
-1.049
0.363
-0.783
-0.910
-0.721
-0.953
-7.667
-4.016
-2.988
-2.249
-2.084
-5.344
-2.860
-2.508
-1.890
-1.516

127
0.1114
0.1302
0.1491
-2.016
-1.682
-1.541
-1.683
-1.536
-1.303
-0.917
-1.099
-0.975
-1.145
-1.245
-1.129
-1.723
-1.709
-1.453
-1.250
-1.136
-1.168
(viii) Glycylglyclne in 2 M aqueous KNO3 solution
0.0180
0.0360
0.0541
0.0722
0.0904
0.1087
0.1270
0.1454
-3.736
-1.926
-1.627
-1.713
-1.962
-1.698
-1.900
-1.724
-1.032
-0.897
-1.899
-1.772
-1.967
-1.883
-1.767
-1.710
-4.121
-1.975
-1.796
-1.842
-1.680
-1.773
-1.756
-1.933
-4.103
-2.885
-2.510
-2.064
-1.857
-1.919
-1.835
-2.234
-5.006
-2.418
-2.616
-2.061
-2.036
-2.067
-2.090
-2.352
-4.992
-2.412
-2.504
-2.059
-2.214
-1.860
-1.703
-2.137

128
-e-
Fig3.9
2-1
1-
0-
1-
2-
3-
4-
A.
<4
/ •
•
—•-—.
• • — •
•"'
T —1 1 1 r
^ ^
—•—298.15K - • - 3 0 3 . 1 5 K - A - 3 0 8 . 1 5 K - T - 3 1 3 . 1 5 K —•—318.15 K —<-323.15 K
1 '
0.00 0.05 0.10 0.15 m / molkg"'
0.20 0.25
Plot of apparent molal isentropic compressibility versus molal
concentration of L- histidine in 2 M aqueous KCI solution.
o
13 x>
"o X
Fig 3,10
0-
• 1 -
-2-
-3-
0.00 0.05 0.10 0.15
m / molkg"^
-•-298.15 K -•-303.15 K - A ~ 308.15 K -•-313.15 K —•-318.15 K —4-323.15 K T
0.20 0.25
Plot of apparent molal isentropic compressibility versus molal
concentration of L- histidine in 2 M aqueous KNO3 solution.

129
o B
o X
-e-
Fig3.11
4n
3-
2-
1-
0-
1-
2-•
3-•
4-
5-
•. . .
4 - "" "--•
' 1 —
~~~ ~ ~*
' r-
- • - 2 9 8 . 1 5 K - • - 3 0 3 . 1 5 K - A - 3 0 8 . 1 5 K - • - 3 1 3 . 1 5 K —•-318.15K --< 323.15 K
0.01 0.02 0.03 m / molkg
0.04 1
0.05 0.06
Plot of apparent molal isentropic compressibility versus molal
concentration of L- glutamic acid in 2 M aqueoxis KCl solution.
o S
X5
O
X
Fig 3.12
0-
-2-
-4-
-6-
-8-
•10 0.01
- • -298 .15 K - • -303 .15 K -A-308.15 K - • -313 .15 K - • -318 .15K -^-323.15 K
0.02 0.03 0.04 T
0.05 0.06 m / molkg"
Plot of apparent molal isentropic compressibility versus molal
concentration of L- glutamic acid in 2 M aqueous KNO3 solution.
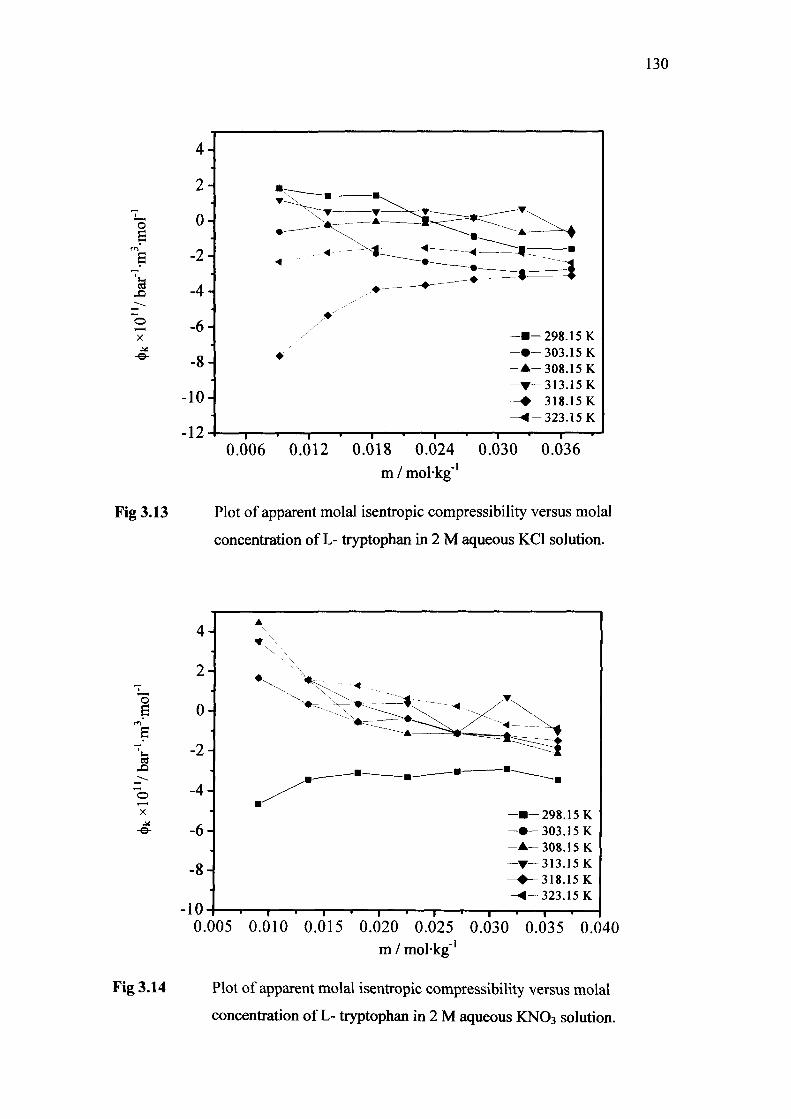
130
1
B
E
o X
-e-
4-
2-
0-
-2-
-4-
-6-
-8-
-10-
-12-
Fig 3.13
- • -
4
- • - 2 9 8 . 1 5 K - • - 3 0 3 . 1 5 K -A~ 308.15 K - • - 3 1 3 . 1 5 K -•—318.15K -4 -323 .15 K
0.006 0.012 0.018 0.024 0.030 0.036 m / mol-kg"'
Plot of apparent molal isentropic compressibility versus molal
concentration of L- tryptophan in 2 M aqueous KCl solution.
I
X)
o X
Fig 3.14
4-
2-
0-
-2-
-4-
-6-
-8-
-10
-•-298.15 K -•-303.15 K -A-308.15 K -T-313.15 K —•-318.15K —<- 323.15 K
0.005 0.010 0.015 0.020 0.025 0.030 0.035 0.040 m / mol-kg"'
Plot of apparent molal isentropic compressibility versus molal
concentration of L- tryptophan in 2 M aqueous KNO3 solution.
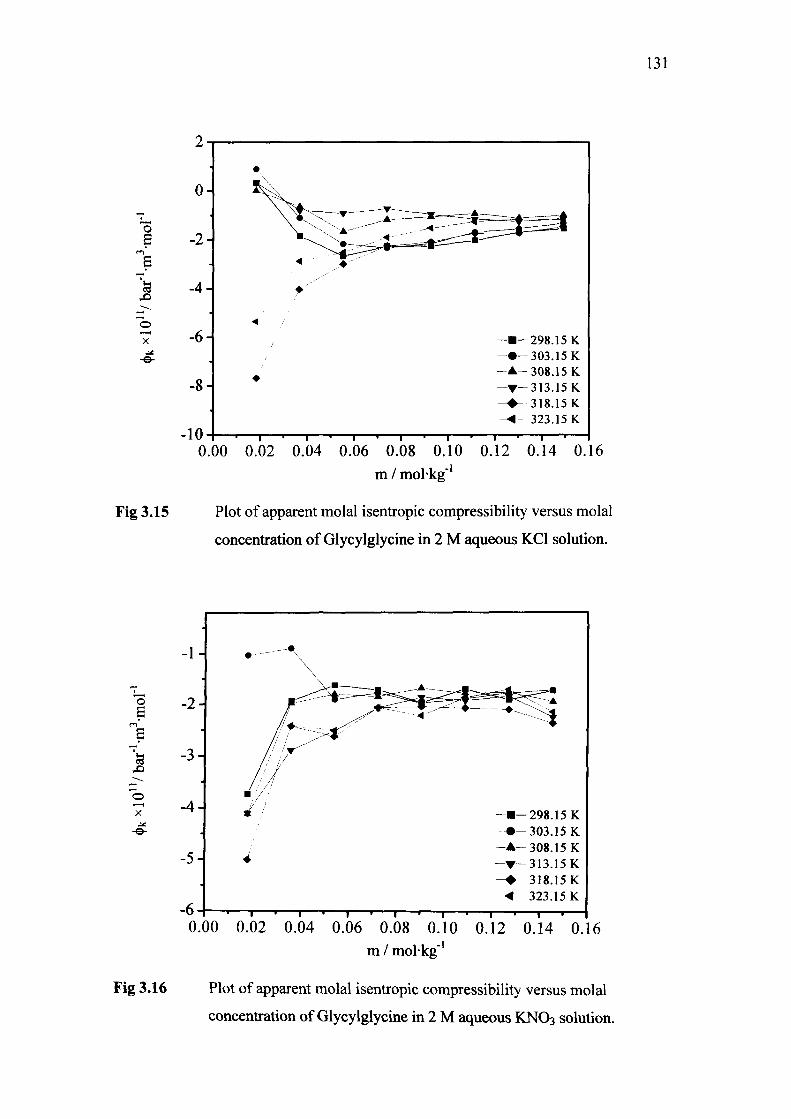
131
o
a
o X
Fig 3.15
0-
-2-
-4-
-6-
-8-
•10
-•-298.15 K -•-303.15 K -A-308.15 K -T-313.15 K -•-318.15K —^-323.15 K
I I I I I I I I I I I I I I I
0.00 0.02 0.04 0.06 0.08 0.10 0.12 0.14 0.16
m / molkg"'
Plot of apparent molal isentropic compressibility versus molal
concentration of Glycylglycine in 2 M aqueous KCl solution.
X
-e-
Fig 3.16
-1
-2-
-3-
-4-
-5-
-•-298.15 K -•-303.15 K -A-308.15 K -•-313.15 K -•-318.15K -^-323.15 K
0.00 0.02 0.04 0.06 0.08 0.10 0.12 0.14 0. 16 m / mol-kg"^
Plot of apparent molal isentropic compressibility versus molal
concentration of Glycylglycine in 2 M aqueous KNO3 solution.

132
where 0^ is the apparent molal isentropic compressibility at infinite dilution which is
also referred as partial molal isentropic compressibility, and is a measure of solute-
solvent interactions in solutions.
The ^l and Sk values have been listed in Table 3.4. The partial molal
isentropic compressibilities of L- histidine in 2M aqueous KCl and 2M aqueous
KNO3 solutions at 298.15 K have been found to be -0.4863x10"" and -2.2567x10""
(bar"'-m''-mor'), respectively, while in aqueous medium it has been reported at 298.15
K as -3.484x10"" [269], -3.25x10"" [320] and -2.96x10"" [233] (bar"'-m^-mor'). The
if I values of L- histidine in 2 M aqueous KCl and 2M aqueous KNOj solutions at
308.15 K have been found to be -0.642x10"" and -2.389x10"" (bar"'-m^mor'),
respectively, while in aqueous medium it has been reported at the same temperature as
-2.59x10"" [320], -2.68x10"" [233] (bar'^V-mol"'). The ^l values of L-glutamic
acid in 2 M aqueous KCl and 2 M aqueous KNO3 solutions at 298.15 K have been
found to be -0.888x10"" and -0.893x10"" (baf'-m^-mol"'), respectively, whereas the
^l values in aqueous medium at 298.15, have been reported as -3.917x10" [269], -
2.95x10"" [320] and -2.96x10'" (bar"'-m^-mor'). The (|)° values of L-glutamic acid
in 2 M aqueous KCl and 2 M aqueous KNO3 solutions at 318.15 K have been found to
be 1.158x10"" and -6.7073x10"" (bar"'-m^-mor'), respectively, while at the same
temperature the (^ I values of L-glutamic acid monosodium in aqueous medium has
been reported as [233] -7.00x10"" (bar"'-m^-mor'). The (^l values of L- tryptophan
in 2 M aqueous KCl and 2 M aqueous KNO3 solutions at 298.15 K have been found to
be 3.402x10"" and -4.265x10"" (bar''-m^-mol"'), respectively, while <j)° values of L-
tryptophan in aqueous medium have been reported at 298.15 K as -3.064x10"" [330],
-3.324x10"" [269], -3.05x10"" [320] and -3.449x10"" [331] (bar"'-m^-mol"'). The (j)"
values of glycylglycine in 2 M aqueous KCl and 2 M aqueous KNO3 solutions at
298.15 K have been found to be -1.191x10"" and -2.766x10"" (baf'-m^-mol"')
respectively, while in aqueous medium at 298.15 K it has been reported as -3.69x10""
[88], -3.878x10"" [242] and -3.591x10"" (bar"'-m -moI"') [152]. The (|)° values of
glycylglycine in 1.5m aqueous sodium sulphate solution at 298.15 K, has been
reported [242] as -1.279x10"" (bar"'-m^-mor').
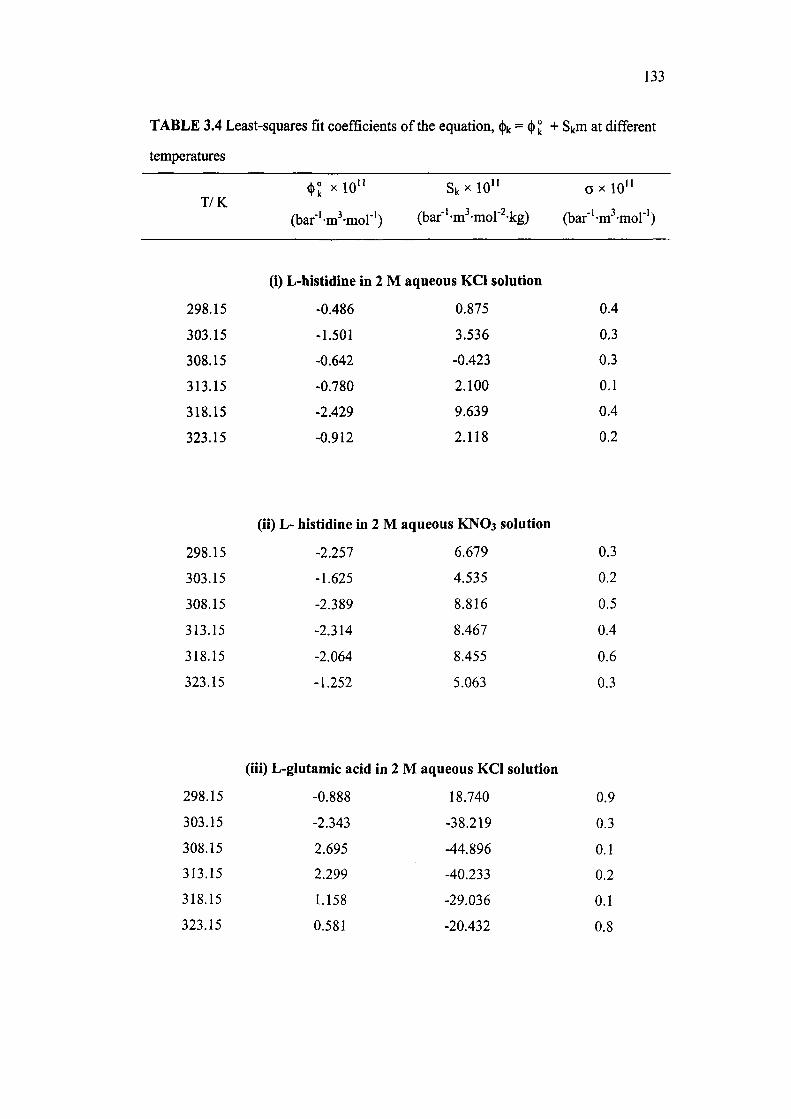
133
TABLE 3.4 Least-squares fit coefficients of the equation, (t)k = <|)k + Skm at different
temperatures
T/K ^l X 10"
(baf'-m^-mor')
Sk X 10"
(bar''-m^-mor^-kg)
o x 10"
(bar-'-m^-mor")
(i) L-histidine in 2 M aqueous KCI solution
298.15 -0.486 0.875 0.4
303.15 -1.501 3.536 0.3
308.15 -0.642 -0.423 0.3
313.15 -0.780 2.100 0.1
318.15 -2.429 9.639 0.4
323.15 -0.912 2.118 0.2
(11) L- histldlne in 2 M aqueous KNO3 solution
298.15 -2.257 6.679 0.3
303.15 -1.625 4.535 0.2
308.15 -2.389 8.816 0.5
313.15 -2.314 8.467 0.4
318.15 -2.064 8.455 0.6
323.15 -1.252 5.063 0.3
(ill) L-glutamlc acid in 2 M aqueous KCI solution
298.15 -0.888 18.740 0.9
303.15 -2.343 -38.219 0.3
308.15 2.695 -44.896 0.1
313.15 2.299 -40.233 0.2
318.15 1.158 -29.036 0.1
323.15 0.581 -20.432 0.8
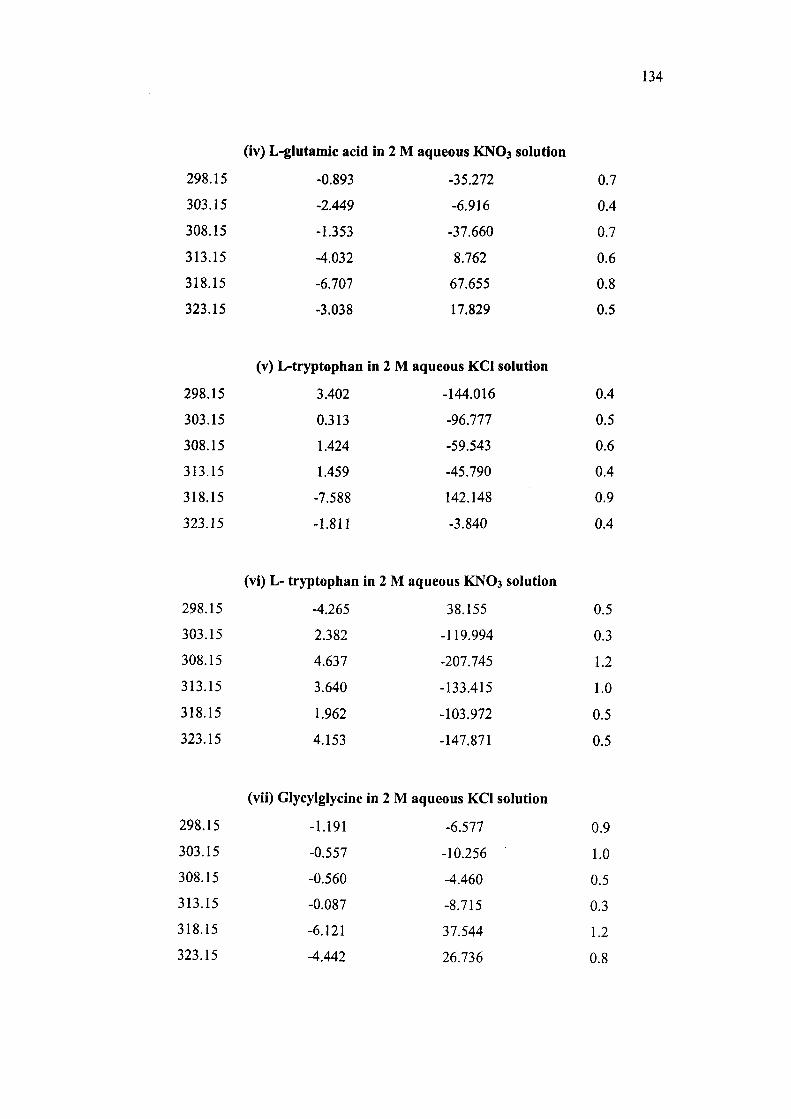
134
(iv) L-glutamic acid in 2 M aqueous KNO3 solution
298.15 -0.893 -35.272 0.7
303.15 -2.449 -6.916 0.4
308.15 -1.353 -37.660 0.7
313.15 -4.032 8.762 0.6
318.15 -6.707 67.655 0.8
323.15 -3.038 17.829 0.5
(v) L-tryptophan in 2 M aqueous KCI solution
298.15 3.402 -144.016 0.4
303.15 0.313 -96.777 0.5
308.15 1.424 -59.543 0.6
313.15 1.459 -45.790 0.4
318.15 -7.588 142.148 0.9
323.15 -1.811 -3.840 0.4
(vi) L- tryptophan in 2 M aqueous KNO3 solution
298.15 -4.265 38.155 0.5
303.15 2.382 -119.994 0.3
308.15 4.637 -207.745 1.2
313.15 3.640 -133.415 1.0
318.15 1.962 -103.972 0.5
323.15 4.153 -147.871 0.5
(vii) Glycylglycine in 2 M aqueous KCI solution
298.15 -1.191 -6.577 0.9
303.15 -0.557 -10.256 1.0
308.15 -0.560 -4.460 0.5
313.15 -0.087 -8.715 0.3
318.15 -6.121 37.544 1.2
323.15 -4.442 26.736 0.8

135
(viii) Glycylglycine in 2 M aqueous KNO3 solution
298.15 -2.766 8.964 0.6
303.15 -1.125 -6.027 0.3
308.15 -2.993 10.644 0.7
313.15 -3.050 13.249 0.5
318.15 -3.743 14.268 0.8
323.15 -3.830 16.508 0.8

136
The ^l values of L-histidine, L-glutamic acid, L-tryptophan and
glycylglycine in 2 M aqueous of KCl and 2 M aqueous KNO3 solutions are higher
than those of corresponding values in aqueous medium, whereas for L-histidine, L-
glutamic acid, L-tryptophan and glycylglycine in 2 M aqueous KNO3 solution, the
^l values are quite close to the corresponding values in aqueous medium. The
similar trends of variation of ^l have been reported by M. Yasuda et al. for some
amino acids in 2m aqueous lithium chloride, 2m aqueous sodium chloride and 2m
aqueous potassium chloride solutions [208] and also reported by Banipal et al for
some amino acids in IM aqueous sodium chloride and IM aqueous glucose solutions
[21]. These values apparently indicate a large ordering effect of solute molecules on 2
M aqueous KCl and 2 M aqueous KNO3 solutions. A simple model can express the
partial molal isentropic compressibility of the amino acid / peptide molecule as,
r, =r, (int) + (t)°, (elect) (3.8)
where (j) (int) is the intrinsic partial molal isentropic compressibility of amino acid /
peptide molecule and ^l (elect) is the electrostriction partial molal isentropic
compressibility due to hydration of the amino acid / peptide molecule. The (j) (int)
for the said amino acids and peptide can be assumed as almost zero as the value of
<^l (int) is expected to be very small [269]. Thus, (j) may be considered to represent
^l (elect). The reported values of the said amino acids /peptide in water are negative.
The negative ^l seems due to the hydration of the charged centers of the amino acid
/ peptide as the hydrated water appear to be less compressible than that the bulk water.
The values of Sk for all systems under study are found to be negative, which suggest
the presence of essentially weak zwitterions-zwitterions interactions in the systems.

CHAPTER-IV
Viscometric Studies of L-histidine-/L-glutamic acid-/L-
tryptophan-/ Glycylglycine - Aqueous KCI/KNO3
Systems
INTRODUCTION
Viscosity measurement is useful to study the state of solvation of solute in a
solution [224]. Viscometric studies have been used to draw important conclusions
regarding various types of interactions occurring in a solution [229,337,338] and are
of great help in understanding the nature of action of metal ions with amino acid /
peptide molecule. A number of authors have measured the viscosities of proteins,
amino acids and peptides in aqueous [7,10,184,187,188], aqueous electrolytes
[43,175,177,178,185,208,339], mixed aqueous solutions, [57,190,191,340,341]; and
pure and mixed organic solvent systems [177,179,180,192-194,151]. The viscosity
and its derived parameters such as relative viscosity, specific viscosity and intrinsic
viscosity provide an important information about size and state of solvation of
molecules in the solution [224].
The viscosity data may also be analyzed in the light of Jones-Dole equation [203] in
order to obtain the viscosity coefficients A and B, which prove to be useful
coefficients in estimating the interactions operative in the solutions. A number of
researchers have determined the viscosity B-coefficients of amino acid and peptide
molecules in aqueous medium [22,176,189,204,212,220,226], aqueous electrolytes
[189,208,211,214-216,220], and organic solvent systems [179,193,212,217-219]. The
degree of 'structure' of structural solvents viz., water appreciably affected by addition
of a solute molecule having or not having a primary solvation sheath. A 'structure
building' solute lowers the average effective kinetic energy of the solvent molecules,
which in turn, increases the viscosity of the solution and leads to higher B-coefficient
values [174]. Solute which disrupt the hydrogen bonded water aggregate structure in
their vicinity and create a region of lower viscosity, have lower B-coefficient values
which causes an increase in the kinetic energy [224] while the solute which enforce
water structure, e.g., by hydrophobic hydration have relatively large B-coefficient
which decreases as the temperature is increased [225]. Amino acid and peptide
molecules show both hydrophilic and hydrophobic behavior in interaction with
solvents [343]. Hydrophobic side chains exert an ordering effect, whereas polar and
ionic side chains of amino acid and peptide molecule exert a disordering effect on the
solvent structure [344]. The sign of dB/dT appears to be a more straightforward
indicator of structure-breaking or -making ability than the sign or size of the B-
coefficient. Features of solute effects on solvent structure ought to be temperature
dependent. A positive dB/dT indicates a structure-breaking ion or molecule, and a
138
negative sign, a structure making one. In general, the dB/dT is negative for structure-
maker and positive for structure-breaker solutes in solution [201,226]. A literature
survey shows that viscometric investigations of amino acids and peptides have been
reported in alkali chlorides [208], KSCN [205,214], NH4CI [211], urea [191], sodium
butyrate [177], sodium acetate [178,189] tetra-n-alkylammonium bromide [10,315],
caffeine [345], sodium caproate [201], MgCh [346], NaCe [272], CaCl2 [7],
magnesium acetate [223], tetramethyl ammonium iodide [347], Cu II nitrate, Ni II
chloride [235], surfactant [348], methanol [349], D-glucose [350], potassium citrate
salt solution [340] KCl, KNO3 [339], and NaBr, KCl, KBr, MgCb and Na2S04
[10,183,351].
The investigation in this chapter focuses on the measurements of viscosity
coefficients of (L-histidine, L-glutamic acid, L-tryptophan, glycylglycine + 2 M
aqueous KCl / 2 M aqueous KNO3) solutions as functions of amino acid concentration
and temperature (298.15, 303.15, 308.15, 313.15, 318.15, and 323.15) K. Using the
viscosity data the parameters, relative viscosity, specific viscosity, B-coefficient and
its temperature derivative (dB/dT) have been evaluated. The trends of variation of
experimental and computed parameters with change in molal concentration of solute
and temperature have been interpreted in terms of zwitterions-ions, zwitterions-water
dipoles, ions-ions and ions-water dipoles interactions.
RESULTS AND DISCUSSION
The experimentally measured viscosity values of L- histidine / L- glutamic
acid / L- tryptophan / glycylglycine + 2 M aqueous KCl / 2 M aqueous KNO3
solutions as functions of amino acid / peptide molal concentration and temperature
have been listed in the Table 4.1. The plots of viscosity values with solute
concentration are presented in Figs 4.1-4.8. The viscosity values have been least-
squares fitted to the following polynomial,
7]=?j,+ r],m + 7j,m^ (4.1)
where //^, ;/,, T]^; and m are the fitted coefficients and molal concentration of
solutions, respectively. The fitted coefficients of the equation (4.1) have been given in
the Table 4.2. A perusal of the Table 4.1 reveals that the // values increase with an

139
TABLE 4.1 Viscosity values (T/XIO'*/ N-m -s) as functions of amino acid / peptide
molal concentration and temperature
m/
mol-kg"
T/K
298.15 303.15 308.15 313.15 318.15 323.15
(i) L- histidine in 2 M aqueous KCl solution
0.0000
0.0277
0.0555
0.0836
0.1117
0.1400
0.1686
0.1974
0.2263
0.0000
0.0270
0.0541
0.0815
0.1090
0.1367
0.1645
0.1926
0.2207
9.063
9.170
9.282
9.389
9.524
9.667
9.816
9.936
10.06
(ii)L-
8.985
9.057
9.193
9.295
9.399
9.564
9.682
9.796
9.942
8.279
8.355
8.459
8.545
8.653
8.812
8.903
8.995
9.089
histidine in
8.134
8.264
8.371
8.458
8.550
8.667
8.785
8.896
9.007
7.573
7.654
7.751
7.829
7.922
8.048
8.144
8.234
8.333
2 M aqueous
7.473
7.550
7.649
7.728
7.819
7.921
8.038
8.135
8.244
6.954
7.034
7.111
7.183
7.267
7.366
7.474
7.543
7.628
6.400
6.473
6.549
6.620
6.697
6.819
6.882
6.962
7.046
KNO3 solution
6.857
6.926
7.017
7.101
7.192
7.275
7.364
7.446
7.548
6.322
6.409
6.479
6.562
6.626
6.695
6.783
6.851
6.939
5.914
5.985
6.055
6.117
6.199
6.270
6.351
6.424
6.487
5.838
5.911
5.986
6.042
6.116
6.185
6.258
6.320
6.406
0.0000
0.0092
0.0184
0.0277
0.0369
9.063
9.089
9.143
9.170
9.205
8.279
8.300
8.333
8.374
8.401
(iii) L- glutamic acid in 2 M aqueous KCl solution
7.573
7.592
7.626
7.654
7.675
6.954
6.963
7.007
7.035
7.062
6.400
6.414
6.423
6.480
6.500
5.914
5.935
5.967
5.993
6.013

140
0.0462
0.0555
9.254
9.300
8.438
8.476
7.712
7.748
7.098
7.127
6.530
6.559
6.042
6.070
(iv) L- glutamic acid in 2 M aqueous KNO3 solution
7.473
7.503
7.531
7.567
7.597
7.624
7.676
(v) L- tryptophan in 2 M aqueous KCl solution
0.0000
0.0090
0.0180
0.0270
0.0360
0.0450
0.0541
8.985
8.989
9.032
9.063
9.087
9.115
9.156
8.134
8.190
8.226
8.256
8.293
8.333
8.380
6.857
6.899
6.915
6.938
6.967
7.064
7.103
6.322
6.357
6.372
6.388
6.417
6.450
6.494
5.838
5.873
5.893
5.909
5.938
5.976
6.000
0.0000
0.0092
0.0138
0.0184
0.0231
0.0277
0.0323
0.0370
0.0000
0.0090
0.0135
0.0180
0.0225
0.0270
0.0315
0.0361
9.063
9.150
9.155
9.181
9.204
9.239
9.268
9.300
8.279
8.307
8.327
8.348
8.382
8.409
8.431
8.476
(vi) L- tryptoplian in
8.985
9.020
9.029
9.062
9.085
9.119
9.153
9.189
8.134
8.201
8.242
8.270
8.297
8.319
8.352
8.381
7.573
7.604
7.626
7.647
7.674
7.700
7.721
7.754
6.954
6.981
7.002
7.022
7.048
7.080
7.101
7.121
I 2 M aqueous KNO3
7.473
7.506
7.541
7.555
7.582
7.617
7.644
7.677
6.857
6.897
6.925
6.939
6.959
7.006
7.045
7.098
6.400
6.445
6.466
6.486
6.505
6.525
6.539
6.584
solution
6.322
6.361
6.382
6.409
6.435
6.443
6.476
6.515
5.914
5.953
5.966
5.986
6.005
6.025
6.045
6.071
5.838
5.870
5.891
5.917
5.936
5.957
5.983
6.009
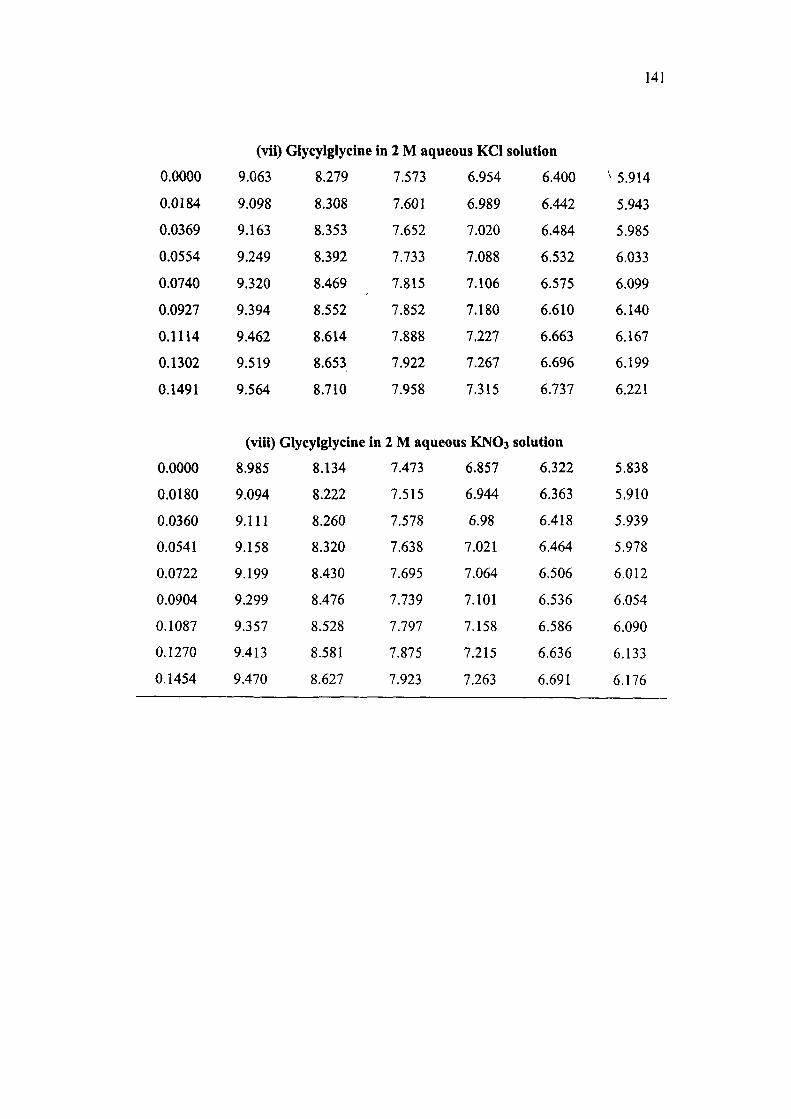
141
0.0000
0.0184
0.0369
0.0554
0.0740
0.0927
0.1114
0.1302
0.1491
(vii
9.063
9.098
9.163
9.249
9.320
9.394
9.462
9.519
9.564
) Glycyiglycine in 2 M aqueous KCl solution
8.279
8.308
8.353
8.392
8.469
8.552
8.614
8.653
8.710
7.573
7.601
7.652
7.733
7.815
7.852
7.888
7.922
7.958
6.954
6.989
7.020
7.088
7.106
7.180
7.227
7.267
7.315
6.400
6.442
6.484
6.532
6.575
6.610
6.663
6.696
6.737
^ 5.914
5.943
5.985
6.033
6.099
6.140
6.167
6.199
6.221
(viii) Glycyiglycine in 2 M aqueous KNO3 solution
0.0000
0.0180
0.0360
0.0541
0.0722
0.0904
0.1087
0.1270
0.1454
8.985
9.094
9.111
9.158
9.199
9.299
9.357
9.413
9.470
8.134
8.222
8.260
8.320
8.430
8.476
8.528
8.581
8.627
7.473
7.515
7.578
7.638
7.695
7.739
7.797
7.875
7.923
6.857
6.944
6.98
7.021
7.064
7.101
7.158
7.215
7.263
6.322
6.363
6.418
6.464
6.506
6.536
6.586
6.636
6.691
5.838
5.910
5.939
5.978
6.012
6.054
6.090
6.133
6.176
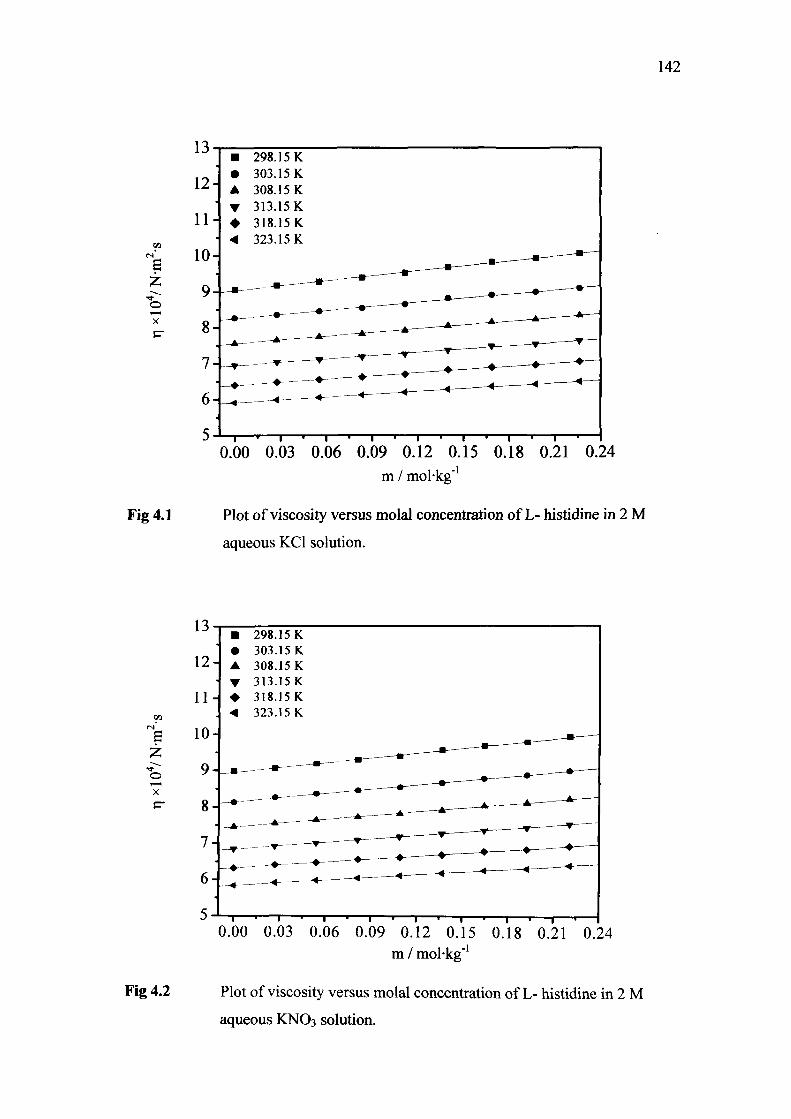
142
o X
Fig 4.1
0.00 0.03 0.06 0.09 0.12 0.15 0.18 0.21 0.24
m / mol-kg"'
Plot of viscosity versus molal concentration of L- histidine in 2 M
aqueous KCl solution.
e
X
Fig 4.2
0.00 0.03 0.06 0.09 0.12 0.15 0.18 0.21 0.24 m / molkg"'
Plot of viscosity versus molal concentration of L- histidine in 2 M
aqueous KNO3 solution.
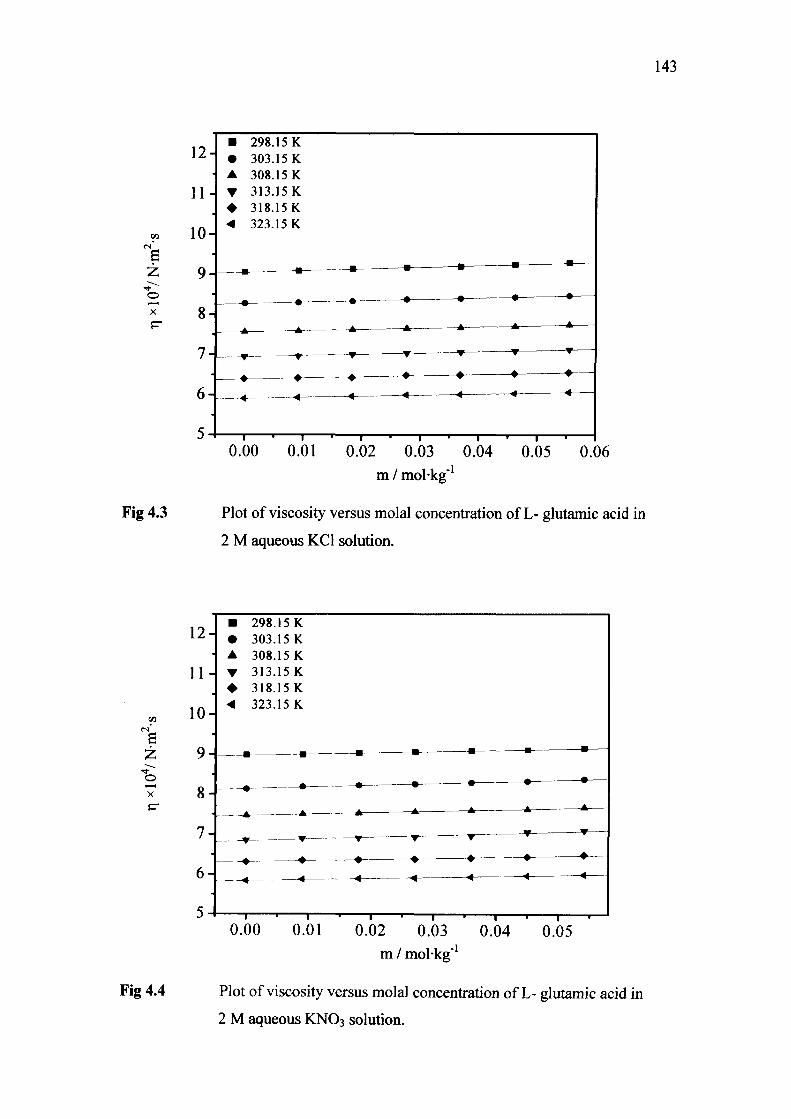
143
6
X
Fig 4.3
12H
IH
10-
9-
8-
7-
6-
5-
• • •
•
• <
—
298.15 K 303.15 K 308.15 K 313.15 K 318.15 K 323.15 K
« •
« •
A A
• — •
• •
4 4
T • 1
•
•
•
•
4
' 1
,
•
T
• <
-•
•
<
•
•
A
•
4
—
•
•
"ir
•
0.00 0.01 0.02 0.03 0.04 0.05 0.06
m / molkg"'
Plot of viscosity versus molal concentration of L- glutamic acid in
2 M aqueous KCl solution.
S
X
Fig 4.4
12-
I H
10-
9-
8-
7-
6-
5-
• 298.15 K • 303.15 K A 308.15 K • 313.15 K • 318.15K •4 323.15 K
• «
A A
• ^
# •
4 4
- r ' 1
— • -
«
I T —
r-•
J^ -A
• ^
• i
1 1 1
^
^ •
. ^
• •
1 4
0.00 0.01 0.02 0.03 0.04 0.05
m / molkg"'
Plot of viscosity versus molal concentration of L- glutamic acid in
2 M aqueous KNO3 solution.
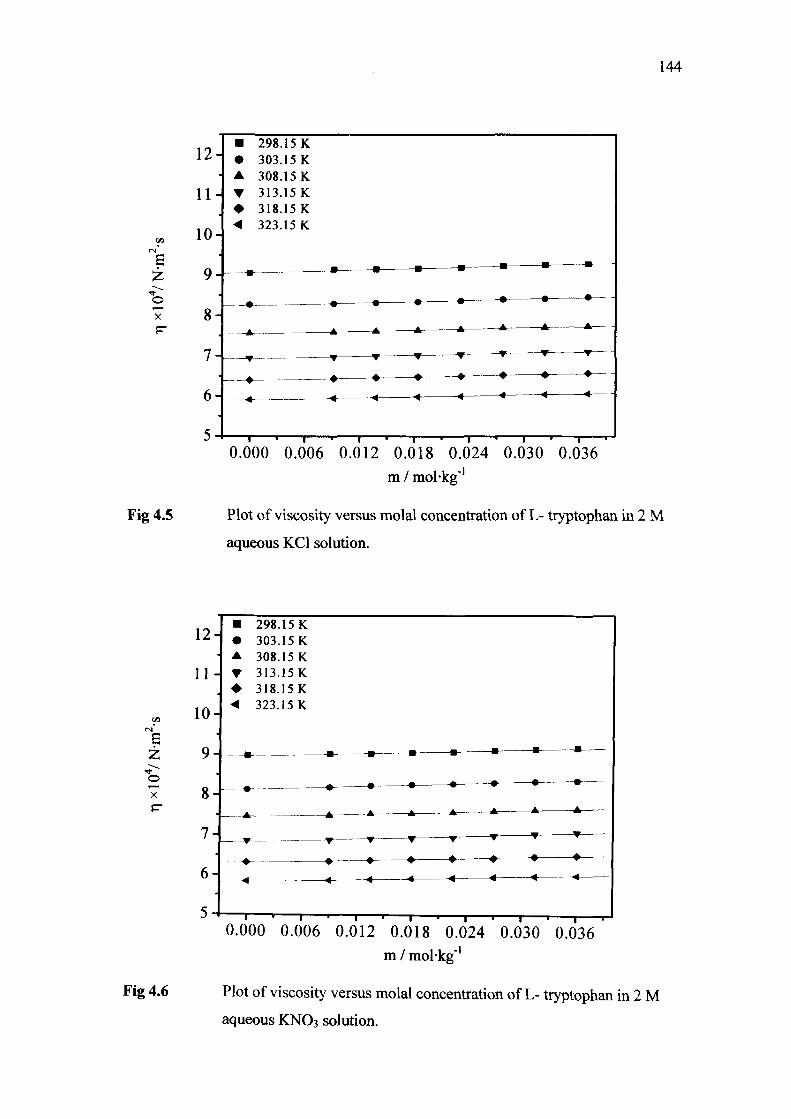
144
e
O X
Fig 4.5
12-
1 1 -
10-
9 -
8-
7 -
6-
298.15 K 303.15 K 308.15 K 313.15 K 318.15K 323.15 K
0.000 0.006 0.012 0.018 0.024 0.030 0.036
m / molkg"'
Plot of viscosity versus molal concentration of L- tryptophan in 2 M
aqueous KCl solution.
S
O
Fig 4.6
12--
I H
10-
9-
8-
7-
6-
. -
• 298.15 K • 303.15 K A 308.15 K T 313.15K • 318.15K < 323.15 K
•
A
j ^
«
I ' 1
—A
- •
-^
•
•-
T r-
^
^
T
•
• —
•—
•
•
• 4
—1 •-
•
•
• 4
0.000 0.006 0.012 0.018 0.024 0.030 0.036
m / molkg*
Plot of viscosity versus molal concentration of L- tryptophan in 2 M
aqueous KNO3 solution.
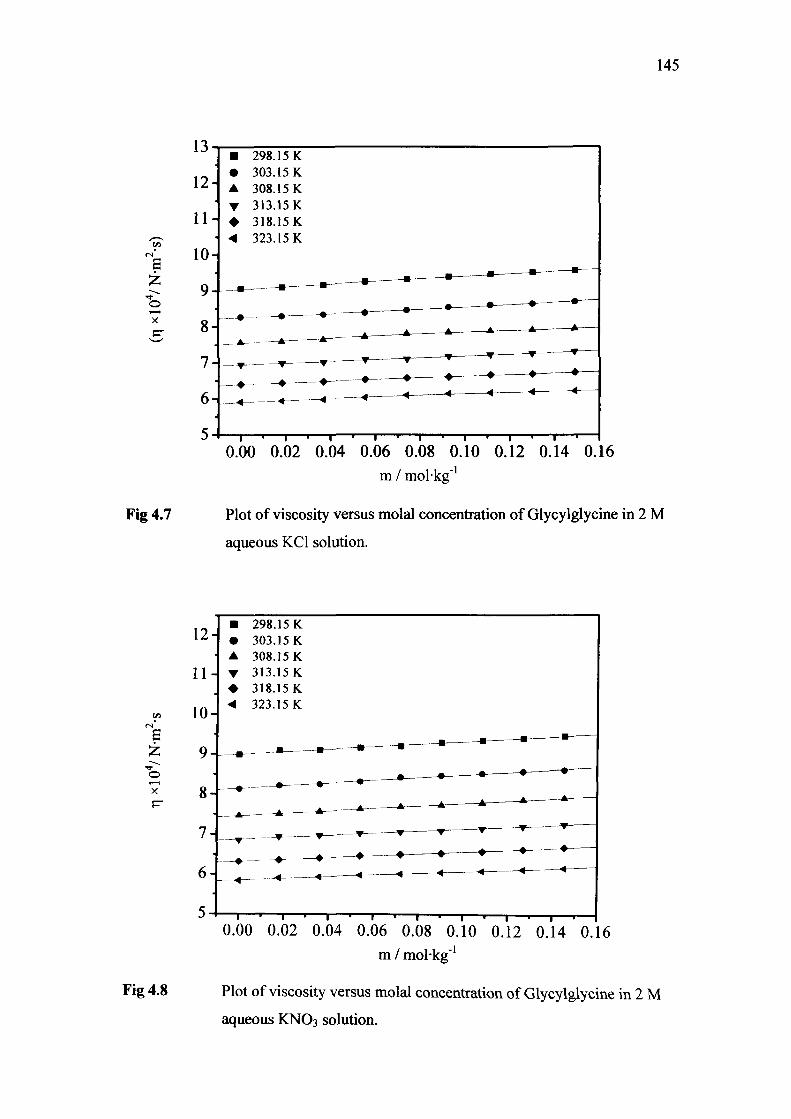
145
13
S
o X
Fig 4.7
12- A
298.15 K 303.15 K 308.15 K
• 313.15 K I H • 318.15K
•4 323.15 K
0.00 0.02 0.04 0.06 0.08 0.10 0.12 0.14 0.16 m / mol-kg"'
Plot of viscosity versus molal concentration of Glycylglycine in 2 M
aqueous KCl solution.
S
X
Fig 4.8
12
11-
10-
9-
8-
7-
6-
298.15 K 303.15 K 308.15 K 313.15 K 318.15K 323.15 K
0.00 0.02 0.04 0.06 0.08 0.10 0.12 0.14 0.16 m / molkg'
Plot of viscosity versus molal concentration of Glycylglycine in 2 M
aqueous KNO3 solution.
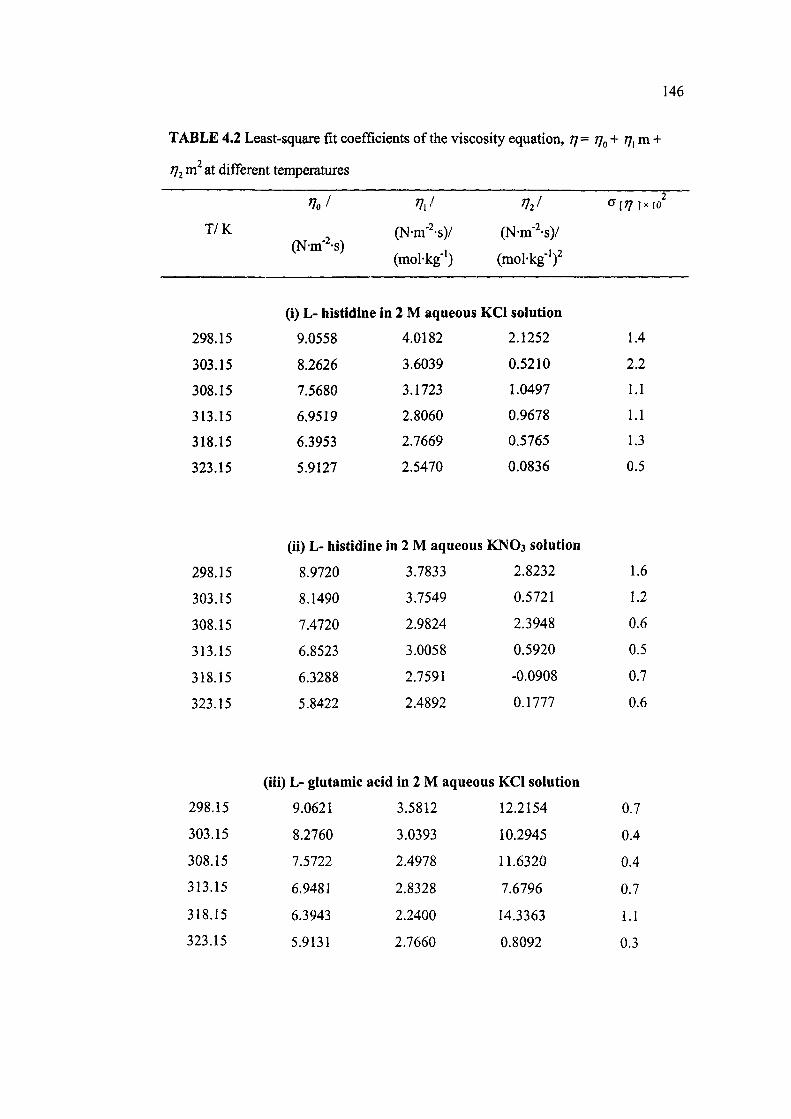
146
TABLE 4.2 Least-square fit coefficients of the viscosity equation, r]= Tjg+ TJ^m +
7J2 m at different temperatures
T/K
298.15
303.15
308.15
313.15
318.15
323.15
%/
(N-m"^-s)
(i) L- histidine
9.0558
8.2626
7.5680
6.9519
6.3953
5.9127
nj (N-m-^-s)/
(mol-kg-')
in 2 M aqueous
4.0182
3.6039
3.1723
2.8060
2.7669
2.5470
^ 2 /
(N-m-^-s)/
(mol-kg-f
KCl solution
2.1252
0.5210
1.0497
0.9678
0.5765
0.0836
^ 2 Cf (7 ]x 10
1.4
2.2
1.1
1.1
1.3
0.5
(ii) L- histidine in 2 M aqueous KNO3 solution
298.15
303.15
308.15
313.15
318.15
323.15
8.9720
8.1490
7.4720
6.8523
6.3288
5.8422
3.7833
3.7549
2.9824
3.0058
2.7591
2.4892
2.8232
0.5721
2.3948
0.5920
-0.0908
0.1777
1.6
1.2
0.6
0.5
0.7
0.6
(iii) L- glutamic acid in 2 M aqueous KCI solution
298.15
303.15
308.15
313.15
318.15
323.15
9.0621
8.2760
7.5722
6.9481
6.3943
5.9131
3.5812
3.0393
2.4978
2.8328
2.2400
2.7660
12.2154
10.2945
11.6320
7.6796
14.3363
0.8092
0.7
0.4
0.4
0.7
1.1
0.3
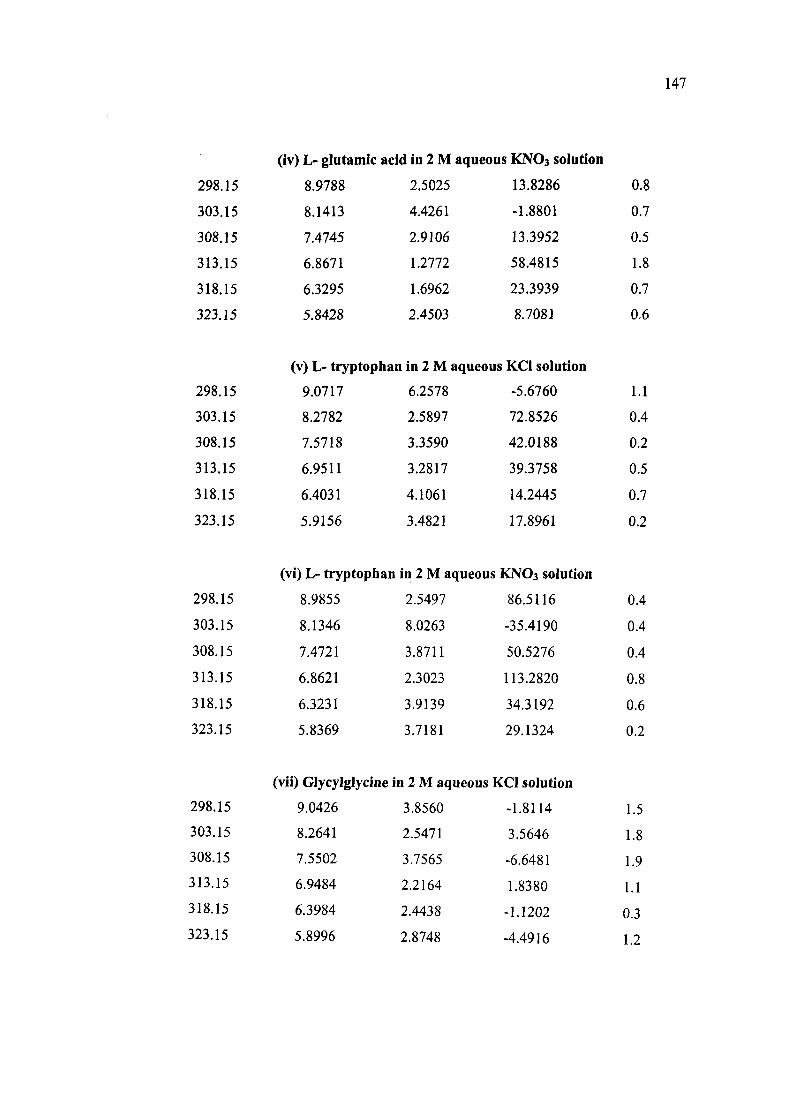
147
(iv) L- glutamic acid in 2 M aqueous KNO3 solution
298.15
303.15
308.15
313.15
318.15
323.15
8.9788
8.1413
7.4745
6.8671
6.3295
5.8428
2.5025
4.4261
2.9106
1.2772
1.6962
2.4503
13.8286
-1.8801
13.3952
58.4815
23.3939
8.7081
0.8
0.7
0.5
1.8
0.7
0.6
(v) L- tryptophan in 2 M aqueous KCl solution
298.15
303.15
308.15
313.15
318.15
323.15
9.0717
8.2782
7.5718
6.9511
6.4031
5.9156
6.2578
2.5897
3.3590
3.2817
4.1061
3.4821
-5.6760
72.8526
42.0188
39.3758
14.2445
17.8961
1.1
0.4
0.2
0.5
0.7
0.2
(vi) L- tryptophan in 2 M aqueous KNO3 solution
298.15
303.15
308.15
313.15
318.15
323.15
8.9855
8.1346
7.4721
6.8621
6.3231
5.8369
2.5497
8.0263
3.8711
2.3023
3.9139
3.7181
86.5116
-35.4190
50.5276
113.2820
34.3192
29.1324
0.4
0.4
0.4
0.8
0.6
0.2
(vii) Glycylglycine in 2 M aqueous KCl solution
298.15
303.15
308.15
313.15
318.15
323.15
9.0426
8.2641
7.5502
6.9484
6.3984
5.8996
3.8560
2.5471
3.7565
2.2164
2.4438
2.8748
-1.8114
3.5646
-6.6481
1.8380
-1.1202
-4.4916
1.5
1.8
1.9
1.1
0.3
1.2
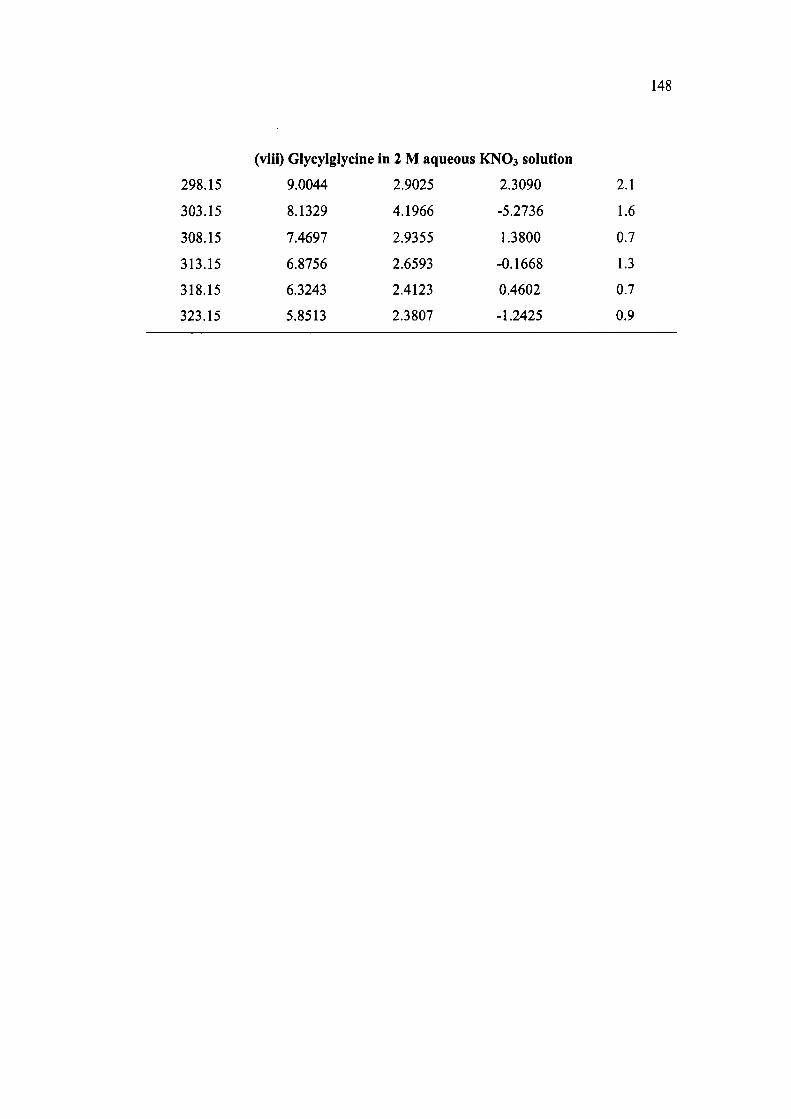
148
(viii) Glycylglycine in 2 M aqueous KNO3 solution
298.15
303.15
308.15
313.15
318.15
323.15
9.0044
8.1329
7.4697
6.8756
6.3243
5.8513
2.9025
4.1966
2.9355
2.6593
2.4123
2.3807
2.3090
-5.2736
1.3800
-0.1668
0.4602
-1.2425
2.1
1.6
0.7
1.3
0.7
0.9
149
increase in molal concentration of amino acids and peptide in all the systems xmder
investigation. The viscosity values of 2 M aqueous KCl (9.063x10" / N-m^s at 298.15
K) are larger than that of 2 M aqueous KNO3 (8.985x10' / N-m -s at 298.15 K) at
each temperature of study. Bianchi et al. [352] have reported the similar trend of
variation of viscosity value of Poly-L- Lysine in 0.88 M aqueous KNO3 and 0.88 M
aqueous KCl solutions. The viscosity values of amino acid and peptide in 2 M
aqueous KCl and 2 M aqueous KNO3 solutions decrease with an increase in
temperature. An increase in temperature may increase the kinetic energy of
molecules, which in turn, may decrease the ion-ion (K^-CF, K^ -NOs") and
zwitterion-ion (-COO -K" , -NHs^ - CI" / NO3") interactions. Chen and Tsaih [353]
reported that the intrinsic viscosity of chitosan in dilute HCl solution decreases
linearly with an increase in temperature. Pogodina et al [354] reported that the
intrinsic viscosity of chitosan decreases with increasing temperature [355]. Filar and
Wirick [356], and Chen and Lin [357] reported the decreasing trend of variation of
apparent viscosity of chitosan with an increase in solution temperature. An increase in
temperature of solution results in a rapid decrease in the ratio of radius of gyration
and average molecular weight resulting in an increase in chain flexibility and
compactness of the molecules which, in turn, causes a decrease in the intrinsic
viscosity [358,359]. Noguchi [360] reported that an increase in temperature causes the
decrease in hydrogen-bonded hydration water of glucose, dextran, etc. The decrease
in hydrogen-bonded hydration water in turn, results a decrease in specific volume and
therefore a decrease in intrinsic viscosity. Kharat [361] has reported the similar trend
of variation of viscosity values of sodium acetate in aqueous medium with an increase
in temperature.
The relative viscosity [184,362,363] and specific viscosity [202] values have
been computed by employing the following relations using the viscosity values of
solvent and solution.
11 = ^ (4.2)
% = ^ ^ (4.3)

150
The computed values of relative and specific viscosity have been listed in Tables 4.3
and 4.4, respectively. The T]^ values increase with an increase in molal concentration
of amino acid and peptide in 2 M aqueous KCl as v 'ell as in 2 M aqueous KNO3
solutions but these values do not exhibit regular trends of variation with an increase in
temperature in the systems under investigation (Figs 4.9-1.6). The increasing trend of
T]^ with an increase in solute concentration may be ascribed to an increase in the ion-
ion (K^ - C r , K^-NOJ) and zwitterion-ion (-COO'-K^ -NH^-CP / NO3)
interactions in solutions.
The viscosity data have been fitted to the Jones-Dole [48] equation,
7 = ^ = 1 + Am"2 + Bm, (4.4)
where A and B are the Falkenhagen [364,365] and Jones-Dole [203] coefficients,
respectively. The coefficients A and B account for the solute-solute interactions and
structural modifications induced by the solute-solvent interactions [366,367],
respectively. The values of A and B-coefficients alongwith the standard deviations of
linear regression have been listed in Table 4.5 and Table 4.6, respectively. The B-
coefficient values of the amino acids and peptides reflect the net structural effects of
the charged end groups (NH 3, COO") and the hydrophobic (-CH2) groups on the
solvent. The contribution of CH2 groups in B-coefficient values vary with the number
of carbon atoms in their alkyl chain at a given teihperature. These two effects can be
separated by noting the linear relationship [226,366,368] of B-coefficient with the
number of carbon atoms, iic,
B = B ( N H ; , COO") + UcB (CH2)
A close perusal of data listed in Table 4.6 indicates that the B-coefficient values of L-
histidine, L-glutamic acid, L-tryptophan and glycylglycine in 2 M aqueous KCl and 2
M aqueous KNO3 solutions are positive at all amino acid / peptide concentration as
well as at all temperatures of study. The viscosity B-coefficients of L-histidine in 2M
aqueous KCl and 2M aqueous KNO3 solutions have been found to be 0.537 and 0.567
(dm-mol"'), respectively, at 298.15 K while it has been reported as [369] 0.39
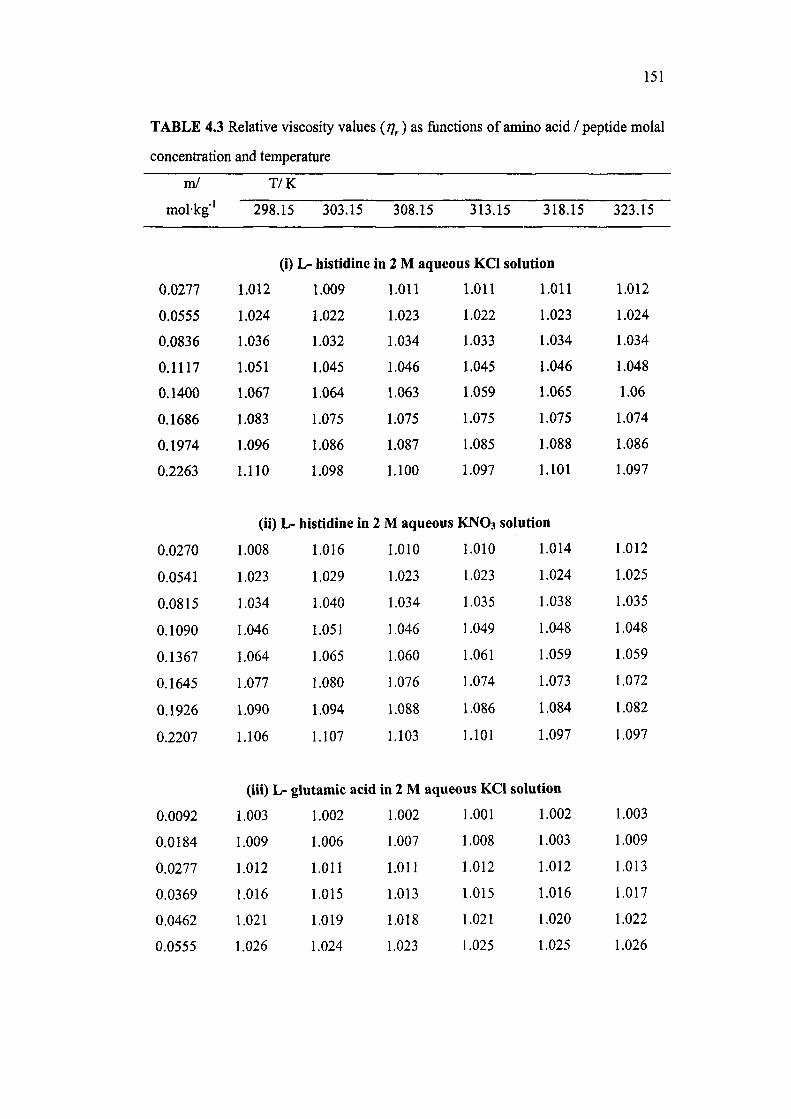
151
TABLE 4.3 Relative viscosity values (77 ) as functions of amino acid / peptide molal
concentration and temperature
m/
molkg''
0.0277
0.0555
0.0836
0.1117
0.1400
0.1686
0.1974
0.2263
0.0270
0.0541
0.0815
0.1090
0.1367
0.1645
0.1926
0.2207
T/K
298.15 303.15
(i) L- histidine
1.012
1.024
1.036
1.051
1.067
1.083
1.096
1.110
1.009
1.022
1.032
1.045
1.064
1.075
1.086
1.098
(ii) L- histidine in
1.008
1.023
1.034
1.046
1.064
1.077
1.090
1.106
1.016
1.029
1.040
1.051
1.065
1.080
1.094
1.107
308.15 313.15 318.15
in 2 M aqueous KCl solution
1.011
1.023
1.034
1.046
1.063
1.075
1.087
1.100
2 M aqueous
1.010
1.023
1.034
1.046
1.060
1.076
1.088
1.103
1.011
1.022
1.033
1.045
1.059
1.075
1.085
1.097
1.011
1.023
1.034
1.046
1.065
1.075
1.088
1.101
KNO3 solution
1.010
1.023
1.035
1.049
1.061
1.074
1.086
1.101
1.014
1.024
1.038
1.048
1.059
1.073
1.084
1.097
323.15
1.012
1.024
1.034
1.048
1.06
1.074
1.086
1.097
1.012
1.025
1.035
1.048
1.059
1.072
1.082
1.097
(iii) L- glutamic acid in 2 M aqueous KCl solution
0.0092
0.0184
0.0277
0.0369
0.0462
0.0555
1.003
1.009
1.012
1.016
1.021
1.026
1.002
1.006
1.011
1.015
1.019
1.024
1.002
1.007
1.011
1.013
1.018
1.023
1.001
1.008
1.012
1.015
1.021
1.025
1.002
1.003
1.012
1.016
1.020
1.025
1.003
1.009
1.013
1.017
1.022
1.026

152
0.0090
0.0180
0.0270
0.0360
0.0450
0.0541
(iv) L- glutamic acid
1.000
1.005
1.009
1.011
1.014
1.020
1,007
1.011
1.015
1.019
1.024
1.030
in 2 M aqueous KNO3 solution
1.004
1.008
1.012
1.016
1.020
1.027
1.006
1.008
1.012
1.016
1.030
1.036
1.003
1.008
1.010
1.015
1.020
1.027
(v) L- tryptophan in 2 M aqueous KCI solution
(vi) L- tryptophan in 2 M aqueous KNO3 solution
1.004
1.009
1.011
1.014
1.019
1.023
1.027
(vii) Glycylglycine in 2 M aqueous KCI solution
0.0090
0.0135
0.0180
0.0225
0.0270
0.0315
0.0361
1.004
1.005
1.008
1.011
1.015
1.019
1.023
1.008
1.013
1.017
1.020
1.023
1.027
1.030
1.006
1.009
1.012
1.020
1.024
1.028
0.0092
0.0138
0.0184
0.0231
0.0277
0.0323
0.0370
1.009
1.010
1.013
1.015
1.019
1.023
1.026
1.003
1.006
1.008
1.012
1.016
1.018
1.024
1.004
1.007
1.010
1.013
1.017
1.019
1.024
1.004
1.007
1.010
1.013
1.018
1.021
1.024
1.007
1.010
1.013
1.016
1.019
1.022
1.029
1.006
1.009
1.012
1.015
1.019
1.022
1.026
1.006
1.010
1.012
1.015
1.022
1.027
1.035
1.006
1.009
1.014
1.018
1.019
1.024
1.030
1.005
1.009
1.013
1.017
1.020
1.025
1.029
0.0184
0.0369
0.0554
0.0740
0.0927
1.004
1.011
1.020
1.028
1.036
1.003
1.009
1.014
1.023
1.033
1.004
1.010
1.021
1.032
1.037
1.005
1.009
1.019
1.022
1.025
1.006
1.013
1.021
1.027
1.033
1.006
1.012
1.020
1.031
1.038
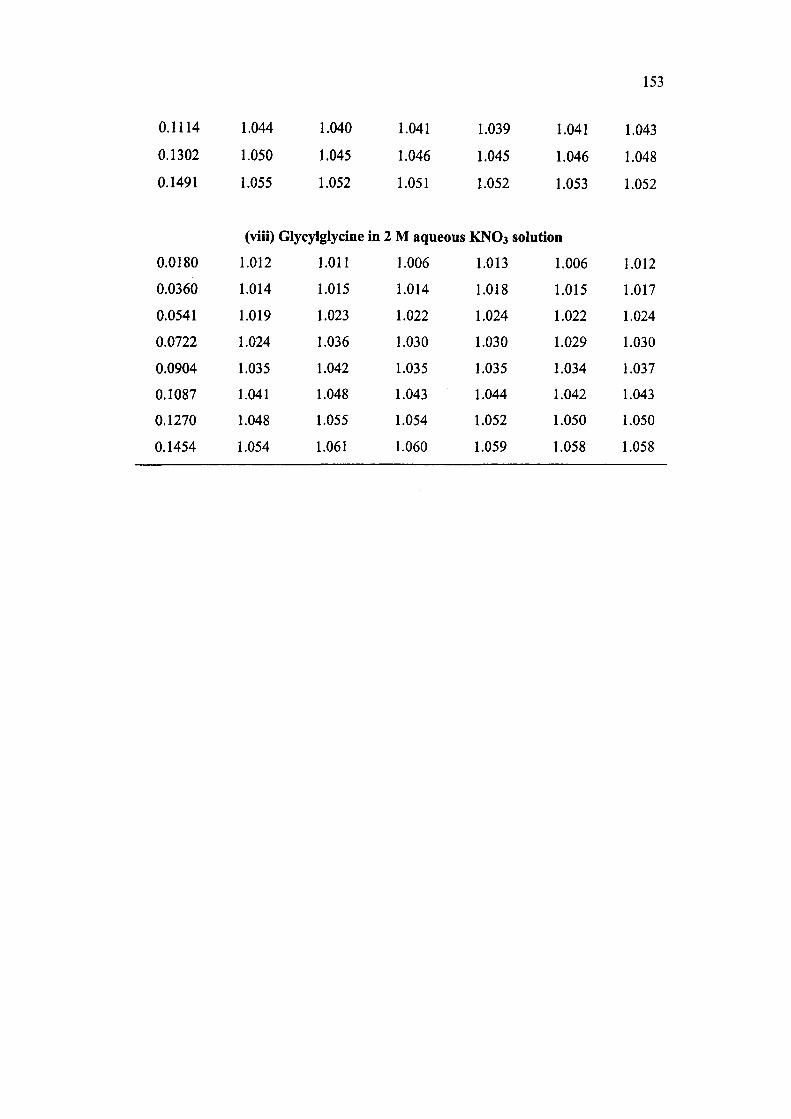
153
0.1114
0.1302
0.1491
1.044
1.050
1.055
1.040
1.045
1.052
1.041
1.046
1.051
1.039
1.045
1.052
1.041
1.046
1.053
1.043
1.048
1.052
(viii) Glycylglycine in 2 M aqueous KNO3 solution
0.0180 1.012 1.011 1.006 1.013 1.006 1.012
0.0360 1.014 1.015 1.014 1.018 1.015 1.017
0.0541 1.019 1.023 1.022 1.024 1.022 1.024
0.0722 1.024 1.036 1.030 1.030 1.029 1.030
0.0904 1.035 1.042 1.035 1.035 1.034 1.037
0.1087 1.041 1.048 1.043 1.044 1.042 1.043
0.1270 1.048 1.055 1.054 1.052 1.050 1.050
0.1454 1.054 1.061 1.060 1.059 1.058 1.058
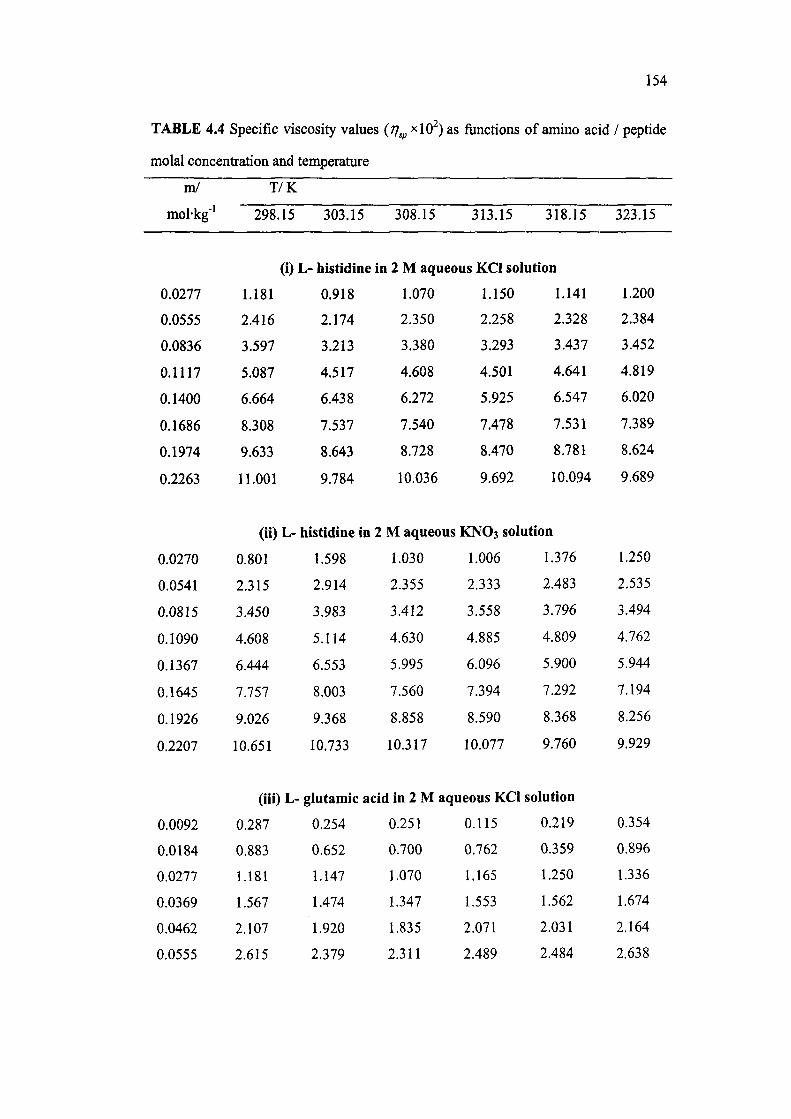
154
TABLE 4.4 Specific viscosity values {rj^^ xlO ) as functions of amino acid / peptide
molal concentration and temperature
m/
mol-kg"'
0.0277
0.0555
0.0836
0.1117
0.1400
0.1686
0.1974
0.2263
T/K
298.15
(i)L-
1.181
2.416
3.597
5.087
6.664
8.308
9.633
11.001
303.15
histldine in
0.918
2.174
3.213
4.517
6.438
7.537
8.643
9.784
308.15 313.15 318.15
2 M aqueous KCl solution
1.070
2.350
3.380
4.608
6.272
7.540
8.728
10.036
1.150
2.258
3.293
4.501
5.925
7.478
8.470
9.692
1.141
2.328
3.437
4.641
6.547
7.531
8.781
10.094
323.15
1.200
2.384
3.452
4.819
6.020
7.389
8.624
9.689
(ii) L- histidine in 2 M aqueous KNO3 solution
0.0270
0.0541
0.0815
0.1090
0.1367
0.1645
0.1926
0.2207
0.801
2.315
3.450
4.608
6.444
7.757
9.026
10.651
1.598
2.914
3.983
5.114
6.553
8.003
9.368
10.733
1.030
2.355
3.412
4.630
5.995
7.560
8.858
10.317
1.006
2.333
3.558
4.885
6.096
7.394
8.590
10.077
1.376
2.483
3.796
4.809
5.900
7.292
8.368
9.760
1.250
2.535
3.494
4.762
5.944
7.194
8.256
9.929
0.0092
0.0184
0.0277
0.0369
0.0462
0.0555
0.287
0.883
1.181
1.567
2.107
2.615
0.254
0.652
1.147
1.474
1.920
2.379
(iii) L- glutamic acid in 2 M aqueous KCI solution
0.251
0.700
1.070
1.347
1.835
2.311
0.115
0.762
1.165
1.553
2.071
2.489
0.219
0.359
1.250
1.562
2.031
2.484
0.354
0.896
1.336
1.674
2.164
2.638
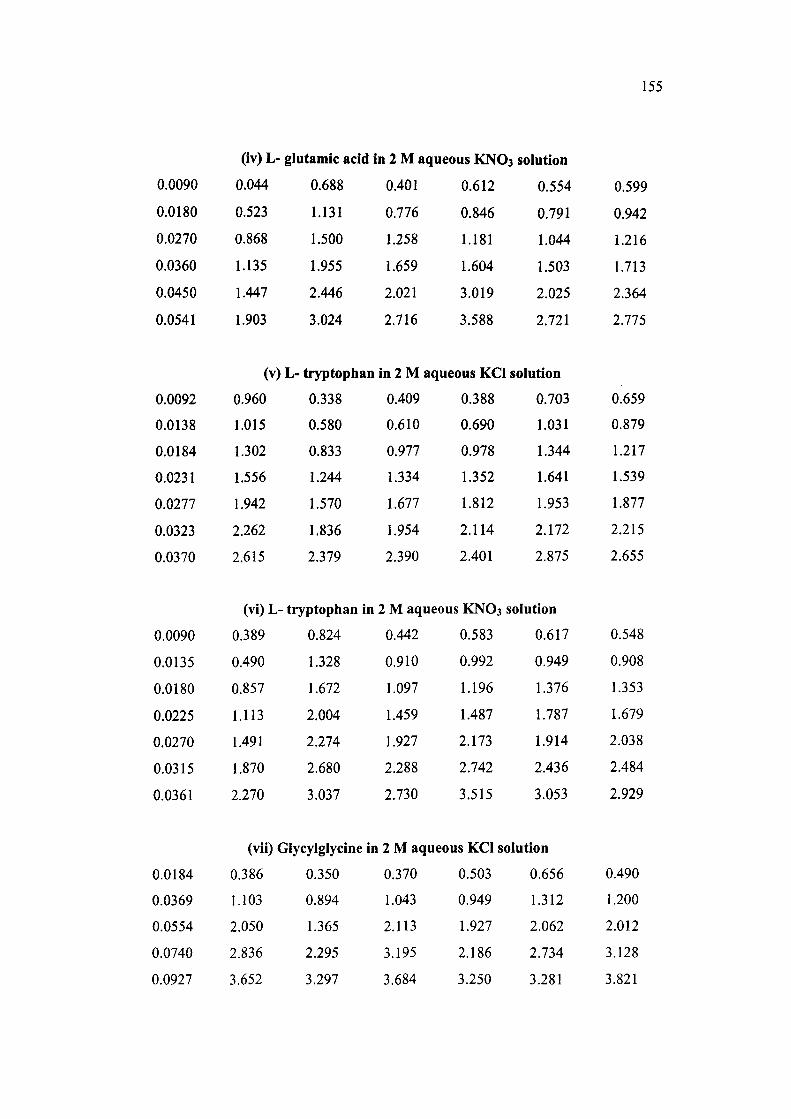
155
0.0090
0.0180
0.0270
0.0360
0.0450
0.0541
(iv) L- glutamic acid
0.044
0.523
0.868
1.135
1.447
1.903
0.688
1.131
1.500
1.955
2.446
3.024
in 2 M aqueous KNO3 solution
0.401
0.776
1.258
1.659
2.021
2.716
0.612
0.846
1.181
1.604
3.019
3.588
0.554
0.791
1.044
1.503
2.025
2.721
(v) L- tryptophan in 2 M aqueous KCi solution
0.599
0.942
1.216
1.713
2.364
2.775
0.0092
0.0138
0.0184
0.0231
0.0277
0.0323
0.0370
0.960
1.015
1.302
1.556
1.942
2.262
2.615
0.338
0.580
0.833
1.244
1.570
1.836
2.379
0.409
0.610
0.977
1.334
1.677
1.954
2.390
0.388
0.690
0.978
1.352
1.812
2.114
2.401
0.703
1.031
1.344
1.641
1.953
2.172
2.875
0.659
0.879
1.217
1.539
1.877
2.215
2.655
(vi) L- tryptophan in 2 M aqueous KNO3 solution
0.0090 0.389 0.824 0.442 0.583 0.617 0.548
0.0135 0.490 1.328 0.910 0.992 0.949 0.908
0.0180 0.857 1.672 1.097 1.196 1.376 1.353
0.0225 1.113 2.004 1.459 1.487 1.787 1.679
0.0270 1.491 2.274 1.927 2.173 1.914 2.038
0.0315 1.870 2.680 2.288 2.742 2.436 2.484
0.0361 2.270 3.037 2.730 3.515 3.053 2.929
(vii) Giycylglycine in 2 M aqueous KCI solution
0.0184 0.386 0.350 0.370 0.503 0.656 0.490
0.0369 1.103 0.894 1.043 0.949 1.312 1.200
0.0554 2.050 1.365 2.113 1.927 2.062 2.012
0.0740 2.836 2.295 3.195 2.186 2.734 3.128
0.0927 3.652 3.297 3.684 3.250 3.281 3.821

156
0.1114
0.1302
0.1491
0.0180
0.0360
0.0541
0.0722
0.0904
0.1087
0.1270
0.1454
4.402
5.031
5.528
4.046
4.517
5.206
(viii) Glycylglycine in
1.213
1.402
1.925
2.382
3.495
4.140
4.763
5.398
1.082
1.549
2.287
3.639
4.205
4.844
5.495
6.061
4.159
4.608
5.084
3.926
4.501
5.191
2 M aqueous KNO3
0.562
1.405
2.208
2.971
3.559
4.336
5.379
6.022
1.269
1.794
2.392
3.019
3.558
4.390
5.221
5.921
4.109
4.625
5.266
solution
0.648
1.518
2.246
2.910
3.385
4.176
4.967
5.837
4.278
4.819
5.191
1.233
1.730
2.398
2.980
3.700
4.316
5.053
5.790
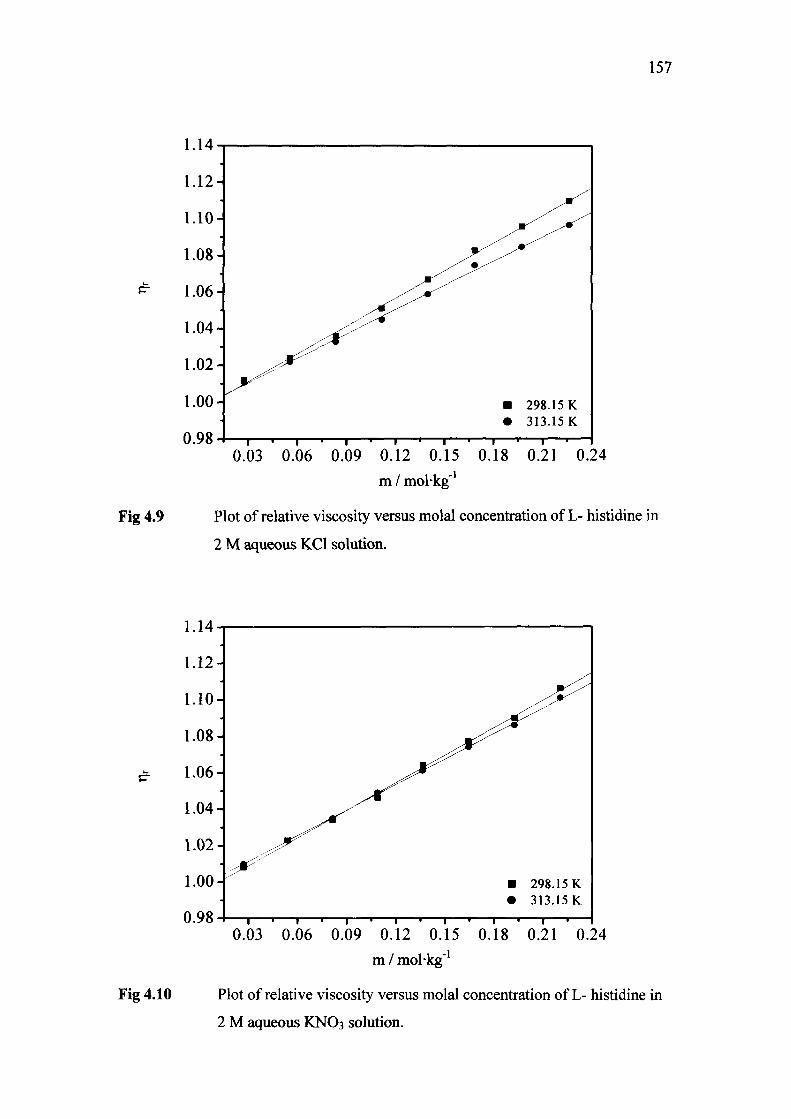
157
Fig 4.9
1.12-
1.10-
1.08-
1.06-
1.04-
1.02-
1.00-
0.98 J
^
—,—
. . - * = ' ' ' "
- • 1 ' - r • 1
/ < ^
^ ^ • ^
• 298.15 K • 313.15 K
1 1 1 1 r 1 1—
0.03 0.06 0.09 0.12 0.15 0.18 0.21 0.24 m / mol-kg''
Plot of relative viscosity versus molal concentration of L- histidine in
2 M aqueous KCl solution.
1.14
1.12
1.10
1.08
1.06
1.04
1.02-
1.00-
0.98
• . < ^ ' '
• 298.15 K • 313.15K
0.03 0.06 0.09 0.12 0.15 0.18 0.21 0.24
m / molkg"'
Fig 4.10 Plot of relative viscosity versus molal concentration of L- histidine in
2 M aqueous KNO3 solution.
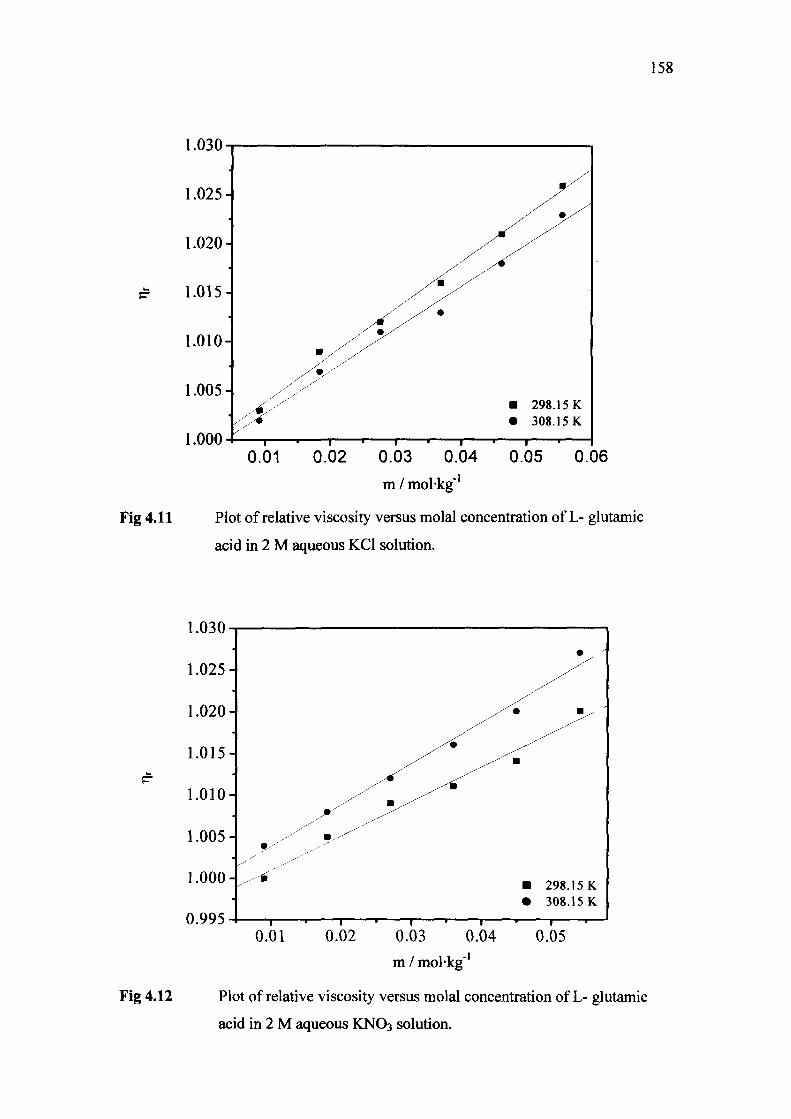
158
1.025-
1.020-
1.015-
1.010-
1.005-
1.000 J
Xy .^X
4-^ 1 1 • 1
^ ; •-^•y
—t f" —, p -
/ ^ • , /
• 298.15 K • 308.15 K
r 1 1- •
0.01 0.02 0.03 0.04 0.05 0.06
m / molkg''
Fig 4.11 Plot of relative viscosity versus molal concentration of L- glutamic
acid in 2 M aqueous KCl solution.
1.U3U -
1.025-
1.020-
1.015-
1.010-
1.005-
1.000-
0.995 J 1 1 '
m^.-^
, —
• -- ^-^
— , P-
^ ^
_ym
' 1—
•
^
* B ^ '
^ m
• 298.15 K • 308.15 K
0.01 0.02 0.03 0.04 m / mol-kg"'
0.05
Fig 4.12 Plot of relative viscosity versus molal concentration of L- glutamic
acid in 2 M aqueous KNO3 solution.
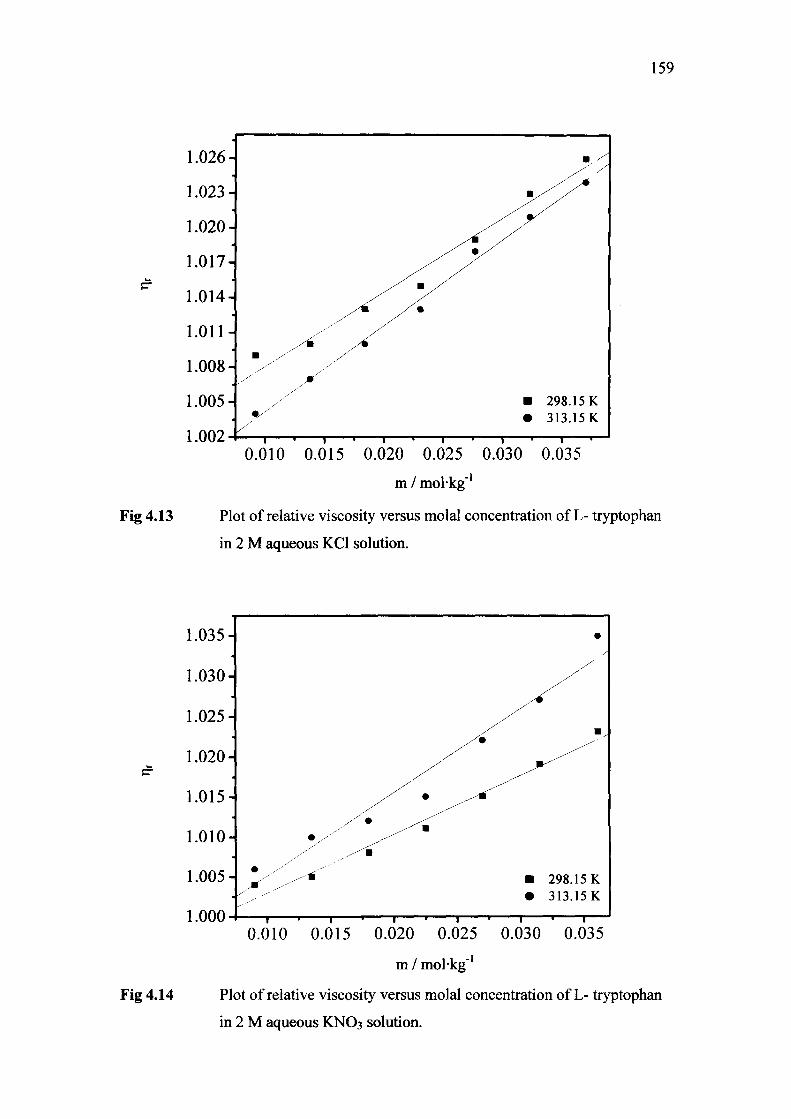
159
1.026-
1.023-
1.020-
1.017-
1.014-
1.011-
1.008-
1.005-
1.002 J
•
%y
^x
/ • ^
1—
X > .y
"
-*—1—•—
x^ • y y^%
—\ « r
*x
• ^
m^X X^
• 298.15 K • 313.15K
1 " 1 •
Fig 4.13
0.010 0.015 0.020 0.025 0.030 0.035
m / molkg"'
Plot of relative viscosity versus molal concentration of L- tryptophan
in 2 M aqueous KCl solution.
1.035-
1.030-
1.025-
1.020-
1.015-
1.010-
1.005-
1.000 J
• ,/"' ^ /
1 1 . ,
y
^,^ ^ • ^
— 1 1
•
^^^^ M
ym
T •
•
• ^
• 298.15 K • 313.15K
—1 ' 1
Fig 4.14
0.010 0.015 0.020 0.025 0.030 0.035
m / mol-kg"'
Plot of relative viscosity versus molal concentration of L- tryptophan
in 2 M aqueous KNO3 solution.

160
1.06-
1.05-
1.04-
1.03-
1.02-
1.01-
1.00-: ^ ' ^
• ^
^^^'^^'^
— ' — 1 — • — 1 —
• ^ ^
x^' ^y'l^^ *
• 298.15 K • 323.15 K
Fig 4.15
0.02 0.04 0.06 0.08 0.10 0.12 0.14 0.16
m / molkg"'
Plot of relative viscosity versus molal concentration of Glycylglycine
in 2 M aqueous KCl solution.
1.07
1.06-
1.05-
1.04-
1.03-
1.02-
1.01-
1.00-
: ^
• 298.15 K • 323.15 K
0.02 0.04 0.06 0.08 0.10 0.12 0.14
m / molkg"'
Fig 4.16 Plot of relative viscosity versus molal concentration of Glycylglycine
in 2 M aqueous KNO3 solution.

161
TABLE 4.5 Viscosity A-coefficient values (molal'' ^) at different temperatures
T/K
298.15 303.15 308.15 313.15 318.15 323.15
(i) L-histidine in 2 M aqueous KCl solution
-0.024 -0.029 -0.017 -0.011 -0.014 -0.003
(ii) L-histidine in 2 M aqueous KNO3 solution
-0.040 0.022 -0.022 -0.016 0.015 0.007
(iii) L-glutamic acid in 2 M aqueous KCI solution
-0.017 -0.023 -0.018 -0.040 -0.045 -0.008
(iv) L-glutamic acid in 2 M aqueous KNO3 solution
-0.037 0.030 -0.009 -0.022 0.007 0.015
(v) L-tryptophan in 2 M aqueous KCI solution
0.043 -0.055 -0.038 -0.049 0.005 -0.007
(vi) L-tryptophan in 2 M aqueous KNO3 solution
-0.051 0.026 -0.044 -0.065 -0.025 -0.036
(vii) Glycylglycine in 2 M aqueous KCI solution
-0.034 -0.044 -0.022 -0.025 -0.001 -0.016
(viii) Glycylglycine in 2 M aqueous KNO3 solution
0.034 0.024 0.015 0.048 0.001 0.047
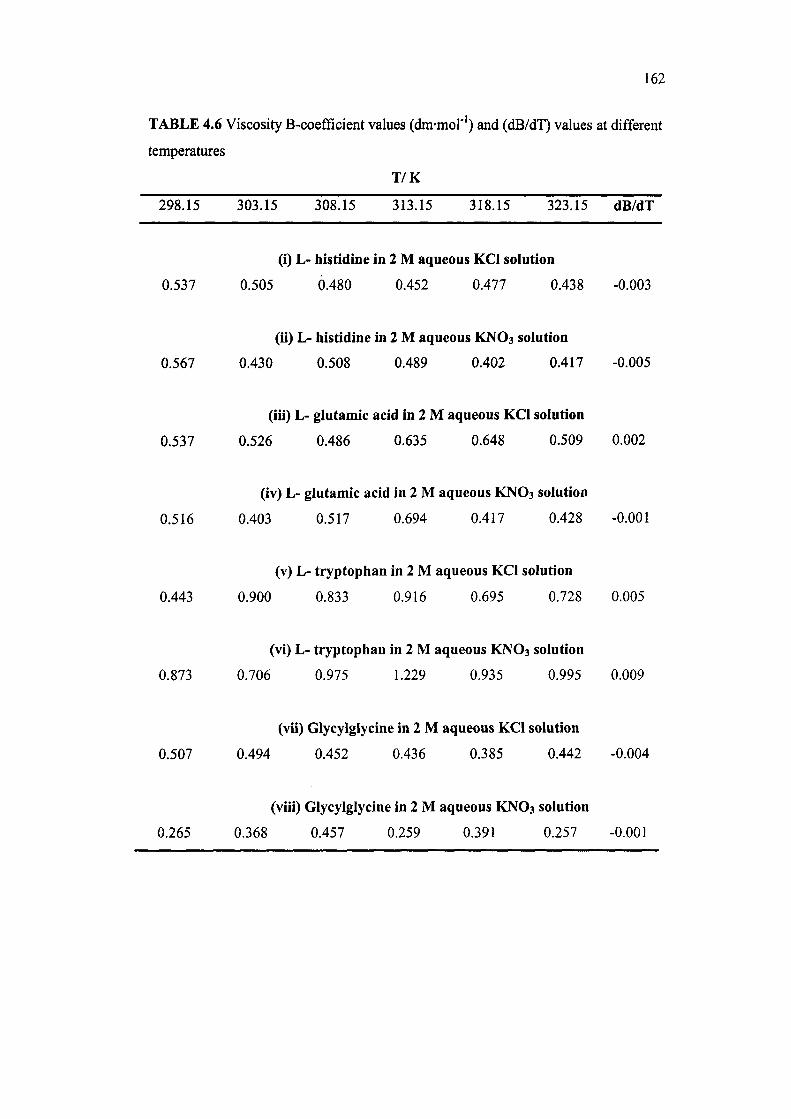
162
TABLE 4.6 Viscosity B-coefficient values (dm-raol'') and (dB/dT) values at different
temperatures
T/K
298.15 303.15 308.15 313.15 318.15 323.15 dB/dT
(i) L- histidine in 2 M aqueous KCl solution
0.537 0.505 0.480 0.452 0.477 0.438 -0.003
(ii) L- histidine in 2 M aqueous KNO3 solution
0.567 0.430 0.508 0.489 0.402 0.417 -0.005
(iii) L- glutamic acid in 2 M aqueous KCl solution
0.537 0.526 0.486 0.635 0.648 0.509 0.002
(iv) L- glutamic acid in 2 M aqueous KNO3 solution
0.516 0.403 0.517 0.694 0.417 0.428 -0.001
(v) L- tryptophan in 2 M aqueous KCl solution
0.443 0.900 0.833 0.916 0.695 0.728 0.005
(vi) L- tryptophan in 2 M aqueous KNO3 solution
0.873 0.706 0.975 1.229 0.935 0.995 0.009
(vii) Glycylglycine in 2 M aqueous KCl solution
0.507 0.494 0.452 0.436 0.385 0.442 -0.004
(viii) Glycylglycine in 2 M aqueous KNO3 solution
0.265 0.368 0.457 0.259 0.391 0.257 -0.001

163
(dm-mol') at 298.15 K in aqueous medium. The value has been reported as 0.552
(dm-mol'') at 298.15 K in aqueous tetramethylammonium bromide solution [328].
The coefficient values of L-histidine have been found to be 0.505, 0.480 and 0.452
(dm-mol"') in 2M aqueous KCl at 303.15K, 308.15 K and 313.15 K, respectively. The
values have been found as 0.430, 0.508 and 0.489 (dm mol"') in 2M aqueous KNO3 at
303.15 K, 308.15 K and 313.15 K, respectively. It has been reported as 0.38, 0.37 and
0.35 (dm-mol"') [370] at 303.15K, 308.15 K and 313.15 K, respectively in aqueous
medium. The viscosity B-coefficients of L-glutamic acid in 2M aqueous KCl and 2M
aqueous KNO3 solutions have been found to be 0.537 and 0.516 (dm-mol'),
respectively, at 298.15 K while it has been reported as [369] 0.29 (dm-mol"') at
298.15 K in aqueous medium. It has been found to be 0.526, 0.486 and 0.635
(dm-mol"') in 2 M aqueous KCl at 303.15 K, 308.15 K and 313.15 K, respectively,
whereas the values have been found to be 0.403, 0.517 and 0.694 (dm-mol"') in 2M
aqueous KNO3 at 303.15K, 308.15 K and 313.15 K, respectively. The B-coefficient
values have been reported as 0.31, 0.32 and 0.33 (dm-mol"') in aqueous medium at the
said temperatures [370].
The viscosity B-coefificients of L-tryptophan in 2 M aqueous KCl and 2 M
aqueous KNO3 solutions have been found to be 0.443 and 0.873 (dm-mol''),
respectively, at 298.15 K. The B-coefficient value of L-tryptophan in aqueous
medium or in a mixed solvent system has not been found in literature for comparison
of our data. The viscosity B-coefficients of glycylglycine have been found to be
0.494, 0.452 and 0.436 (dm-mol"') in 2 M aqueous KCl solution at 303.15 K, 308.15
K and 313.15 K, respectively. The values have been found as 0.368, 0.457 and 0.259
(dm-mol"') in 2M aqueous KNO3 solution at 303.15 K, 308.15 K and 313.15 K,
respectively, whereas it has been reported as [226] 0.250, 0.298 and 0.337 (dm-mol"')
at 303.15 K, 308.15 K and 313.15 K, respectively, in aqueous medium. The positive
values of B-coefficients of L-histidine, L-glutamic acid, L-tryptophan and
glycylglycine in 2 M aqueous KCl and 2 M aqueous KNO3 solutions indicate the
possibility of a strong alignment of zwitterions with ions/ water dipoles. The viscosity
B-coefficient values of L-histidine, L-glutamic acid, L-tryptophan and glycylglycine
in 2M aqueous KCl and 2M aqueous KNO3 solutions are higher than the
corresponding values in pure aqueous medium. The observed higher B-coefficient
values of L-histidine, L-glutamic acid, L-tryptophan and glycylglycine in 2M aqueous
KCl and 2M aqueous KNO3 solutions than those in aqueous medium may be

164
attributed to K^-CP, K^-NO" and -COO'-K^ -NHj^-Cl" / NO" interactions
operative in the solutions.
The temperature derivative of B-coefficient values (dB/dT) have also been
calculated and listed in the Table 4.6. The positive B- coefficients alongwith positive
(dB/dT) values of L-glutamic acid in 2 M aqueous KCl and L- tryptophan in both 2 M
aqueous KCl and 2 M aqueous KNO3 solutions indicate the structure breaking nature
of these solute in the solutions. The positive B-coefficients alongwith negative
(dB/dT) values of L- glutamic acid in 2M aqueous KNO3; and of L- histidine and
glycylglycme in both 2M aqueous KCl and 2M aqueous KNO3 solutions indicate the
structure making nature of these solutes in the solutions. The structure breaking
tendency of the solute may be attributed to the domination of effect of polar part on
the apolar part of the solutes on solutions. On the other hand, the structure making
tendency of the solutes may be ascribed to the domination of effect of apolar part on
the polar part of the solutes on solutions.

RE pEREf^CES

[I] I. Haq, R.R.J. O'brein and J.E. Ladbury, in Drug-Receptor Thermodynamics:
Introduction and Application, R.B. Raffa (ed.), Wiley Chichester: UK, 2001, chapter
5.
[2] L.R. Gurley, J.G. Valdez, W.D. Spall, B.F. Smith and D.D. Gillette, J. Protein
Chem., 10,1991,75.
[3] P.R. Haberstroth and D.M. Karl, Geochim. Cosmochim. Acta, 53,1989, 2937.
[4] J.P. Amend and E.L. Shock, Science, 281,1998,1659.
[5] J.B. Corliss, J.A. Baross and S.E. Hoffman, Oceanol. Acta, 4,1981, 59.
[6] J.A. Barloss and S.E. Hoffinan, Orig. Life, 15,1985,327.
[7] Z. Yan, J. Wan, W. Kong and J. Lu, Fluid Phase Equihb., 215, 2004, 143.
[8] R. Badarayani and A. Kumar, J. Chem. Eng. Data, 48,2003, 664.
[9] R. Badarayani and A. Kumar, J. Chem. Thermodyn., 36, 2004,49.
[10] R. Badarayani and A. Kumar, J. Chem. Thermodyn., 36, 2004, 983.
[II] S.K Singh, A. Kundu and N. Kishore, J. Chem. Thermodyn. 36,2004, 7.
[ 12] S.N. Timasheff and G. D. Fasman, Structure and Stability of Biological
Macromolecules, Marcel Dekker Inc: New York, 1969, (a) chapter 2, p. 65, (b)
chapters,p. 213.
[13] F. Hofmeister, Arch. Exp. Pathol. Pharmakol., 24,1888, 247.
[14] J.P. Harrington and T.T. Herskovits, Biochemistry, 14,1975, 4972.
[15] B.Nagy and W. P. Jencks, J. Am. Chem. Soc, 87, 1965, 2480.
[16] G.R. Hedwig and H. Hoiland, J. Chem. Thermodyn., 25,1993, 349.
[17] M. Sahayam and G.R. Hedwig, J. Chem. Thermodyn., 26,1994, 361.
[ 18] T.S. Banipal and P. Kapoor, J. hidian Chem. Soc, 76,1999,431.
[19] T.S. Banipal, G. Singh and B.S. Lark, J. Solution Chem., 30, 2001, 657.
[20] R.Bhat and J. C. Ahluwalia, J. Phys. Chem., 89,1985,1099.
[21] T.S. Banipal and G. Sehgal, Thermochim. Acta, 262,1995, 175.
[22] R.K. Wadi and P. Ramasami, J. Chem. Soc. Faraday Trans., 93,1997,243.
[23] R. Bhat and J.C. Ahluwalia, Int. J. Peptide protein Res., 30,1987, 145.
[24] Riyazuddeen and N. Islam, J. Pure Appl. Ultrason., 19,1997, 165.
[25] S. Islam and B. N. Waris, Thermochim. Acta, 424,2004, 165.
[26] J.D. Pandey and V. Sanguri, Phys. Chem. Liq., 46, 2008, 417.
[27] Riyazuddeen and R. Basharat, J. Chem. Thermodyn., 38, 2006, 1684.
[28] Riyazuddeen and G.K. Bansal, Thermochim. Acta, 445, 2006,40.
[29] Riyazuddeen and I. Khan, Thermochim. Acta, 483, 2009,45.
[30] J.M. Resa, C. Gonzalez, J.M. Goenaga and M. Iglesias, Phys. Chem. Liq., 43, 2005,
65.
[31] D. Ragouvamane and A.S. Rao, Indian J. Chem., 37A, 1998, 659.

166
[32] M.C. Sheshagiri Rao, Indian J. Pure and Appl. Phys., 9,1971, 169.
[33] R.T. Beyer and S.V. Latcker, Physical Ultrasonics, Academic Press: New York,
1969.
[34] K.J. Patil, Indian J. Pure and Appl. Phys., 16,1978, 68.
[35] R.K. Dewan, S.K. Mehta and S.T. Ahmad, Asian J. Chem., 4,1992, 152.
[36] R.K. Dewan, S.K. Mehta and S.T. Ahmad, Acoust. Lett., 15,1992, 193.
[37] J.D. Pandey, K. Mishra and V. Mushran, Acustica, 80,1994, 563.
[38] M. Radhamma, P. Venkatesu, M.V. Prabhakara Rao, Ming-Jer Lee and Ho-Mu Lin,
J. Chem. Thermodyn., 40,2008,492.
[39] A. Pal, R. Gaba and S. Sharma, J. Mol. Liq., 137, 2008, 122.
[40] D.S. Wankhede, N. N. Wankhede, M. K. Lande and B. R. Arbad, J. Mol. Liq., 138,
2004,124.
[41] J.L. Liu, A.W. Hakin and G.R. Hedwig, J. Chem. Thermodyn., 38,2006, 1640.
[42] A.N. Kannappan and R. Palani, Indian J. Chem., 46A, 2007,60.
[43] M.S. Santosh, D. K. Bhat and A. S. Bhat, J. Chem. Eng. Data, 2009, doi: 10.1021/
je800732f.
[44] R.K.O. Apenten, B. Buttner, B. Mignot, D. Pascal and M. J. W. Povey, Food
HydrocoUoids, 14,2000, 83.
[45] W.P. Leung, K.C. Cho, Y. M. Lo and C.L. Choy, Biochim. et Biophys. Acta-Protein
Structure and Molecular En2ymology, 870,1986, 148.
[46] J.D. Pandey, A. Misra, N. Hasan and K. Misra, Accoust. Lett., 15,1991, 105.
[47] J.D. Pandey, S. Haroon, K.K. Dubey, M. Upadhyaya, R. Dey and K. Misra, Can. J.
Chem., 78,2000, 1561.
[48] S. Govindarajan, V. Kannappan, M.D. Naresh, K. Venketaboopathy and B.
Lokanadam, J. Mol. Liq., 107, 2003, 289.
[49] Q.J. Ahmad, Physico-Chemical Studies of Multicomponent Systems, Ph.D. Thesis,
A. M. U., Aligarh, India, 1999.
[50] A. Ali, Abida, S. Hyder and A. K. Nain, Collect Czech. Chem. Comm., 67, 2002,
1125.
[51] A. Ali, A. K. Nain, N. Kumar and M. Ibrahim, Chinese J. Chem. 21,2003, 253.
[52] A. Ali and A. K. Nain, Bull. Chem. Soc. Jpn., 75,2002, 681.
[53] J.S. Shah and M. E. Straumanis, Solid State Comm., 10,1972, 159.
[54] N.P. Rao and R.E. Verrall, Can. J. Chem., 65,1987, 810.
[55] H. Endo, Bull. Chem. Soc. Jpn., 46,1973,1106.
[56] F.J. Millero, in Water and Aqueous Solution: Structure, Thermodynamics and
Transport Process, R. A. Home (ed.), Willey Interscience: New York, chapter 13,
1972.
167
[57] U.N. Dash and N. N. Pasupalak, Indian J. Chem., 36A, 1997, 834.
[58] F.J. MiUero, G.K. Ward, F.K. Lepple and E.V. Hofif, J. Phys. Chem., 78,1974,1636.
[59] J.D. Pandey, B.R. Chaturvedi and N. Pant, Acoust. Lett., 4,1980, 92.
[60] M.R. Islam and S. K. Quadri, Acoust. Lett., 11,1988,219.
[61] J.D. Pandey, G. P. Dubey, B. P. Shukla and S. N. Dubey, Acustica, 80,1994, 92.
[62] J.O. Hirschfeider, C.F. CXirtiss and R.B. Bird, Molecular Theory of Gases and
Liquids, John Wiley and Sons: New York, 1957, p. 286.
[63] J.G. Mathieson and B.E. Conway, J. Solution Chem., 3,1974,455.
[64] H. Holland, in Thermodynamic Data for Biochemistry and Biotechnology, H.J. Hinz
(ed.), Springer-Verlag: Berlin, 1986, chapter 4.
[65] F.J. MiUero, G.K. Ward and P. Chetirkin, J. Biol. Chem., 251,1976,4001.
[66] G.R. Hedwig and H. Holland, Phys. Chem. Chem. Phys., 6, 2004, 2440.
[67] J.D. Pandey and Vyas, Pramana- J. Phys., 43,1994,36.
[68] J.G. Mc Gowan, Nature, 210,1966, 1255.
[69] N. Aurbach, Experimentia, 4,1948,473.
[70] J.L. Lebowitz, H. L. Frisch and E. Hefand, J. Chem. Phys., 34,1961,1037.
[71] E.J. Thiele, J. Chem. Phys., 39,1963,474.
[72] E.A. Guggenheim, Mol. Phys., 9,1965,43.
[73] W.G. Hoower and F.H. Ree, J. Chem, Phys., 46,1966,4181.
[74] W.G. Hoower and F. H. Ree, J. Chem, Phys., 49,1968,3609.
[75] N.F. Camahan and K. E. Starling, J. Chem. Phys., 51,1969, 635.
[76] D. Henderson, J. A. Baker, Mol. Phys., 21,1971,187.
[77] D. Henderson, Mol. Phys., 30,1975, 971.
[78] H.L. Frisch, Adv. Chem. Phys., 6,1964,229.
[79] W.W. Wood, J. Chem. Phys., 52,1970, 729.
[80] E.J. LeFevre, Nature, 20,1972,235.
[81] L.V. Woodcock, J. Chem. Soc. Faradey Trans. II, 72,1976,731.
[82] L.V. Woodcock, J. Chem. Soc. Faradey Trans. II, 74,1978, 11.
[83] R.J. Speedy, J. Chem. Soc. Faradey Trans. II, 73,1977,714.
[84] C.V. Chaturvedi and S. Pratap, Acustica, 42,1979,260.
[85] J.D. Pandey and K. Misra, Acoust. Lett., 6, 1983, 148.
[86] S.S. Dhondge and L. Ramesh, J. Chem. Thermodyn., 39, 2007, 667.
[87] S.S. Dhondge, C. Pandhumekar and L. Ramesh, J. Chem. Thermodyn., 40, 2008, I.
[88] G.R. Hedwig, J. Phys. Chem., 99, 1995, 12063.
[89] A.A. Yayanos, J. Phys. Chem., 97, 1993, 13027.
[90] V.A. Buckin, Biophys. Chem., 29,1988, 283.
[91] M.B. Ewing and K. N. Marsh, J. Chem. Thermodyn., 10,1978, 267.

168
[92] T. Hofinan, A. Golden, A. Nevines and T. M. Letcher, J. Chem, Thermodyn., 40,
2008,580.
[93] R. Wedberg, G.H. Peters and J. Abildskov, Fluid Phase Equilib., 273,2008, 1.
[94] J.H. Hildebrand and R, K. Scott, The Solubility of Non-Electrolytes, Dover
Publications: New York, 3"'edn., 1964, chapters V, XXIII and appendix I,
[95] J.M. Prausnitz, Molecular Thermodynamics of Fluid Phase Equilibria, Englewood
Cliffs; Prentice Hall: N. J., 1969, chapter 7.
[96] A.F.M. Barton, J. Chem. Edu., 48,1971,156.
[97] A.F.M. Barton, J. Chem. Rev., 75,1975, 731.
[98] L.A.K. Stavely, W.J. Tupman and K. R. Hart, Faraday Trans. Soc. Disc, 15,1953,
130.
[99] H. MacDonald, G. Marangom and R. Palepu, Thermochim. Acta, 84,1985, 157.
[100] M. Alagar, M. Ponnusamy and V. Krishnasamy, Ultrasonics, 28,1990, 386.
[101] C.V. Suryanarayana, Ultrasonics, 31,1993,281.
[102] V. Tewari and J. D. Pandey, Z. Phys. Chem, (Leipzig), 262,1981,53.
[103] J.D. Pandey, N. Pant and B. R. Chaturvedi, Chem. Scr., 18,1981,224.
[104] J.D. Pandey, A. K. Shukla, N. Tripathi and G. P. Dubey, Pramana-J. Phys., 40,1993,
81.
[105] R. Basharat, Physico-Chemical Studies of Molecular hiteractions, Ph.D.Thesis, A. M.
U., Aligarh, India, 2004.
[106] G.K. Bansal, Physico-Chemical Studies of Ternary Systems, Ph.D. Thesis, A. M. U.,
Aligarh, hidia, 2005.
[107] D. Kumar, Physico-Chemical Studies of Multicomponent Systems, Ph.D. Thesis,
A. M. U., AUgarh, India, 2006.
[108] I. Khan, Physico-Chemical Studies of Ternary Systems, Ph.D. Thesis, A. M. U.,
Aligarh, hidia, 2008.
[109] R. Palepu and H. MacDonald, Thermochim. Acta, 87,1985,151,
[110] T. Singh and A. Kumar, J. Phys. Chem. B, 112, 2008, 12968.
[111] E.K. Goharshadi and F. Nazari, Fluid Phase Equihb., 187, 2001,425.
[112] J. Amoros, J. R. Solana and E. Villar, Mat. Chem. Phys., 10,1984, 557.
[113] J.A.R. Renuncio, G. J. F. Breedveld and J. M. Prausnitz, J. Phys. Chem., 81,1977,
324.
[114] J.D. Pandey, P. Dubey and M. C. Saxena, Acustica, 48,1981, 277.
[115] A. Lucia and E. J. Finger, Adv. Environ. Res., 8,2004, 197.
[116] M. Arellano, I.M.-Zloczower and D. L. Fake, Powder Tech., 84,1995, 117.
[117] A. Grubemmann, Dyes and Pigments, 21,1993, 273.
[118] L.A. Kleintjens, Fluid Phase Equilib., 53,1989,289.
169
[119] CM. Hansen, Progress Org. Coatings, 51,2004, 77.
[ 120] J. Plessis, J. Pharm. Sci., 16,2002,107.
[121] B.C. Hancock, P. York and R. C. Rowe, Int. J. Pharm., 148,1997,1.
[122] J.A. Biydson, Plastics, London, 26,1961, 107.
[123] H. Burrell, Off. Dig, Fed. Paint Vam. Prod. Clubs, 27,1955, 726.
[124] H. Burrell, Interchem Rev., 14,1955,31.
[125] H. Burrell, J. Paint Technol., 40,1968,197.
[126] L. Knopoff and J. N. Shaprio, Phys. Rev. Bl, 1970,3893.
[127] S.K. Kor, U. S. Tandon and B. K. Singh, Phys. Lett. A, 38,1972,187.
[128] B.P. Shukla, V. N. Mishra and S. N. Dubey, Curr. Sci., 52,1983,721.
[129] J.N.C. Lopes, L. P. N. Rebelo and G. Jancso, J. Mol. Liq., 54,1992,115.
[130] J. Amoros, J. R. Solana and E. Villar, Mat. Chem. Phys., 20,1988,255.
[131] B.K. Sharma, Ultrasonics, 25, 1987, 365.
[132] B.K. Sharma, Phys. Lett. A, 101,1984,405.
[133] S.K. Kor and S. K. Pandey, Ultrasonics, 29,1973, 63.
[134] P.D. Golub' and 1.1. Perepechko, Polymer Sci., U. S. S. R, 16,1974,1847.
[135] S.K. Kor and U. S. Tandon, Solid State Comm., 11,1972, 963.
[136] U.S. Tandon and S. K. Pandey, Phys. Lett. A, 41,1972, 161.
[137] J.S. Shah and M. E. Straumanis, SoHd State Comm., 10,1972, 159.
[138] 1. Martinez, C. S.-Valle, I. Daniel and B. Reynard, Chem. Geol., 207, 2004, 47.
[139] C. Liu, L. Zhuo and R. Lin, J. Solution Chem., 36, 2007, 923.
[140] CM. Romero and M.S. Paez, J. Solution Chem., 36, 2007, 237.
[141] S.P. Ziemer and E.M. Wooly, J. Chem. Thermodyn., 39, 2007, 67.
[142] T.S. Banipal, K. Singh and P.K. Banipal, J. Solution Chem., 36, 2007, 1635.
[143] M. Singh and M. Pandey, Phys. Chem. Liq., 46, 2008,119.
[144] T.S. Banipal, D. Kaur, P.K. Banipal and G. Singh, J. Mol.Liq., 140, 2008, 54.
[145] Bhanupriya, R.P. Rajwade and R. Pande, J. Chem. Eng. Data, 53, 2008, 1458.
[146] R. Sadeghi and B. Goodarzi, J. Mol. Liq., 141, 2008, 62.
[147] R.A. Clara, A.CG. Marigliano and H.N. Solimo, J. Chem. Thermodyn., 40, 2008, 292.
[148] K. Zhuo, Y. Chen, W. Wang and J. Wang, J. Chem. Eng. Data, 53, 2008, 2022.
[149] A.M. Seuvre and M. Mathlouthi, Food Chemistry, 2009, doi: 10.1016/j. foodchem. 2009.04.101.
[150] M.J. Iqbal and M.A. Chaudhry, J. Chem. Eng. Data, 54, 2009, 1643.
[151] K. Gekko and Y. Hasegawa, Biochemistry, 13,1986, 145.
170
[152] M. Iqbal and R.E. Verrall, J. Phys. Chem., 91,1987,967.
[153] D.P. Kharakoz and A.P. Sarvazyan, Biopolymers, 33,1993,11.
[154] B. Nolting and S. G. Sligar, Biochemistry, 32,1993,12319.
[155] Y. Tamura and K. Gekko, Biochemistry, 34,1995,1878.
[156] T.V. Chalikian, V. S. Gindikin and K. J. Breslauer, J. Mol. Biol., 250,1995,291.
[ 157] T.V. Chalikian, V. S. Gindikin and K. J. Breslauer, FASEBJ., 10,1996, 164.
[158] T.V. Chalikian, M. Totrov, R. Abagyan and K.J. Breslauer, J. Mol. Biol., 260,1996,
588.
[159] T.V. Chalikian, J. Volker, D. Anafi and K. J. Breslauer, J. Mol. Biol., 274,1997,237.
[160] T.V. Chalikian, and K. J. Breslauer, Proc. Natl. Acad. Sci., USA, 93,1996, 1012.
[161] T.V. Chalikian and K. J. Breslauer, Biopolymers, 39,1996,619.
[162] J. Traube, Sammlung Chemischer and Chemischnischer Vortrage, 4,1899, N 7.
[163] A.A. Zamyatain, Prog. Biophys. Mol. Biol., 24,1972,109.
[164] A.A. Zamyatnin, Annu. Rev. Biophys. Bioeng., 13,1984,145.
[165] E.J. Cohn and J.T. Edall, Proteins, Amino acids and Peptides as Ion, Reinhold: New
York, 1943.
[166] J.P. Greenstein and M. Winitz, Chemistry of the Amino acids, Willey-Interscience:
New York, 1961.
[167] J.W. Larson and L. G. Helper, Solute-Solvent Interactions, J. F. Coetzee and C. D.
Ritchie (eds.), Macel Dekker: New York, 1969.
[168] T.V. Chalikian, A.P. Sarvazyan and K.J. Breslauer, Biophys. Chem., 51,1994, 89.
[169] T.V. Chalikian, Annu. Rev. Biophys. Biomol. Struct., 32, 2003 ,207.
[170] B. Nolting, M. Jiang and S. Sligar, J. Am. Chem. Soc, 115,1993,9879.
[171] D.P. Kharakoz and V. E. Bychkova, Biochemistry, 36,1997, 1882.
[172] T.V. Chalikian and N. Taulier, Biochim Biophys. Acta, 1595, 2002,48.
[173] D.P. Kharakoz, Biochemistry, 36,1997,10276.
[174] H.J.V. Tyrrell and M. Kennerley, J. Chem. Soc. (A), 1968,2724.
[ 175] A.W. Hakin, A.K. Copeland, J.L. Liu, R.A. Marrion and K.E. Preuss, J. Chem Eng.
Data, 42,1997, 84.
[176] K.B. Belibagli and E. Ayranci, J. Solution Chem. 19,1990, 867.
[177] Z. Yan, J. Wang and J. Lu, J. Chem. Eng. Data, 46, 2001,217.
[178] T.S. Banipal, D. Kaur and P. K. Banipal, J. Chem. Eng. Data, 49, 2004, 1236.
[ 179] T.S. Banipal, D. Kaur, P. Lai, G. Singh and P.K. Banipal, J. Chem. Eng. Data, 47,
2002, 1391.
[180] Q. Liu, Y. Hu, R. Lin, W. Sang and S. Li, J. Chem. Eng. Data, 46, 2001, 522.
[181] E. Ayranci, Thermochim. Acta, 232,1994,297.
171
[ 182] A. Ali, S. Sabir and M. Tariq, Acta Phys.-Chim. Sin., 23, 2007, 79.
[183] R. Badarayani and A. Kumar, J. Solution Chem., 33,2004,407.
[184] W. Devine and B.M. Lowe, J. Chem. See. A, 1971, 2113.
[185] H. Rodriguez, A. Soto, A. Arce and M.K. Khoshkbarchi, J. Solution Chem. 32, 2003,
53.
[186] B.N. Wans, U. Hasan and Srivastava, Thermochim. Acta, 375,2001,1.
[187] S. Lapanje, Biochim. et Biophys. Acta-Protein Structure, 243,1971,357.
[188] Z. Yan, J. Wang, W. Liu and J. Lu, Thermochim. Acta, 334,1999,17.
[189] Z. Yan, J. Wang and J. Lu, Biophys. Chem., 99, 2002, 199.
[ 190] J. Wang, Z. Yan, Y. Zhao and F. Cui, J. Chem. Eng. Data, 49, 2004,1354.
[191] J. Wang, Z. Yan H. Zhang and J. Lu, Biophys. Chem., 86,2000, 71.
[192] N.C. Dey, B.K. Saikia and I. Haque, Can. J. Chem., 58,1980,1512.
[193] J.S. Sandhu and U. Kashyap, Indian J. Chem., 26A, 1987, 952.
[194] J. Wang, Z. Yan and J. Lu, J. Chem. Thermodyn., 36,2004,281.
[195] L. Paduano, R. Sartorio, V. Vitagliano and L. Costantino, J. Mol. Liq., 47,1990,193.
[196] B. Schobert and H. Tschesche, Biochim. et. Biophys. Acta, 541,1978,270.
[ 197] C.W. Fountain, J. Jennings, C.K. McKie, P. Oakman and M.L. Fetterolf, J. Chem.
Educ, 74,1997, 224.
[198] D.M. Swenson, M.B. Blodgett, S.P. Ziemer and E.M. Wooley, J. Chem. Thermodyn.,
40, 2008,292.
[199] M.M.H. Bhuiyan, J. Ferdaush and M.H. Uddin, J. Chem. Thermodyn., 39, 2007,675.
[200] R. Gupta and M. Singh, J. Chem. Thermodyn., 117, 2005,275.
[201 ] Z. Yan, J. Wang, H. Zhang and X. Xuan, J. Chem. Eng. Data, 50, 2005, 1864.
[202] J.L. Richards, J. Chem. Edu., 70,1993, 685.
[203] D. Jones and M. Dole, J. Am. Chem. Soc, 51,1929, 2950.
[204] T.S. Banipal, G. Singh and B.S. Lark, Indian J. Chem., 39A, 2000, 1011.
[205] R.K. Wadi and R.K. Goyai, J. Solution Chem., 21,1992,163.
[206] J. Wang, Z. Yan, K. Zhuo and J. Lu, Biophys. Chem., 80,1999, 179.
[207] S.K. Smgh and N. Kishore, J. Solution Chem., 32, 2003,117.
[208] T. Ogawa, K. Mizutani and M. Yasuda, Bull. Chem. Soc. Jpn., 57,1984,2064.
[209] D. Kumar, Can. J. Chem. 77,1999, 1288.
[210] B.S. Lark, D. Kaur and P. K. Banipal, J. Chem. Eng. Data, 49, 2004, 553.
[211] M. Natarajan, R. K. Wadi and H. C. Gaur, J. Chem. Eng. Data, 35,1990, 87.
[212] T.S. Banipal and G. singh, Thermochim. Acta, 412,2004, 63.
[213] Z. Yan, J. Wang and J. Lu, Biophys. Chem., 99, 2002, 199.
[214] R.K. Wadi and R. K. Goyai, J. Chem. Eng. Data, 3 7,1992, 3 77.

172
[215] Z. Yan. J. wang, W. Liu and J. Lu, Z. Phys. Chem. (Leipzig), 211,1990,121.
[216] T.S. Banipal, D. Kaur and P. K. Banipal, J. Chem. Thermodyn., 38,2006, 71.
[217] A. Pal and S. Kumar, J. Mol. Liq., 109,2004,23.
[218] B.N. Waris, U. Hassan and N. Srivastava, Indian J. Chem., 40 A, 2001, 1218.
[219] G. Kumar, N.C. Dey and B.K. Saikia, Z. Phys.Chem. (N. F.) 149,1986,183.
[220] T.S. Banipal, A. Bhatia, P. K. Banipal, G. Singh and D. Kaur, J. Indian Chem. Soc,
81,2004,126.
[221] C. Zhao, P. Ma and M. Kennereley, J. Chem. Thermodyn., 37, 2005, 37.
[222] S.K. Singh and N. Kishore, J. Solution Chem., 33,2004,1411.
[223] T.S. Banipal, D. Kaur and P.K. Banipal, J. Chem. Thermodyn., 38, 2006, 1214.
[224] R.H. Stokes and R. Mills, Viscosity of Electrolytes and Related Properties,
Pergamon: London, 1965.
[225] L.S. Mason, P. M. Kanpmeyer and R. L. Robinson, J. Am. Chem. Soc, 74,1952,
287.
[226] J.M. Tsangaris and RB. Martin, Arch. Biochem. Biophys., 112,1965,267.
[127] E.R. Nightingale and R F. Benck, J. Phys. Chem., 63,1959,177.
[228] W.M. Cox and J.H. Wolfenden, Proc. R. Soc, Lond. A, 145,1934,475.
[229] R.W. Gumey, Ionic Processes in Solution, McGraw-Hill: New York, 1953, p. 166.
[230] M. Kaminsky, Z. Naturforsch, 129,1957,424.
[231] J. Kirshnerova, P.G. Farrell and J.T. Edward, J. Phys. Chem., 80,1976, 1974.
[232] D. Kumar, J. hidian Chem. Soc, 74,1997, 610.
[233] Y. Yasuda, N. Tochio, M. Sakurai and K. Nitta, J. Chem. Eng. Data, 43,1998,205.
[234] P. Venkatesu, M. J. Lee and Ho-Mu Lin, J. Chem. Thermodyn., 39, 2007, 1206.
[235] Y. Akhtar, Fluid Phase Equilib., 258, 2007,125.
[236] A. Soto, A. Arce and M.K. Khoshkbarchi, Biophys. Chem., 74,1998, 165.
[237] A. Soto, A. Arce and M.K. Khoshkbarchi, Biophys. Chem., 76,1999, 73.
[238] Ju-Lin Shen, Zhi-Fen Li, Bao-Huai Wang and You-Min Zhang. J. Chem.
Thermodyn., 32, 2000, 805.
[239] Q. Yuan, Zhi-Fen Li and Bao-Huai Wang, J. Chem. Thermodyn., 38, 2006, 20.
[240] G. Lin, R. Lin and L. Ma, Thermochim. Acta, 430, 2005, 31.
[241] G. Lin, P. Bian and R. Lin, J. Chem. Thermodyn., 38, 2006, 144.
[242] P. Ramasami and R. Kakkar, J. Chem. Thermodyn., 38, 2006, 1385.
[243] G. S. Kell, J. Chem. Eng. Data, 20,1975, 97.
[244] H. Kashiwagi, T. Hashimoto, Y. Tanaka, H. Kubota and T. Makita, Int. J.

173
Thermophys., 3,1982,201.
[245] J. Kestin, M. Sokolov and W. A. Wakeham, J. Phys. Chem. Ref. Data, 7,1980,941.
[246] G. S. Kell, J. Chem. Eng. Data, 15,1970, 119.
[247] S. Singh, R. Singh, N. Prasad and S. Prakash, Ind. J. Pure Appl. Phys., 15,1977, 629.
[248] P. G. Rohankar and A. S. Aswar, Indian J. Chem., 41 A, 2002,312.
[249] T. S. Banipal and G. Singh, Indian J. Chem., 43 A, 2004,1156.
[250] G. R. Hedwig and H. Holland, J. Chem. Thermodyn., 23,1991,1029.
[251 ] A. Soto, A. Arce and M. K. Khoshkbarchi, J. Solution Chem., 33,2004,11.
[252] T. Hianik, P. Rybar, G.M. Kostner and A. Hermetter, J. Biol. Chem., 67,1997,221.
[253] K.C. Cho, W.P. Leung, H.Y. Mok and C.L. Choy, Biochim. Biophys. Acta, 830,
1985,36.
[254] R. Randall, Bur. Standards J. Res., 8,1932,79.
[255] U. Hedaira and Y. Suzuki, Bull. Chem. Soc. Jpn., 52,1979,2787.
[256] P.R. Malasane and A.S. Aswar, Indian J. Chem. Tech., 12,2005,689.
[257] P.K. Nandi and D. R. Robinson, J. Am. Chem. Soc, 94,1972,1299; 94,1972, 1308.
[258] P.H. Von Hippel and T. Scheich, in Structure and Stability of Biological
Macromolecules, S. N. Timasheff and G.D. Fasman (eds.). Marcel Dekker Inc.: New
York,vol. 2,1969,p.417.
[259] W.P. Jencks, Catalysis in Chemistry and Enzymology, Mc Graw Hill: New York,
1969, p. 351.
[260] P. H. Von Hippel and T. Schleich, Ace. Chem. Res., 30,1987, 145.
[261] F. Hirata, and K. Arakawa, Bull. Chem. Soc. Jpn, 45,1972,2715.
[262] S. Magazu, Migliardo and A.M. Musolino, J. Chem. Phys. B., 101,1997, 2348.
[263] N. Rohman and S. Mahiuddin, J. Chem. Soc. Faraday Trans., 93,1997, 2053.
[264] S. Ernst and R. Manikowski, J. Chem. Eng. Data, 42,1997, 647.
[265] T.V. Chalikian, A.P. Sarvazyan, T. Funck, C.A. Cain and K.J. Breslauer, J. Phys.
Chem., 98,1994,321.
[266] I. Mozo, J.A. Gonzalez, I.G. de la Fuente, J.C. Cobos and N. Riesco, J. Mol. Liq.,
140,2008,87.
[267] L. Hall, Phys. Rev., 73,1948, 775.
[268] K. Arakawa and K. Sasaki, Bull. Chem. Soc. Jpn., 42,1969, 303.
[269] F.J. Millero, A. L. Surdo and C. Shin, J. Phys. Chem., 82,1978, 784.
[270] D.S. Wankhede, N.N. Wankhede, M.K. Lande and B.R. Arbad, J. Mol. Liq., 138,
2008, 124.
[271] S.N. Rao, K. V. Rao and K.S. Rao, Indian J. Pure Appl. Phys. 11,1973,407.
[272] D. D. Despande and L.G. Bhatgadde, J. Phys. Chem., 72,1963,261.

174
[273] L.G. Bhatgadde, S. Oswal and C. S Prabhu, J. Chem., Eng. Data, 61,1971,469.
[274] B.P. Shukla and S. N. Dubey, Acoust. Lett., 9,1985, 71.
[275] A.F.S.S. Mendonca, S.M.A. Dias, F.A. Dias, B.A.S. Barata, I.M.S. Lamperia, Fluid
Phase Equilib., 212,2003,67.
[276] A.P. Sarvazyan, D.P. Kharakoz, P. Hemmas, J. Phys. Chem., 83,1979, 1796.
[277] A.W. Hakin, H. Holland and G. R. Hedwig, Phys. Chem. Chem. Phys., 2, 2000,4850.
[278] J.H. Hildebrand and R.L. Scott, Regular Solutions, England Cliffs; Prentice Hall:
New Jersey, 1962.
[279] J.H. Hildebrand and R.L. Scott, Solubility of Non-Electrolytes, Reinhold: New York,
3"'edn., 1950.
[280] D.D. Macdonald and J. B. Hyne, Chem., 49,1971, 611.
[281] S.V. Subramanyam, T. Ramanuujappa and E. S. Raja Gopal, Acustica, 52,1983,
125.
[282] C.V. Suryanarayana, Indian J. Pure Appl. Phys., 27,1989, 751.
[283] M.R. J. Dack, Aust. J. Chem., 28,1975, 1643.
[284] M. R. J. Dack, J. Chem. Soc. Rev. (G.B.), 4,1975,211.
[285] R.D. Dunlop and R. L. Scott, J. Phys. Chem., 66,1962, 631.
[286] L.I. Acevedo, G. C. Pnedrosa and U. Kartz, J. Solution Chem., 19,1990, 11.
[287] M.R.J. Dack, Aust. J. Chem., 29,1976, 779.
[288] J.D. Pandey and R.L. Mishra, Acustica, 39,1978, 200.
[289] J.D. Pandey and V. Tiwari, Z. Phys. Chem. (Leipzig) 4,1981, S 53.
[290] D.R. Rosseinsky, J. Phys. Chem., 81,1977, 1578.
[291] R.K. Shukla, S. K. Shukla, V. K. Pandey and P.Awasthi, J. Mol. Liq., 135, 2008,104.
[292] L. Knoff and J.N. Shapiro, Phys. Rev., B-1,1970, 3839.
[293] H.C. Pandey and J.D. Pandey, Phys. Stattis Solidi, 65,1974, K-149.
[294] R.P. Jain and J. D. Pandey, Indian J. Pure Appl. Phys., 12,1974, 830.
[295] M. Yasmin, K.P. Singh, S. Parveen, M. Gupta and J.P. Shukla, Acta Physica Polonica
A, 115,2009,890.
[296] N. Auerbach, Exprimentia 4,1948,473.
[297] F.J. Millero. R.W. Curry and W. Drost-Hansen, J. Chem. Eng. Data, 14, 1969, 422.
[298] F.J. Millero and F.K. Lepple, J. Chem. Phys., 54,1971, 946.
[299] F.S. Featas and D.J.G. Ives, J. Chem. Soc, 1956, 2798.
[300] J.V. Leyendekkers, J. Chem. Soc, Faraday Trans., 179,1983, 1109.
[301] I.A.K. Staveley, W.J. Tupman and K.R. Hart, Trans. Faradey Soc, 51,1955, 323.
[302] S. Cabani, G. Conti, E. Matteoli and M.R. Tine, J. Chem. Soc. Faraday Trans., 177,
1981, 2377.
[303] H. Holland, J. Solution Chem., 9,1980, 857.
175
[304] J.V. Leyendekkers, J. Chem. Soc. Faraday Trans. I, 84,1988,397.
[305] T.V. Chalikian, A. Priev, G. Barshtein, B. Gavish and S. Yedgar. Biochim. et
Biophys. Acta-Protein Structure and Molecular Enzymology, 1382,1998,151.
[306] J.P. Hershey, S. Sotolongo and F. J. Millero, J. Solution Chem., 12,1979,233.
[307] J.F. Reading, I. D. Watson and G. R. Hedwig, J. Chem. Thermodyn., 22,1990,159.
[308] A.W. Hakin, M.M. Duke, J.L. Marty and K.E. Preuss, J. Chem. Soc. Faraday Trans.,
90,1994,2027.
[309] M. Hackel, H. -J. Hinz and G.R. Hedwig, Phys. Chem. Chem. Phys., 2,2000,4843.
[310] J.V. Leyendekkers, J. Phys. Chem. 90,1986, 5449.
[311] C. Jolicoeur, N.B. Riedle, D. Desrochers, L.L. Lemelin, R. Zamojska and O. Enea, J.
Solution Chem., 15,1986,109.
[312] A.W. Hakin, M.M. Duke, S. A. Klassen, R.M. Mckay and K.E. Preuss, Can. J. Chem.
72,1994, 362.
[313] G.R. Hedwig, J. Chem. Thermodyn., 2009, doi: I0.1016/j.jct.2009.08.004.
[314] T.S. Banipal, D. Kaur, P.K. Banipal and G. Singh, J. Chem. Thermodyn., 39, 2007,
371.
[315] A. Ali, S. Khan, S. Hyder and M. Tariq, J. Chem. Thermodyn., 39,2007, 613.
[316] K.P. Prasad and J, C. Ahluwalia, Biopolymers, 19,1980,263.
[317] Riyazuddeen and I. Khan, Int. J. Thermophys., 30,2009,475.
[318] X. Ren. R. Lin. Y. Ni and H. Zong, Can. J. Chem., 77,1999,387.
[319] LM.S. Lampreia and L. A. V. Ferreia, J. Chem. Soc. Faraday Trans., 92,1996, 27.
[320] D.P. Kharakoz, J. Phys. Chem., 95,1991, 5634.
[321] T.V. Chalikian, A. P. Sarvazyan and J. K. Bresiauer, J. Phys. Chem., 97,1993,
13017.
[322] M. Iqbal and T. Ahmed, hidian J. Chem., 32A, 1993,119.
[323] LN.B. MaHick and R. K. Mohanty, Indian J. Chem., 25A, 1986, 1089.
[324] R. Badarayani and A. Kumar, Fluid Phase Equilib., 201, 2002, 321.
[325] L.H. Laliberte and B. E. Conway, J. Phys. Chem., 74,1970,4116.
[326] G.R. Hedwig and J. F. Reading, J. Chem. Soc. Faraday Trans., 87,1991, 1751.
[327] J.E. Desnoyers, Pure Appl. Chem., 54,1982, 1469.
[328] A. Ali and Shahjahan, Z. Phys. Chem., 222, 2008, 1519.
[329] T.S. Banipal, K. Singh, P. K. Banipal and J. Kaur, J. Chem. Thermodyn., 40, 2008,
1166.
[330] M. Iqbal and R. E. Verrall, Can. J. Chem., 67,1989, 727.
[331] M. Kikuchi, M. Sakurai and K. Nitta, J. Chem. Eng. Data, 40,1995, 935.
[332] A.K. Mishra and J.C. Ahluwalia, J. Phys. Chem., 88,1984, 86.
[333] A.S. Aswar, Indian J. Chem. Tech., 12,2005, 689.

176
[334] F. Franks, M.A.J. Quickenden, D.S. Reid and B. Watson, Trans. Faraday Soc, 66,
1970, 582.
[335] F. Shahidi, P.G. Farrell and J. T. Edwards. J. Solution Chem., 5,1976, 807.
[336] D.P. Kharakoz, Biophysical Chemistry, 34,1989,115.
[337] J.D. Pandey and A. Yasmin, Proc. Indian Acad. Sci., 109,1997, 289.
[338] A.P. Mishra and S. K. Gautam, Indian J. Chem., 40 A, 2001,100.
[339] Riyazuddeen and I. Khan, J. Chem. Thermodyn., 40,2008, 1549.
[340] R. Sadeghi, B. Goodarzi and K. Karami, J. Chem. Eng. Data, 54, 2009, 791
[341] A. Pal and N. Chauhan, J. Mol. Liq., 2009, doi: 10.1016/j.molliq.2009.07.014.
[342] A.K. Nain and D. Chand, J. Chem. Thermodyn., 41,2009,243.
[343] T.T. Berezov and B.F.Korovkin, Biologicheskaya Khimiya, Biological Chemistry,
Meditsina: Moscow, 1998.
[344] S.D. Varfolomeev, Khimicheskaya Enzimologiya, Chemical Enzymology,
Akademiya: Moscow, 2005.
[345] A. Ali, S. Sabir, A.K. Nain, S. Hyder, S. Ahmad, M. Tariq and R. Patel, J.
Chin. Chem. Soc, 54,2007, 659.
[346] B.S. Lark, P. Patyar and T.S. Banipal, J. Chem. Thermodyn., 39, 2007, 344.
[347] B. Sinha, V.K. Dakua and M.N. Roy, J. Chem. Eng. Data, 52,2007, 1768.
[348] A. Ali, M. Tariq, R. Patel and F.A. Ittoo, Colloid Polym. Sci., 286, 2008, 183.
[349] J.S. Sandhu and G. Singh, J. Indian Chem. Soc, 65,1988, 173.
[350] A. Ali, S. Hyder, S. Sabir, D. Chand and A.K. Nain, J. Chem. Thermodyn., 38, 2006,
136.
[351] R. Badarayani, B. Satpute and A. Kumar, J. Chem. Eng. Data, 50,2005, 1083.
[352] E. Bianchi, A. Bicchi and G. Conic, J. Macromol. Sci. Chem., Part A: Pure and
Applied Chemistry, 1,1967,909.
[353] R.H. Chen and M.L. Tsaih, hit. J. Biol. Macromol., 23,1998, 135.
[354] N.V. Pogodina, G.M. Pavlov, S.V. Bushin, A.B. Mal'nikov, Y.B. Lysenko, L. A.
Nud'ga, V.N. Marsheva, G.N. Marchenko and V.N. Tsvetkov, Polym Sci.: USSR,
1986, p. 251.
[355] M. Rinaudo and A. Domard, in Chitin and Chitosan: Sources, Chemistry,
Biochemistry, Physical Properties and Applications, G. Skjak-Brjek, T. Anthonsen
and P. Sandford (eds.), Elsevier Applied Science: London, 1989, p. 71.
[356] L.J. Filar, M.G. Wirick, in P rod" International Conference on Chitin/Chitosan,
R.A.A. Muzzarelli and E.R. Pariser (eds.), MA: MIT Sea Grant Program,
Cambridge, 1978, p. 169.
[357] R.H. Chen and W.C. Lin., J. Fish Soc. Taiwan, 19,1992, 299.

177
[358] D. Henley, Arkiv For Kemi 18,1962,327.
[359] B. Launay, J. L. Doublier and G. Cuvelier, in Functional Properties of Food
Macromolecules, J.R. Mitchell and D.A. Ledward (eds.), Elsevier Applied
Science: London, 1986, p. 1.
[360] H. Noguchi, in Water Activity: Influences on Food Quality, L.B Rockland and G.F
Stewart (eds.), Academic Press: New York, 1981, p. 281.
[361] S.J. Kharat, J. Mol. Liq., 140,2008,10.
[362] R. Palepu, J. Oliver and D. Campbell, J. Chem. Eng. Data, 30,1985,355.
[363] T. Zamir, A. Khan, F. Uddin and S. Durrani, J. Chem. Eng. Data, 53,2008,2746.
[364] H. Falkenhagen and M. Dole, Z. Phys., 30,1929, 611.
[365] H. Falkenhagen and E.L. Vernon, Z. Phys., 33,1932, 140.
[366] D. Feakins, D.J. Freemantle and K.G. Lawrence, J. Chem. Soc, Faraday Trans., 70,
1974,95.
[367] T.C. Bai and G.B. Yan, Carbohydr. Res., 338,1999,2921.
[368] M. Kaminsky, Discuss. Faraday Soc, 24,1957,171.
[369] H. Zhao, Biophys. Chem., 122, 2006,157.
[370] O.P. Awasthi and P.P. Rastogi, J. Indian Chem. Soc, 57,1980, 1204.
APPENDIX
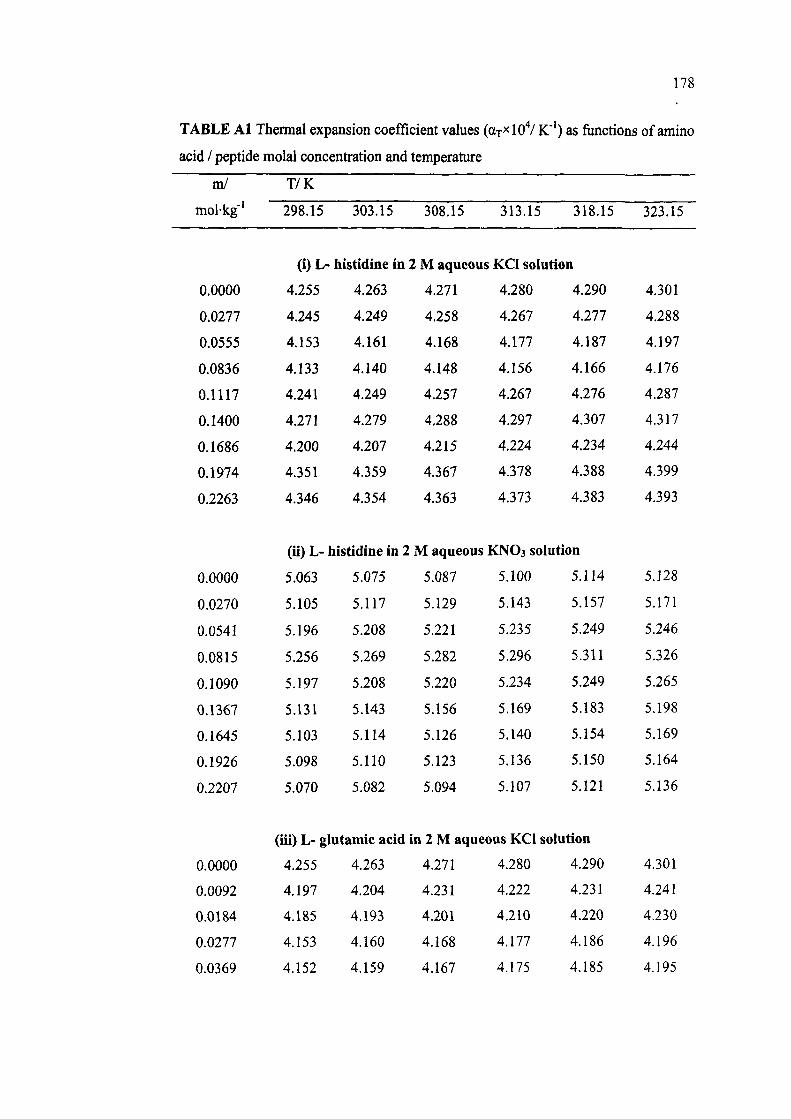
TABLE Al Thermal expansion coefficient values (arXlO''/ K'') as functions of amino
acid / peptide molai concentration and temperature
mi TTK
mol-kg' 298.15 303.15 308.15 313.15 318.15 323.15
(i) L- histidine in 2 M aqueous KCI solution
0.0000
0.0277
0.0555
0.0836
0.1117
0.1400
0.1686
0.1974
0.2263
0.0000
0.0270
0.0541
0.0815
0.1090
0.1367
0.1645
0.1926
0.2207
4.255
4.245
4.153
4.133
4.241
4.271
4.200
4.351
4.346
(u)L-
5.063
5.105
5.196
5.256
5.197
5.131
5.103
5.098
5.070
4.263
4.249
4.161
4.140
4.249
4.279
4.207
4.359
4.354
histidine in
5.075
5.117
5.208
5.269
5.208
5.143
5.114
5.110
5.082
4.271
4.258
4.168
4.148
4.257
4.288
4.215
4.367
4.363
2 M aqueous
5.087
5.129
5.221
5.282
5.220
5.156
5.126
5.123
5.094
4.280
4.267
4.177
4.156
4.267
4.297
4.224
4.378
4.373
4.290
4.277
4.187
4.166
4.276
4.307
4.234
4.388
4.383
KNO3 solution
5.100
5.143
5.235
5.296
5.234
5.169
5.140
5.136
5.107
5.114
5.157
5.249
5.311
5.249
5.183
5.154
5.150
5.121
4.301
4.288
4.197
4.176
4.287
4.317
4.244
4.399
4.393
5.128
5.171
5.246
5.326
5.265
5.198
5.169
5.164
5.136
(iii) L- glutamic acid in 2 M aqueous KCi solution
0.0000 4.255 4.263 4.271 4.280 4.290 4.301
0.0092 4.197 4.204 4.231 4.222 4.231 4.241
0.0184 4.185 4.193 4.201 4.210 4.220 4.230
0.0277 4.153 4.160 4.168 4.177 4.186 4.196
0.0369 4.152 4.159 4.167 4.175 4.185 4.195

179
0.0462
0.0555
0.0000
0.0090
0.0180
0.0270
0.0360
0.0450
0.0541
4.107
4.177
4.114
4.185
(iv) L- glutamic acid
5.063
4.979
5.059
5.030
5.003
5.027
5.073
5.075
4.990
5.070
5.042
5.013
5.038
5.085
4.122
4.193
4.130
4.202
in 2 M aqueous KNO3
5.087
5.002
5.082
5.054
5.026
5.050
5.097
5.100
5.015
5.095
5.067
5.038
5.063
5.110
4.140
4.211
solution
5.114
5.028
5.109
5.081
5.052
5.077
5.124
4.150
4.222
5.128
5.042
5.124
5.094
5.066
5.091
5.139
(v) L- ttyptophan in 2 M aqueous KCl solution
0.0000
0.0092
0.0138
0.0184
0.0231
0.0277
0.0323
0.0370
0.0000
0.0090
0.0135
0.0180
0.0225
0.0270
0.0315
0.0361
4.255
4.223
4.180
4.127
4.226
4.308
4.291
4.253
4.263
4.230
4.187
4.134
4.233
4.316
4.299
4.262
(vi) L- tryptoplian in
5.063
5.088
5.061
5.035
5.109
5.083
5.062
5.193
5.075
5.099
5.072
5.045
5.121
5.094
5.073
5.205
4.271
4.239
4.196
4.142
4.24
4.325
4.308
4.270
4.280
4.248
4.204
4.151
4.250
4.334
4.317
4.279
2 M aqueous KNO3
5.087
5.112
5.084
5.058
5.134
5.107
5.085
5.218
5.100
5.125
5.097
5.070
5.147
5.120
5.099
5.232
4.290
4.257
4.214
4.160
4.260
4.344
4.327
4.289
solution
5.114
5.139
5.111
5.084
5.161
5.134
5.112
5.246
4.301
4.268
4.224
4.170
4.271
4.355
4.337
4.299
5.128
5.153
5.125
5.099
5.176
5.149
5.127
5.261
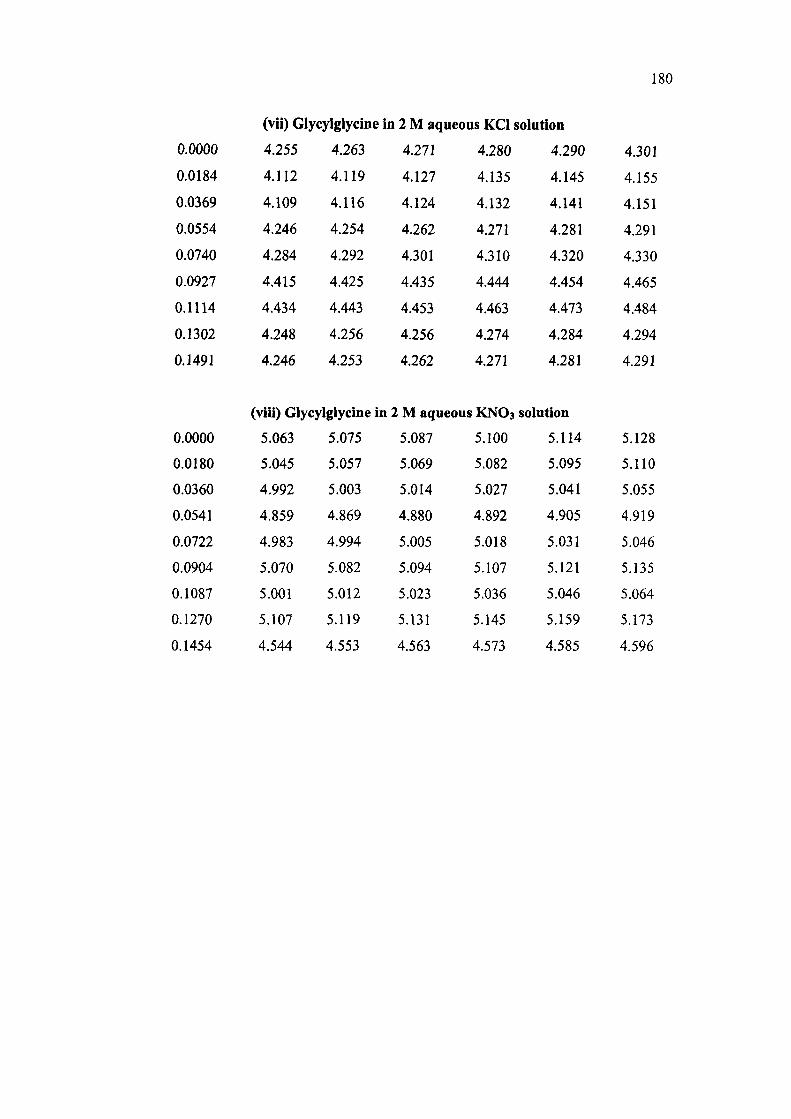
180
(vii) Glycylglycine in 2 M aqueous KCl solution
0.0000
0.0184
0.0369
0.0554
0.0740
0.0927
0.1114
0.1302
0.1491
0.0000
0.0180
0.0360
0.0541
0.0722
0.0904
0.1087
0.1270
0.1454
4.255
4.112
4.109
4.246
4.284
4.415
4.434
4.248
4.246
4.263
4.119
4.116
4.254
4.292
4.425
4.443
4.256
4.253
(viii) Glycylglycine in
5.063
5.045
4.992
4.859
4.983
5.070
5.001
5.107
4.544
5.075
5.057
5.003
4.869
4.994
5.082
5.012
5.119
4.553
4.271
4.127
4.124
4.262
4.301
4.435
4.453
4.256
4.262
4.280
4.135
4.132
4.271
4.310
4.444
4.463
4.274
4.271
2 M aqueous KNO3
5.087
5.069
5.014
4.880
5.005
5.094
5.023
5.131
4.563
5.100
5.082
5.027
4.892
5.018
5.107
5.036
5.145
4.573
4.290
4.145
4.141
4.281
4.320
4.454
4.473
4.284
4.281
solution
5.114
5.095
5.041
4.905
5.031
5.121
5.046
5.159
4.585
4.301
4.155
4.151
4.291
4.330
4.465
4.484
4.294
4.291
5.128
5.110
5.055
4.919
5.046
5.135
5.064
5.173
4.596
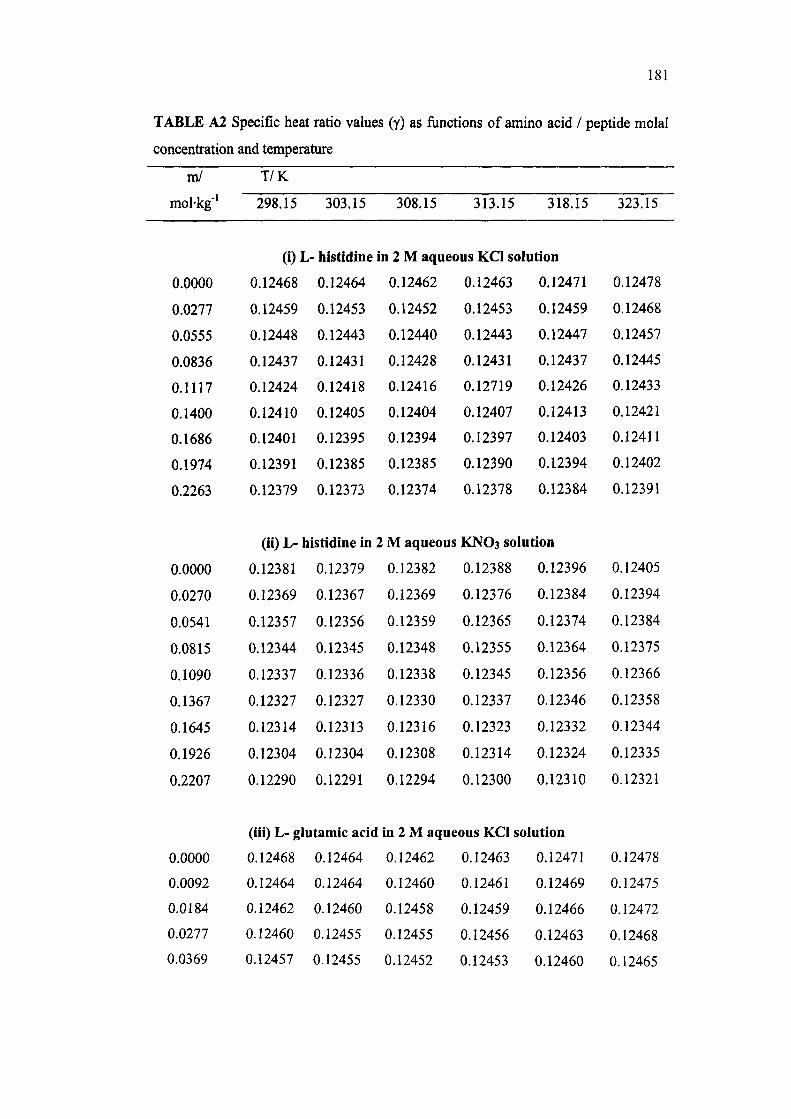
181
TABLE A2 Specific heat ratio values (y) as functions of amino acid / peptide molal
concentration and temperature
ml
mol-kg"'
0.0000
0.0277
0.0555
0.0836
0.1117
0.1400
0.1686
0.1974
0.2263
0.0000
0.0270
0.0541
0.0815
0.1090
0.1367
0.1645
0.1926
0.2207
T/K
298.15 303.15
(i) L- histidine
0.12468
0.12459
0.12448
0.12437
0.12424
0.12410
0.12401
0.12391
0.12379
0.12464
0.12453
0.12443
0.12431
0.12418
0.12405
0.12395
0.12385
0.12373
(il) L- histidine in
0.12381
0.12369
0.12357
0.12344
0.12337
0.12327
0.12314
0.12304
0.12290
0.12379
0.12367
0.12356
0.12345
0.12336
0.12327
0.12313
0.12304
0.12291
308.15 313.15 318.15
in 2 M aqueous KCl solution
0.12462
0.12452
0.12440
0.12428
0.12416
0.12404
0.12394
0.12385
0.12374
2 M aqueous
0.12382
0.12369
0.12359
0.12348
0.12338
0.12330
0.12316
0.12308
0.12294
0.12463
0.12453
0.12443
0.12431
0.12719
0.12407
0.12397
0.12390
0.12378
0.12471
0.12459
0.12447
0.12437
0.12426
0.12413
0.12403
0.12394
0.12384
i K N O 3 solution
0.12388
0.12376
0.12365
0.12355
0.12345
0.12337
0.12323
0.12314
0.12300
0.12396
0.12384
0.12374
0.12364
0.12356
0.12346
0.12332
0.12324
0.12310
323.15
0.12478
0.12468
0.12457
0.12445
0.12433
0.12421
0.12411
0.12402
0.12391
0.12405
0.12394
0.12384
0.12375
0.12366
0.12358
0.12344
0.12335
0.12321
(iii) L- glutamic acid in 2 M aqueous KCl solution
0.0000
0.0092
0.0184
0.0277
0.0369
0.12468
0.12464
0.12462
0.12460
0.12457
0.12464
0.12464
0.12460
0.12455
0.12455
0.12462
0.12460
0.12458
0.12455
0.12452
0.12463
0.12461
0.12459
0.12456
0.12453
0.12471
0.12469
0.12466
0.12463
0.12460
0.12478
0.12475
0.12472
0.12468
0.12465

182
0.0462
0.0555
0.12452
0.12446
0.12450
0.12444
0.12447
0.12442
0.12448
0.12443
0.12455
0.12450
0.12459
0.12454
(iv) L- glutamic acid in 2 M aqueous KNO3 solution
0.0000
0.0090
0.0180
0.0270
0.0360
0.0450
0.0541
0.0000
0.0092
0.0138
0.0184
0.0231
0.0277
0.0323
0.0370
0.12381
0.12377
0.12372
0.12367
0.12363
0.12359
0.12352
0.12379
0.12374
0.12369
0.12365
0.12359
0.12357
0.12350
0.12382
0.12378
0.12373
0.12367
0.12362
0.12359
0.12353
0.12388
0.12382
0.12379
0.12373
0.12367
0.12364
0.12357
0.12396
0.12389
0.12385
0.12380
0.12375
0.12372
0.12365
(v) L- tryptoplian in 2 M aqueous KCl solution
0.12468
0.12465
0.12463
0.12462
0.12458
0.12454
0.12450
0.12448
0.12464
0.12460
0.12458
0.12455
0.12452
0.12448
0.12445
0.12443
0.12462
0.12459
0.12456
0.12454
0.12451
0.12450
0.12446
0.12444
0.12463
0.12460
0.12457
0.12455
0.12454
0.12451
0.12448
0.12445
0.12471
0.12464
0.12462
0.12460
0.12457
0.12455
0.12452
0.12449
0.12405
0.12400
0.12396
0.12391
0.12387
0.12383
0.12377
0.12478
0.12473
0.12471
0.12468
0.12466
0.12463
0.12460
0.12457
(vi) L- tryptophan in 2 M aqueous KNO3 solution
0.0000
0.0090
0.0135
0.0180
0.0225
0.0270
0.0315
0.0361
0.12381
0.12375
0.12373
0.12370
0.12367
0.12365
0.12363
0.12358
0.12379
0.12376
0.12373
0.12371
0.12368
0.12365
0.12363
0.12359
0.12382
0.12380
0.12377
0.12374
0.12371
0.12368
0.12366
0.12362
0.12388
0.12386
0.12383
0.12381
0.12378
0.12375
0.12373
0.12371
0.12396
0.12394
0.12391
0.12388
0.12386
0.12383
0.12381
0.12378
0.12405
0.12403
0.12400
0.12398
0.12396
0.12393
0.12390
0.12388
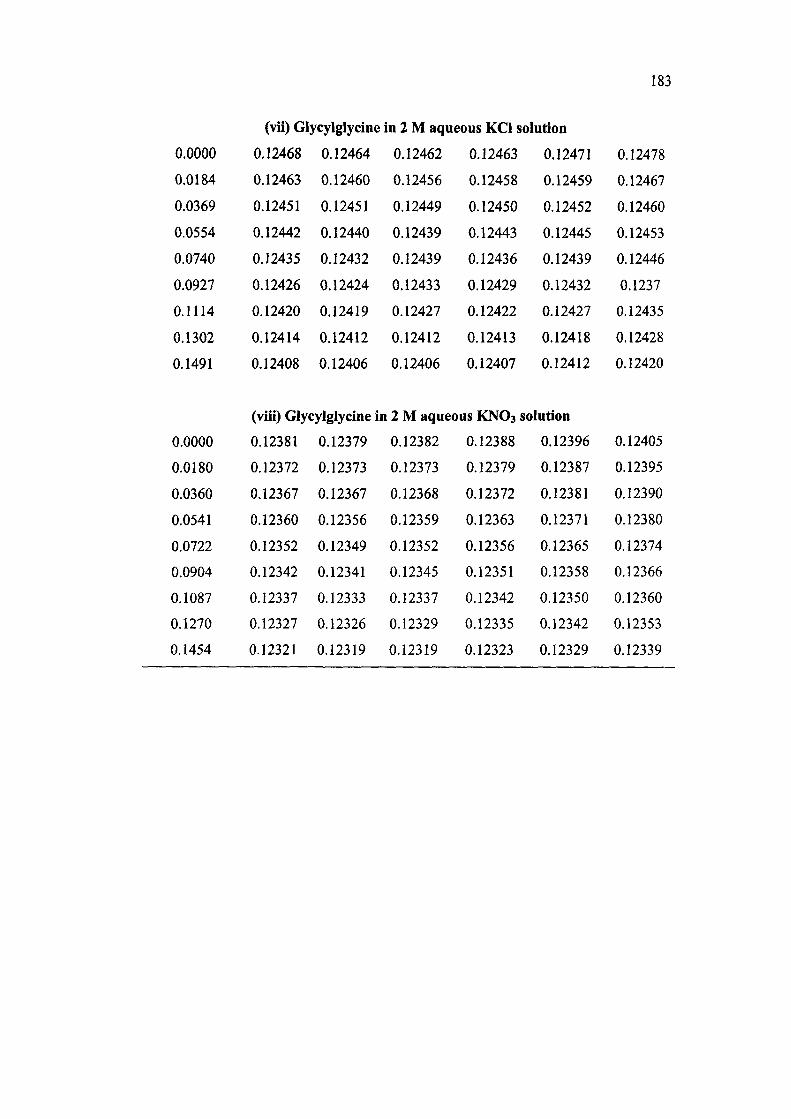
183
0.0000
0.0184
0.0369
0.0554
0.0740
0.0927
0.1114
0.1302
0.1491
0.0000
0.0180
0.0360
0.0541
0.0722
0.0904
0.1087
0.1270
0.1454
(vii) Glycylglycine in 2 M aqueous KCl solution
0.12468
0.12463
0.12451
0.12442
0.12435
0.12426
0.12420
0.12414
0.12408
0.12464
0.12460
0.12451
0.12440
0.12432
0.12424
0.12419
0.12412
0.12406
0.12462
0.12456
0.12449
0.12439
0.12439
0.12433
0.12427
0.12412
0.12406
0.12463
0.12458
0.12450
0.12443
0.12436
0.12429
0.12422
0.12413
0.12407
0.12471
0.12459
0.12452
0.12445
0.12439
0.12432
0.12427
0.12418
0.12412
(viii) Glycylglycine in 2 M aqueous K N O 3 solution
0.12381
0.12372
0.12367
0.12360
0.12352
0.12342
0.12337
0.12327
0.12321
0.12379
0.12373
0.12367
0.12356
0.12349
0.12341
0.12333
0.12326
0.12319
0.12382
0.12373
0.12368
0.12359
0.12352
0.12345
0.12337
0.12329
0.12319
0.12388
0.12379
0.12372
0.12363
0.12356
0.12351
0.12342
0.12335
0.12323
0.12396
0.12387
0.12381
0.12371
0.12365
0.12358
0.12350
0.12342
0.12329
0.12478
0.12467
0.12460
0.12453
0.12446
0.1237
0.12435
0.12428
0.12420
0.12405
0.12395
0.12390
0.12380
0.12374
0.12366
0.12360
0.12353
0.12339

PUBLICATIONS
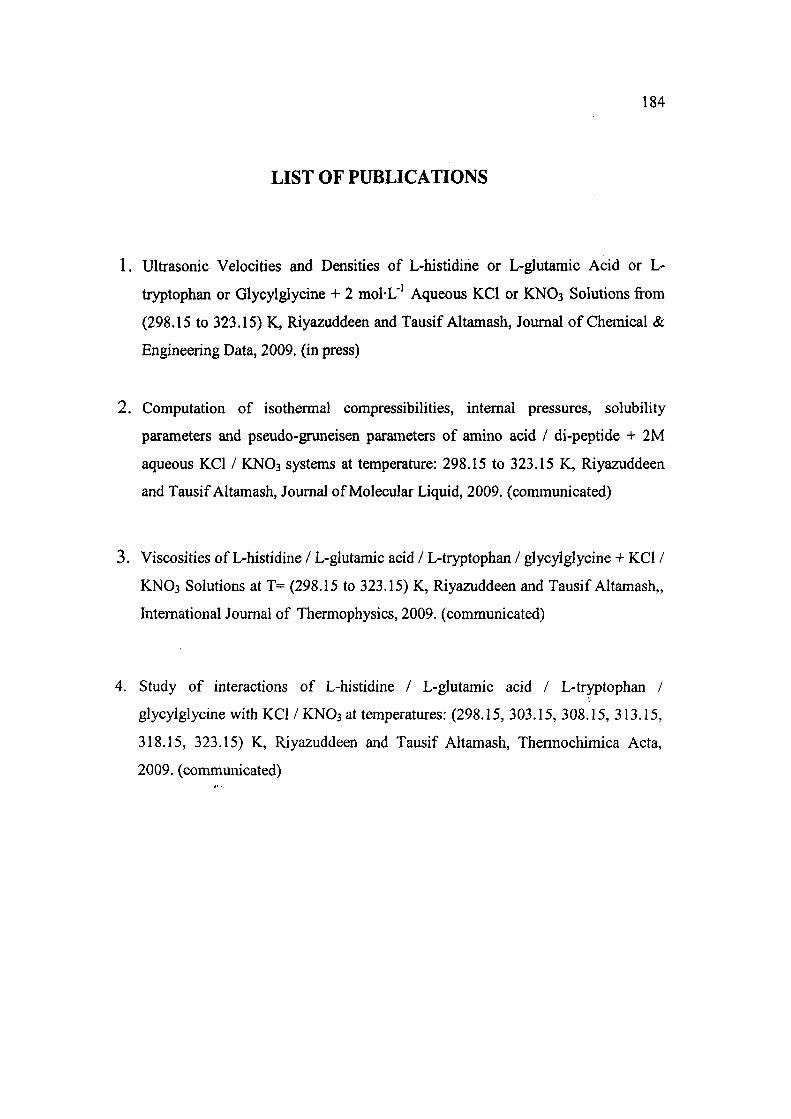
184
LIST OF PUBLICATIONS
1. Ultrasonic Velocities and Densities of L-histidirie or L-glutamic Acid or L-
tryptophan or Glycylglycine + 2 mol-L'' Aqueous KCl or KNO3 Solutions from
(298.15 to 323.15) K, Riyazuddeen and Tausif Altamash, Journal of Chemical «fe
Engineering Data, 2009. (in press)
2. Computation of isothermal compressibilities, internal pressures, solubility
parameters and pseudo-gruneisen parameters of amino acid / di-peptide + 2M
aqueous KCl / KNO3 systems at temperature: 298.15 to 323.15 K, Riyazuddeen
and Tausif Altamash, Journal of Molecular Liquid, 2009. (communicated)
3. Viscosities of L-histidine / L-glutamic acid / L-tryptophan / glycylglycine + KCl /
KNO3 Solutions at T= (298.15 to 323.15) K, Riyazuddeen and Tausif Altamash,,
International Journal of Thermophysics, 2009. (communicated)
4. Study of interactions of L-histidine / L-glutamic acid / L-tryptophan /
glycylglycine with KCl / KNO3 at temperatures: (298.15, 303.15, 308.15, 313.15,
318.15, 323.15) K, Riyazuddeen and Tausif Altamash, Theraiochimica Acta,
2009. (communicated)
J. Chem. Eng. Data XXXX, xxx, 000
Ultrasonic Velocities and Densities of L-Histidine or L-Glutamic Add or L-Tryptophan or Glycylglycine + 2 mol'L"^ Aqueous KCl or KNO3 Solutions from (298.15 to 323.15) K
Riyazuddeen* Tausif Altamasb
Department of Chemistry, Aligarh Muslim University, Aligarh 202002, U.P., India
Ulttasonic velocity and density values of L-htstidine or L-glutamic acid or L-tryptophan or glycylglycine + 2 mol'L"' aqueous KCl or 2 mol*L"' aqueous KNO3 solution have been measured as functions of amino acid or cUpeptide concentration and temperature from T = (298.15 to 323.15) K. Using ultrasonic velocity and density dau, the thermodynamic parameters isentropic compressibility (K,) and change in isentropic compressibility values have been computed. The K, values decrease with an increase in the amino acid/ dipeptide concentration as well as with temperature of the systems under investigation. The decrease in K, values with an increase in concentration of amino acid/dipeptide in aqueous solutions of KCl and KNO3 has been ascribed to an increase in the number of incompressible zwltterions in the solutions.
'8 Introduction b Measurements of ultrasonic velocity and density values of 2 amino acids and peptides in aqueous electrolytes have been of
12 interest with a view to improve the comprehension about the I , | subility of native proteins and the equilibrium process between [ g "folded" versus "unfolded" forms of proteins. As the amino acid > ^ and peptide molecules contain functional groups similar to those > £ existing in the more complex proteins, they are expected to : I mimic some common features of proteins. A number of authors i |> have measured the ultrasonic velocity and density values of
amino acids and small peptides in aqueous electrolytic solutions.'""
The present study is a continuation of our research program on the thermodynamic studies of amino acid—aqueous salt solution systems.'*"'* In this study, the ulO'asonic velocity (M) and density (p) values of L-histidine or L-glutamic acid or L-tryptophan or glycylglycine + 2 mol-L"' aqueous solution of KCl or KNO} as functions of amino acid/peptide concentration and temperature [(298.15,303.15,308.15,313.15,318.15, and 323.15) K] have been reportefl. Using the u and p data, the isentropic compressibility {K,) and change in isentropic compressibility (Av,) values have been evaluated with a view to investigating the zwitterions—ions, zwitterions—water dipoles, ions—water dipoles, and ions—ions interactions operative in the said systems.
Material and Methods
The amino acids and peptide (L-histidine, L-glutamic acid, L-tryptophan, and glycylglycine) and the salts [potassium chloride and potassium niu-ate of high purity (> 99 %)] used in this study were purchased from SRL (India) and E. Merck (India), respectively. The amino acids were reciystalyzed twice in (ethanol + water) mixtures, dried at 383.15 K, and kept in a vacuum desiccator over P2O5 for at least 72 h before use. The salts were recrystaliized twice in triply distilled water, dried at 423.15 K for at least 3 h, and then kept over PjOj in a vacuum
* To whom cQn«spond«nce should be addreMed. E-mail: izl ®redifihuiilx»m. Phone; +91 571 2703515.
desiccator at room temperature for a minimum of 48 h prior to their use. Stock solutions of 2 mol'L~' aqueous KCl and 2 mol'L'' aqueous KNO3 were prepared in triply distilled water and were used as solvents for the preparation of amino acid and peptide solutions. The specific electrical conductivity of triply distilled water used was less than 18*10"* C'-cm"', All the solutions were stored in special airtight bottles to avoid the exposure of solutions to air and evaporation.
An ultrasonic interferometer (Mittal model M-77, India) based on the variable-padi principle was used for the measurement of the ultrasonic velocity at a frequency of 4 MHz at different temperatures using a method described elsewhere.'*'"" An average of 10 readings was taken as a final value of the ultrasonic velocity. Water from a thermostat was circulated duough a brass jacket sunrounding the cell and the quartz crystal. The jacket was well insulated, and the temperature of the solution under study was maintained to an uncertainty of 0.01 K. The instrument was tested with the ultrasonic velocity values of triple-distilled water at different temperatures taken from the literature.^
The densities of solutions were measured with a pyknometer using a method described elsewhere.'*''^'* All mass quantities were corrected for buoyancy. The densities of toluene at various required temperatures were taken from the literature for calibration purposes. ' The thermostatted water bath used for measurements of ultrasonic velocity and the thermostatted paraffin bath used for measurements of density were maintained at a desired temperature (± 0.01 K) for about 30 min prior to recording of readings at each temperature of study. Several very close readings of density calculated at each temperature were averaged.
The uncertainties in measurements of the ultrasonic velocity and density values were ascertained by comparing the experimental values with corresponding literature values at different temperatures for water. The measured values of the ultrasonic velocity of water were found to be (1496.8,1519.9, and 1536.4) m's"' at (298.15.308.15, and 318.15) K, respectively, whereas the corresponding literature values "* are (1496.687, 1519.808, and 1536.409) m-s"'. The experimental values of the density of water were found to be (0.9971,0.9942,0.9903, and 0.9879) g«cm-' at (298.15,308,15,318,15, and 323,15) K, respectively.
10.I021/je900I99j CCC: $40.75 © XXXX American Chemical Society
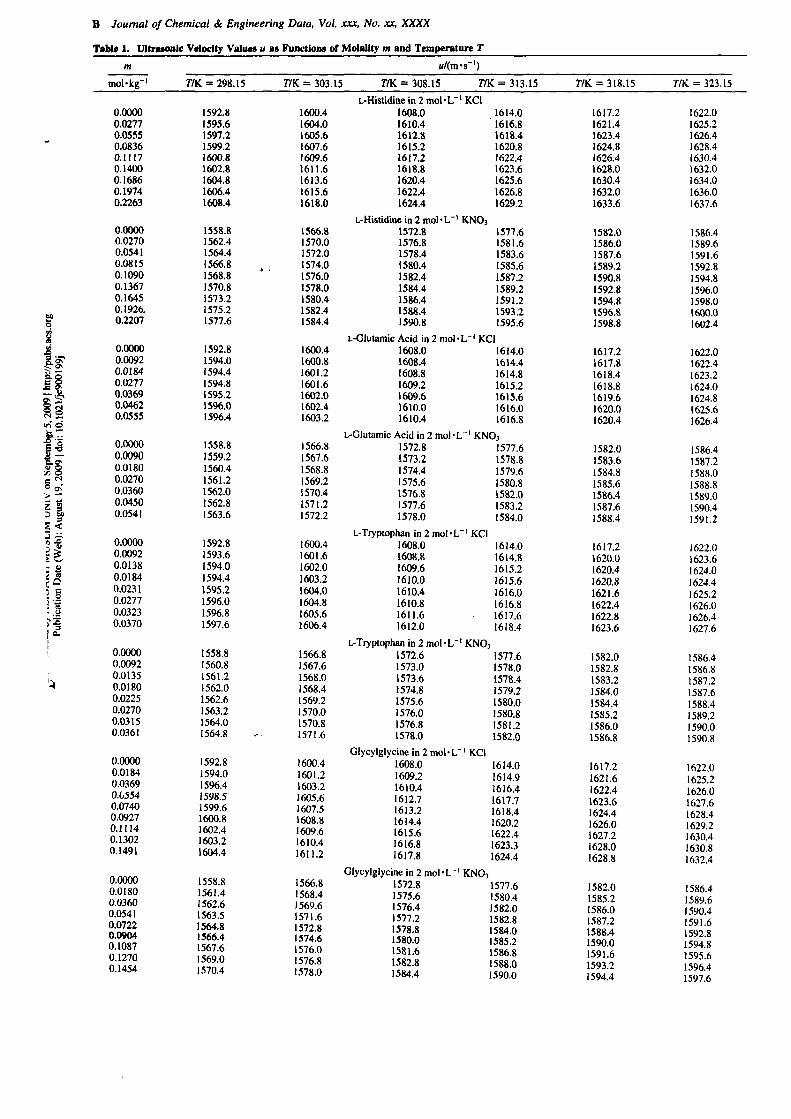
B Journal of Chemical & Engineering Data, Vol. xxx. No. xx, XXXX
Tabic 1. UltrMOnlc Velocity Values u as Functions of Molality m and Temperature T
^W
— o
B.2; ^8
II U
0.
m
mol'kg"'
0.0000 0.0277 0.0555 0.0836 0.1117 0.1400 0.1686 0.1974 0.2263
0.0000 0.0270 0.0541 0.0815 0.1090 0.1367 0.1645 0.1926. 0.2207
0.0000 0.0092 0.0184 0.0277 0.0369 0.0462 0.0555
0.0000 0,0090 0.0180 0.0270 0.0360 0.0450 0.0541
0.0000 0.0092 0.0138 0.0184 0.0231 0.0277 0.0323 0.0370
0.0000 0.0092 0.0135 0.0180 0.0225 0.0270 0.0315 0.0361
0.0000 0.0184 0.0369 0.0554 0.0740 0.0927 0.1114 0.1302 0.1491
0.0000 0.0180 0.0360 0.0541 0.0722 0.0904 0.1087 0.1270 0.1454
TVK = 298.15
1592.8 1595.6 1597.2 1599.2 1600.8 1602.8 1604.8 1606.4 1608.4
1558.8 1562.4 1564.4 1566.8 1568.8 1570.8 1573.2 1575.2 1577.6
1592.8 1594.0 1594.4 1594.8 1595.2 1596.0 1596.4
1558.8 1559.2 1560.4 1561.2 1562.0 1562.8 1563.6
1592,8 1593.6 1594.0 1594.4 1595.2 1596.0 1596.8 1597.6
1558.8 1560.8 1561.2 1562.0 1562.6 1563.2 1564.0 1564.8
1592.8 1594.0 1596.4 1598.5 1599.6 1600.8 1602.4 1603.2 1604.4
1558.8 1561.4 1562.6 1563.5 1564.8 1566,4 1567.6 1569.0 1570.4
«/(m'
77K = 303.15 T/K = 308.15
1600.4 1604.0 1605.6 1607.6 1609.6 1611.6 1613.6 1615.6 1618.0
1566.8 1570.0 1572.0 1574.0 1576.0 1578.0 1580.4 1582.4 1584.4
1600.4 1600.8 1601.2 1601.6 1602.0 1602.4 1603.2
1566.8 1567.6 1568.8 1569.2 1570.4 1571.2 1572.2
1600.4 1601.6 1602.0 1603.2 1604.0 1604.8 1605.6 1606.4
1566.8 1567.6 1568.0 1568.4 1569.2 1570.0 1570.8 1571.6
1600.4 1601.2 1603.2 1605.6 1607.5 1608.8 1609.6 1610.4 1611.2
1566.8 1568.4 1569.6 1571.6 1572.8 1574.6 1576.0 1576.8 1578.0
L-Histi(linein2mol-L ' 1608.0 1610.4 1612.8 1615.2 1617.2 1618.8 1620.4 1622.4 1624.4
L-Histidine in 2 mol'L"' 1572.8 1576.8 1578.4 1580.4 1582.4 1584.4 1586.4 1588,4 1590.8
•s-')
77K = 313.15
KCl 1614.0 1616.8 1618.4 1620.8 1622.4 1623.6 1625.6 1626.8 1629.2
K N O j 1577.6 1581.6 1583.6 1585.6 1587.2 1589.2 1591.2 1593.2 1595.6
L-Glutamic Acid in 2 mol-L"' KCl 1608.0 1608.4 1608.8 1609.2 1609.6 1610.0 1610.4
L-Glutamic Acid in 2 mol-L 1572.8 1573.2 1574.4 1575.6 1576.8 1577.6 1578.0
L-Tryptophan in 2 mol-L 1608.0 1608.8 1609.6 1610.0 1610.4 1610.8 1611.6 1612.0
L-Tryptophan in 2 mol-L"' 1572.6 1573.0 1573.6 1574.8 1575.6 1576.0 1576.8 1578.0
Glycylglycine in 2 mol'L" 1608.0 1609.2 1610.4 1612.7 1613.2 1614.4 1615.6 1616.8 1617.8
Glycylglycine in 2 mol'L"' 1572.8 1575.6 1576.4 1577.2 1578.8 1580,0 1581.6 1582.8 1584.4
1614.0 1614,4 1614,8 1615.2 1615.6 1616.0 1616.8
,-' KNO3 1577,6 1578,8 1579,6 1580.8 1582.0 1583.2 1584.0
-'KCl 1614.0 1614.8 1615.2 1615.6 1616.0 1616.8 1617.6 1618.4
'KNO3 1577.6 1578.0 1578.4 1579.2 1580.0 1580.8 1581.2 1582.0
'KCl 1614.0 1614.9 1616.4 1617.7 1618.4 1620.2 1622.4 1623.3 1624.4
KNO3 1577.6 1580.4 1582.0 1582.8 1584.0 1585.2 1586.8 1588.0 1590.0
r/K = 318.15
1617.2 1621.4 1623.4 1624.8 1626.4 1628.0 1630.4 1632.0 1633.6
1582.0 1586.0 1587.6 1589.2 1590.8 1592.8 1594.8 1596.8 1598.8
1617.2 1617.8 1618.4 1618.8 1619.6 1620.0 1620.4
1582.0 1583.6 1584.8 1585.6 1586.4 1587.6 1588.4
1617.2 1620.0 1620.4 1620.8 1621.6 1622.4 1622.8 1623.6
1582.0 1582.8 1583.2 1584.0 1584.4 1585.2 1586.0 1586.8
1617.2 1621.6 1622.4 1623.6 1624.4 1626.0 1627.2 1628.0 1628.8
1582.0 1585.2 1586.0 1587.2 1588.4 1590.0 1591.6 1593.2 1594.4
TIK = 323.15
1622.0 1625.2 1626.4 1628.4 1630.4 1632.0 1634.0 1636.0 1637.6
1586.4 1589.6 1591.6 1592.8 1594.8 1596.0 1598.0 1600.0 1602.4
1622.0 1622.4 1623.2 1624.0 1624.8 1625.6 1626.4
1586.4 1587.2 1588.0 1588.8 1589.0 1590.4 1591.2
1622.0 1623.6 1624.0 1624.4 1625.2 1626.0 1626.4 1627.6
1586,4 1586,8 1587,2 1587,6 1588.4 1589.2 1590.0 1590.8
1622,0 1625.2 1626.0 1627.6 1628.4 1629.2 1630.4 1630.8 1632.4
1586.4 1589.6 1590.4 1591.6 1592.8 1594.8 1595.6 1596.4 1597.6

Journal of Chemical & Engineering Data, Vol. xxx, No. xx, XXXX C
Table 2. Density Values p as Functions of Molality m and Temperature 7
f
3 tH
z <
Is li : a
11 '1
m
mol'kg"'
0.0000 0.0277 0.0555 0.0836 o.un 0.1400 0.1686 0.1974 0.2263
0.0000 0.0270 0.0541 0.0815 0.1090 0.1367 0.1645 0.1926 0.2207
0.0000 0.0092 0.0184 0.0277 0.0369 0.0462 0.0555
0.0000 0.0090 0.0180 0.0270 0.0360 0.0450 0.0541
0.0000 0.0092 0.0138 0.0184 0.0231 0.0277 0.0323 0.0370
0.0000 0.0092 0.0135 0.0180 0.0225 0.0270 0.0315 0.0361
0.0000 0.0184 0.0369 0.0554 0.0740 0.0927 0.1114 0.1302 0.1491
0.0000 0.0180 0.0360 0.0541 0.0722 0.0904 0.1087 0.1270 0.1454
7yK = 298.15
1.0877 1.0883 1.0896 1.0909 \Sm.i} 1.0944 1.0953 1.0966 1.0979
1.1150 1.1159 1.1173 1.1187 1.1194 1.1204 1.1220 1.1230 1.1247
1.0877 1.0879 1,0881 1.0884 1.0887 1.0893 1.0902
1.1150 1.1155 1.1160 1.1166 1.1171 1.1174 1.1184
1.0877 1.0879 1.0881 1.0882 1.0886 1.0890 1.0894 1.0895
1.1150 1.1153 1.1156 1.1157 1.1161 1.1163 1.II64 1.1169
1.0877 1.0881 1.0890 1.0902 1.0911 1.0923 1.0928 1.0935 1.0935
1.1150 1.1156 1.1161 1.1171 1.1181 1.1192 1.1198 1.1211 1.1216
p-10-V(kg'm-3)
77K = 303.15 TVK = 308.15
1.0857 1.0865 1,0877 1.0890 1.TO06 1.0923 1.0933 1.0945 1.0958
1.1125 1.1134 1.1147 1.1160 1.1170 1.1178 1.1196 1.1204 1.1221
1.0857 1.0859 1.0861 1.0865 1.0868 1.0875 1.0883
1.1125 1,1130 1.1135 1.1141 1.1147 1.1149 1.1159
1.0857 1.0860 1.0862 1.0864 1.0867 1.0870 1.0873 1.0874
1.1125 1.1127 1.1131 1.1133 1.1135 1.1138 1.1139 1.1143
1.0857 1.0862 1.0871 1.0881 1,0890 1.0899 1.0905 1.0915 1.0922
1.1125 1.1130 1.1137 1.1148 1.1157 '.1166 1.1174 1.1185 1.1194
L-Histidine in 2 mol'L'' 1.0836 1.0844 1.0857 1.0870 i.oas5 1.0901 1.0912 1.0922 1.0935
L-Histidine in 2 mol'L"' 1.1098 1.1107 1.1120 1.1132 1.1143 1.1150 1.1169 1.1177 1.1194
TVK = 313.15
KCl 1.0813 1.0821 1.0834 1.0847 \.XM)\ 1.0878 1.0889 1.0898 1.0911
KNOj 1.1070 1.1078 1.1090 1.1102 1.1114 x.mi 1.1140 1.1148 1.1166
L-Glutamic Acid in 2 mol-L"' KCl 1.0836 1.0837 1.0840 1.0844 1.0847 1.0855 1.0862
u-Glutamic Acid in 2 mol-L 1.1098 1.1104 1.1108 1.1114 1.1120 1.1122 1.1132
L-Tryptophan in 2 mol-L 1.0836 1.0838 1.0841 1.0843 1.0846 1.0847 1.0851 1.0853
L-Tryptophan in 2 mol • L"' 1.1098 1.1100 1.1104 1.1106 1.1108 1.1111 1.1113 1.1115
Glycylglycine in 2 mol-L' 1.0836 1.0841 1.0850 1.0859 1.0868 1.0875 1.0881 1.0893 1.0900
Glycylglycine in 2 mol-L"' 1.1098 1.1104 1.1111 1.1123 1.1131 1.1139 1.1148 1.1158 1.1170
1.0813 1.0815 1.0817 1.0822 1.0825 1.0833 1.08.39
"' KNO3 1.1070 1,1076 1.1080 1.1086 1.1092 1.1094 1.1104
"'KCl 1.0813 1.0816 1.0819 1.0821 1.0823 1.0824 1.0828 1.0829
KNO3 1.1070 1.1072 1.1076 1.1078 1.1080 1.1083 1.1084 1.1086
'KCl 1.0813 1.0819 1.0828 1.0836 1.0845 1.0852 1.0857 1.0870 1,0877
KNO3 1.1070 1.1076 1.1083 1.1096 1.1103 I.nil 1.1120 1.1129 1.1144
77K = 318.15
1.0788 1.0795 1.0809 1.0823 1.0837 1.0853 1.0864 1.0873 1.0886
1.1040 1.1048 1.1060 1.1072 1.1082 1.1092 I.IIIO 1.1118 1.1136
1.0788 1.0790 1.0793 1.0797 1.0800 1.0808 1.0815
1.1040 1.1047 1.1050 1.1056 1.1062 1.1064 1.1074
1.0788 1.0791 1.0794 1.0796 1.0798 1.0799 1.0803 1.0805
1.1040 1.1042 1.1046 1.1048 1.1050 1.1053 1.1054 1.1056
1.0788 1.0795 1.0804 1.0812 1.0820 1.0827 1.0832 1.0845 1.0852
1.1040 1.1046 1.1053 1.1067 1.1073 1.1081 1.1090 1.1099 1.1117
r/K = 323.15
1.0761 1.0768 1.0783 1.0796 1.0810 1.0827 1.0838 1.0847 1.0860
1.1009 1.1017 1.1028 1.1040 1.1049 1.1060 1,1077 1,1087 1.1104
1.0761 1.0765 1.0767 1.0771 1.0774 1.0781 1.0788
1.1009 1.1016 1.1019 1.1026 1.1032 1.1034 1.1042
1.0761 1.0764 1.0767 1.0770 1.0771 1.0773 1.0777 1.0779
1.1009 1.1011 1.1015 1.1017 1.1018 1.1021 1.1023 1.1024
1.0761 1.0769 1.0778 1.0786 1.0794 1.0802 1.0807 1.0819 1.0826
1.1009 1.1015 1.1022 1.1035 1.1042 1.1050 1.1058 1.1068 1.1089
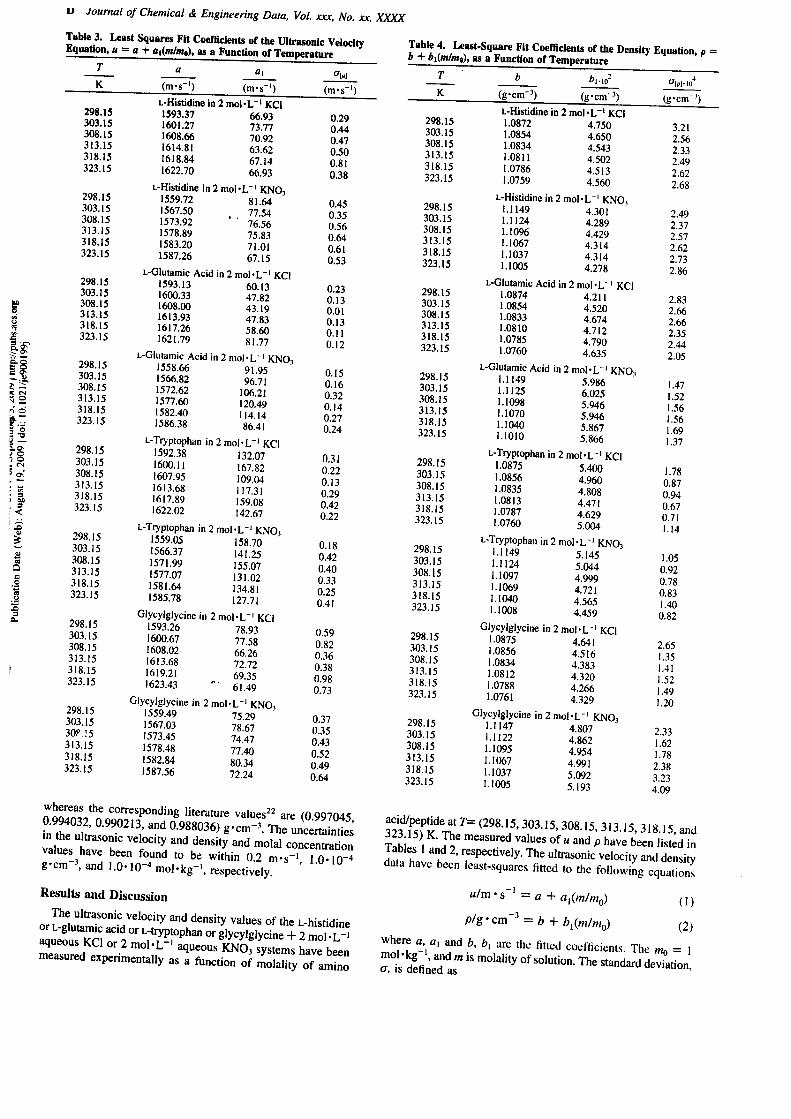
u Journal of Chemical & Engineering Data, Vol. xxx. No. xx, XXXX
XI
Table 3. Least Squares Fit Coefficients of tlie Ultrasonic Velocity Equation, H = o + ai(<n/w>), as a Function of Temperature
a\
298. IS 303.15 308.15 313.15 318.15 323.15
298.15 303.15 308.15 313.15 318.15 323.15
298.15 303.15 308.15 313.15 318.15 323.15
298.15 303.15 308.15 313.15 318.15 323.15
298.15 303.15 308.15 313.15 318.15 323.15
298.15 303.15 308.15 313.15 318.15 323.15
298.15 303.15 308.15 313.15 318.15 323.15
298.15 303.15 30P.I5 313.15 318.15 323.15
(m-s"') (m-s"')
L-Histidine in 2 mol-L"' KCl 1593.37 66.93 1601.27 73.77 1608.66 70 92 1614.81 63.62 1618.84 67.14 1622.70 66.93
L-Histidine in2mol 1559.72 1567.50 1573.92 1578.89 1583.20 1587.26
L-' KNO3 81.64 77.54 76.56 75.83 71.01 67.15
L-Glutamic Acid in 2 mol-L"' KCl 1593.13 60.13 1600.33 47.82 1608.00 43.19 1613.93 47.83 1617.26 58.60
1621.79 81.77
L-Glutamic Acid in 2 mol-L~' KNO3 1558.66 91.95 1566.82 96.71 1572.62 106.21 1577.60 120.49 1582.40 114.14 1586.38 86.41
L-Tryptophan in 2 mol-L"' KCl 1592.38 132.07 1600.11 167.82 1607.95 109.04 1613.68 117.31 1617.89 159.08 1622.02 142.67
L-Tryptophan in 2 mol-L'' KNO3 1559.05 158.70 1566.37 141.25 1571.99 155.07 1577.07 131.02 1581.64 134.81 1585.78 127.71
Glycylglycine in 2 mol-L-' KCl 1593.26 1600.67 1608.02 1613.68 1619.21 1623.43
78.93 77.58 66.26 72.72 69.35 61.49
Glycylglycine in 2 mol-L"' KNO3 1559.49 75.29 1567.03 78.67 1573.45 74.47 1578.48 77.40 1582.84 80.34 1587.56 72.24
(m-s"')
0.29 0.44 0.47 0.50 0.81 0.38
0.45 0.35 0.56 0.64 0.61 0.53
0.23 0.13 0.01 0.13 0.11 0.12
0.15 0.16 0.32 0.14 0.27 0.24
0.31 0.22 0.13 0.29 0.42 0.22
0.18 0.42 0.40 0.33 0.25 0.41
0.59 0.82 0.36 0.38 0.98 0.73
0.37 0.35 0.43 0.52 0.49 0.64
whereas the corresponding literature values^^ are (0.997045, 0.994032, 0.990213, and 0.988036) g-cm-^ The uncertainties in the ultrasonic velocity and density and molal concentration values have been found to be within 0.2 m-s"', 1.0* 10"" g-cm"', and 1.0 •10"'' mol'kg"', respectively.
Results and Discussion
The ultrasonic velocity and density values of the L-histidine or L-glutamic acid or L-tryptophan or glycylglycine + 2 mol-L"' aqueous KCl or 2 mol-L"' aqueous KNO3 systems have been measured experimentally as a function of molality of amino
Table 4, Least-Square Fit Coefficients of the Density b + bi(mlm»), as a Function of Temperature
Equation, p =
bi-
298.15 303.15 308.15 313.15 318.15 323.15
298.15 303.15 308.15 313.15 318.15 323.15
298.15 303.15 308.15 313.15 318.15 323.15
298.15 303.15 308.15 313.15 318.15 323.15
298.15 303.15 308.15 313.15 318.15 323.15
298.15 303.15 308.15 313.15 318.15 323.15
298.15 303.15 308.15 313.15 318.15 323.15
298.15 303.15 308.15 313.15 318.15 323.15
(g'cm )
L-Histidine in 2 mol 1.0872 1.0854 1.0834 1.0811 1.0786 1.0759
(g-cm ')
•L-' KCl 4.750 4.650 4.543 4.502 4.513 4.560
L-Histidine in 2 mol-L"' KNO3 1.1149 1.1124 1.1096 1.1067 1.1037 1.1005
4.301 4.289 4.429 4.314 4.314 4.278
KCl L-Glutamic Acid in 2 mol-L" 1.0874 4.211 1.0854 4.520 1.0833 4.674 1.0810 4 712 1.0785 4.790
1.0760 4.635
L-Glutamic Acid in 2 mol-L"' KNO, '1149 5.986 11125 6.025 11098 5.946 1.1070 5.946 11040 5.867 11010 5.866
L-Ttyptophan in 2 mol-L"' KCl 10875 5.400 1.0856 4.960 10835 4.808 1.0813 4 471 1.0787 4.629 1.0760 5.004
L-Ttyptophan in 2 mol-L"' KNO, 1-1149 5.145 ••1124 5.044 1.1097 4999 1.1069 4.721 11040 4.565 1.1008 4.459
Glycylglycine in 2 mol-L"' KCl 1.0875 4.641 1.0856 4.516 10834 4.383 1.0812 4.320 10788 4.266 1.0761 4.329
Glycylglycine in 2 mol-L"' KNO, 1-1147 4.807 1-1122 4.862 1.1095 4954 1.1067 4991 11037 5.092 1.1005 5.193
g[pl-io''
(g-cm"')
3.21 2.56 2.33 2.49 2.62 2.68
2.49 2.37 2,57 2.62 2.73 2.86
2.83 2.66 2.66 2.35 2.44 2.05
1.47 1.52 1.56 1.56 1.69 1.37
1.78 0.87 0.94 0.67 0.7! 1.14
1.05 0.92 0.78 0.83 1.40 0.82
2.65 I..35 1.41 1.52 1.49 1.20
2.33 1.62 1.78 2.38 3.23 4.09
acid/peptide at T= (298.15,303.15, 308.15, 313.15, 318.15, and 323.15) K. The measured values of u and p have been listed in Tables 1 and 2, respectively. The ultrasonic velocity and density data have been least-squares fitted to the following equations
(I)
(2) where a, a, and b, bi are the fitted coefficients. The wo = 1 mol -kg"', and m is molality of solution. The standard deviation, a, is defined as

Journal of Chemical & Engineering Data, Vol. xxx. No. xx, XXXX E
Table 5. Isentropic Compressibility Values K, as Functions of Solute Concentration and Temperature
an
f £ If 11 is II s — M O
O ON
> -
5 < J -ij-
2 §
8 °-3 ,-S 3
m
mol'kg"'
0.0000 0.0277 0.0555 0.0836 0.U17 0.1400 0.1686 0.1974 0.2263
0.0000 0.0270 0.C541 0.0815 0.1090 0.1367 0.1645 0.1926 0.2207
0.0000 0.0092 0.0184 0.0277 0.0369 0.0462 0.0555
0.0000 0.0092 0.01 &0 0.0270 0.0360 0.0450 0.0541
0.0000 0.0092 0.0138 0.0184 0.0231 0.0277 0.0323 0.0370
0.0000 0.0090 0.0135 0.0180 0.0225 0.0270 0.0315 0.0361
0.0000 0.0184 0.0369 0.0554 0.0740 0.0927 0.1114 0.1302 0.1491
0.0000 0.0180 0,0360 0.0541 0.0722 0.0904 0.1087 0.1270 0.1454
''
r/K = 298.15
36.24 36.09 35.98 35.84 35.72 35.57 35.45 35.34 35.21
36.91 36.71 36.57 36.41 36.30 36.17 36.01 35.87 35.72
36.24 36.18 36.15 36.12 36.10 36.04 35.98
36.91 36.88 36.80 36.74 36.69 36.64 36.57
36.24 36.19 36.17 36.15 36.10 36.05 36.00 35.96
36.91 36.80 36.78 36.73 36.69 36.66 36.62 36.56
36.24 36.17 36.03 35.90 35.82 35.72 35.64 35.58 35.50
36.91 36.77 36.69 36.62 36.52 36.41 36.34 36.23 36.15
K,-10"/(m2-N-')
r/K = 303.15 TTK = 308.15
35.96 35.77 35.66 35.53 35.39 35.25 35.13 35.04 34.86
36.62 36,44 36.30 36.17 36.04 35.93 35.76 35.64 35.50
35.96 35.94 35.91 35.88 35.85 35.81 35.75
36.62 36.56 36.49 36.45 36.38 36.33 .36.26
35.96 35.90 35.87 35.81 35.77 35.72 35.67 35.64
36.62 36.57 36.54 36.51 36.47 36.42 36.38 36.33
35.96 35.91 35.79 35.65 35.54 35.45 35.39 35.33 35.27
36.62 36,52 36.45 36.32 36.23 36.12 36.03 35.96 35.87
L-Histidine in 2 mol-L" 35.69 35.56 35.41 35.26 35.13 35.01 34.90 34.78 34.66
L-Histidine in 2 mol'L~' 36.42 36.21 36.10 35.97 35.84 35.73 35.58 35.46 35.30
77K = 313.15
'KCl 35.50 35.35 35.24 35.09 34,98 34,87 34,75 34.67 34.53
KNO., 36.29 36.09 35.96 35.83 35.72 35.60 35.45 35.34 35,18
L-Glutamic Acid in 2 moI-L"' KCl 35.69 35.67 35.64 35.61 35.58 35.54 35.50
L-Glutamic Acid in 2 mol-L 36.42 36.39 36.32 36.24 36.17 36.13 36.07
L-Tryptophan in 2 moI-L 35.69 35.65 35.60 35.58 35.55 35,53 35,48 35,46
L-Tryptoplian in 2 mol*L"' 36,42 36,41 36,37 36,31 36,26 36,23 36,19 36,\3
Glycylglycine in 2 mol-L' 35,69 35,62 35,54 35,41 35,36 35,28 35,21 35,12 35,05
Glycylglycine in 2 mol-L^'' 36,42 36,28 36,22 36.14. 36.04 35.96 35.86 35.77 35.66
35,50 35,48 35,45 35,42 35,39 35,35 35,29
."' KNOj 36,29 36,22 36,17 36,10 36,02 35,96 35.89
' 'KCl 35.50 35.46 35.43 35.40 35.38 35.34 35.29 35.26
'KNO3 36.29 36.27 36.24 36.20 36.15 36.11 36.08 36.04
'KCl 35.50 35.44 35.35 35.26 35.20 35.10 34.99 34.91 34.84
KNO3 36.29 36.15 36.05 35.97 35.90 35.82
35.71 35.63 35.49
7VK = 318.15
35.44 35.23 35.10 35.00 34.88 34.76 34.63 34.53 34.42
36.19 35.98 35.87 35.76 35.66 35.53 35.39 35.27 35.13
35.44 35,41 35,37 35,34 35,30 35,25 35,21
36,19 36,10 36,03 35,98 35,92 35,86 35,79
35,44 35,31 35,28 35.26 35,22 35,18 35,15 35,11
36,19 36,15 36.12 36.07 36.05 36.00 35.96 35.92
35.44 35.23 35.16 35.09 35.02 34.93 34,87 34,79 34.73
36.19 36.03 35.97 35.87 35.79 35.70 35.59 35.49 35.38
r/K = 323.15
35.32 35.16 35.06 34.93 34.80 34,68 34.56 34.44 34.34 •
36.09 35.92 35,80 35.70 35.58 35.49 35.35 35,23 35.07
35.32 35.29 35.25 35.20 35^16 35.10 35^04
36.09 36,03 35.99 35.93 35.90 35.83 35.77
35.32 35.24 35.21 35.19 35.15 35.11 35.08 35.02
36.09 36.07 36.04 36.01 35.97 35.93 35.88 35.84
35.32 35.16 35.09 35.00 34,94 34.86 34.81 34.75 34.66
36.09 35.93 35.87 35.77 35.70 35,58 35,52 35,45 35,33
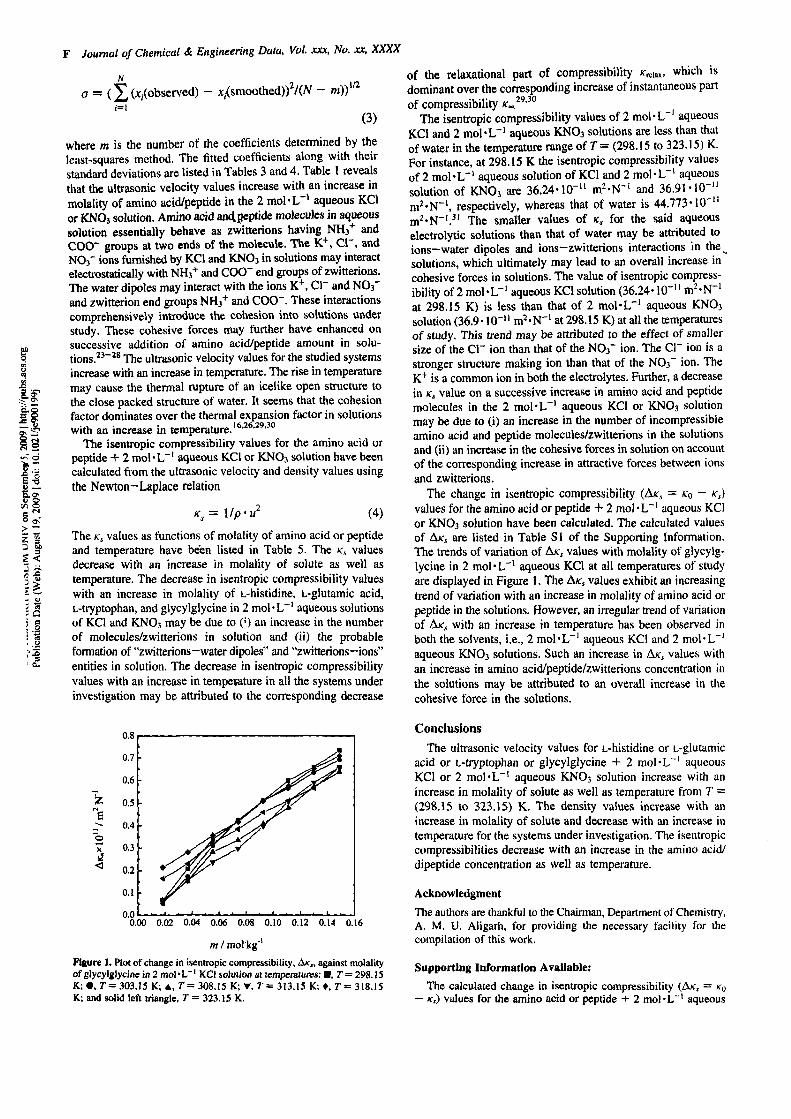
Journal of Chemical & Engineering Data, Vol. xxx, No. xx. XXXX
o
1." u —
u o t/3 O
3
M
a = (^(x,(observed) - x,(smoothed))^/(iV - m))'
(3)
where /n is the number of the coefficients determined by the least-squares method. The fitted coefficients along with their standard deviations are listed in Tables 3 and 4. Table 1 reveals that the ultrasonic velocity values increase with an increase in molality of amino acid/peptide in the 2 mol'L'' aqueous KCl or KNOj solution. Amino acid an(JL peptide molecules in aqueous solution essentially behave as zwitterions having NH3* and COO" groups at two ends of the molecule. The K+, CI", and NO3" ions furnished by KCl and KNO3 in solutions may interact electrostatically with NH3+ and COO" end groups of zwitterions. The water dipoles may interact with the ions K , CI" and NO3" and zwitterion end groups NH3+ and COO". These interactions comprehensively introduce the cohesion into solutions under study. These cohesive forces may further have enhanced on successive addition of amino acid/peptide amount in solu-tions. ^"^* The ultrasonic velocity values for the studied systems increase with an increase in temperature. The rise in temperature may cause the thermal rupture of an icelike open structure to the close packed structure of water. It seems that the cohesion factor dominates over the thermal expansion factor in solutions with an increase in temperature.'*'^*'^'''''
The isentropic compressibility values for the amino acid or peptide + 2 mol-L"' aqueous KCl or KNO3 solution have been calculated from the ultrasonic velocity and density values using the Newton-Laplace relation
K,= \/P'U' (4)
The K, values as functions of molality of amino acid or peptide and temperature have been listed in Table 5. The K^ values decrease with an increase in molality of solute as well as temperature. The decrease in isentropic compressibility values with an increase in molality of L-histidine, L-glutamic acid, L-tryptophan, and glycylglycine in 2 mol*L"' aqueous solutions of KCl and KNO3 may be due to (') an increase in the number of molecules/zwitterions in solution and (ii) the probable formation of "zwitterions—water dipoles" and "zwitterions—ions" entities in solution. The decrease in isentropic compressibility values with an increase in temperature in all the systems under investigation may be attributed to the corresponding decrease
of the relaxational part of compressibility (Creiax- which is dominant over the corresponding increase of instantaneous part of compressibility r . '' "
The isentropic compressibility values of 2 mol-L ' aqueous KCl and 2 mol'L"' aqueous KNO3 solutions are less than that of water in the temperature range of T = (298.15 to 323.15) K. For instance, at 298.15 K the isentropic compressibility values of 2 mol'L"' aqueous solution of KCl and 2 mol-L"' aqueous solution of KNO3 are 36.24-10"" m^-N"' and 36.91-10"" m^-N"', respectively, whereas that of water is 44.773-10 " m^-N"'.^' The smaller values of K^ for the said aqueous electrolytic solutions than that of water may be attributed to ions—water dipoles and ions—zwitterions interactions in the^ solutions, which ultimately may lead to an overall increase in cohesive forces in solutions. The value of isentropic compressibility of 2 mol-L"' aqueous KCl solution (36.24-10"" m^-N"' at 298.15 K) is less than that of 2 mol-L"' aqueous KNO3 solution (36.9-10'" m^-N"' at 298.15 K) at all the temperatures of study. This trend may be attributed to the effect of smaller size of the CI" ion than that of the NO3" ion. The CI" ion is a stronger structure making ion than tiiat of tiie NO3" ion. The K^ is a common ion in both the electrolytes. Further, a decrease in Ks value on a successive increase in amino acid and peptide molecules in the 2 mol-L"' aqueous KCl or KNO3 solution may be due to (i) an increase in the number of incompressible amino acid and peptide molecules/zwitterions in the solutions and (ii) an increase in the cohesive forces in solution on account of the corresponding increase in attractive forces between ions and zwitterions.
The change in isentropic compressibility (AK, = KO - ^rj values for the amino acid or peptide + 2 mol-L"' aqueous KCl or KNO3 solution have been calculated. The calculated values of A/fj are listed in Table SI of the Supporting Information. The trends of variation of Afc values with molality of glycylglycine in 2 mol-L"' aqueous KCl at all temperatures of study are displayed in Figure 1. The A/Cj values exhibit an increasing trend of variation with an increase in molality of amino acid or peptide in the solutions. However, an irregular trend of variation of AK^ with an increase in temperature has been observed in both the solvents, i.e., 2 mol-L"' aqueous KCl and 2 mol-L"' aqueous KNO3 solutions. Such an increase in A/Cj values with an increase in amino acid/peptide/zwitterions concentration in the solutions may be attributed to an overall increase in the cohesive force in the solutions.
4
0.00 0.02 0.04 0.06 0,08 0.10 0.12 0.14 0.16
m I molkg"' Figure 1. Plot of change in isentropic compressibility, A«:„ against molality of glycylglycine in 2 mol 'L"' KCl solution at temperatures; •, 7" = 298.15 K; •, r = 303.15 K; A, ?•= 308.15 K; T, r = 313.15 K; •,7'= 318.15 K; and solid left triangle, T = 323.15 K.
Conclusions The ulti-asonic velocity values for L-histidine or L-glutamic
acid or L-tiyptophan or glycylglycine + 2 mol-L~' aqueous KCl or 2 mol-L"' aqueous KNO3 solution increase with an increase in molality of solute as well as temperature from 7 = (298.15 to 323.15) K. The density values increase with an increase in molality of solute and decrease with an increase in temperature for the systems under investigation. The isentropic compressibilities decrease with an increase in the amino acid/ dipeptide concentration as well as temperature.
Acknowledgment The authors are thankful to the Chairman, Department of Chemistry, A. M. U. Aligarh, for providing the necessary facility for the compilation of this work.
Supporting Information Available: The calculated change in isentropic compressibility (A/Cj = K^
— Ks) values for the amino acid or peptide -I- 2 mol-L~' aqueous
Journal of Chemical & Engineering Data, Vol. xxx. No. xx, XXXX G
KCl or KNO3 solution are listed in Table SI . This material is available free of charge via the Internet at http;//pubs.acs.org.
Literature Cited (1) Yuan, Q.; Li, Z.; Wang. B. Partial Molar Volume of L-Alanine, DL-
Serine, DL- Threonine, L-Histidine, Glycine, and Glycylglycine in Water, NaCl and DMSO Aqueous Solutions at T = 298.15 K. / Chem. Thermodyn. 2006, 38, 20-33.
(2) Lin, G.; Bian, P.; Lin, R. The Limiting Partial Molar Volume and Transfer Partial Molar Volume of Glycylglycine in Aqueous Sodium Halide Solutions at 298.15 K. J. Chem. Thermodyn. 2006, 38, 144-151.
(3) Pal, A.; Kumar, S. Volumetric and Ultrasonic Studies of Some Amino Arids in Binary Aqueous Solutions of MgCl2.6H20 at 298.15 K. J. Mol. Liq. 2005, 121, 148-155.
(4) Soto, A.; Arce, A.; Khoshkbarchi, M. K. Thermodynamics of Diglycine and Triglycine in Aqueous NaCl Solutions: Apparent Molar Volume, Isentropic Compressibility and Refractive Index. J. Solution Chem. 2004,55, 11-20.
(5) Badarayani, R.; Kumar, A. The Mixing Effect of Glycylglycine with KCl, KBr, and NajSO* from Volumetric and Viscometric Investigation at 298.15 K. / Solution Chem. 2004, 3i, 407-426.
(6) Badarayani, R.; Kumar, A. Density and Speed of Sound of Glycine in Concentrated Aqueous NaBr, KCl, KBr and MgCb at T = 298,15 K. /. Chem. Thermodyn. 2003, 35, 897-908.
(7) Rodriguez, H.; Soto, A.; Arce, A.; Khoshkbarchi, M. K. Thermodynamics of Isentropic Compressibility, Refractive Index and Viscosity of DL-Alanine in Aqueous NaCl Solutions. J. Solution Chem. 2003, 32, 53-63.
(8) Badarayani, R.; Kumar, A. Ionic Interactions from Volumetric Investigations of L-Alanine in NaBr, KCl, KBr and MgClj upto High Concentrations. Fluid Phase Equilib. 2002, 207, 321-323.
(9) Soto, A.; Arce, A.; Khoshkbarchi, M. K. Effect of Cation and Anion of an Electrolyte on Apparent Molar Volume, Isentropic Compressibility and Refractive Index of Glycine in Aqueous Solutions. Biophys. Chem. 1999, 76, 73-82.
(10) Soto, A.; Arce, A.; Khoshkbarchi, M. K. Experimental Data and Modeling of Apparent Molar Volume, Isentropic Compressibilities and Refractive Indices in Aqueous Solutions of Glycine + NaCl. Biophys. Chem. 1998, 74, 165-173.
(11) Banipal, T. S.; Sehgal, G. Partial Molal Adiabatic Compressibilities of Transfer of Some Amino Acids and Peptides from Water to Aqueous Sodium Chloride and Aqueous Glucose Solutions. Thermochim. Acta 1995, 262, 175-183.
(12) Sadeghi, R.; Goodarzi, B. Apparent Molar Volumes and Isentropic Compressibilities of Transfer of L-Alanine from Water to Aqueous Potassium Di-hydrogen Citrate and Tri-potassium Citrate at T= (283.15 to 308.15) K. J. Mol. Uq. 2008, 141, 62-68.
(13) Kannappan, A. N.; Palani, R. Ultrasonic Investigation in Amino Acids with Aqueous Dimethyle Formamide. Indian J. Chem. 2007,46A, 54-59.
(14) Riyazuddeen; Bansal, G. K. Intermolecular/Interionic Interactions in L-Leucine-, L-Asparagine- and Glycylglycine-Aqueous Electrolyte Systems. Thermochim. Acta 2006, 445, 40-48.
(15) Riyazuddeen; Basharat, R. Intermolecular/Interionic Interactions in L-Isoleucine, L-Proline, L-Glutamine-Aqueous Electrolyte Systems. J. Chem. Thermodyn. 2006, 38, 1684-1695.
(16) Riyazuddeen; Khan, 1. Interaction in L-Alanine/L-ProlineA,-Valine/ L-Leucine-Aqueous KCI/KNO3 System at Different Temperatures: An Isentropic Compressibility Study. Thermochim. Acta 2008, 483, 45-48.
(17) Riyazuddeen; Khan, 1. Effect of KCl and KNO3 on Partial Molal Volumes and Partial Molal Compressibility of Some Amino Acids at Different Temperatures. Int. J. Thermophys. 2009, 30, 475-489.
(18) Riyazuddeen; Khan, I. Viscosity studies of L-Alanine-, L-Proline, L-Valine, L-Leucine + Aqueous KCI/KNO3 Solutions at Different Temperatures. J. Chem. Thermodyn. 2008, 40, 1549-1551.
(19) Islam, S.; Waris, B. N. Intermolecular/Interionic interaction in Leucine-, NaCl-, and KCl- Aqueous Urea Systems. Thermochim. Acta 2004, 424, 165-174.
(20) Del Grosso, V. A,; Mader, C. W. Speed of Sound in Pure Water. J. Acoust. Soc. Am. 1972,52, 1442-1446.
(21) Kashiwagi, H.; Hashimoto, T.; Tanaka, Y.; Kubota, H.; Makita, T, Thermal Conductivity and Density of Toluene in the Temperature Range 273-373 K at Pressures up to 250 MPa. Int. J. Thermophys. 1982,5,201-215.
(22) Kell, G. S. Density, Thermal Expansivity and Compressibility of Liquid Water from CC to 150°C, Correlations and Table for Atmospheric Pressure and Saturation Reviewed and Expressed on 1%8 Temperature Scale. J. Chem. Eng. Data 197S, 20, 97-105.
(23) Rao, N. P.; Verrall, R. E. Ultrasonic Velocity, Excess Adiabatic Compressibility, Apparent Molar Volume and Apparent Molar Compressibility Properties of Binary Liquids Mixture Containing 2- But Oxyethanol. Can. J. Chem. 1987, 65, 810-816.
(24) Hirata, F.; Aiakawa, K. Ultrasonic Study of Solute-Solvent Interaction in Aqueous Solutions of Tetraalkylammonium Salts. Bull. Chem. Soc. Jpn. 1972, 25, 2715-2719.
(25) Magazu, S.; Milgliardo, P.; Musollno, A. M. a,a Terehalose-Water Solutions. 1. Hydration Phenomena and Anomalies in the Acoustic Properties. /. Phys. Chem. B 1997,101, 2348-2351.
(26) Rohman, N.; Mahiuddin, S. Concentration and Temperature Dependence of Ultrasonic Velocity and Isentropic Compressibility in Aqueous Sodium Nitrate and Sodium Thiosulphate Solutions. /. Chem. Soc, Faraday Trans. 1997, 93, 2053-2056.
(27) Ragouvamane, D,; Rao, A. S. Ultrasonic Studies on the Influence of Some Amino Acids on Molecular Interactions in Aqueous Solutions of Ethanol. Mian J. Chem. 1998, 37A, 659-662.
(28) Ernst, S.; Manikowski, R. Measurements of Speed of Sound and Density of Aqueous Solutions of the First- Row Transition- Metal Halides. 2. Apparent and Molar Compressibilities and Volumes of Aqueous NiCl2 and NiBrj within the Temperature Range 291.15 to 297.15 K. J. Chem. Eng. Data 1997, 42, 647-650.
(29) Hall, L. The Origin of Ultrasonic Absorption in Water. Phys. Rev. 1948, 73, 775-781.
(30) Arakawa, K.; Sasaki, K. The Structural Theory of Water. 1. Two State Theory. Bull. Chem. Soc. Jpn. 1969, 42, 303-308.
(31) Millero, F. J.; Surdo, A. L.; Shin, C. The Apparent Molal Volume and Adiabatic Compressibility of Aqueous Amino Acid at 25 °C. / Phys. Chem. 1978, 82, 784-792.
Received for review February 20, 2009. Accepted July I. 2009. One of the authors (T.A.) wishes to acknowledge UGC for granting the Research Fellowship.
JE900I99J