Embed Size (px)
Citation preview

physician and other health professional services
C H A p t e R 4

R e C o M M e n D A t I o n s
(The Commission reiterates its standing position on improving Medicare’s payments to physicians and other health professionals. See pp. 112–114.)

93 Repo r t t o t h e Cong r e s s : Med i ca r e Paymen t P o l i c y | Ma r ch 2014
physician and other health professional services
Chapter summary
Physicians and other health professionals deliver a wide range of services,
including office visits, surgical procedures, and diagnostic and therapeutic
services in a variety of settings. In 2012, Medicare paid $69.6 billion for
physician and other health professional services, accounting for 12 percent
of total Medicare fee-for-service spending. About 850,000 clinicians billed
Medicare—550,000 physicians and 300,000 nurse practitioners, physician
assistants, therapists, chiropractors, and other practitioners.
Medicare fee-for-service pays for the services of physicians and health
professionals under a fee schedule, and total payments are limited in principle
by the sustainable growth rate (SGR) formula. Due to years of volume growth
exceeding the SGR limits and legislative and regulatory overrides of negative
updates, the SGR calls for large negative payment adjustments to fees for
physicians and other health professionals.
Assessment of payment adequacy
Informing the Commission’s deliberations on payment adequacy for
physicians and other health professionals are beneficiary access to services,
volume growth, quality, and changes in input costs and other measures of
payment adequacy.
In this chapter
• Are Medicare fee schedule payments adequate in 2014?
• How should Medicare payments change in 2015?
C H A p t e R 4

94 Phy s i c i a n and o t h e r h ea l t h p r o f e s s i o na l s e r v i c e s : A s s e s s i ng paymen t adequacy and upda t i ng paymen t s
Beneficiaries’accesstocare—Overall, beneficiary access to physician and other
health professional services is stable. We generally find results similar to prior
years—beneficiaries’ access to physician services is stable and similar to (or better
than) access among privately insured individuals ages 50 to 64. Most beneficiaries
report they are able to obtain timely appointments for routine care and illness or
injury, and most beneficiaries are able to find a new doctor without a problem
(although beneficiaries seeking a primary care doctor were more likely to report that
they had a problem than beneficiaries seeking a specialist). The survey does not find
statistically significant differences in access between urban and rural beneficiaries,
similar to prior years.
• Capacityandsupplyofproviders—The number of physicians and other health
professionals providing services to Medicare beneficiaries from 2010 through
2012 kept pace with growth in the beneficiary population.
• Volumeofservices—Across all services, volume per beneficiary remained
essentially unchanged, with a growth rate of −0.2 percent in 2012. Among
broad categories of service, growth rates were 0.1 percent for evaluation and
management services, 0.2 percent for major procedures, 0.4 percent for other
procedures, and −0.5 percent for tests. Imaging had a negative growth rate of
−3.2 percent. However, the imaging decrease does not raise concerns about
access to these services. The decrease occurred amid concerns about overuse of
the services. Further, the decrease includes a shift in billing for cardiovascular
imaging from professionals’ offices to hospitals.
Qualityofcare—Most measures of ambulatory care quality between the periods
of 2009 to 2010 and 2011 to 2012 improved slightly or did not change; a few
worsened slightly.
Medicarepaymentsandproviders’costs—Because physicians and other health
professionals do not report their costs to Medicare, we use proxies for Medicare’s
payments relative to providers’ costs. Medicare’s payments for fee schedule
services relative to private insurer payments have remained constant at 81 percent.
CMS currently projects that the percentage change in the Medicare Economic
Index, a measure of the change in providers’ costs, will be 2.2 percent in 2015.
Repeal of the sgR
In light of this information regarding payment adequacy for and beneficiary access
to physician and other health professional services, the Commission reiterates
its longstanding recommendation to repeal the SGR formula. The Commission’s
recommendation is based on these principles: repeal of the SGR is urgent,
beneficiary access must be preserved, payments should be rebalanced between

95 Repo r t t o t h e Cong r e s s : Med i ca r e Paymen t P o l i c y | Ma r ch 2014
primary care and other specialties, and the Medicare program should encourage
movement toward reformed delivery systems.
The Commission sees SGR repeal as urgent because, after a decade of year-end
legislative overrides, the policy is causing uncertainty for physician and other
clinician practices and has the potential to create instability for beneficiaries. The
SGR also bogs down the policy process by focusing all efforts on the yearly need to
override negative fee schedule updates. ■

97 Repo r t t o t h e Cong r e s s : Med i ca r e Paymen t P o l i c y | Ma r ch 2014
Background
Physicians and other health professionals deliver a wide range of services to Medicare beneficiaries in all settings—including physicians’ offices, hospitals, ambulatory surgical centers, skilled nursing facilities and other post-acute care settings, hospices, outpatient dialysis facilities, clinical laboratories, and beneficiaries’ homes. Of the roughly 850,000 clinicians billing Medicare, 550,000 are physicians and 300,000 are other health professionals, such as advanced practice nurses, physical and occupational therapists, and chiropractors. Part B of Medicare pays for physician and other health professional services; in 2012, total payments were $69.6 billion, about 12 percent of Medicare fee-for-service (FFS) spending. Nearly all Medicare beneficiaries receive at least one physician service in a year—98 percent in 2011 (Centers for Medicare & Medicaid Services 2012c).
Medicare pays for physicians’ and other health professionals’ services using a fee schedule, which includes payment rates for around 7,000 separate billing codes. For each service, CMS assigns three weights: the amount of clinician work required to provide a service, the expenses of running a practice, and the cost of malpractice insurance. Each weight is adjusted by the relative geographic cost of input prices. In total, these weights are designed to reflect the resources needed to provide the typical service. The sum of the weights is multiplied by a dollar amount called the conversion factor, which produces the total payment amount.1
Under current law, the conversion factor is governed by the sustainable growth rate (SGR) formula. The SGR formula, established in the Balanced Budget Act of 1997, is designed to limit the aggregate growth in payments to physicians and other health professionals. It allows for growth in input prices, enrollment, changes in law and regulation, and volume, with the allowance for volume growth equal to the rate of growth in per capita gross domestic product (GDP). As a result, the differential between GDP and volume growth is an important factor. A rationale for setting GDP as the volume target is that national output—or GDP—reflects a measure of affordability because government tax collections have generally remained a constant share of national output. Medicare Part B, which funds physician and other health professional services, receives the bulk of its financing from tax collections.
The resulting formula produced negative payment updates every year starting in 2002—and continuing through
2012—due to increases in volume and intensity beyond those permitted by the formula. However, legislatively the Congress overrode the negative updates every year starting in 2003. On December 26, 2013, the estimated 24 percent payment cut to physician fees under the SGR was overridden until April 2014.
Are Medicare fee schedule payments adequate in 2014?
We assess payment adequacy by reviewing beneficiary access to care provided by physicians and other health professionals, volume growth, quality of care, and Medicare’s payment rates relative to those in the private sector. Overall, most indicators show no significant change from prior years.
Beneficiaries’ access to care: generally stable We review a range of beneficiary access measures, including our own beneficiary survey, other surveys, physicians’ willingness to accept Medicare beneficiaries, and results from beneficiary and physician focus groups. We find that the share of beneficiaries in 2013 reporting that they have good access to care and that they are satisfied with their care is consistent with prior years.
Beneficiary survey finds stable access to physician services
Every year, the Commission sponsors a telephone survey of 4,000 Medicare beneficiaries and 4,000 privately insured individuals ages 50 to 64. The goal in surveying these two populations is to assess whether concerns reported by Medicare beneficiaries are unique to the Medicare population or are part of trends in the broader health care delivery system. This year’s survey was fielded in the summer and fall of 2013.
Overall, we find that beneficiaries’ access to physician services is stable and similar to or better than access among privately insured individuals. Higher shares of Medicare beneficiaries reported that they were very or somewhat satisfied with their care (88 percent) compared with those who have private insurance (83 percent) (Table 4-1, p. 98).
Most beneficiaries reported they were able to obtain timely appointments for routine care and illness or injury, and
98 Phy s i c i a n and o t h e r h ea l t h p r o f e s s i o na l s e r v i c e s : A s s e s s i ng paymen t adequacy and upda t i ng paymen t s
most beneficiaries are able to find a new doctor without a problem. However, beneficiaries seeking a primary care doctor were more likely to report that they had a problem finding a doctor than beneficiaries seeking a specialist (Table 4-2). These findings are consistent with prior years’ survey results as well as with access reported among the privately insured.
Most beneficiaries are able to see their doctors when they want to The results from the 2013 survey are consistent with prior years in finding that most Medicare beneficiaries are able to see their doctors in a timely manner. The share of beneficiaries seeking a routine care appointment who reported that they never had to wait longer than they wanted was 73 percent; 82 percent of beneficiaries seeking an illness or injury appointment said they never had to wait longer than they wanted. These shares are significantly higher than the shares of the privately insured population who never had to wait longer than they wanted for a routine appointment (69 percent) or illness appointment (77 percent) (Table 4-2).
In 2013, 10 percent of beneficiaries responded that they see a nurse practitioner (NP) or physician assistant (PA) for all or most of their primary care, and 24 percent said that they see an NP or PA for some of their primary care. Rural beneficiaries were more likely than urban beneficiaries to report that they see an NP or PA for all or most of their care (13 percent for rural beneficiaries vs. 9 percent for urban beneficiaries).
Beneficiaries are generally able to find a new physician, but those seeking a new primary care provider encounter more trouble than those seeking a specialist Our survey also asks whether beneficiaries seeking a new doctor
face problems finding one. Overall, 1.3 percent of all Medicare beneficiaries reported that they had a big problem finding a new primary care doctor, higher than the share of Medicare beneficiaries reporting that they had a big problem finding a new specialist (0.7 percent). The rates of individuals with private insurance who reported a big problem finding a doctor or specialist were similar, at 1.4 percent and 1.1 percent, respectively.
Overall, we do not find significant problems with beneficiary access to physicians or other health professional services, but beneficiaries in certain areas or populations may face problems with access to care, and beneficiaries may have difficulty finding physicians in certain specialties. However, even though the share of beneficiaries with access issues is small, the problems faced by these beneficiaries can be personally distressing and are often featured in local and national media reports.
Reports of not getting needed care are higher among privately insured individuals and some groups of beneficiaries A lesser share of Medicare beneficiaries (8 percent) than privately insured individuals (11 percent) reported that they had a health problem for which they should have seen, but did not see, a doctor (Table 4-2).
Among Medicare beneficiaries, a greater share of minority beneficiaries reported that they always had to wait longer than they wanted for routine care (4 percent vs. 2 percent of White beneficiaries) and for an illness or injury appointment (3 percent vs. 1 percent). Similarly, minority beneficiaries were more likely than White beneficiaries to report that they had a medical concern about which they should have seen, but did not see, a doctor (10 percent for minority beneficiaries, 8 percent for White beneficiaries). Other differences by race in the share of beneficiaries reporting difficulties in access to primary or specialty care services were not significant (Table 4-3, p. 100).
urban and rural beneficiaries report similar access Overall, the survey found no major differences in access between urban and rural beneficiaries. Most urban and rural beneficiaries (73 percent of both) never had to wait longer than they want for routine care; the shares were greater for illness or injury appointments (81 percent for urban, 82 percent for rural beneficiaries; see online Appendix 4-A, available at http://www.medpac.gov). There were no significant differences in the rates of urban and rural beneficiaries reporting that they did not have a problem finding a primary care physician or a specialist.
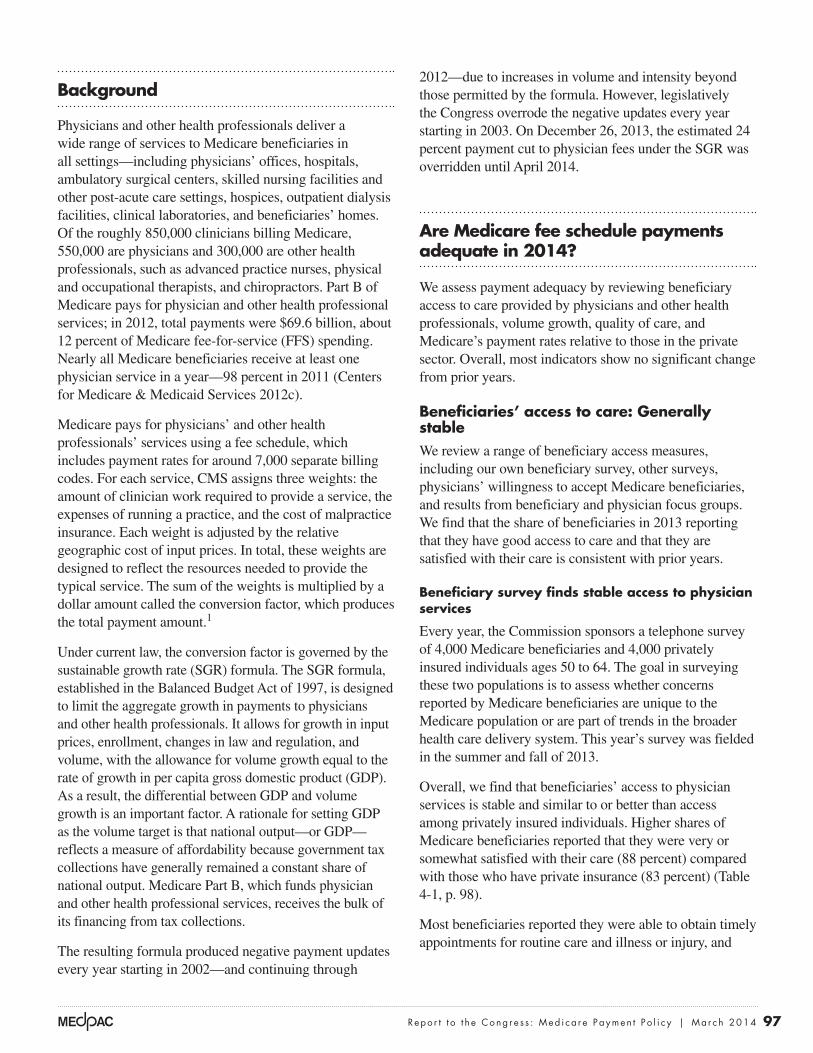
t A B L e4–1 satisfaction with the overall
quality of health care received in the past 12 months, 2013
Medicare (age 65 or older)
private insurance
(age 50–64)
Very satisfied 70% 60%Somewhat satisfied 18 23Somewhat dissatisfied 3 4Very dissatisfied 1 1
Note: Table excludes the following responses: “Did not receive health care in past 12 months,” “Don’t know,” and “Refused.”
Source: MedPAC-sponsored telephone survey conducted in 2013.
99 Repo r t t o t h e Cong r e s s : Med i ca r e Paymen t P o l i c y | Ma r ch 2014
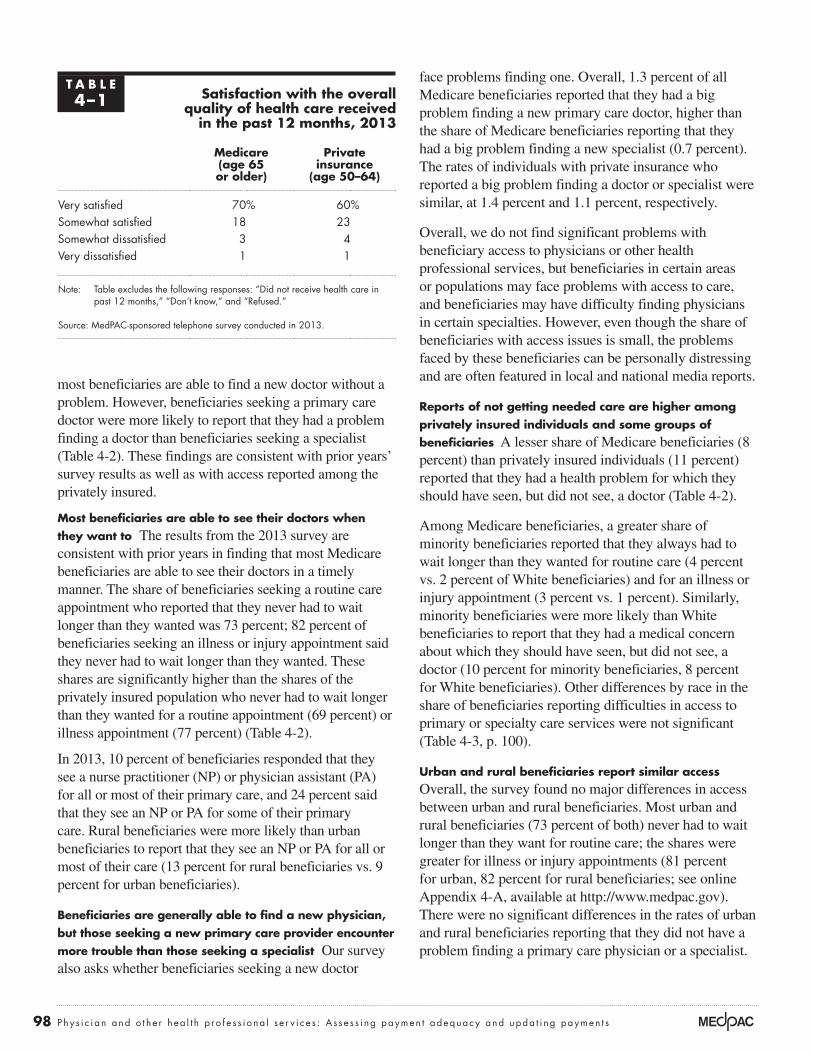
t A B L e4–2 Most aged Medicare beneficiaries and older privately insured
individuals have good access to physician care, 2009–2013
Medicare (age 65 or older)
private insurance (age 50–64)
survey question 2009 2010 2011 2012 2013 2009 2010 2011 2012 2013
unwanted delay in getting an appointment: Among those who needed an appointment in the past 12 months, “How often did you have to wait longer than you wanted to get a doctor’s appointment?”
For routine careNever 77%ab 75%ab 74%a 77%ab 73%a 71%ab 72%ab 71%a 72%ab 69%a
Sometimes 17ab 17ab 18a 17ab 20a 22a 21ab 21a 21ab 23a
Usually 2ab 3a 3 3 3a 3a 4a 4 3b 4a
Always 2 2 2a 2ab 3 3 3 3a 3a 3
For illness or injury Never 85ab 83a 82 84a 82a 79a 80ab 79 80a 77a
Sometimes 11ab 13a 14a 12a 14a 17ab 15a 17a 16ab 17a
Usually 2 2 2 2 2a 2 2 2 2 3a
Always 1 1a 1 1a 1 2 2a 1 2a 2
not accessing a doctor for medical problems: “During the past 12 months, did you have any health problem or condition about which you think you should have seen a doctor or other medical person, but did not?”
Percent answering “Yes” 7a 8a 8a 8a 8a 11a 12a 11a 11a 11a
Looking for a new doctor: “In the past 12 months, have you tried to get a new...?” (Percent answering “Yes”) Primary care doctor 6 7 6b 7 7 8 7 7 7 8Specialist 14a 13ab 14a 13a 14 19a 15a 16a 18a 16
getting a new physician: Among those who tried to get an appointment with a new primary care physician or a specialist in the past 12 months, “How much of a problem was it finding a primary care doctor/specialist who would treat you? Was it…”
primary care physician
No problem 78 79a 65 72 70 71 69a 68 75 67Percent of total insurance group 5.0 5.2 3.6 4.7 5.2 5.4 4.8 4.5 5.0 5.2
Small problem 10 8 12 14 11 8b 12 16 9 15b
Percent of total insurance group 0.6 0.5 0.7 0.9 0.8 0.6 0.8 1.1 0.6 1.2
Big problem 12a 12 23a 14 17 21a 19 14a 15 18Percent of total insurance group 0.8 0.8 1.3 0.9 1.3 1.6 1.3 0.9 1.0 1.4
specialist No problem 88 87a 84 87 86 84 82ab 86 86 87b
Percent of total insurance group 12.5 11.0 12.1 11.7 12.4 16.1 12.6 13.9 15.6 13.9
Small problem 7 6a 8 6 8 9 11ab 8 7 6b
Percent of total insurance group 1.0 0.8 1.1 0.7 1.2 1.7 1.8 1.3 1.2 0.9
Big problem 5 5 7 7 5 7 6 6 7 7Percent of total insurance group 0.7 0.7 1.0 0.9 0.7 1.3 1.0 1.0 1.2 1.1
Note: Numbers may not sum to 100 percent because missing responses (“Don’t know” or “Refused”) are not presented. Sample sizes for each group (Medicare and privately insured) are 4,000 from 2009 to 2013. Sample sizes for individual questions varied.
a Statistically significant difference between the Medicare and privately insured populations in the given year (at a 95 percent confidence level).
b Statistically significant difference from 2013 within the same insurance coverage category (at a 95 percent confidence level).
Source: MedPAC-sponsored telephone surveys conducted in 2009, 2010, 2011, 2012, and 2013.

100 Phy s i c i a n and o t h e r h ea l t h p r o f e s s i o na l s e r v i c e s : A s s e s s i ng paymen t adequacy and upda t i ng paymen t s
t A B L e4–3 Medicare beneficiaries have better or similar access to physicians
compared with privately insured individuals, but minorities in both groups report problems more frequently, 2013
Medicare (age 65 or older)
private insurance (age 50–64)
survey question All White Minority All White Minority
unwanted delay in getting an appointment: Among those who needed an appointment in the past 12 months, “How often did you have to wait longer than you wanted to get a doctor’s appointment?”
For routine careNever 73%a 74%a 71%a 69%a 70%ab 65%ab
Sometimes 20a 20a 19a 23a 23a 25a
Usually 3a 3a 4 4a 5a 4Always 3 2b 4b 3 3b 5b
For illness or injury Never 82a 83ab 77b 77a 77a 76Sometimes 14a 13a 16 17a 18a 17Usually 2a 2ab 3b 3a 3a 2Always 1 1b 3b 2 1 2
not accessing a doctor for medical problems: “During the past 12 months, did you have any health problem or condition about which you think you should have seen a doctor or other medical person, but did not?”
Percent answering “Yes” 8a 8ab 10b 11a 11a 11
Looking for a new doctor: “In the past 12 months, have you tried to get a new...?” (Percent answering “Yes”) Primary care physician 7 7 7 8 8 7Specialist 14 15b 12b 16 17b 12b
getting a new physician: Among those who tried to get an appointment with a new primary care physician or a specialist in the past 12 months, “How much of a problem was it finding a primary care doctor / specialist who would treat you? Was it…”
primary care physician
No problem 70 72 65 67 67 66Percent of total insurance group, by race 5.2 5.4 4.5 5.2 5.4 4.7
Small problem 11 9a 19a 15 15a 16a
Percent of total insurance group, by race 0.8 0.7 1.3 1.2 1.2 1.1
Big problem 17 18 14 18 19 16Percent of total insurance group, by race 1.3 1.4 1.0 1.4 1.5 1.1
specialist
No problem 86 87 80 87 88 86Percent of total insurance group, by race 12.4 13.1 9.4 13.9 14.9 10.6
Small problem 8 7 12a 6 6 4a
Percent of total insurance group, by race 1.2 1.1 1.4 0.9 1.0 0.6
Big problem 5 5 7 7 6 9Percent of total insurance group, by race 0.7 0.7 0.8 1.1 1.0 1.1
Note: Respondents who did not report race or ethnicity were not included in “White” or “Minority” results but were included in “All” results. Numbers may not sum to 100 percent because missing responses (“Don’t know” or “Refused”) are not presented and due to rounding. Sample sizes for each group (Medicare and privately insured) were 4,000 in 2013. Sample sizes for individual questions varied. a Statistically significant difference between the Medicare and privately insured populations in the given year (at a 95 percent confidence level). b Statistically significant difference by race within the same insurance category in the given year (at a 95 percent confidence level).
Source: MedPAC-sponsored telephone surveys, conducted in 2013.

101 Repo r t t o t h e Cong r e s s : Med i ca r e Paymen t P o l i c y | Ma r ch 2014
This year, interviewers probed beneficiaries and providers about the concept of retainer-based, or “concierge,” physician practices. A few beneficiaries reported that they had sought care from retainer-based practices, and a few physicians reported that they had joined retainer-based practices because they felt that it allowed them to simplify administration of their practice.
Finally, participants in the physician focus groups and at the site visits were asked about working in a solo practice compared with working in a large practice or for a hospital or other organization. Many physicians reported that it was becoming more difficult to operate as a solo physician practice; interviewers got this response from both practitioners who had a solo practice as well as those in large organizations. Younger physicians were generally more likely to see a benefit to working in a large organization than were older physicians. Some also said that working for a larger organization made it easier to adopt technologies and new innovations because the organization could cover the cost of the investment, but they felt that the trade-off was some loss of autonomy.
other national patient surveys show results comparable with the Commission survey regarding beneficiaries’ access to services
The findings of other surveys assessing access for Medicare beneficiaries are similar to our beneficiary survey:
• An analysis of the 2011 Medicare Current Beneficiary Survey (MCBS) finds that 96 percent of noninstitutionalized Medicare beneficiaries had a usual source of medical care (74 percent cited a doctor’s office and 12 percent cited a clinic). About 5 percent of beneficiaries reported that they had difficulty obtaining care, and 10 percent of beneficiaries reported that they delayed care because of cost. By comparison, higher rates of the under-65 Medicare population (generally entitled to Medicare based on a disability) had access problems: 15 percent reported trouble obtaining care and 25 percent reported delaying care because of cost (Centers for Medicare & Medicaid Services 2013a).
• The 2010 Health Tracking Household Survey, administered by the Center for Studying Health System Change, found that access to health care was similar between Medicare beneficiaries and individuals ages 55–64 with private insurance. Specifically, Medicare seniors reported levels of
Beneficiary focus groups
For a number of years, the Commission has contracted to conduct beneficiary and physician focus groups to supplement our survey. This year, the focus groups included Medicare beneficiaries, dual-eligible Medicare and Medicaid beneficiaries, and primary care physicians. Groups were conducted in four areas: the Bronx, NY; Greenville, SC; Chicago, IL/Gary, IN; and Richmond, VA. These focus groups were supplemented by visits to providers in different locations—27 facilities and agencies, including hospitals and health systems, private practices, and mental health providers, among others.
With respect to access, the Commission’s findings from beneficiary focus groups have shown considerable consistency over time. Beneficiaries reported that, overall, they generally had a regular source of care and could get in to see their primary care provider in a reasonable amount of time. Some reported that they could see their provider the same day or the next day, while others reported that the wait could be more like a few days to a few weeks. Beneficiaries who see practitioners in large group practices were more likely to report that they could see another provider in their practice that day even if their usual physician was not available.
Dual-eligible beneficiaries were more likely to report that they had trouble finding a new doctor or provider, which is consistent with both the reports from prior years’ focus groups as well as beneficiary surveys. Some Medicare beneficiaries reported that while their physicians did not accept new Medicare patients, they were able to continue being seen because they were patients of the practitioner before attaining Medicare eligibility. Some beneficiaries reported problems finding access to certain specialists—notably dermatologists and psychiatrists, which is also consistent with reports from prior years’ focus groups.
Most providers interviewed stated that they continued to take new Medicare patients, at least in some capacity. A few reported that they had either dropped all insurance or that they were considering dropping Medicare in the future. Providers were more likely to report that they did not take certain types of Medicare Advantage plans (such as health maintenance organizations, or HMOs), even though they continued to take Medicare FFS. For example, one provider was having trouble keeping up with the changes in coverage in one Medicare Advantage plan and no longer participated in that plan. A few providers also reported that they did not take Medicare because of the complexity of patients in the disabled and aging populations.
102 Phy s i c i a n and o t h e r h ea l t h p r o f e s s i o na l s e r v i c e s : A s s e s s i ng paymen t adequacy and upda t i ng paymen t s
While the Commission survey is currently unable to assess whether beneficiaries have supplemental coverage or are enrolled in Medicare Advantage plans, other surveys are able to identify beneficiaries’ type of coverage either from a detailed questionnaire covering insurance status (such as the MEPS) or by matching survey responses to Medicare administrative data (such as the MCBS). From those surveys, we can see whether the Medicare population’s access to care varies by the type of coverage they have.
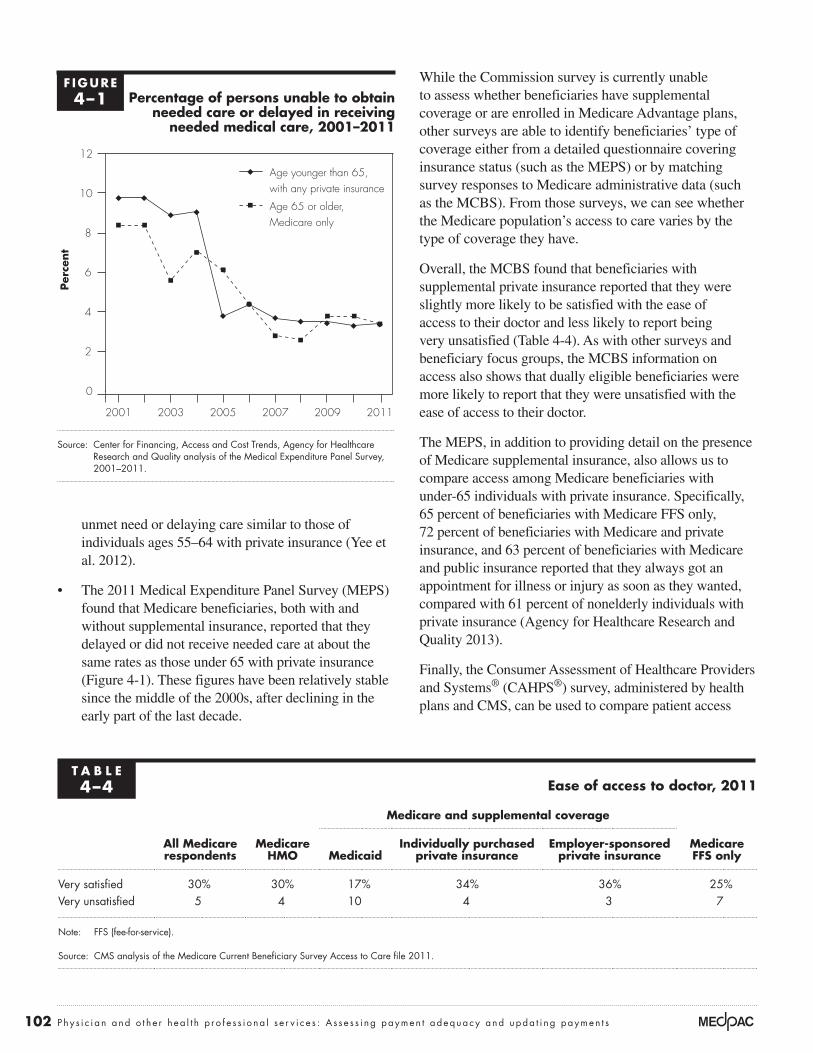
Overall, the MCBS found that beneficiaries with supplemental private insurance reported that they were slightly more likely to be satisfied with the ease of access to their doctor and less likely to report being very unsatisfied (Table 4-4). As with other surveys and beneficiary focus groups, the MCBS information on access also shows that dually eligible beneficiaries were more likely to report that they were unsatisfied with the ease of access to their doctor.
The MEPS, in addition to providing detail on the presence of Medicare supplemental insurance, also allows us to compare access among Medicare beneficiaries with under-65 individuals with private insurance. Specifically, 65 percent of beneficiaries with Medicare FFS only, 72 percent of beneficiaries with Medicare and private insurance, and 63 percent of beneficiaries with Medicare and public insurance reported that they always got an appointment for illness or injury as soon as they wanted, compared with 61 percent of nonelderly individuals with private insurance (Agency for Healthcare Research and Quality 2013).
Finally, the Consumer Assessment of Healthcare Providers and Systems® (CAHPS®) survey, administered by health plans and CMS, can be used to compare patient access
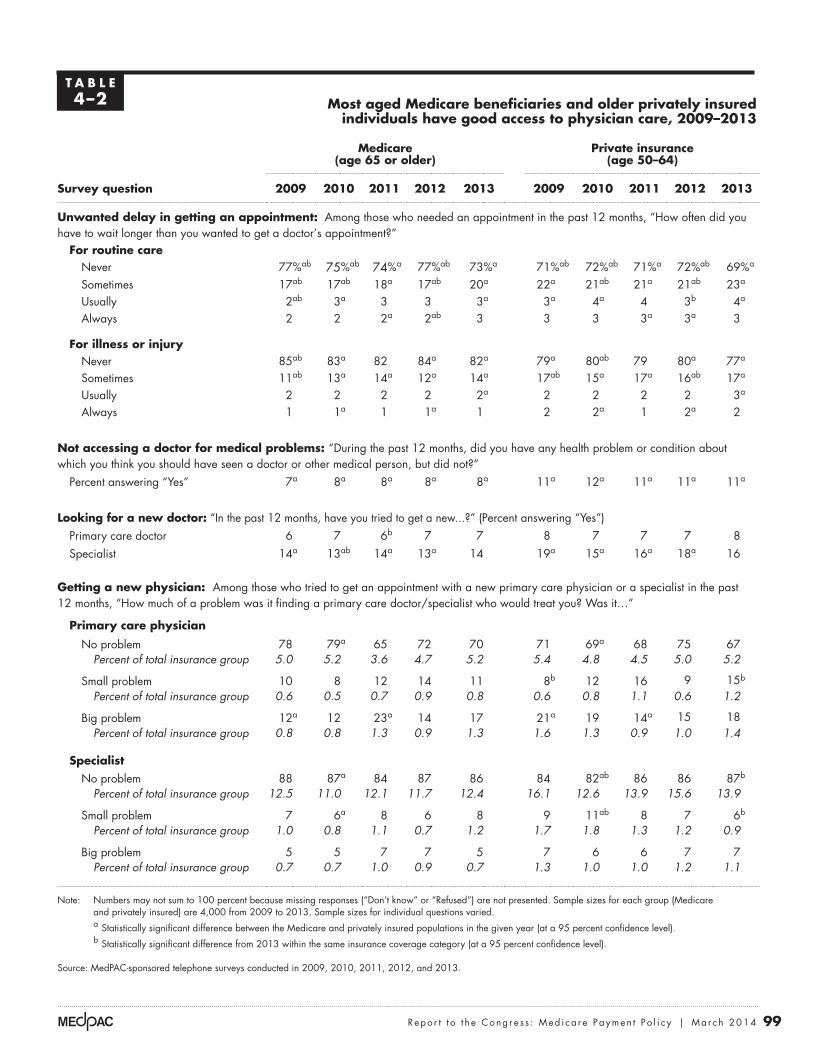
unmet need or delaying care similar to those of individuals ages 55–64 with private insurance (Yee et al. 2012).
• The 2011 Medical Expenditure Panel Survey (MEPS) found that Medicare beneficiaries, both with and without supplemental insurance, reported that they delayed or did not receive needed care at about the same rates as those under 65 with private insurance (Figure 4-1). These figures have been relatively stable since the middle of the 2000s, after declining in the early part of the last decade.
F IguRe4–1 percentage of persons unable to obtain
needed care or delayed in receiving needed medical care, 2001–2011
Source: Center for Financing, Access and Cost Trends, Agency for Healthcare Research and Quality analysis of the Medical Expenditure Panel Survey, 2001–2011.
Per
cent
Volume growth has raised...FIGURE4-1
0
2
4
6
8
10
12Older than 65, Medicare only
Younger than 65, any private insurance
201120092007200520032001
Notes about this graph:• Data is in the datasheet. Make updates in the datasheet.• I had to force return the items on the x-axis. They will reflow if I update the data.• I had to manually draw tick marks and axis lines because they kept resetting when I changed any data.• Use direct selection tool to select items for modification. Otherwise if you use the black selection tool, they will reset to graph default when you change the data.• Use paragraph styles (and object styles) to format.
Note: Note and Source in InDesign.
Age younger than 65, with any private insurance
Age 65 or older, Medicare only
t A B L e4–4 ease of access to doctor, 2011
All Medicare respondents
Medicare HMo
Medicare and supplemental coverage
Medicare FFs onlyMedicaid
Individually purchased private insurance
employer-sponsored private insurance
Very satisfied 30% 30% 17% 34% 36% 25%Very unsatisfied 5 4 10 4 3 7
Note: FFS (fee-for-service).
Source: CMS analysis of the Medicare Current Beneficiary Survey Access to Care file 2011.

103 Repo r t t o t h e Cong r e s s : Med i ca r e Paymen t P o l i c y | Ma r ch 2014
to physician and other health professional services between beneficiaries in Medicare Advantage (MA) and beneficiaries in FFS Medicare. The Kaiser Family Foundation did such an analysis and reported that beneficiaries in Medicare FFS and beneficiaries in MA were generally able to get an appointment for routine care as soon as needed at the same rate—62 percent (Boccuti et al. 2013). We are not currently able to compare access to care between beneficiaries served by an accountable care organization (ACO) and those in FFS or MA using the beneficiary telephone survey, although we may be able to do so in the future.
Some beneficiary surveys, in assessing whether individuals could get a timely appointment with their doctor, pose general questions regarding whether beneficiaries were able to see their doctor as soon as they wanted. The MEPS and the Commission’s surveys use such a framework, which helps allay concerns that beneficiaries may not be able to recall how long they waited for doctors’ appointments over the prior year with sufficient specificity.
The MCBS does ask interviewees how long they waited for their last physician appointment. In 2011, half of Medicare beneficiaries reported that they could see their doctor within three days—20 percent report that they could see their physician without waiting, and 30 percent report that they have to wait one to three days. These figures have remained relatively constant over the past decade (Figure 4-2).
physician surveys show that providers were generally willing to accept Medicare beneficiaries
Another measure of beneficiary access to physician services is the willingness of providers to accept new Medicare patients. A study from the Department of Health and Human Services Office of the Assistant Secretary for Planning and Evaluation (ASPE) reported that initial findings from the 2011 and 2012 National Ambulatory Medical Care Survey (NAMCS) showed that physician acceptance of new Medicare patients was similar to prior years, with about 85 percent of primary care physicians accepting new Medicare patients (when pediatricians
Half of all beneficiaries report that they can see their physician within three days
Source: Medicare Current Beneficiary Survey Access to Care file 2000–2011.
Wait timesPer
cent
of
ben
efici
ari
esFIGURE4-2
Note: Note and Source are in InDesign.
Source:
Notes about this graph:• Data is in the datasheet. Make updates in the datasheet.• WATCH FOR GLITCHY RESETS WHEN YOU UPDATE DATA!!!!• The column totals were added manually.• I had to manually draw tick marks and axis lines because they kept resetting when I changed any data.• I can’t delete the legend, so I’ll just have to crop it out in InDesign.• Use direct selection tool to select items for modification. Otherwise if you use the black selection tool, they will reset to graph default when you change the data.• Use paragraph styles (and object styles) to format. • Data was from: R:\Groups\MGA\data book 2007\data book 2007 chp1
0
10
20
30
40
50
60
70
80
90
100
201120102009200820072006200520042003200220012000
Over 3 weeks
10 to 21 days
4 to 9 days
1 to 3 days
Did not have to wait
F IguRe4–2

104 Phy s i c i a n and o t h e r h ea l t h p r o f e s s i o na l s e r v i c e s : A s s e s s i ng paymen t adequacy and upda t i ng paymen t s
are excluded) and 90 percent of specialist physicians accepting new Medicare patients (Shartzer et al. 2013).2
The American Medical Association 2013 National Health Insurer Report Card, which assesses payment accuracy, timeliness, and transparency, found that Medicare was comparable with other large payers (American Medical Association 2013).
supply of physicians and other professionals billing Medicare has kept pace with enrollment growth, and most services are paid on assignment Other indicators of access include the supply of providers billing Medicare, the share of physicians and other health professionals who are participating providers, and whether these providers take assignment (which means that they accept Medicare’s payment as payment in full). A small number of providers opt out of the Medicare program—less than 1 percent.
supply of physicians and other health professionals billing Medicare has kept pace with enrollment growth
Our analysis of Medicare FFS claims data for 2010 to 2012 shows that the number of physicians and other health professionals providing services to Medicare beneficiaries kept pace with growth in the beneficiary population. For physicians in specialties eligible for the Primary Care Incentive Payment Program, the ratio of these physicians per 1,000 beneficiaries remained constant at 3.8 per 1,000. Between 2011 and 2012, the ratio of physicians in other
specialties fell slightly from 8.5 per 1,000 to 8.4 per 1,000. Meanwhile, the number of advanced practice nurses and physician assistants billing Medicare grew from 2.8 per 1,000 to 3.0 per 1,000 (Table 4-5).
Most physicians and other professionals are part of Medicare’s participating provider program, and most claims are taken on assignment
Nearly all physicians and other health professionals billing Medicare sign an agreement with Medicare to be part of the participating provider program—96 percent in 2011 (Centers for Medicare & Medicaid Services 2012b). Participating providers agree to take assignment for all claims, which means they accept the fee schedule amount as payment in full (most claims are paid on assignment—99.3 percent in 2011). In return, participating providers receive the full fee schedule amount, can receive payments directly from Medicare (rather than billing the beneficiary for the full amount of the service), have their name and address listed on Medicare’s website, and can electronically search a beneficiary’s supplemental insurance status.
Providers who do not elect to participate receive a 5 percent lower payment amount and can choose whether to take assignment for their claims. If they do not assign a claim, providers may “balance bill” up to 109.25 percent of the fee schedule amount, with the beneficiary paying the difference between that limiting charge and Medicare’s payment.
t A B L e4–5 physicians and other health professionals billing Medicare, 2010–2012
Year
physicians Advanced practice nurses and
physician assistants other practitionersprimary care specialties other specialties
number
number per 1,000
beneficiaries number
number per 1,000
beneficiaries number
number per 1,000
beneficiaries number
number per 1,000
beneficiaries
2010 165,565 3.8 372,269 8.5 113,232 2.6 135,584 3.12011 169,640 3.8 379,411 8.5 123,959 2.8 140,436 3.12012 174,848 3.8 388,237 8.4 138,184 3.0 146,396 3.2
Note: Primary care specialties are those eligible for the Primary Care Incentive Payment Program: family medicine, internal medicine, pediatric medicine, and geriatric medicine. Number billing Medicare includes those with a caseload of more than 15 different beneficiaries during the year. Beneficiary counts include those in fee-for-service and Medicare Advantage, on the assumption that professionals are furnishing services to both types. Figures exclude nonperson providers (e.g., suppliers or lab facilities).
Source: Medicare claims data for 100 percent of beneficiaries and the 2013 annual report of the Boards of Trustees of the Medicare trust funds.

105 Repo r t t o t h e Cong r e s s : Med i ca r e Paymen t P o l i c y | Ma r ch 2014
Balance billing and nonparticipating providers are relatively rare in Medicare, and the total amount of balance billing has been declining over time (Centers for Medicare & Medicaid Services 2012c). Some provider specialties are more likely to balance bill than others. For example, chiropractors are more likely than other specialties or provider types to balance bill—90 percent of their claims were taken on assignment, and average balance billing amounts were about $20 per patient. Other specialties were less likely to balance bill; when they do, because their services are more expensive, the beneficiary’s liability is higher. For example, thoracic and cardiac surgery patients who were subject to balance billing had average liabilities of $87 and $164, respectively, and patients of radiation oncologists who were subject to balance billing had average liabilities of $434 (Centers for Medicare & Medicaid Services 2012c).
practitioners who opt out of Medicare are rare but the number may be increasing
Physicians and other health professionals opt out of the Medicare program by signing an affidavit with Medicare agreeing that they cannot receive any reimbursement from Medicare, directly or indirectly, for any Medicare patient they see. They must enter into a private contract with Medicare beneficiaries in order to care for them, and the contract must state that no payment will be made from Medicare either to the beneficiary or to the provider for services delivered by the opt-out physician. Opt-out agreements are in place for two years and can be renewed.
Based on data from CMS, as of September 30, 2013, just over 6,600 providers had opted out of the Medicare program, accounting for less than 1 percent of all providers billing under the fee schedule. The largest share of these opt-out providers were psychiatrists and oral surgeons (dentists only). These two specialties alone accounted for over half of the opt-out providers. Providers who opted out are concentrated in California, New York, and Texas. Opt-out providers were more likely to be older—more than a third were over the age of 60.
use of services is essentially unchanged
We analyze annual changes in use of services as another indicator of payment adequacy but recommend caution in interpreting such data because factors unrelated to Medicare’s payment adequacy can influence service volume. Our evidence indicates that volume decreases are more likely to be due to non–payment-related factors,
such as general practice pattern changes or concerns about overuse of imaging. For example, the volume of coronary artery bypass grafting has been declining as other interventions substitute for this procedure. Increases in volume may signal overpricing if physicians favor certain services because they are relatively profitable, but other factors—including changes in population, disease prevalence, Medicare benefits, site of care, technology, and beneficiaries’ preferences—can also explain volume increases.
For this year’s analysis of volume changes, we used claims data for 2007, 2011, and 2012 to identify the services provided by physicians and other professionals billing under Medicare’s fee schedule and calculate two measures of changes in service use. First, we calculated the change in the units of service per beneficiary. Second, we calculated the change in the volume of services per beneficiary. Volume is calculated as units of service multiplied by each service’s relative value unit (RVU) from the fee schedule. The result is that volume growth accounts for changes in both the number of services and the complexity, or intensity, of those services. For example, growth in the volume of imaging services would account not just for any change in the number of such services but also for any change in intensity, such as when providers substitute computed tomography (CT) scans for less complex X-rays. We used RVUs for 2012 to put service volume for all years on a common scale.
Our volume analysis also accounts for the policy changes that have occurred in payments for office and inpatient consultations. As of 2010, CMS stopped recognizing the billing codes for consultations.3 Physicians and other health professionals now use office visit codes and codes for hospital and nursing facility visits. If we ignored this change in policy, the volume analysis would show a change in intensity of services—use of lower payment rate visits in place of higher payment rate consultations. To avoid this inaccuracy, when considering changes in service use before 2010 we focus the discussion belowon the change in units of service and limit discussion of changes in volume growth to those services not affected by the change in payments for consultations.
Across all services, volume per beneficiary remained essentially unchanged, with a growth rate of −0.2 percent in 2012 (Table 4-6, p. 106). Among broad categories of service, growth rates were 0.1 percent for evaluation and management (E&M), 0.2 percent for major procedures,

106 Phy s i c i a n and o t h e r h ea l t h p r o f e s s i o na l s e r v i c e s : A s s e s s i ng paymen t adequacy and upda t i ng paymen t s
t A B L e4–6 use of services furnished by physicians and other
health professionals, per fee-for-service beneficiary
type of service
Change in units of service per beneficiary
Change in volume per beneficiary percent
of 2012 allowed charges
Average annual 2007–2011 2011–2012
Average annual 2007–2011 2011–2012
All services 1.4% –0.4% n/A –0.2% 100.0%
evaluation and management 0.8 –0.4 n/A 0.1 45.8Office visit—new and established 0.8 0.2 N/A 0.6 25.3Inpatient visit—hospital and nursing facility 0.4 –1.8 N/A –1.3 15.5Emergency room visit 2.4 1.7 4.0% 2.5 3.2Hospital visit—critical care 6.9 1.7 7.0 1.7 1.4Home visit 4.4 0.1 5.2 0.4 0.4
Imaging 0.6 –1.9 0.2 –3.2 11.9Advanced—CT: other 2.6 1.7 1.7 –1.1 1.7Advanced—MRI: other 0.3 –0.4 –1.3 –3.4 1.2Echography—heart 0.6 –2.0 0.0 –5.1 1.2Standard—nuclear medicine –5.4 –8.0 –6.9 –13.6 1.0Echography—other 5.3 2.6 6.7 5.8 1.0Standard—musculoskeletal 0.4 –1.2 0.0 –2.0 0.9Standard—breast 2.8 –0.3 3.5 –1.6 0.7Imaging/procedure—other 0.0 –8.2 5.1 –4.7 0.6Advanced—MRI: brain –0.6 –1.3 –3.6 –5.3 0.6Advanced—CT: head 2.4 0.1 0.8 –2.4 0.5Standard—chest –0.8 –3.4 –1.3 –3.8 0.5Echography—abdomen and pelvis 2.3 0.1 2.7 0.3 0.5
Major procedures 0.5 –0.9 1.8 0.2 7.5Cardiovascular—other –0.8 –1.7 2.6 –0.1 1.8Orthopedic—other 4.7 –4.7 6.5 –5.3 1.1Knee replacement 0.7 2.5 1.3 2.6 0.5Coronary angioplasty –1.8 –6.0 –1.7 –5.8 0.3Hip replacement 2.4 4.7 3.0 4.9 0.3Explore, decompress, or excise disc 3.0 2.9 5.0 3.8 0.3Hip fracture repair –1.7 –2.8 –1.5 –2.7 0.2Coronary artery bypass graft –6.8 –6.8 –7.0 –6.6 0.2
other procedures 3.2 0.1 2.6 0.4 22.5Skin—minor and ambulatory 1.1 1.9 2.5 1.9 4.7Outpatient rehabilitation 6.4 –0.5 7.2 0.0 3.5Radiation therapy –1.6 –5.0 1.4 –6.3 2.1Minor—other 1.9 –0.8 2.4 0.3 2.0Cataract removal/lens insertion –0.8 1.1 –0.4 1.3 1.6Minor—musculoskeletal 2.2 2.2 2.8 2.0 1.4Eye—other 10.4 8.4 4.2 5.5 1.0Colonoscopy –2.3 –0.6 –2.2 –0.5 0.9Upper gastrointestinal endoscopy 1.0 –0.4 1.5 0.1 0.5Cystoscopy –0.2 1.0 –0.3 0.6 0.4
tests 1.1 0.2 3.0 –0.5 5.2Other tests 0.6 1.6 1.9 –1.1 2.0Laboratory tests—other 4.4 1.8 6.3 1.9 1.8Electrocardiograms 0.4 –1.9 0.8 –1.8 0.5
Note: N/A (not available), CT (computed tomography). Volume is measured as units of service multiplied by each service’s relative value unit (RVU) from the physician fee schedule. To put service use in each year on a common scale, we used the RVUs for 2012. For billing codes not used in 2012, we imputed RVUs based on the average change in RVUs for each type of service. Some low-volume categories are not shown but are included in the summary calculations. Evaluation and management volume is not reported for some types of service because a change in payment policy for consultations prevented assignment of RVUs to those services. For 2007, units of service for office visits and inpatient visits include, respectively, office and inpatient consultations. Laboratory tests include tests billable under the fee schedule for physicians and other health professionals and excludes services billable under the laboratory fee schedule. Numbers may not sum to totals due to rounding.
Source: MedPAC analysis of claims data for 100 percent of Medicare beneficiaries.

107 Repo r t t o t h e Cong r e s s : Med i ca r e Paymen t P o l i c y | Ma r ch 2014
called on his colleagues in the specialty to become “effective gatekeepers” who develop clinical imaging conferences, act as imaging consultants, and conduct imaging rounds (Jha 2013).
• In a study for the Commission documenting trends in the services provided to Medicare beneficiaries by cardiologists from 1999 to 2008, physician researchers found that the bulk of the growth occurred in two established technologies: echocardiograms and stress tests with nuclear imaging (Andrus and Welch 2012). They concluded that it is unlikely that these services were underused in 1999 and expressed doubt that there was a clinical justification for a threefold increase in nuclear stress testing and a twofold increase in echocardiography. They noted further that excessive use of such services poses a number of potential harms, including cancer risk due to radiation exposure (from nuclear imaging), anxiety related to false-positive results, and complications of invasive procedures pursued in response to those false-positive results.
0.4 percent for other procedures, and −0.5 percent for tests. Use of imaging services declined by 3.2 percent.
Imaging decreases amid concerns about appropriateness
Despite decreases after 2009, use of imaging services has remained much higher than it was a decade ago (Figure 4-3). Cumulative growth in the volume of imaging from 2000 to 2009 totaled 85 percent, compared with a cumulative decrease in imaging volume since then of about 7 percent. The growth in imaging volume from 2000 to 2009 was exceeded only by the 86 percent growth in use of tests—such as allergy tests—during those years. Such growth was more than double the cumulative growth rates during the same period for E&M services and major procedures, which were 32 percent and 34 percent, respectively.
Meanwhile, physicians and others continue to raise concerns about overuse of imaging, including the exposure to radiation that can accompany that overuse. Some physician organizations have responded to these concerns. For example, the American Board of Internal Medicine (ABIM) Foundation has a Choosing Wisely initiative underway to help physicians and patients have conversations about the overuse of imaging and other services such as CT or MRI scans for common headaches or imaging studies for those with nonspecific low back pain. The initiative is also intended to support physician efforts to help patients make smart and effective choices about their care (ABIM Foundation 2012).
• Data on trends in management and treatment of uncomplicated back pain in the general population for the years 1999 to 2000 and 2009 to 2010 show that orders for CT or MRI, as a proportion of visits for the condition, went from 7.2 percent to 11.3 percent (Mafi et al. 2013). Imaging is generally not indicated for uncomplicated low back pain. The study’s authors concluded that use of advanced diagnostic imaging for low back pain has experienced an inappropriate increase.
• Physicians have voiced concerns about diagnostic tests that are ordered without an understanding of how the results could change patient treatment (Hoffman and Cooper 2012, Redberg et al. 2011). The concern is that sophisticated technology, while able to detect disease, can also have costs, including exposure to radiation, adverse effects of treatment, and proliferation of false-positive results. One radiologist
F IguRe4–3 growth in the volume of
practitioner services, 2000–2012
Note: E&M (evaluation and management). Volume growth for E&M from 2009 to 2010 is not directly observable due to a change in payment policy for consultations. To compute cumulative volume growth for E&M through 2011, we used a growth rate for 2009 to 2010 of 1.85 percent, which is the average of the 2008 to 2009 growth rate of 1.70 percent and the 2010 to 2011 growth rate of 2.00 percent.
Source: MedPAC analysis of claims data for 100 percent of Medicare beneficiaries.
Cum
ula
tive
per
cent
change
Volume growth has raised...FIGURE4-2
0
20
40
60
80
100Major procedures
E&M
Other procedures
Tests
Imaging
2012201020082006200420022000
Notes about this graph:• Data is in the datasheet. Make updates in the datasheet.• I had to force return the items on the x-axis. They will reflow if I update the data.• I had to manually draw tick marks and axis lines because they kept resetting when I changed any data.• Use direct selection tool to select items for modification. Otherwise if you use the black selection tool, they will reset to graph default when you change the data.• Use paragraph styles (and object styles) to format.
Note: Note and Source in InDesign.
ImagingTestsOther proceduresE&M servicesMajor procedures
108 Phy s i c i a n and o t h e r h ea l t h p r o f e s s i o na l s e r v i c e s : A s s e s s i ng paymen t adequacy and upda t i ng paymen t s
of Medicine, a physician and another author wrote that “the goal should be to redirect nascent physicians from a shotgun approach toward the critical use of imaging in thoughtful and elegant diagnosis” (Hillman and Goldsmith 2010).
• As discussed in the Commission’s June 2011 report, there is evidence that some diagnostic imaging services ordered by physicians are not clinically appropriate and that inappropriate use occurs in multiple settings. The American College of Cardiology Foundation (ACCF) and UnitedHealthcare assessed the appropriateness of nuclear cardiology procedures performed by six nonhospital practices using criteria developed by the ACCF and the American Society of Nuclear Cardiology (Hendel et al. 2010). The researchers found that 14 percent of the studies performed at these sites were inappropriate and 15 percent were of uncertain appropriateness.
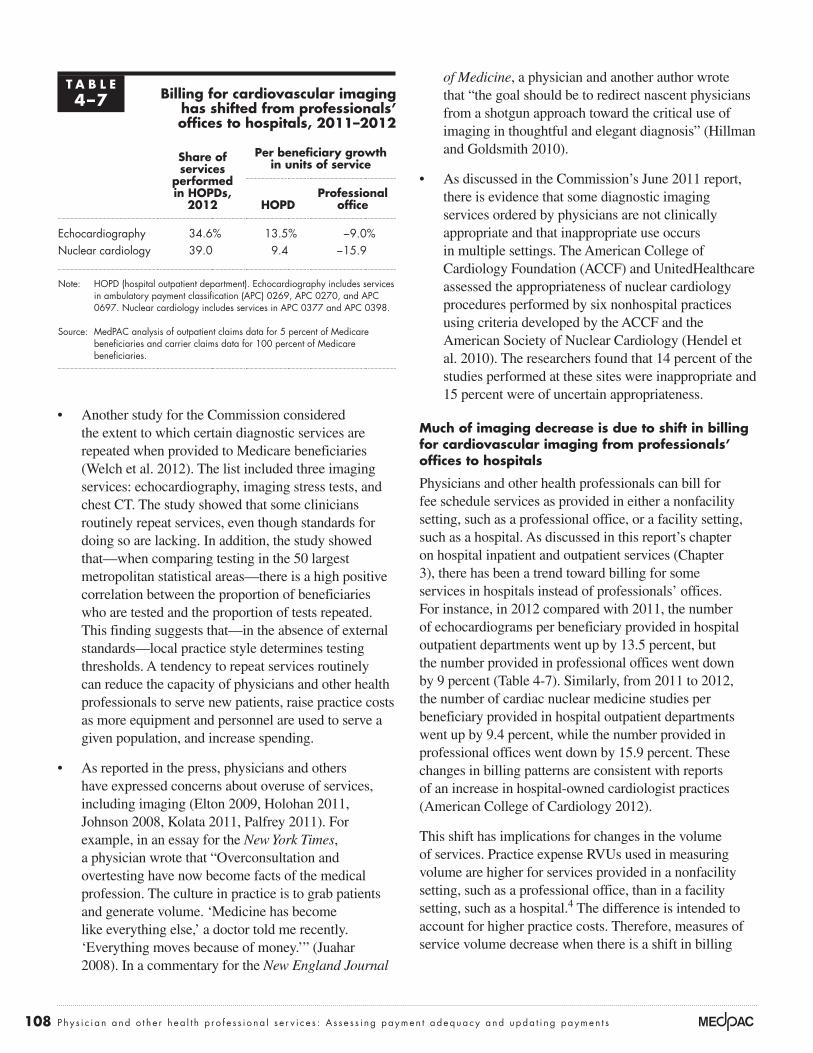
Much of imaging decrease is due to shift in billing for cardiovascular imaging from professionals’ offices to hospitals
Physicians and other health professionals can bill for fee schedule services as provided in either a nonfacility setting, such as a professional office, or a facility setting, such as a hospital. As discussed in this report’s chapter on hospital inpatient and outpatient services (Chapter 3), there has been a trend toward billing for some services in hospitals instead of professionals’ offices. For instance, in 2012 compared with 2011, the number of echocardiograms per beneficiary provided in hospital outpatient departments went up by 13.5 percent, but the number provided in professional offices went down by 9 percent (Table 4-7). Similarly, from 2011 to 2012, the number of cardiac nuclear medicine studies per beneficiary provided in hospital outpatient departments went up by 9.4 percent, while the number provided in professional offices went down by 15.9 percent. These changes in billing patterns are consistent with reports of an increase in hospital-owned cardiologist practices (American College of Cardiology 2012).
This shift has implications for changes in the volume of services. Practice expense RVUs used in measuring volume are higher for services provided in a nonfacility setting, such as a professional office, than in a facility setting, such as a hospital.4 The difference is intended to account for higher practice costs. Therefore, measures of service volume decrease when there is a shift in billing
• Another study for the Commission considered the extent to which certain diagnostic services are repeated when provided to Medicare beneficiaries (Welch et al. 2012). The list included three imaging services: echocardiography, imaging stress tests, and chest CT. The study showed that some clinicians routinely repeat services, even though standards for doing so are lacking. In addition, the study showed that—when comparing testing in the 50 largest metropolitan statistical areas—there is a high positive correlation between the proportion of beneficiaries who are tested and the proportion of tests repeated. This finding suggests that—in the absence of external standards—local practice style determines testing thresholds. A tendency to repeat services routinely can reduce the capacity of physicians and other health professionals to serve new patients, raise practice costs as more equipment and personnel are used to serve a given population, and increase spending.
• As reported in the press, physicians and others have expressed concerns about overuse of services, including imaging (Elton 2009, Holohan 2011, Johnson 2008, Kolata 2011, Palfrey 2011). For example, in an essay for the New York Times, a physician wrote that “Overconsultation and overtesting have now become facts of the medical profession. The culture in practice is to grab patients and generate volume. ‘Medicine has become like everything else,’ a doctor told me recently. ‘Everything moves because of money.’” (Juahar 2008). In a commentary for the New England Journal
t A B L e4–7 Billing for cardiovascular imaging
has shifted from professionals’ offices to hospitals, 2011–2012
share of services
performed in HopDs,
2012
per beneficiary growth in units of service
HopDprofessional
office
Echocardiography 34.6% 13.5% −9.0%Nuclear cardiology 39.0 9.4 −15.9
Note: HOPD (hospital outpatient department). Echocardiography includes services in ambulatory payment classification (APC) 0269, APC 0270, and APC 0697. Nuclear cardiology includes services in APC 0377 and APC 0398.
Source: MedPAC analysis of outpatient claims data for 5 percent of Medicare beneficiaries and carrier claims data for 100 percent of Medicare beneficiaries.

109 Repo r t t o t h e Cong r e s s : Med i ca r e Paymen t P o l i c y | Ma r ch 2014
these measures for FFS beneficiaries based on changes in rates between two time periods, 2009 to 2010 and 2011 to 2012. Between these periods, 18 indicators improved, 15 indicators were statistically unchanged, and 5 indicators worsened. All of the statistically significant changes in the rates were modest.
Two indicators that worsened slightly were the rate of beneficiaries with a breast cancer diagnosis who received a chest X-ray at initial diagnosis and the rate of mammography surveillance following diagnosis. In both cases, it is possible that physicians used other diagnostic imaging modalities such as MRI or CT that were not included in these measures—a separate indicator of breast imaging after diagnosis increased slightly (though not enough to be statistically significant). In contrast to recent years’ analyses, the indicator of breast cancer screening rates was stable rather than decreased. The trend in breast cancer screening rates was similar for Medicare Advantage and commercially insured private health plan enrollees, as measured in the National Committee for Quality Assurance’s Healthcare Effectiveness Data and Information Set® (HEDIS®). In the HEDIS measures, the rates of breast cancer screening also stabilized for those enrolled in Medicare HMOs and preferred provider
patterns from higher RVU nonfacility settings to lower RVU facility settings.
Some of the 3.2 percent decrease in the volume of imaging services results from decreases in units of service for nuclear medicine and echocardiography. However, the more important factor is the movement of these services from the nonfacility setting to the facility setting. If these two types of services are excluded from the calculations, the volume of all other imaging services from 2011 to 2012 would show a decrease of 1.9 percent instead of 3.2 percent.
Across all services, volume growth has contributed to an increase in spending
For all services billable under the fee schedule, Medicare spending per beneficiary has increased faster than both the Medicare Economic Index (MEI) and updates to the fee schedule’s conversion factor (Figure 4-4). From 2000 to 2012, Medicare spending per beneficiary increased by 72 percent despite an increase in updates of 9 percent, while the MEI rose at a cumulative rate of 27 percent. Since growth in payments to physicians is a function of volume growth and fee schedule updates, volume growth is an important factor accounting for the difference between the fee schedule updates and spending growth. Medicare’s payment adjustments for incentive programs are another source of changes in payments. For example, the Physician Quality Reporting System bonus for 2012 was 0.5 percent.5
From 2011 to 2012, per beneficiary spending for the services of physicians and other health professionals grew at a rate of 2 percent. By contrast, the average annual growth rate from 2000 to 2011 was 4.9 percent.
Quality of care: Most ambulatory care indicators were stable or improved, although some measures declinedThe Commission developed a set of quality indicators, called the Medicare Ambulatory Care Indicators for the Elderly (MACIEs), with input from a group of clinicians, to assess the quality of care delivered by physicians and other health professionals. The MACIEs consist of 32 measures of clinically indicated acute and follow-up care for beneficiaries diagnosed with certain chronic or acute conditions, as well as 6 measures of potentially avoidable hospitalizations and emergency department visits for beneficiaries with 5 chronic diseases (for a complete list of the MACIEs, see online Appendix 4-B, available at http://www.medpac.gov). For this year’s analysis, we calculated
F IguRe4–4 Volume growth has caused spending
to increase faster than input prices and updates, 2000–2012
Note: MEI (Medicare Economic Index). Source: 2013 annual report of the Boards of Trustees of the Medicare trust funds
and Office of the Actuary 2013.
Cum
ula
tive
per
cent
change
Volume growth has raised...FIGURE4-3
-10
0
10
20
30
40
50
60
70
80Updates
MEI
Spending per FFS beneficiary
2012201020082006200420022000
Notes about this graph:• Data is in the datasheet. Make updates in the datasheet.• I had to force return the items on the x-axis. They will reflow if I update the data.• I had to manually draw tick marks and axis lines because they kept resetting when I changed any data.• Use direct selection tool to select items for modification. Otherwise if you use the black selection tool, they will reset to graph default when you change the data.• Use paragraph styles (and object styles) to format.
Note: Note and Source in InDesign.
Spending per beneficiary
UpdatesMEI

110 Phy s i c i a n and o t h e r h ea l t h p r o f e s s i o na l s e r v i c e s : A s s e s s i ng paymen t adequacy and upda t i ng paymen t s
of primary care and overvaluing of specialty care. First, the Commission has concerns that the resource-based relative value scale, which forms the basis for the fee schedule, includes mispriced services and that these mispriced services can cause an income disparity between primary care and specialty physicians. Second, FFS payment allows some specialties to increase the volume of services they provide more easily (and therefore increase their revenue from Medicare), while other specialties, particularly those that spend most of their time providing E&M services, have limited ability to increase their volume. This difference in ability to increase volume can also lead to the compensation differences between primary care and specialty care.
For an analysis of the compensation received by physicians—the largest subset of practitioners—the Commission contracted with the Urban Institute, working in collaboration with the Medical Group Management Association (MGMA) (Berenson et al. 2010). The contractor developed a method for analysis of two measures of compensation: “actual compensation,” or actual revenues received by a physician from all payers, and “simulated compensation,” or payments a physician would receive if all the services the physician provided were paid under Medicare’s physician fee schedule.6 Private payers often use a conversion factor—or multiple conversion factors, depending on the type of service—that differs from Medicare’s.
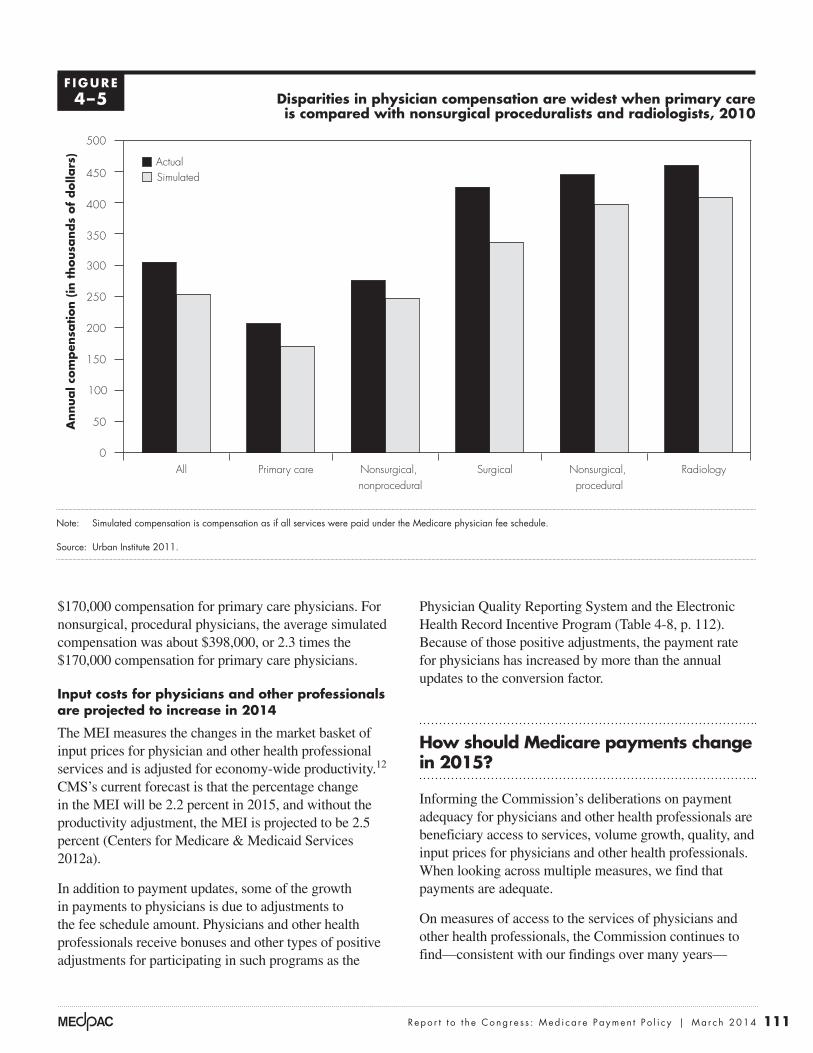
In an update of the initial analysis, the contractor used data from MGMA’s Physician Compensation and Production Survey to analyze physician compensation in 2010.7 The analysis showed that—averaged across all specialties—actual physician compensation was about $305,000 per year. Simulated annual compensation for all specialties was about $254,000—17 percent lower.8
Within these averages, compensation was much higher for some specialties than others. The specialty groups with the highest compensation were the nonsurgical, procedural group and radiology (Figure 4-5).9 Their actual compensations were about $445,000 and $460,000, respectively. Compensation at these levels was more than double that of the $207,000 average for primary care specialties.10,11
Use of simulated annual compensation instead of actual annual compensation resulted in minimal narrowing of the disparities between primary care physicians and specialists. Simulated, radiologists’ average annual compensation was about $408,000, or 2.4 times the
organization (PPOs) as well as commercially insured individuals under age 65, after decreasing from their peaks in 2005 and 2009, respectively (National Committee for Quality Assurance 2013). This trend may be due to ongoing discussions regarding the frequency and efficacy of breast cancer screening (Bleyer and Welch 2012).
Among the six measures of potentially avoidable hospitalizations for chronic conditions, four improved (hospitalization for short-term complications of diabetes, emergency department visits for unstable angina with coronary artery disease, hospitalization for heart failure, and hospitalization for chronic obstructive pulmonary disease), one worsened (hospitalization for hypertension), and the other (hospitalization for long-term complications of diabetes) was statistically unchanged.
Medicare payments and providers’ costsBecause physicians and other health professionals do not report their costs to the Medicare program, we use indirect measures to assess the adequacy of Medicare payments relative to physicians’ costs. The first measure is how Medicare’s payments compare with the fees paid by private insurers for covered services. The second measure is whether Medicare’s fee schedule encourages differences in physician compensation across specialties, even after accounting for the cost of running a practice. The third is a measure of input prices for physicians and other health professionals—the MEI.
Ratio of Medicare payments to private insurer payments is steady
Since 1999, the ratio of Medicare’s allowed physician and other health professional fees (including cost sharing) to private insurer allowed fees has been around 80 percent. Results for 2012 showed little change from the results reported for 2011. In 2012, Medicare’s payments for physician and other health professional services were 81 percent of commercial rates for PPOs; the rate for 2011 was 82 percent. This analysis is based on a data set of paid claims for PPO members of a large national insurer. We are unable to include additional private insurer payments or penalties that may occur outside of the claims payment process. In contrast, Medicare fees include bonuses or penalties as part of the claim.
Compensation differences between primary and specialty care
The Commission remains concerned that the fee schedule and the nature of FFS payment lead to an undervaluing
111 Repo r t t o t h e Cong r e s s : Med i ca r e Paymen t P o l i c y | Ma r ch 2014
Physician Quality Reporting System and the Electronic Health Record Incentive Program (Table 4-8, p. 112). Because of those positive adjustments, the payment rate for physicians has increased by more than the annual updates to the conversion factor.
How should Medicare payments change in 2015?
Informing the Commission’s deliberations on payment adequacy for physicians and other health professionals are beneficiary access to services, volume growth, quality, and input prices for physicians and other health professionals. When looking across multiple measures, we find that payments are adequate.
On measures of access to the services of physicians and other health professionals, the Commission continues to find—consistent with our findings over many years—
$170,000 compensation for primary care physicians. For nonsurgical, procedural physicians, the average simulated compensation was about $398,000, or 2.3 times the $170,000 compensation for primary care physicians.
Input costs for physicians and other professionals are projected to increase in 2014
The MEI measures the changes in the market basket of input prices for physician and other health professional services and is adjusted for economy-wide productivity.12
CMS’s current forecast is that the percentage change in the MEI will be 2.2 percent in 2015, and without the productivity adjustment, the MEI is projected to be 2.5 percent (Centers for Medicare & Medicaid Services 2012a).
In addition to payment updates, some of the growth in payments to physicians is due to adjustments to the fee schedule amount. Physicians and other health professionals receive bonuses and other types of positive adjustments for participating in such programs as the
Disparities in physician compensation are widest when primary care is compared with nonsurgical proceduralists and radiologists, 2010
Note: Simulated compensation is compensation as if all services were paid under the Medicare physician fee schedule.
Source: Urban Institute 2011.
Freestanding Medicare margins....A
nnual c
om
pen
sation (
in t
housa
nds
of
dolla
rs)
FIGURE4-5
Note: Note and Source are in InDesign.
Source:
Notes about this graph:• Data is in the datasheet. Make updates in the datasheet.• WATCH FOR GLITCHY RESETS WHEN YOU UPDATE DATA!!!!• The column totals were added manually.• I had to manually draw tick marks and axis lines because they kept resetting when I changed any data.• I can’t delete the legend, so I’ll just have to crop it out in InDesign.• Use direct selection tool to select items for modification. Otherwise if you use the black selection tool, they will reset to graph default when you change the data.• Use paragraph styles (and object styles) to format. • Data was from: R:\Groups\MGA\data book 2007\data book 2007 chp1
0
50
100
150
200
250
300
350
400
450
500
RadiologyNonsurgical, procedural
SurgicalNonsurgical, nonprocedural
Primary careAll
ActualSimulated
F IguRe4–5

112 Phy s i c i a n and o t h e r h ea l t h p r o f e s s i o na l s e r v i c e s : A s s e s s i ng paymen t adequacy and upda t i ng paymen t s
sgR repeal is urgentMedPAC’s highest policy priority with respect to Medicare’s payments to physicians and other health professionals is repeal of the SGR. Given the Commission’s findings regarding access to care, the Commission reiterates its principles for repeal and specific recommendations, as outlined in prior Commission documents.13
The Commission’s principles for addressing the SGR are:
• RepealoftheSGRisurgent. Temporary stop-gap fixes to the SGR have had a destabilizing influence on the Medicare program by creating uncertainty for physicians, other health professionals, and beneficiaries, and the short-term overrides of the SGR have created an administrative burden on providers and CMS.
• Beneficiaryaccessmustbepreserved.Although our latest access survey does not show significant deterioration at the national level, growing “SGR fatigue” among physicians, resulting from annual crises prompted by pending Medicare payment cuts, can only exacerbate any nascent access problems.
• Thephysicianfeeschedulemustberebalancedtoachievegreaterequityofpaymentsbetweenprimarycareandotherspecialties. Given the important role primary care will play in delivery system reform, the Commission believes that the imbalance in payment
that beneficiary access to care is stable. Medicare beneficiaries generally have better overall access to care than privately insured individuals ages 50 to 64. Other beneficiary access surveys have findings consistent with ours. The number of physicians per beneficiary has remained relatively constant, the number of other health professionals per beneficiary has grown, and the share of providers accepting assignment and enrolled in Medicare’s participating provider program remains high. However, more beneficiaries seeking a primary care doctor reported a significant problem than beneficiaries seeking a specialist, which continues to be of concern to the Commission.
The volume of physician and other health professional services per beneficiary was essentially unchanged, declining by 0.2 percent in 2012, and growth rates varied across services (0.1 percent for evaluation and management, 0.2 percent for major procedures, 0.4 percent for other procedures, −0.5 percent for tests, and –3.2 percent for imaging). Despite decreases after 2009, use of imaging services remained much higher than it was a decade ago.
Most measures of ambulatory care quality between the periods of 2009 to 2010 and 2011 to 2012 improved slightly or did not change, and a few worsened slightly. Input prices for physicians and other health professionals are projected to increase by 2.2 percent in 2015 (including a productivity adjustment).
t A B L e4–8 Medicare’s payment adjustments for incentive programs
Incentive program payment adjustment
Physician Quality Reporting System • 2012–2014: 0.5% bonus for participants• 2015: 1.5% penalty for nonparticipants• 2016 and after: 2% penalty for nonparticipants
Value-based payment modifier • 2015 and after: Groups (100 physicians or more) that do not satisfactorily report under the Physician Quality Reporting System receive a 1% penalty under the modifier; groups can elect cost and quality tiering.*
EHR Incentive Program • Through 2014: Up to $44,000 over five years is available per physician • 2015 and after: 1% penalty for physicians who do not satisfy the EHR criteria
eRx Incentive Program • 2014: 2% penalty for physicians who did not have a qualified electronic prescribing system
Note: EHR (electronic health record), eRx (electronic prescribing).
*Under the law, the value-based payment modifier must be expanded to cover all physicians by 2017.

113 Repo r t t o t h e Cong r e s s : Med i ca r e Paymen t P o l i c y | Ma r ch 2014
correct some of the undesirable incentives to increase volume without penalty in FFS and have the potential to reward providers who control costs and improve quality.
• RepealoftheSGRshouldbedoneinafiscallyresponsibleway.The Commission’s recommendations to the Congress aim to preserve or enhance beneficiary access to quality care while minimizing the financial burden on beneficiaries and taxpayers.
between primary care and specialty care must be corrected to ensure adequate beneficiary access to these services and to support the role of primary care in delivery system reform.
• Medicare’spaymentsystemsmustmoveawayfromunrestrainedFFSandtowardnewpaymentmodelsanddeliverysystems.New payment models, such as ACOs and bundled payment, offer an opportunity to
policies to address ongoing management of patients with chronic conditions and to support primary care
The ability of practitioners in Medicare fee-for-service (FFS) to increase volume more easily in procedural specialties has led to compensation
differentials between primary care practitioners and other specialties. It is the Commission’s perspective that a robust, well-supported primary care system is crucial to the type of delivery system reform that produces high-value, coordinated care. The Primary Care Incentive Payment Program (PCIP), designed largely in accordance with the Commission’s 2008 recommendation for a primary care bonus, pays a 10 percent bonus for certain services for physicians and other clinicians who specialize in delivering primary care and meet other criteria.
While FFS payment has typically focused on face-to-face activities, CMS has recently created FFS billing codes for some non–face-to-face activities—transitional care management and complex care management.
primary Care Incentive program
The PCIP, created in the Patient Protection and Affordable Care Act of 2010, establishes a 10 percent bonus for certain services to clinicians who have a primary Medicare specialty designation of family practice, internal medicine, pediatrics, geriatrics, nurse practitioner and clinical nurse specialist, and physician assistant—provided they meet a certain threshold for the share of visits that are in primary care. In 2012, Medicare made $664 million in payments under the PCIP. The payment adjustment is made automatically based on the provider’s specialty and claims history. Half of all payments were made to internal medicine physicians, around 40 percent to family physicians, and
10 percent to nurse practitioners and physician assistants (Centers for Medicare & Medicaid Services 2012d).
transitional care management codes
CMS established two new transitional care management billing codes in the 2013 physician and other health professionals fee schedule final rule. Starting January 1, 2013, the Medicare program pays for 30 days of transitional care provided to beneficiaries recently discharged from a hospital, skilled nursing facility, or other facility to a community setting. The two codes correspond to higher and lower intensity medical decision making. The payment is designed to cover activities required to provide comprehensive transitional care management as beneficiaries return home.14 Use of the new codes has been relatively low due to claims processing issues and because there is often a lag for clinicians to adopt new billing conventions. CMS has released new guidance for billing and has modified its payment processes to clarify when providers should bill for the service, which should increase the number of paid claims (Centers for Medicare & Medicaid Services 2013c).
Chronic care management codes
CMS, in its 2014 physician and other health professionals fee schedule final rule, stated that it plans to pay for a new set of care management codes that would cover a 30-day period of care-management activities for beneficiaries with two or more chronic conditions. Beneficiaries would elect which physician or other eligible practitioner would deliver the services (Centers for Medicare & Medicaid Services 2013b). CMS plans to pay for these codes starting in 2015 and establish practice standards through further rulemaking. ■

114 Phy s i c i a n and o t h e r h ea l t h p r o f e s s i o na l s e r v i c e s : A s s e s s i ng paymen t adequacy and upda t i ng paymen t s
Collect data to improve the relative valuation of services
In addition to a conversion factor, the physician and other health professionals fee schedule includes RVUs. These RVUs account for the amount of work required to provide each service, the expenses that practitioners incur related to maintaining a practice, and malpractice insurance costs. The Secretary lacks current, objective data needed to set the fee schedule’s RVUs for practitioner work and practice expenses. The Commission has recommended that the Secretary regularly collect data from a cohort of efficient practices—including service volume and work time—to establish more accurate work and practice expense values.
Identify overpriced services and rebalance payments
The Commission also previously recommended a change in the process for identifying overpriced services in the physician fee schedule. The Secretary could use the data collected through the prior recommendation to identify overpriced services and adjust the work and practice expense RVUs for these services. The Commission’s recommendation would also give the Secretary a numeric target for the amount of overpriced services to be adjusted.
encourage ACos by creating greater opportunities for shared savings
The Commission recommends that physicians and health professionals who join or lead two-sided risk ACOs should be afforded a greater opportunity for shared savings compared with those in bonus-only ACOs and those who do not join any ACO. The greater opportunity for shared savings would come through a performance standard that does not reflect lower updates.
These four recommendations constitute the Commission’s approach to moving forward from the SGR. ■
Based on these principles, the Commission made four distinct recommendations:
Repeal the sgR and replace it with a 10-year path of legislated updates with higher updates for primary care services than updates for other services
Under the Commission’s approach, the SGR would be repealed and a new set of statutory updates would be created for 10 years for physicians and other health professionals; the update would be different for clinicians who deliver primary care and clinicians who deliver other services. Specifically, fees for non–primary care services would be reduced by less than 3 percent in each of the first three years, followed by a freeze. Fees for primary care would be frozen for 10 years. Through these reductions and freezes, physicians and other health professionals would shoulder about one-third of the cost of repealing the SGR.
While such a sequence of legislated updates would establish a new budgetary baseline, it would not be immutable. Each year, the Commission will continue to review whether payments to physicians and other health professionals are adequate. If it is determined that a change in payment rates or a delay in a conversion factor adjustment is needed to ensure adequate access, the Commission would make such a recommendation to the Congress. The cost of a one-year delay or change in payment rates would be cheaper than the current practice of overriding the negative updates under the SGR. If necessary, it would be possible to vary the amounts of the primary care and non–primary care updates and to phase in a sequence of those updates at different rates.

115 Repo r t t o t h e Cong r e s s : Med i ca r e Paymen t P o l i c y | Ma r ch 2014
1 For further information, see the Commission’s Payment basics: Physician and other health professionals payment system at http://www.medpac.gov/documents/MedPAC_Payment_Basics_13_Physician.pdf.
2 ASPE notes that their results come from the 2011 data from the NAMCS Electronic Records Supplement and 2012 data from the NAMCS Electronic Health Records Survey, which are both conducted by mail.
3 CMS changed the policy on billing for consultations with the rationale that relaxing requirements for consultation documentation had, over time, brought the effort involved in consultations to levels appropriate for those of visits.
4 When a service is provided in a facility setting, Medicare makes a separate facility payment to account for its cost.
5 See Table 4-8 (p. 112) for further discussion.
6 In simple terms, simulated compensation was calculated in two steps. Step 1 was annual total RVUs for the services provided by a physician multiplied by the Medicare conversion factor. Step 2 was the result of Step 1 multiplied by a ratio that was the physician’s actual compensation divided by collections (revenues) from the physician’s professional services and collections from other sources attributable to the physician, such as laboratory services and injectable drugs.
7 The 2010 data predate payment of a 10 percent bonus for eligible primary care practitioners and general surgeons (general surgeons practicing in health professional shortage areas) started on January 1, 2011.
8 The 17 percent difference between simulated compensation and actual compensation does not mean that Medicare’s payments for physician services are 17 percent lower than private payers’ payments for those services. The
compensation estimates include compensation attributable to physician services and to services other than physician services, such as laboratory services and injectable drugs. In addition, the comparison is simulated Medicare compensation relative to actual compensation, where actual compensation includes not just private payers’ payments but also some Medicare payments.
9 The nonsurgical, procedural specialties in the analysis are cardiology, dermatology, gastroenterology, and pulmonary medicine.
10 The primary care specialties in the analysis are family medicine, internal medicine, and general pediatrics.
11 To account for differences among specialties in hours worked per week, the contractor’s earlier initial analysis for the Commission—with MGMA data for 2007—included comparisons of hourly compensation. The results were similar to those from the analysis of the 2010 data on annual compensation: hourly compensation for nonsurgical, procedural specialties and radiology was more than double the hourly compensation rate for primary care. Analysis of hourly compensation was not possible with the 2010 data because the newer MGMA survey did not include questions about hours worked.
12 The MEI measures the weighted average annual price change for various inputs used by physicians and other health professionals to provide services.
13 See, for example, the Commission’s letters to the Congress (October 2011 and April 2013), testimony to the Congress (February 2013 and May 2013), the March 2012 report to the Congress, and the March 2013 report to the Congress.
14 The transitional care management code requires one face-to-face visit (not paid separately) as well as the non–face-to-face time required to deliver the transitional care.
endnotes
116 Phy s i c i a n and o t h e r h ea l t h p r o f e s s i o na l s e r v i c e s : A s s e s s i ng paymen t adequacy and upda t i ng paymen t s
ABIM Foundation. 2012. Choosing wisely. http://choosingwisely.org.
Agency for Healthcare Research and Quality. 2013. MEPS topics: Access to health care. Quality of care tables. http://meps.ahrq.gov/mepsweb/data_stats/MEPS_topics.jsp?topicid=1Z-1.
American College of Cardiology. 2012. Findings from the ACC cardiovascular practice consensus. Washington, DC: ACC. http://www.nccacc.org/news/2012USCVPracticeCensusNorthCarolina.pdf.
American Medical Association. 2013. 2013 National Health Insurer Report Card. Washington, DC: AMA.
Andrus, B. W., and H. G. Welch. 2012. Medicare services provided by cardiologists in the United States: 1999–2008. Circulation Cardiovascular Quality and Outcomes 5, no. 1 (January 1): 31–36.
Berenson, R., S. Zuckerman, K. Stockley, et al. 2010. What if all physician services were paid under the Medicare fee schedule: An analysis using Medical Group Management Association data. A study conducted for the Medicare Payment Advisory Commission by staff from the Urban Institute and the Medical Group Management Association Center for Research. Washington, DC: MedPAC.
Bleyer, A., and H. G. Welch. 2012. Effect of three decades of screening mammography on breast-cancer incidence. New England Journal of Medicine 367, no. 21 (November 22): 1998–2005.
Boccuti, C., C. Swoope, A. Damico, et al. 2013. Medicare patients’ access to physicians: A synthesis of the evidence. Issue brief. Menlo Park, CA: The Kaiser Family Foundation.
Centers for Medicare & Medicaid Services, Department of Health and Human Services. 2013a. The characteristics and perceptions of the Medicare population: Data from the 2011 Medicare Current Beneficiary Survey. http://www.cms.gov/Research-Statistics-Data-and-Systems/Research/MCBS/Data-Tables-Items/2011CharAndPerc.html?DLPage=1&DLSortDir=descending.
Centers for Medicare & Medicaid Services, Department of Health and Human Services. 2013b. Frequently asked questions about billing Medicare for transitional care management services. http://www.cms.gov/Medicare/Medicare-Fee-for-Service-Payment/PhysicianFeeSched/Downloads/FAQ-TCMS.pdf.
Centers for Medicare & Medicaid Services, Department of Health and Human Services. 2013c. Revisions to payment policies under the physician fee schedule, clinical laboratory fee schedule and other revisions to Part B for CY 2014 (CMS–1600–FC). Final rule. Federal Register 78, no. 237 (December 10): 74230–74823.
Centers for Medicare & Medicaid Services, Department of Health and Human Services. 2012a. Market basket data: Medicare Economic Index. http://www.cms.gov/Research-Statistics-Data-and-Systems/Statistics-Trends-and-Reports/MedicareProgramRatesStats/MarketBasketData.html.
Centers for Medicare & Medicaid Services. 2012b. Medicare & Medicaid statistical supplement: 2012 edition. http://www.cms.gov/Research-Statistics-Data-and-Systems/Statistics-Trends-and-Reports/MedicareMedicaidStatSupp/2012.html.
Centers for Medicare & Medicaid Services, Department of Health and Human Services. 2012c. Medicare and Medicaid Research Review. 2012 statistical supplement. Baltimore, MD: CMS. http://www.cms.gov/Research-Statistics-Data-and-Systems/Statistics-Trends-and-Reports/MedicareMedicaidStatSupp/2012.html.
Centers for Medicare & Medicaid Services, Department of Health and Human Services. 2012d. Primary care incentive payment program (PCIP): Medicare PCIP payments for 2011 will exceed $560 million. Baltimore, MD: CMS. http://www.cms.gov/Medicare/Medicare-Fee-for-Service-Payment/PhysicianFeeSched/Downloads/PCIP-2011-Payments.pdf.
Elton, E. 2009. Changing the patterns of medical care. Letter to the editor. New York Times, June 20.
Hendel, R. C., M. Cerqueira, P. S. Douglas, et al. 2010. A multicenter assessment of the use of single-photon emission computed tomography myocardial perfusion imaging with appropriateness criteria. Journal of the American College of Cardiology 55, no. 2 (January 12): 156–162.
Hillman, B. J., and J. C. Goldsmith. 2010. The uncritical use of high-tech medical imaging. New England Journal of Medicine 363, no. 1 (July 1): 4–6.
Hoffman, J. R., and R. J. Cooper. 2012. Overdiagnosis of disease: A modern epidemic. Archives of Internal Medicine 172, no. 15 (August 13): 1123–1124.
Holohan, E. 2011. When docs own MRIs, back pain scans increase: Study. HealthDay, April 28.
Jha, S. 2013. From imaging gatekeeper to service provider—A transatlantic journey. New England Journal of Medicine 369, no. 1 (July 4): 5–7.
References

117 Repo r t t o t h e Cong r e s s : Med i ca r e Paymen t P o l i c y | Ma r ch 2014
Redberg, R., M. Katz, and D. Grady. 2011. Diagnostic tests: Another frontier for less is more: Or why talking to your patient is a safe and effective method of reassurance. Archives of Internal Medicine 171, no. 7 (April 11): 619.
Shartzer, A., R. Zuckerman, A. McDowell, et al. 2013. Access to physician services for Medicare beneficiaries. Issue brief. Washington, DC: Department of Health and Human Services, Office of the Assistant Secretary for Planning and Evaluation.
Welch, H. G., K. J. Hayes, and C. Frost. 2012. Repeat testing among Medicare beneficiaries. Archives of Internal Medicine 172, no. 22 (December 10): 1745–1751.
Yee, T., P. Cunningham, G. Jacobson, et al. 2012. Cost and access challenges: A comparison of experiences between uninsured and privately insured adults age 55 to 64 with seniors on Medicare. Issue brief. Menlo Park, CA: Kaiser Family Foundation.
Johnson, L. A. 2008. Health insurers limit advanced scans. USA Today, March 23.
Juahar, S. 2008. Many doctors, many tests, no rhyme or reason. New York Times, March 11.
Kolata, G. 2011. Law may do little to curb unnecessary care. New York Times, March 29.
Mafi, J. N., E. P. McCarthy, R. B. Davis, et al. 2013. Worsening trends in the management and treatment of back pain. Journal of the American Medical Association Internal Medicine 173, no. 17 (September 23): 1573–1581.
National Committee for Quality Assurance. 2013. Improving quality and patient experience: The state of health care quality 2013. Washington, DC: NCQA.
Palfrey, S. 2011. Daring to practice low-cost medicine in a high-tech era. New England Journal of Medicine 364, no. 11 (March 17): e21.

![[Product Monograph Template - Schedule D] · screening plasma donors for prior exposure to certain viruses, ... be reported by the physician or other health care professional to Saol](https://img.dokumen.tips/doc/110x75/5fbad37cb2ac555fa34709fa/product-monograph-template-schedule-d-screening-plasma-donors-for-prior-exposure.jpg)