Embed Size (px)
Citation preview

Morphodynamics of Fluid-Fluid Displacement in Three-DimensionalDeformable Granular Media
Marie-Julie Dalbe† and Ruben Juanes*
Massachusetts Institute of Technology, 77 Massachusetts Avenue, Cambridge, Massachusetts 02139, USA
(Received 23 August 2017; revised manuscript received 23 January 2018; published 26 February 2018)
We study experimentally the displacement of one fluid by another in a granular pack to uncoverrelationships between fluid invasion and medium deformation. We develop an experimental setup thatallows us to reconstruct the coupled invasion-deformation dynamics in 3D. We simultaneously characterizethe fluid invasion pattern and document a transition from fluid-fluid displacement in pores to the formationof conduits by grain motion. We rationalize the findings in terms of a simple poromechanics model thatindeed captures this transition as a result of the balance between viscous and frictional forces. These resultscontribute to elucidating the role of three dimensionality in the timing, mode, and morphology of fluid-fluiddisplacement and injection-induced deformation in porous media.
DOI: 10.1103/PhysRevApplied.9.024028
I. INTRODUCTION
Multiphase flow in porous media plays a fundamentalrole in many natural and engineered processes, includingenhanced oil recovery [1,2], geothermal energy production[3], geologic CO2 sequestration [4,5], water infiltration insoil [6,7], and water dropout in fuel cells [8], to name just afew. Of particular complexity and importance are processesthat involve the simultaneous displacement of fluids anddeformation of the host medium, with applications asvaried as shale-oil and shale-gas production via hydraulicfracturing [9,10], methane venting from organic-rich sedi-ments [11], hydrate formation and dissociation [12–14],volcanic eruptions [15], desiccation cracks in soil [16], airsparging for subsurface contaminant remediation [17,18],and patterning of carbon-nanotube forests [19].Studies investigating the morphology of the deformation
of granular packs from fluid injection have almost exclu-sively been conducted in quasi-2D experimental setups.For single-phase fluid flows, early experiments demon-strated a transition from viscous fingering to fracturing inclay slurries [20,21], and recent work has shown theemergence of inelastic deformation from the collectiverearrangement of a 2D monolayer of elastic frictionlesshydrogel particles [22]. Fracture patterns have also beenobserved in loose and dense systems such as particle raftsas a result of surfactant spreading [23,24], and colloidalsuspensions as a result of drying [25,26]. Two-phase flowexperiments of air injection into liquid-filled granular packshave elucidated a transition from Saffman-Taylor–type
fingering to fracturing as the packing ratio increases[27]. This type of fluid-fluid-particle displacement of agranular suspension can lead to a variety of fascinatinginvasion patterns, including labyrinth structures [28], coralmorphologies, and stick-slip bubbles [29].Of particular interest to us are systems at high packing
density which display a transition from pore-scale fingeringto hydrocapillary fracturing, as a result of the interplaybetween viscous and capillary forces and frictional forces[30–32]. This balance of forces at the pore scale permitsrationalizing observations in a wide range of systems,including gas injection into water-saturated granular packs[33–36] and clays [37], liquid imbibition into sand [38],desiccation cracks [39], CO2 migration in porous rocks[40], and methane venting from soft sediments [11,41,42].Three-dimensional visualizations of multiphase flow in
porous media under dynamic conditions have relied ondirect optical visualization [43], planar laser-fluorescenceimaging similar to that we employ here [44–47], confocalmicroscopy [48], magnetic resonance imaging [49], andhigh-energy x-ray computed tomography [50,51]. Whilethese 3D observations have been instrumental in characte-rizing fluid-fluid displacements—including temporallyresolved imaging of pore-scale invasion events [50,51]—they have been limited to small sampling volumes and torigid porous media that have left medium deformationunexplored.Here, we perform 3D imaging of two-phase flow in a
deformable porous medium, with an emphasis in under-standing the morphology and dynamics of fluid invasionand medium deformation. We construct a porous cell madeof borosilicate glass beads initially filled with glycerol toachieve refractive-index matching, and we inject a lessviscous silicon oil that is also index matched. We employ a
*[email protected]†Present address: Aix-Marseille Universite, 49 Rue Joliot
Curie, 13013 Marseille, France.
PHYSICAL REVIEW APPLIED 9, 024028 (2018)
2331-7019=18=9(2)=024028(14) 024028-1 © 2018 American Physical Society
planar laser-fluorescence imaging technique in which alaser sheet mounted on a moving stage shines on themedium and excites fluorescent dyes premixed with thedefending and invading fluids. To control the deformabilityof the medium, we apply a confining weight to the top lid ofthe cell. To elucidate the morphology of fluid invasionunder different confining weights, bead sizes, and injectionrates, we perform two different types of measurements andanalyses:(1) Macroscopic (cell scale), in which we track the
displacement of the top lid. We develop a coupledporomechanics model for the onset of frictionalfailure and the evolution of postfailure overall celldeformation, as a balance between fluid-fluid dis-placement and cavity expansion. Our model allowsus to identify the relevant poromechanical parame-ters for our model system across a wide range ofexperimental conditions.
(2) Microscopic (pore scale), in which time-lapse 3Dimaging allows us to reconstruct in detail themorphology of the invading fluid and the bead-packdisplacement. This analysis allows us to delineatethe experimental conditions under which fluid in-vasion into the granular pack is controlled by eitherpore-scale fingering or conduit opening.
II. LABORATORY EXPERIMENTS
A. Experimental setup
We built a porous-medium cell consisting of an acrylicbox (horizontal dimensions L × L). The box, initially openat the top, is filled with borosilicate glass beads (nominaldiameter, d), and a lid is placed at the top of the bead pack(initial height, H0). This lid is drilled with holes (holediameter, 1 mm), so as to allow uniform seepage of fluidthrough it while retaining the beads. A weight W is placedon top of the lid to control the confining stress that the beadpack is subject to. The cell has a hole drilled at the center ofthe bottom face to allow the injection of fluid. A needle(internal diameter, 1.7 mm) is glued to the inside of thishole, and fluids are injected using a syringe pump (PHD2000, Harvard Apparatus).Initially, we pour the beads inside the container and place
the lid on top, and then the confining weight. The dry beadpack is then filled with the initial defending fluid, glycerol,at a rate of 1 mlmin−1. Glycerol is wetting to the glassbeads with respect to air. Thus, injection of glycerol is aviscously stable, gravity-stable, slow imbibition that resultsin a complete displacement of air from the porous medium.The absence of air bubbles is checked optically. We stopinjection once the glycerol has reached the top of the lid.We then inject the invading liquid at a rate q.We employ cells of different dimensions (L ¼ f2; 6g cm,
H0 ¼ f2.5; 4.5g cm), beads of different diameters (d ¼f1; 3g mm), and a range of values for the other control
parameters (0.045 < W < 23.9 N, 0.03<q<100mlmin−1)to study fluid-fluid displacement under diverse experimentalconditions.
B. Imaging
We perform two types of experiments, according to thekind of imaging that is conducted: (1) direct imaging,and (2) planar laser-induced fluorescence (PLIF) imaging.In each type of experiment, we employ slightly differentfluids—with, therefore, slightly different properties, whichwe describe next.
1. Direct imaging
In this set of experiments, we image the porous cell fromone side using a digital CMOS camera (HamamatsuORCA-Flash4.0). The defending fluid, glycerol, has thesame refraction index as borosilicate glass (r ¼ 1.430),thereby rendering the porous medium transparent. Theinvading fluid is silicone oil (Sigma Aldrich), dyed with ablue dye (Orcosolve Oil Blue AP), and direct imagingrecords a 2D projection of the 3D fluid invasion pattern(Fig. 1). The properties of the fluids are given in Table I.
2. PLIF imaging
In a second set of experiments, we use the PLIFtechnique, which allows us to see through a transparentporous medium [44,46,47]. In this case, the invading fluidis also index matched to the borosilicate glass beads. Weuse a silicone oil that is a mix of two different products:60.9% Dow Corning 556 and 39.1% Dow Corning 550.The proportions are determined experimentally so that therefractive index of the mix is as close as possible to that ofthe beads.A laser sheet is used to illuminate a vertical plane of the
bead pack (Z-Laser ZM18, emitting at 532 nm). Both thedefending and invading liquids are dyed using differentfluorescent dyes that are excited by the wavelength ofthe laser. The defending fluid (glycerol) is seeded with
FIG. 1. Image taken by the camera during a direct-imagingexperiment in a cell with horizontal dimension L ¼ 6 cm andbeads of diameter d ¼ 3 mm. The dark pattern is the injectedsilicone oil.
MARIE-JULIE DALBE and RUBEN JUANES PHYS. REV. APPLIED 9, 024028 (2018)
024028-2

Rhodamine 590 Chloride (Exciton) at a concentration of0.12 mg l−1. The invading fluid (silicone oil) is seededwith Pyrromethene 567A (Exciton) at a concentration of2.7 mg l−1. The fluid properties are given in Table I. Thetwo dyes emit at a similar wavelength, around 560 nm. Weplace a long-pass filter, keeping light with a wavelengthlonger than 550 nm only, ensuring that the light emitteddirectly by the laser does not reach the camera. We usedifferent dye concentrations so that, in the illuminatedplane, we can distinguish the beads and the two fluids: thebeads appear black, the defending fluid gray, and theinvading fluid white. The laser and the camera are mountedon a motorized stage to scan the entire porous cell andobtain a 3D reconstruction of the dynamics of invasion(Fig. 2). Images are taken at 1024 × 1024 pixels, giving aresolution of 80–100 μm/pixel. The maximum width of thelaser sheet is 0.3 mm, which is well below one beaddiameter. Thus, individual pore volumes are lit during agiven scan, and we believe that the measurements wouldnot be different if the laser sheet width were smaller. Thefrequency of images is such that the separation between
planes is 0.5 mm for the large cell (L ¼ 6 cm) and 0.2 mmfor the small cell (L ¼ 2 cm). The time lapse between3D-imaging cycles of the cell is 4.0 s for the large cell, and4.5 s for the small cell.
C. Wetting properties
We employ borosilicate glass beads (Corning 7268from Sigma Aldrich for the 3-mm beads, CG-1101 fromChemglass for the 1-mm beads), which we reuse from oneexperiment to the next. We ensure reproducibility of thewetting properties of the beads by following a six-stepcleaning process before each experiment: (1) wash withacetone to remove most of the silicone oil; (2) wash withisopropanol to dilute the glycerol, let soak overnight;(3) wash with a solvent remover, soap, and water; (4) letdry on a hot plate at 75 °C for 12 h; (5) wash with a piranhasolution (mix of 75% hydrogen peroxide and 25% sulfuricacid); and (6) let dry in the oven at 75 °C for 24 h.Following this cleaning procedure, the beads are exposed toa handheld plasma for 10 min or to an ozone cleaner inorder to alter their wetting properties.We measure the contact angle between the two fluids
directly on the glass beads using a goniometer (rame hart,Model 590). The contact angle is the same, within themeasurement uncertainty, for the two pairs of fluids(glycerol–silicone oil and glycerol–Dow Corning mixes).Experimentally, we immerse a glass bead into silicone oil,deposit a droplet of glycerol on top of it, and then measurethe static contact angle. The contact angle through thedense glycerol phase is θ ¼ 35� 8° (Fig. 3).Therefore, our fluid-fluid displacement experiments are
in the drainage, unfavorable-mobility regime: a less wetting,
FIG. 2. Schematic of the experimental setup for PLIF imaging.The cubic cell is filled with borosilicate glass beads. We firstinject glycerol, which is the defending fluid. Then we inject a mixof Dow Corning silicone oil at a constant injection rate q with asyringe pump. We shine a laser sheet through the cell that excitesthe defending and invading fluids, and we image using a camerafiltering out the light emitted directly by the laser. The beadsappear black, the defending fluid gray, and the invading fluidwhite. The laser and the camera are mounted on a motorizedstage, which allows scanning of the entire cell.
FIG. 3. Image from the goniometer during measurement of thecontact angle. We deposit a droplet of glycerol (dark gray) on aglass bead immersed in silicone oil.
TABLE I. Fluid properties for both types of experiments: density ρ, dynamic viscosity η, viscosity contrastM, and interfacial tension γ.
Direct imaging PLIF imaging
Defending Glycerol ρd ¼ 1260 kgm−3 Glycerol with ρd ¼ 1260 kgm−3fluid ηd ¼ 1410 mPa s Rhodamine 590 Chloride ηd ¼ 1410 mPa s
Invading Silicon oil with ρi ¼ 960 kgm−3 Dow Corning mix with ρi ¼ 1013 kgm−3fluid Orcosolve Blue ηi ¼ 48 mPa s Pyrromethene 567A ηi ¼ 53 mPa s
Fluid-pair M ¼ 29 M ¼ 27interaction γ ¼ 26 mNm−1 γ ¼ 19 mNm−1
MORPHODYNAMICS OF FLUID-FLUID DISPLACEMENT IN … PHYS. REV. APPLIED 9, 024028 (2018)
024028-3

less viscous fluid (oil) displacing a more wetting, moreviscous fluid (glycerol).
D. Bead-pack properties
We determine the flow properties of the glass-bead pack:porosity and permeability. We determine porosity byweighting the cell before and after filling it with glycerol,a fluid of known density. The porosity determined in thisway is ϕ0 ¼ 0.48� 0.02 for both bead diameters used(d ¼ 1 and 3 mm).We measure the intrinsic permeability k0 of the bead
pack using the constant-head method [52]. We use arectangular cell with a sieve at the bottom so that thebeads stay in the cell, while the liquid can escape. We use asyringe pump to keep the level of liquid at the top of the cellconstant. The cell is put inside a container with a fixed levelof liquid, which can overflow in a larger container, and wemeasure the rate of liquid overflowing.For the 3-mm beads, the liquid used is glycerol. We
measure k0/η¼ 9.5�0.2×10⁻⁹ mskg−1. Taking the dyna-mic viscosity η ¼ 1.41 Pa s, we obtain k0¼1.3×10⁻⁸m2.For the 1-mm beads, the liquid used is a mixture of waterand glycerol of viscosity η ¼ 0.143 Pa s, and we mea-sure k0 ¼ 1.3 × 10⁻⁹ m2.We can compare this value with the one given by the
Kozeny-Carman equation [52]:
kKC ¼ d2
180
ϕ30
ð1 − ϕ0Þ2; ð1Þ
which gives kKC ¼ 2.0 × 10⁻⁸ m2 for d ¼ 3 mm, andkKC ¼ 2.3 × 10⁻⁹ m2 for d ¼ 1 mm—a discrepancy ofabout 40% with respect to the experimental values thatcan easily be attributed to the lack of monodispersity of thegranular pack.
III. POROMECHANICS MODEL
Fluid injection into the fluid-filled granular cell pressur-izes the fluid in the cell, which has two main effects:(1) fluid invasion and displacement of the immiscibledefending fluid, and (2) deformation of the granular pack.These two effects are interdependent, and this coupling isgenerally known as poromechanics [53–56].Here, we develop a simplified poromechanics model
that will allow us to rationalize the behavior observed inthe experiments, which is reported on in Sec. IV. In simpleterms, the behavior is as follows: the granular packexperiences small deformations initially, behaving elasti-cally, up to a point at which a cavity near the injectionport forms, displacing the grains and opening a conduitthat is observable macroscopically. Fundamentally, we areinterested in characterizing and predicting the onset offluid-driven granular failure, and the macroscopic evolutionof deformation after failure.
In what follows, we develop this model, staging thedevelopment into prefailure, the onset of failure, andpostfailure.
A. Poroelastic model before frictional failure
Before the granular pack experiences large irreversibledeformations, the evolution of pore pressure and skeletondeformation can be described by the field theory of poro-elasticity in small deformations [53–56]. The equation forthe evolution of pore pressure p takes the form
�b2
Kdþ 1
M
� ∂p∂t þ
bKd
∂σV∂t þ ∇ · v ¼ 0; ð2Þ
where Kd is the dry bulk modulus, b is the Biot coefficient,M is the Biot modulus, σV is the volumetric stress, and v isthe seepage velocity of the fluid with respect to the solid.For incompressible fluids and grains (that is, when all thedeformation can be attributed to grain rearrangement),M → ∞ and b → 1, and we can define the piezometrichead as h ¼ p/ðρfgÞ, where ρf is the fluid density and g isthe gravitational acceleration.If we assume constant load conditions, σV ≈ const and,
using Darcy’s law for the seepage velocity,
v ¼ −K∇h; ð3Þ
where K ¼ kρfg/ηf is the hydraulic conductivity. Definingthe hydraulic diffusivity, D ¼ ðk/ηÞKd ¼ K/ðρfgÞKd, theporoelastic pressure equation reduces to
∂h∂t −D∇2h ¼ 0; ð4Þ
which, under these assumptions, is decoupled from thelinear momentum balance governing medium deformation.This canonical diffusion equation has been solved under
many different geometries and boundary conditions (see,e.g., Refs. [55,57,58]). Here, we put forward a simplifiedconfiguration that reasonably represents the flow in ourporous cell.Given the point injection, the cubiclike dimensions of
the cell, and the uniform seepage through the top boundary,we assimilate the physical problem to a pressure-diffusionproblem on a hollow half sphere (outer radius R and innerradius a) under radial symmetry, with a prescribed flow rateq at the inner boundary, and a constant piezometric headequal to the initial piezometric head (taken as a reference,h ¼ 0) at the outer boundary. We have confirmed, via 3Dfinite-element simulations of Eq. (4) with the appropriateboundary conditions, that the behavior of the solutions inthe actual box geometry and the half-sphere geometry arevery close to each other (within 5% for radial distancesr < 10 mm), thereby justifying the adoption of the half-sphere geometry as a valid approximation for our purposes.
MARIE-JULIE DALBE and RUBEN JUANES PHYS. REV. APPLIED 9, 024028 (2018)
024028-4

Mathematically, the initial and boundary value problem(IBVP) takes the form
∂h∂t ¼
1
r2∂∂r
�Dr2
∂h∂r
�; a < r < R; t > 0; ð5Þ
hðr; 0Þ ¼ 0; a < r < R; ð6Þ
hðR; tÞ ¼ 0; t > 0; ð7Þ
4πa2K∂h∂r
����r¼a
¼ −2q; t > 0: ð8Þ
The solution to this IBVP can be obtained via the changeof variable u ≔ hr and using the method of separation ofvariables [59]:
hðr; tÞ ¼ 2q4πK
1
r·
��1 −
rR
�− 2
X∞n¼1
1
1þ R−aa ð1þ a2λ2nÞ
×sin½λnðR − rÞ�sin½λnðR − aÞ� expð−Dλ2ntÞ
�; ð9Þ
where the eigenvalues λn satisfy the nonlinear equation
tan½λnðR − aÞ� þ aλn ¼ 0; n ¼ 1; 2;…: ð10Þ
For illustration, we plot the solution as a function ofradial distance r at different times for parameters corre-sponding to the large cell (R ¼ 4.5 cm) filled with the largebeads (d ¼ 3 mm) and an effective dry bulk modulusKd ¼ 10 kPa. The solution hðr; tÞ exhibits a fast transientreaching steady state within approximately 10 s (Fig. 4, toppanel). By plotting the time derivative hðr; tÞ, we observe apressure pulse that propagates from the injection point(r ¼ a) outwards (Fig. 4, bottom panel).
B. Onset of frictional failure
We estimate, based on simple considerations of frictionalfailure, the critical value of the piezometric head change,hf, that will lead to particle rearrangement within thegranular pack. We assume that the initial stress state of thegranular pack is controlled by the confining weight on topof the lid, the weight of the beads and the interstitial fluid,and the lateral confinement provided by the vertical wallsof the cubic pack. Thus, the total vertical stress is geostatic,σv ¼ ðW/L2Þ þ ρbgz, the pore pressure is hydrostatic,p ¼ ρfgz, and, therefore, the vertical and horizontal effec-tive stresses at the bottom of the cell are
σ0v ¼WL2
þ ρ0gH0; ð11Þ
σ0h ¼ K0σ0v; ð12Þ
where ρ0 ¼ ρb − ρf is the buoyant density, and K0 is thecoefficient of lateral stress at rest.We employ the Mohr-Coulomb failure criterion for
cohesionless granular materials:
τ ¼ μfσ0n; ð13Þ
where τ is the shear stress, σ0n is the normal effective stress,and μf is the coefficient of friction. Using the commonMohr-circle interpretation, failure is attained once thepressure is increased sufficiently to move the Mohr circleagainst the failure line (Fig. 5). From simple geometry andemploying Eqs. (11) and (12), we obtain the criticalpressure increase,
δpf¼1
2
�WL2
þρ0gH0
��ð1þK0Þ−
1−K0
sinðtan−1μfÞ�: ð14Þ
Defining the frictional parameter
αf ≔ ð1þ K0Þ −1 − K0
sinðtan−1 μfÞ; ð15Þ
and expressing in terms of a piezometric head increment,hf ¼ δpf/ðρfgÞ, we arrive at the expression
hf ¼1
2
WL2 þ ρ0gH0
ρfgαf: ð16Þ
In this simplified analysis, we conclude that failureleading to a conduit opening will take place if the
0 0.01 0.02 0.03 0.04 0.0510
−15
10−10
10−5
100
0 0.01 0.02 0.03 0.04 0.050
1
2
×10−4
−
FIG. 4. Behavior of the solution [Eq. (9)] to the poroelasticdiffusion IBVP [Eqs. (5)–(8)]. (Top panel) Piezometric headhðr; tÞ. (Bottom panel) Time derivative hðr; tÞ. See the text fordetails on the parameters used.
MORPHODYNAMICS OF FLUID-FLUID DISPLACEMENT IN … PHYS. REV. APPLIED 9, 024028 (2018)
024028-5

piezometric head increase at steady state predicted by theporoelastic model at a distance r a few bead diameters awayfrom the injection point,
hssðrÞ≡ hðr; t → ∞Þ ¼ 2q4πK
1
r
�1 −
rR
�; ð17Þ
is greater than the threshold failure head, hf. Given that thiscondition is satisfied, we estimate the time of failure as thetime at which hðr; tfÞ ¼ hf. Combining Eqs. (9) and (16),we arrive at the nonlinear equation for the time of failure, tf:
X∞n¼1
1
1þ R−aa ð1þ a2λ2nÞ
sin½λnðR − rÞ�sin½λnðR − aÞ� expð−Dλ2ntfÞ
¼�1 −
rR
�−
r2q/ð4πKÞ hf: ð18Þ
C. Cavity or conduit opening after frictional failure
Once the failure condition has been reached, the granularpack ismobilized. Thismobilization leads to the opening of aconduit near the inlet and macroscopic deformation of theskeleton—an effect that results in displacement of the top lidto accommodate this deformation.Given that the constituents of the porous pack (beads and
fluids) are assumed to be incompressible, fluid massconservation integrated over the entire cell dictates that
qðtÞ ¼ qoutðtÞ þ L2H; ð19Þ
where qout is the flow rate out of the cell by seepage throughthe porous top lid, and H is the top-lid displacementvelocity. The occurrence of seepage and lid displacementposes the simple question of what the balance is betweenthe two terms on the right-hand side of Eq. (19): (1) ifq ≈ qout, fluid invasion takes place by fluid displacement
without cavity expansion, and (2) if q ≈ L2H, fluidinvasion is accommodated exclusively by cavity expansion.Therefore, Eq. (19) implicitly reflects a balance betweenviscous resistance and frictional resistance.Given the fast transient of the poroelastic solution hðr; tÞ
towards steady state (Fig. 4) and that r is close to theinjection port, we assume that the piezometric head is givenby the steady-state solution, hssðrÞ, but limited to hf, i.e.,
hf ¼ hssðrÞ ¼ hðr; t → ∞Þ ¼ 2qout4πK
1
r
�1 −
rR
�: ð20Þ
From Eqs. (19) and (20), we obtain a nonlinear equationinvolving the displacement rate H:
1
L2
�q −
2πKr1 − r/R
hf
�¼ H; ð21Þ
where hf is dependent onW and the frictional parameter αfthrough Eq. (16).Qualitatively, the balance between viscous resistance and
frictional resistance can be expressed as a frictional failurenumber, Nf, defined as the ratio of the piezometric headincrease from the poroelastic solution hss [Eq. (17)] to thepiezometric head increase for frictional failure hf [Eq. (16)]:
Nf ≔hsshf
: ð22Þ
If Nf ≪ 1, friction is dominant and there is no deformation.This situation is favored for a low injection rate (q↓), a highmedium permeability (k ↑), a low fluid viscosity (η↓), anda high confining weight (W ↑). If Nf ≫ 1, the opposite istrue: a viscous pressure drop is dominant, causing cavityexpansion.
IV. RESULTS: MACROSCOPIC DEFORMATION
A. Evolution of lid position
The macroscopic deformation of the granular pack isreflected in the displacement of the top lid, HðtÞ −H0. Theevolution of this quantity for a typical experiment showsthat the displacement is negligible for a short period oftime, and it then increases at an approximately constant rate(Fig. 6). Such behavior is congruent with our poroelasticCoulomb-failure model, in which there is an induction timein which pressure increases due to injection in a small-deformation configuration, and a frictional-sliding stage inwhich (constant-rate) injection leads to (constant-rate)displacement of the top lid.
B. Model fit to failure onset and cavity expansion
We now probe whether the conceptual and mathematicalmodel of poroelastic evolution followed by frictional fail-ure and conduit opening is a valid representation of the
FIG. 5. Mohr-circle interpretation of the Mohr-Coulomb failurecriterion [Eq. (13)]. Because the diagram is expressed in terms ofeffective stresses, σ0n ¼ σn − pf, an increase in fluid pressure(δpf > 0) results in a decrease in the effective normal stress σ0n,shifting the Mohr circle to the left, towards the Mohr-Coulombfailure line.
MARIE-JULIE DALBE and RUBEN JUANES PHYS. REV. APPLIED 9, 024028 (2018)
024028-6

fluid-fluid displacement in a deformable granular packobserved in the experiments. To perform this interrogationof the data from the lens of the model, we identify theparameters that are common to all experiments and known
(ρf, ηf, ρ0, g, γ), the parameters that are experiment specificand also known (H0, d, k,W, q), and the parameters that areexperiment specific and unknown: the frictional parameterαf, the effective radius of granular failure r, and theeffective dry bulk modulus Kd.To constrain these three parameters, we utilize the
experimental data of lid position as a function of timebinarized into two quantities for each experiment: thefailure time tf and the lid displacement rate H. We performa least-squares minimization of the parameters of the modelin terms of these two quantities using Eqs. (18) and (21).Because of the scatter in the experimental measurements,
it proves to be useful to perform this least-squares mini-mization in two steps. The first is the identification ofranges of joint pair values ðr; αfÞ that best match themeasurements of H. This global minimization leads to aPareto curve in ðr; αfÞ space for all three experimentalsets (Fig. 7).Identification of Kd from minimization of the model and
the tf data [Eq. (18)], however, turns out to be challenging—likely because of the inherent uncertainty in the identi-fication of the failure time, which results in a large rangeof possible values of the effective dry bulk modulus.This additional data set does allow us, however, to provide
0 5 10 15 20 25 30 350
1
2
3
4
FIG. 6. Displacement of the top lid of the cell as a function oftime, HðtÞ −H0. The solid line represents the experimental data,whereas the dashed line is a linear fit. The data correspond to anexperiment with L ¼ 6 cm, d ¼ 1 mm, W ¼ 18.83 N, H0 ¼51 mm and q ¼ 45 mlmin−1.
5 10 15 20 25 30
0.5
1
1.5
2
2.5
310−9
0.4
0.6
0.8
1
1.2
1.4
1.6
1.8
2
2 4 6 8 10
0.5
1
1.5
210−11
5
6
7
8
9
10
5 10 15 20 25
0.5
1
1.5
2
2.5
310−9
1
1.5
2
2.5
3
3.5
4
4.5
MSEMSEMSE
(a) (b) (c)
FIG. 7. Mean squared error (MSE) for H in ðr; αfÞ space, illustrating that there is a Pareto curve that minimizes the MSE. Shown arethe three sets of experimental data: (a) L ¼ 6 cm, d ¼ 1 mm; (b) L ¼ 2 cm, d ¼ 1 mm; and (c) L ¼ 6 cm, d ¼ 3 mm.
104
50
100
150
200
250
300
104
0.5
1
1.5
2
6
6.5
7
7.5
8
8.5
9
9.5
10
104
0.5
1
1.5
2
1
1.5
2
2.5
3
3.5
4
4.5
5
drydrydry
MSEMSEMSE
(a) (b) (c)
1 2 3 4 1 2 3 4 1 2 3 4
0.5
1
1.5
2
FIG. 8. Mean squared error for tf in ðKd; αfÞ space, where the relationship αf ¼ αoptf ðrÞ from the Pareto curve in Fig. 7 is alreadyincorporated. The plots illustrate thatKd is not well constrained by the data. Shown are the three sets of experimental data: (a) L ¼ 6 cm,d ¼ 1 mm; (b) L ¼ 2 cm, d ¼ 1 mm; and (c) L ¼ 6 cm, d ¼ 3 mm.
MORPHODYNAMICS OF FLUID-FLUID DISPLACEMENT IN … PHYS. REV. APPLIED 9, 024028 (2018)
024028-7

additional constraints on the frictional parameter αf(Fig. 8).We interpret the results of the parameter fitting as
follows:(1) The frictional parameter αf is a measure of the
frictional resistance of the pack. It is, in principle, a
material parameter dependent on the friction coeffi-cient μf and the coefficient of lateral stress at rest K0,and typical values for these two coefficients wouldrender αf ∈ ½0; 1�. For experiment series 2 and 3(L/d ≈ 20), the experimental data further suggest thata value of αf ≈ 0.5 provides the best fit—a value that
0 0.1 0.2 0.3 0.40
0.1
0.2
0.3
0.4
0 0.1 0.2 0.3 0.40
0.1
0.2
0.3
0.4
0 0.1 0.2 0.3 0.40
0.1
0.2
0.3
0.4
exp
exp
exp
− − −
−−−
(a) (b) (c)
FIG. 9. Model fit for lid displacement rate H [Eq. (21)]. The red solid line indicates the 1∶1 line denoting the perfect match betweentheory and experiment. Shown are the three sets of experimental data: (a) L ¼ 6 cm, d ¼ 1 mm; (b) L ¼ 2 cm, d ¼ 1 mm; and(c) L ¼ 6 cm, d ¼ 3 mm.
0 0.5 1 1.5 2 2.50
0.5
1
1.5
2
2.5
0 1 2 3 4 5 60
1
2
3
4
5
6
0 2 4 60
1
2
3
4
5
6
7
(a) (b) (c)
FIG. 10. Model fit for time of failure tf [Eq. (18)]. The red solid line indicates the 1∶1 line denoting the perfect match between theoryand experiment. Shown are the three sets of experimental data: (a) L ¼ 6 cm, d ¼ 1 mm; (b) L ¼ 2 cm, d ¼ 1 mm; and (c) L ¼ 6 cm,d ¼ 3 mm.
10−60 0.5 1 1.5
10−4
0
1
2
3
4
10−70 0.2 0.4 0.6 0.8 1 1.2
10−4
0
1
2
3
10−60 0.5 1 1.5
10−4
0
0.5
1
1.5
2
2.5
3
3.5
−−−
−−−
(a) (b) (c)
FIG. 11. Model prediction and experimental data for lid displacement rate H as a function of injection rate q [Eq. (21)]. Differentsymbols represent different confining weights W. Shown are the three sets of experimental data: (a) L ¼ 6 cm, d ¼ 1 mm;(b) L ¼ 2 cm, d ¼ 1 mm; and (c) L ¼ 6 cm, d ¼ 3 mm.
MARIE-JULIE DALBE and RUBEN JUANES PHYS. REV. APPLIED 9, 024028 (2018)
024028-8
comes naturally from taking μf ≈ 0.6 and K0 ≈ 0.5.For experiment series 1 (L/d ≈ 60), the best fit occursfor a higher value, αf ≈ 1.
(2) The effective failure distance r is on the order of5–10 mm, or a few bead diameters, as would beexpected from breaking the arches of force chainsaround the injection point.
(3) The effective dry bulk modulusKd remains relativelyunconstrained by the data, but is on the order of 5–20 kPa, with values on the low end of this range forexperiment series 2 and 3—with a lower L/d valueand likely looser packing due to wall effects—and onthe high end of the range for experiment series 1.
The results of the model fit against the experimentalvalues of H and tf are shown in Figs. 9 and 10,respectively. It is apparent that, while the frictional-slidingmodel explains postfailure deformation (H) nicely, theonset of failure (tf) in these granular systems is plaguedwith scatter, making its prediction challenging. Overall,however, the model offers a good parsimonious explan-ation—over a wide range of experimental conditions—ofthe pressurization, frictional failure, and conduit openingas a result of fluid-fluid displacement in our granularsystem (Fig. 11).
V. RESULTS: PATTERNS OF FLUID INVASIONAND MEDIUM DEFORMATION
To gain insight into the details of fluid-fluid displace-ment and the morphodynamics of deformation, we resortto 3D dynamic imaging of the granular pack at the subporescale, using the PLIF imaging technique described inSec. II B.
A. Fluid invasion pattern
We first confirm that we can reconstruct the 3Ddynamic fluid invasion pattern with fidelity. The processof 3D reconstruction involves thresholding the images,with a depth-dependent threshold that accounts for theinevitable finite transparency of the beads and fluids—images on a plane farther from the camera are less bright
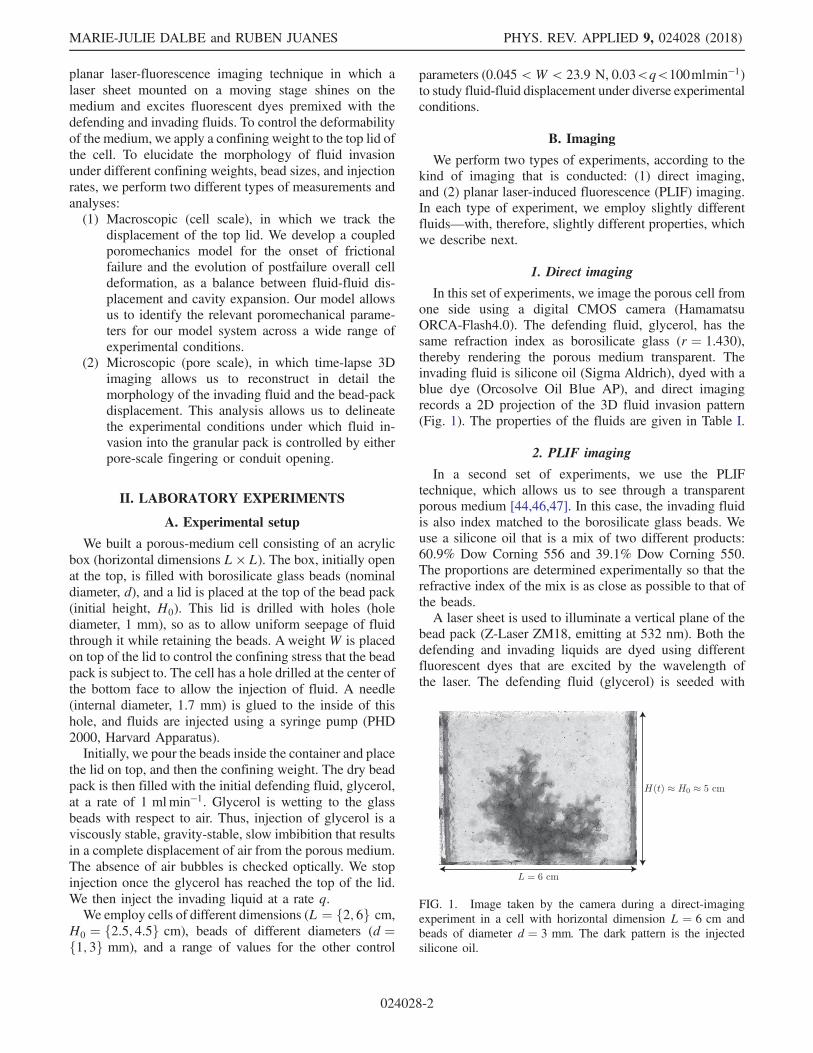
than those on a plane closer to the camera. Because ofthe sharp contrast between the invading fluid and thedefending fluid and beads, the thresholding employed forbinarizing the images is straightforward to select and doesnot have a significant impact on the results. The otherinevitable artifact in the 3D dynamic imaging is the finitetime that it takes to perform a scan (in our case, on theorder of 1.2 s), and we assume that the invasion patterndoes not change much during that period of time. Usingthe thresholded images pertaining to one full scan, wereconstruct the 3D pattern for each experiment [seeFig. 12(b) for a typical example].To check the validity of our image analysis, we compute
the volume of fluid injected V inj by counting the voxelsinside the injected pattern, and we compare this volumewith the known injected volume from the pump, q[Fig. 12(a)]. The good agreement between the twovolumes gives us confidence that the reconstructedfluid invasion is well captured by the 3D dynamicimaging. For example, for experiments with an injectionrate q < 40 mlmin−1, the front advances less than onebead diameter during a scan, and the assumption that thepattern does not change during one scan is valid for allpractical purposes.
B. Fractal dimension
The fractal dimension of a pattern has been employedwidely to categorize dynamic processes into “universalityclasses” [60–64]. Most analyses of fractal dimension influid-fluid displacements in porous media have beenrestricted to 2D problems (see, e.g., Refs. [65–80]).Determination of the fractal dimension in 3D displace-ments has been hindered either by direct imaging, whichpermits only a 2D projection of the invading pattern [43],or by limited spatial and temporal resolution of the 3Dscans [45]. Recent studies using PLIF imaging [46,47],confocal microscopy [48], or high-energy x-ray imaging[50,51] resolve the displacements at the pore level, but theimaged volume is insufficient to ascertain the macroscopicpattern and the fractal dimension.
0 5 10 15 20 25 300
1
2
3
4(a)
(b)
FIG. 12. Fluid invasion pattern. (a) Injectedvolume as a function of time. The blue solidline represents the volume reconstructedfrom 3D dynamic imaging; the red dashedline is a fit with an imposed slope equal to theinjection rate q. (b) Reconstructed 3D injec-tion pattern at t ¼ 16.2 s. The base of thecube is of size L ¼ 6 cm. Experiment withq ¼ 10 mlmin−1, d ¼ 3 mm, and W ¼1.47 N.
MORPHODYNAMICS OF FLUID-FLUID DISPLACEMENT IN … PHYS. REV. APPLIED 9, 024028 (2018)
024028-9

We determine the fractal dimension from the sequenceof 3D images in our experiments. For a given experimentand at a given time t, we compute the volume Vs ofinjected fluid inside a semisphere centered at the injectionport and of radius rs. By plotting Vs (rescaled by thecharacteristic volume Vp of a single pore) as a function ofrs (rescaled by the nominal bead diameter d), we obtaincurves that display a power-law behavior that extendswith time, up to the point when the morphology of theinvading pattern starts to be affected by the cell bounda-ries [Fig. 13(a)]. We determine the fractal dimension Df
of the invading pattern to be the slope of that power law,and we obtain the results shown in Fig. 13(b). Theexperimental data exhibit such sufficient scatter that itis difficult to observe clear trends of Df as a function ofthe two control variables (injection rate q and confiningweight W) for the range probed experimentally. Weinterpret this behavior as being the result of (1) largevariability among experiments due to the relatively smallvolume available for sampling, and (2) the fluid-fluiddisplacement is affected by fingering, regardless of thepresence or absence of deformation of the granular pack.For intermediate times within each experiment, we can
evaluate the capillary number directly as Ca ¼ ηdefvfront/γ.For our experiments, this calculation results in values in therange Ca ∈ ½0.03; 1�, for which we expect viscous-domi-nated displacements. In this sense, the values of fractaldimension that we measure (Df ∼ 2.5) are consistent withthe values expected from viscous fingering [43].
C. Pore opening and conduit pattern
To confirm this hypothesis, we image simultaneouslyand in high resolution the invasion of the injected fluid andthe deformation of the granular pack. First, we determinethe position of the individual beads before the beginning of
the injection of the invading fluid (Fig. 14). The bead-packstructure can be resolved throughout the experiment. Atany given time tn, the pattern of the injected fluid is entirelywithin the pore volume. At the time of the next scan, tnþ1,the injected pattern constitutes a larger volume, and afraction of that volume may consist of regions where beadsare displaced: we denote that volume of displaced solidbetween scans as the “conduit volume.”In Fig. 15, we show 3D renderings of the injection
pattern (in white) and the conduit volume (in red) forexperiments corresponding to L ¼ 6 cm, d ¼ 3 mm, andW ¼ 1.47 N, and differing injection rates q. It is apparentthat, as the injection rate increases, the amount of beaddisplacement also increases, from virtually no bead dis-placement at the lowest value of q [Fig. 15(a)] to a conduitvolume fraction of about 45% for q ¼ 40 mlmin−1[Fig. 15(f)]. The numeric values of this trend betweenthe conduit volume fraction and the injection rate are shownin Fig. 16.
FIG. 14. Position of the glass beads at the beginning of fluidinjection. Experiment with L ¼ 6 cm and d ¼ 3 mm.
100 101101
102
103
0 10 20 30 40 50 60 702
2.2
2.4
2.6
2.8
3
3.2
3.4
−
(a) (b)
FIG. 13. Fractal dimension. (a) Vs/Vp as a function of rs/d, where Vs is the volume of the injected liquid inside a half sphere of radiusrs centered at the injection point. Vp is the characteristic volume of a single pore, and d is the nominal bead diameter. The differentcolors correspond to scans at different times t. The solid line represents a linear fit for rs < 18 mm, which we consider to be unaffectedby boundary effects and has, in this case, a slope of 2.50. The plot corresponds to an experiment with d ¼ 3 mm, L ¼ 6 cm,W ¼ 1.47 N, and q ¼ 36 mlmin−1. (b) Fractal dimension Df estimated for different experiments with a differing injection rate q andconfining weight W, with L ¼ 6 cm and d ¼ 3 mm.
MARIE-JULIE DALBE and RUBEN JUANES PHYS. REV. APPLIED 9, 024028 (2018)
024028-10

This direct pore-scale observation is consistent with themacroscopic measurements of lid displacement, and it iscompatible with our model of frictional failure.
VI. CONCLUSIONS
In this work, we elucidate the role of grain displacement inthe evolution of injection patterns in granular media by
means of direct 3D observations of the dynamic process atthe pore scale. We reconcile observations of fluid invasionmorphology with the underlying pore-scale physics.We findthat the onset and evolution ofmacroscopic displacement canbe captured with a simple model of frictional failure.Our results open the door to a better understanding,
quantification, and eventual prediction of processes inwhich the poromechanics of multiphase mixtures playsa central role, such as soil desiccation [16,39], magmadegassing [15], methane venting from sediments [11,14,42], and hydraulic fracturing of hydrocarbon formations[81]. Our 3D PLIF experimental setup is also allowing usto study other multiphase porous-media processes such asbuoyancy-driven fingering, an instability that controlsrainwater infiltration in soils (see, e.g., Refs. [6,7,82])and hydrocarbon migration in sedimentary basins (see,e.g., Refs. [49,75,83]).We plan to extend our investigation in a number of
directions. For example, we are currently exploring waysto alter the wettability of the system [84–88] to investigatethe impact of wettability on the emergence and morphol-ogy of conduits—the technical challenge being to main-tain index matching among the two fluids and the beads.We are also conducting experiments where we measurethe injection pressure to discern whether the pressuresignature associated with pore-invasion events (see,e.g., Refs. [73,89–92]) is different from that of conduitopening.
FIG. 15. Injection pattern (in white) superimposed on the conduit volume (in red) near the time of breakthrough for experiments withL ¼ 6 cm, d ¼ 3 mm, and W ¼ 1.47 N. (a) q ¼ 2 mlmin−1 at t ¼ 108 s and V ¼ 2.1 ml. (b) q ¼ 5 mlmin−1 at t ¼ 61 s andV ¼ 4.7 ml. (c) q ¼ 10 mlmin−1 at t ¼ 29 s and V ¼ 4.7 ml. (d) q ¼ 20 mlmin−1 at t ¼ 12.8 s and V ¼ 3.8 ml. (e) q ¼ 27 mlmin−1at t ¼ 9.6 s and V ¼ 3.6 ml. (f) q ¼ 36 mlmin−1 at t ¼ 12.7 s and V ¼ 6.8 ml.
0 10 20 30 400
0.1
0.2
0.3
0.4
0.5
−
FIG. 16. Fraction of the fluid invasion volume that correspondsto the volume involving bead displacement, for different injectionrates q.
MORPHODYNAMICS OF FLUID-FLUID DISPLACEMENT IN … PHYS. REV. APPLIED 9, 024028 (2018)
024028-11

ACKNOWLEDGMENTS
We thank Luis Cueto-Felgueroso for conducting 3Dfinite element simulations to confirm the validity of some ofthe approximations in the analytical model. This work wasfunded in part by the U.S. Department of Energy (GrantNo. DE-SC0018357). M.-J. D. acknowledges the fundingprovided by Eni through the Society of Energy Fellowsat MIT.
[1] F. M. Orr, Jr. and J. J. Taber, Use of carbon dioxide inenhanced oil recovery, Science 224, 563 (1984).
[2] L. W. Lake, Enhanced Oil Recovery (Prentice-Hall,Englewood Cliffs, NJ, 1989).
[3] D.W. Brown, D. V. Duchane, G. Heiken, and V. T. Hriscu,Mining the Earth’s Heat: Hot Dry Rock Geothermal Energy(Springer, New York, 2012).
[4] Intergovernmental Panel on Climate Change, CarbonDioxide Capture and Storage: Special Report of theIntergovernmental Panel on Climate Change, edited byB. Metz et al. (Cambridge University Press, Cambridge,England, 2005).
[5] M. L. Szulczewski, C. W. MacMinn, H. J. Herzog, and R.Juanes, Lifetime of carbon capture and storage as a climate-change mitigation technology, Proc. Natl. Acad. Sci. U.S.A.109, 5185 (2012).
[6] L. Cueto-Felgueroso and R. Juanes, Nonlocal InterfaceDynamics and Pattern Formation in Gravity-Driven Unsatu-rated Flow through Porous Media, Phys. Rev. Lett. 101,244504 (2008).
[7] Y. Wei, C. M. Cejas, R. Barrois, R. Dreyfus, and D. J.Durian, Morphology of Rain Water Channeling in System-atically Varied Model Sandy Soils, Phys. Rev. Applied 2,044004 (2014).
[8] C. Y. Wang, Fundamental models for fuel cell engineering,Chem. Rev. 104, 4727 (2004).
[9] T. Patzek, F. Male, and M. Marder, Gas production in theBarnett Shale obeys a simple scaling theory, Proc. Natl.Acad. Sci. U.S.A. 110, 19731 (2013).
[10] L. Cueto-Felgueroso and R. Juanes, Forecasting long-termgas production from shale, Proc. Natl. Acad. Sci. U.S.A.110, 19660 (2013).
[11] B. P. Scandella, L. Pillsbury, T. Weber, C. Ruppel, H.Hemond, and R. Juanes, Ephemerality of discrete methanevents in lake sediments, Geophys. Res. Lett. 43, 4374(2016).
[12] R. Sassen, S. L. Losh, L. Cathles III, H. H. Roberts, J. K.Whelan, A. V. Milkov, S. T. Sweet, and D. A. DeFreitas,Massive vein-filling gas hydrate: Relation to ongoing gasmigration from the deep subsurface in the Gulf of Mexico,Mar. Pet. Geol. 18, 551 (2001).
[13] L.-T. Chen, N. Li, C.-Y. Sun, G.-J. Chen, C. A. Koh, andB.-J. Sun, Hydrate formation in sediments from free gasusing a one-dimensional visual simulator, Fuel 197, 298(2017).
[14] K. Andreassen, A. Hubbard, M. Winsborrow, H. Patton, S.Vadakkepuliyambatta, A. Plaza-Faverola, E. Gudlaugsson,P. Serov, A. Deryabin, R. Mattingsdal et al., Massive
blow-out craters formed by hydrate-controlled methaneexpulsion from the arctic seafloor, Science 356, 948 (2017).
[15] A. Parmigiani, S. Faroughi, C. Huber, O. Bachmann, and Y.Su, Bubble accumulation and its role in the evolution ofmagma reservoirs in the upper crust, Nature (London) 532,492 (2016).
[16] A. Groisman and E. Kaplan, An experimental study ofcracking induced by desiccation, Europhys. Lett. 25, 415(1994).
[17] J. W. Peterson, P. A. Lepczyk, and K. L. Lake, Effect ofsediment size on area of influence during ground-water remediation by air sparging: A laboratory approach,Environ. Geol. 38, 1 (1999).
[18] J. S. Selker, M. Niemet, N. G. McDuffie, S. M. Gorelick,and J.-Y. Parlange, The local geometry of gas injection intosaturated homogeneous porous media, Transp. PorousMedia 68, 107 (2007).
[19] N. Chakrapani, B. Wei, A. Carrillo, P. M. Ajayan, and R. S.Kane, Capillarity-driven assembly of two-dimensionalcellular carbon nanotube foams, Proc. Natl. Acad. Sci.U.S.A. 101, 4009 (2004).
[20] H. Van Damme, F. Obrecht, P. Levitz, L. Gatineau, and C.Laroche, Fractal viscous fingering in clay slurries, Nature(London) 320, 731 (1986).
[21] E. Lemaire, P. Levitz, G. Daccord, and H. Van Damme,From Viscous Fingering to Viscoelastic Fracturing inColloidal Fluids, Phys. Rev. Lett. 67, 2009 (1991).
[22] C. W. MacMinn, E. R. Dufresne, and J. S. Wettlaufer, Fluid-Driven Deformation of a Soft Granular Material, Phys. Rev.X 5, 011020 (2015).
[23] D. Vella, P. Aussillous, and L. Mahadevan, Elasticity of aninterfacial particle raft, Europhys. Lett. 68, 212 (2004).
[24] C. Peco, W. Chen, Y. Liu, J. Dolbow, M. Bandi, and E.Fried, Influence of surface tension in the surfactant-drivenfracture of closely-packed particulate monolayers, SoftMatter 13, 5832 (2017).
[25] E. R. Dufresne, E. I. Corwin, N. A. Greenblatt, J. Ashmore,D. Y. Wang, A. D. Dinsmore, J. X. Cheng, X. S. Xie, J. W.Hutchinson, and D. A. Weitz, Flow and Fracture in DryingNanoparticle Suspensions, Phys. Rev. Lett. 91, 224501(2003).
[26] L. Goehring, W. J. Clegg, and A. F. Routh, Plasticity andFracture in Drying Colloidal Films, Phys. Rev. Lett. 110,024301 (2013).
[27] C. Chevalier, A. Lindner, M. Leroux, and E. Clement, Theinstability of slow, immiscible, viscous liquid-liquid dis-placements in permeable media, J. Non-Newtonian FluidMech. 158, 63 (2009).
[28] B. Sandnes, H. A. Knudsen, K. J. Måløy, and E. G. Flekkøy,Labyrinth Patterns in Confined Granular-Fluid Systems,Phys. Rev. Lett. 99, 038001 (2007).
[29] B. Sandnes, E. G. Flekkøy, H. A. Knudsen, K. J. Måløy, andH. See, Patterns and flow in frictional fluid dynamics, Nat.Commun. 2, 288 (2011).
[30] R. Holtzman, M. L. Szulczewski, and R. Juanes, CapillaryFracturing in Granular Media, Phys. Rev. Lett. 108, 264504(2012).
[31] R. Holtzman and R. Juanes, Crossover from fingering tofracturing in deformable disordered media, Phys. Rev. E 82,046305 (2010).
MARIE-JULIE DALBE and RUBEN JUANES PHYS. REV. APPLIED 9, 024028 (2018)
024028-12

[32] A. K. Jain and R. Juanes, Preferential mode of gas invasionin sediments: Grain-scale mechanistic model of coupledmultiphase fluid flow and sediment mechanics, J. Geophys.Res. 114, B08101 (2009).
[33] X.-Z. Kong, W. Kinzelbach, and F. Stauffer, Morphody-namics during air injection into water-saturated movablespherical granulates, Chem. Eng. Sci. 65, 4652 (2010).
[34] G. Varas, V. Vidal, and J.-C. Geminard, Morphology of airinvasion in an immersed granular layer, Phys. Rev. E 83,061302 (2011).
[35] G. Varas, V. Vidal, and J.-C. Geminard, Venting dynamicsof an immersed granular layer, Phys. Rev. E 83, 011302(2011).
[36] F. K. Eriksen, R. Toussaint, K.-J. Måløy, and E. G. Flekkøy,Invasion patterns during two-phase flow in deformableporous media, Front. Phys. 3, 81 (2015).
[37] J.-H. Choi, Y. Seol, R. Boswell, and R. Juanes, X-raycomputed-tomography imaging of gas migration in water-saturated sediments: From capillary invasion to conduitopening, Geophys. Res. Lett. 38, L17310 (2011).
[38] H. Huang, F. Zhang, P. Callahan, and J. Ayoub, GranularFingering in Fluid Injection into Dense Granular Media in aHele-Shaw Cell, Phys. Rev. Lett. 108, 258001 (2012).
[39] H. Shin and J. C. Santamarina, Fluid-driven fractures inuncemented sediments: Underlying particle-level processes,Earth Planet. Sci. Lett. 299, 180 (2010).
[40] A. Islam, S. Chevalier, I. Ben Salem, Y. Bernabe, R. Juanes,and M. Sassi, Characterization of the crossover fromcapillary invasion to viscous fingering to fracturing duringdrainage in a vertical 2D porous medium, Int. J. MultiphaseFlow 58, 279 (2014).
[41] B. P. Boudreau, C. Algar, B. D. Johnson, I. Croudace, A.Reed, Y. Furukawa, K. M. Dorgan, P. A. Jumars, and A. S.Grader, Bubble growth and rise in soft sediments, Geology33, 517 (2005).
[42] B. P. Scandella, K. Delwiche, H. Hemond, and R. Juanes,Persistence of bubble outlets in soft, methane-generatingsediments, J. Geophys. Res. 122, 1298 (2017).
[43] V. Frette, J. Feder, T. Jøssang, P. Meakin, and K. J.Måløy, Fast, immiscible fluid-fluid displacement in three-dimensional porous media at finite viscosity contrast, Phys.Rev. E 50, 2881 (1994).
[44] M. Stöhr, K. Roth, and B. Jähne, Measurement of 3D pore-scale flow in index-matched porous media, Exp. Fluids 35,159 (2003).
[45] H. Ovdat and B. Berkowitz, Pore-scale study of drainagedisplacement under combined capillary and gravity effectsin index-matched porous media, Water Resour. Res. 42,W06411 (2006).
[46] X.-Z. Kong, M. Holzner, F. Stauffer, and W. Kinzelbach,Time-resolved 3D visualization of air injection in a liquid-saturated refractive-index-matched porous medium, Exp.Fluids 50, 1659 (2011).
[47] P. Sharma, P. Aswathi, A. Sane, S. Ghosh, and S.Bhattacharya, Three-dimensional real-time imaging of bi-phasic flow through porous media, Rev. Sci. Instrum. 82,113704 (2011).
[48] A. T. Krummel, S. S. Datta, S. Münster, and D. A.Weitz, Visualizing multiphase flow and trapped fluid
configurations in a model three-dimensional porousmedium, AIChE J. 59, 1022 (2013).
[49] J. Yan, X. Luo, W. Wang, R. Toussaint, J. Schmittbuhl, G.Vasseur, F. Chen, A. Yu, and L. Zhang, An experimentalstudy of secondary oil migration in a three-dimensionaltilted porous medium, AAPG Bull. 96, 773 (2012).
[50] S. Berg, H. Ott, S. A. Klapp, A. Schwing, R. Neiteler, N.Brussee, A. Makurat, L. Leu, F. Enzmann, J.-O. Schwarz,M. Kersten, S. Irvine, and M. Stampanoni, Real-time 3Dimaging of Haines jumps in porous media flow, Proc. Natl.Acad. Sci. U.S.A. 110, 3755 (2013).
[51] K. Singh, H. Scholl, M. Brinkmann, M. Di Michiel, M.Scheel, S. Herminghaus, and R. Seemann, The role of localinstabilities in fluid invasion into permeable media, Sci.Rep. 7, 444 (2017).
[52] J. Bear, Dynamics of Fluids in Porous Media (Elsevier,New York, 1972).
[53] M. A. Biot, General theory of three-dimensional consoli-dation, J. Appl. Phys. 12, 155 (1941).
[54] J. Geertsma, The effect of fluid pressure decline onvolumetric change of porous rocks, Trans. AIME 210,331 (1957).
[55] J. R. Rice and M. P. Cleary, Some basic stress-diffusionsolutions for fluid saturated elastic porous media withcompressible constituents, Rev. Geophys. 14, 227 (1976).
[56] O. Coussy, Poromechanics (JohnWiley & Sons, Chichester,England, 2004).
[57] J. Crank, Mathematics of Diffusion, 2nd ed. (OxfordUniversity Press, New York, 1975).
[58] H. S. Carslaw and J. C. Jaeger, Conduction of Heat inSolids, 2nd ed. (Oxford University Press, New York, 1959).
[59] The IBVP given by Eqs. (5)–(8) is considered in Sec. 9.9 ofRef. [58]. Unfortunately, the expression given for thesolution is demonstrably incorrect: hðr; tÞ should initiallybe zero for all values of r (it does not in their expression) andshould increase with t (which it also does not).
[60] B. B. Mandelbrot, The Fractal Geometry of Nature (W.H.Freeman and Co., New York, 1982).
[61] M. Kardar, G. Parisi, and Y.-C. Zhang, Dynamic Scaling ofGrowing Interfaces, Phys. Rev. Lett. 56, 889 (1986).
[62] V. K. Horvath, F. Family, and T. Vicsek, Dynamic scaling ofthe interface in two-phase viscous flows in porous media,J. Phys. A 24, L25 (1991).
[63] A. L. Barabási and H. E. Stanley, Fractal Concepts inSurface Growth (Cambridge University Press, Cambridge,England, 1995).
[64] T. Halpin-Healy and Y.-C. Zhang, Kinetic rougheningphenomena, stochastic growth, directed polymers and allthat. Aspects of multidisciplinary statistical mechanics,Phys. Rep. 254, 215 (1995).
[65] L. Paterson, Diffusion-Limited Aggregation and Two-FluidDisplacements in Porous Media, Phys. Rev. Lett. 52, 1621(1984).
[66] K. J. Måløy, J. Feder, and T. Jøssang, Viscous FingeringFractals in Porous Media, Phys. Rev. Lett. 55, 2688 (1985).
[67] R. Lenormand and C. Zarcone, Invasion Percolation in anEtched Network: Measurement of a Fractal Dimension,Phys. Rev. Lett. 54, 2226 (1985).
[68] J. Nittmann, G. Daccord, and H. E. Stanley, Fractalgrowth of viscous fingers: Quantitative characterization of
MORPHODYNAMICS OF FLUID-FLUID DISPLACEMENT IN … PHYS. REV. APPLIED 9, 024028 (2018)
024028-13
a fluid instability phenomenon, Nature (London) 314, 141(1985).
[69] G. Daccord, J. Nittmann, and H. E. Stanley, Radial ViscousFingers and Diffusion-Limited Aggregation: FractalDimension and Growth Sites, Phys. Rev. Lett. 56, 336(1986).
[70] R. Lenormand, E. Touboul, and C. Zarcone, Numericalmodels and experiments on immiscible displacements inporous media, J. Fluid Mech. 189, 165 (1988).
[71] M. A. Rubio, C. A. Edwards, A. Dougherty, and J. P. Gollub,Self-Affine Fractal Interfaces from Immiscible Displacementin Porous Media, Phys. Rev. Lett. 63, 1685 (1989).
[72] J. F. Fernández, R. Rangel, and J. Rivero, CrossoverLength from Invasion Percolation to Diffusion-LimitedAggregation in Porous Media, Phys. Rev. Lett. 67, 2958(1991).
[73] K. J. Måløy, L. Furuberg, J. Feder, and T. Jøssang,Dynamics of Slow Drainage in Porous Media, Phys. Rev.Lett. 68, 2161 (1992).
[74] S. V. Buldyrev, A.-L. Barabási, F. Caserta, S. Havlin, H. E.Stanley, and T. Vicsek, Anomalous interface roughening inporous media: Experiment and model, Phys. Rev. A 45,R8313 (1992).
[75] V. Frette, J. Feder, T. Jøssang, and P. Meakin, Buoyancy-Driven Fluid Migration in Porous Media, Phys. Rev. Lett.68, 3164 (1992).
[76] Y. Meheust, G. Løvoll, K. J. Måløy, and J. Schmittbuhl,Interface scaling in a two-dimensional porous mediumunder combined viscous, gravity, and capillary effects,Phys. Rev. E 66, 051603 (2002).
[77] G. Løvoll, Y. Meheust, R. Toussaint, J. Schmittbuhl, andK. J. Måløy, Growth activity during fingering in a porousHele-Shaw cell, Phys. Rev. E 70, 026301 (2004).
[78] M. Ferer, C. Ji, G. S. Bromhal, J. Cook, G. Ahmadi, andD. H. Smith, Crossover from capillary fingering to viscousfingering for immiscible unstable flow: Experiment andmodeling, Phys. Rev. E 70, 016303 (2004).
[79] R. Toussaint, G. Løvoll, Y. Meheust, K. J. Måløy,and J. Schmittbuhl, Influence of pore-scale disorder onviscous fingering during drainage, Europhys. Lett. 71, 583(2005).
[80] K. A. Takeuchi, M. Sano, T. Sasamoto, and H. Spohn,Growing interfaces uncover universal fluctuations behindscale invariance, Sci. Rep. 1, 34 (2011).
[81] M. K. Hubbert and D. G. Willis, Mechanics of hydraulicfracturing, Petrol. Trans. AIME 210, 153 (1957).
[82] H. Gomez, L. Cueto-Felgueroso, and R. Juanes, Three-dimensional simulation of unstable gravity-driven infiltra-tion of water into a porous medium, J. Comput. Phys. 238,217 (2013).
[83] P. Meakin, G. Wagner, A. Vedvik, H. Amundsen, J. Feder,and T. Jøssang, Invasion percolation and secondary migra-tion: Experiments and simulations, Mar. Pet. Geol. 17, 777(2000).
[84] J. P. Stokes, D. A. Weitz, J. P. Gollub, A. Dougherty, M. O.Robbins, P. M. Chaikin, and H. M. Lindsay, InterfacialStability of Immiscible Displacement in a Porous Medium,Phys. Rev. Lett. 57, 1718 (1986).
[85] D. A. Weitz, J. P. Stokes, R. C. Ball, and A. P. Kushnick,Dynamic Capillary Pressure in Porous Media: Origin of theViscous-Fingering Length Scale, Phys. Rev. Lett. 59, 2967(1987).
[86] B. Levache and D. Bartolo, Revisiting the Saffman-TaylorExperiment: Imbibition Patterns and Liquid-EntrainmentTransitions, Phys. Rev. Lett. 113, 044501 (2014).
[87] M. Trojer, M. L. Szulczewski, and R. Juanes, StabilizingFluid-Fluid Displacements in Porous Media throughWettability Alteration, Phys. Rev. Applied 3, 054008(2015).
[88] B. Zhao, C. W. MacMinn, and R. Juanes, Wettability controlon multiphase flow in patterned microfluidics, Proc. Natl.Acad. Sci. U.S.A. 113, 10251 (2016).
[89] L. Furuberg, K. J. Måløy, and J. Feder, Intermittent behaviorin slow drainage, Phys. Rev. E 53, 966 (1996).
[90] M. Jankov, G. Løvoll, H. A. Knudsen, K. J. Måløy, R.Planet, and R. Toussaint, Effects of pressure oscillations ondrainage in an elastic porous medium, Transp. PorousMedia 84, 569 (2010).
[91] F. Moebius and D. Or, Interfacial jumps and pressure burstsduring fluid displacement in interacting irregular capillaries,J. Colloid Interface Sci. 377, 406 (2012).
[92] F. Moebius and D. Or, Pore scale dynamics underlying themotion of drainage fronts in porous media, Water Resour.Res. 50, 8441 (2014).
MARIE-JULIE DALBE and RUBEN JUANES PHYS. REV. APPLIED 9, 024028 (2018)
024028-14