Embed Size (px)
Citation preview

Physical Realities of Colorado
Water Supply and Demand 2014 Water Course
February 3, 2014
Dr. Gigi A. Richard
Faculty Director, Water Center
Associate Professor of Geology
Colorado Mesa University
Grand Junction, CO
Image credit: Colo. Foundation for Water Education

Colorado’s Water Supply

Grand Jnct
Average
Precipitation
9 in/yr
Colorado Avg
Precipitation 15.5 in/yr

From

Most of the runoff is
produced by only
15% of the drainage
area
Climate of the
Colorado River
Basin
Map by G. Richard

Fassnacht 2006
How does this
precipitation
regime translate
into timing of
streamflow?
Upper
Colorado
River Basin
Lower Colorado River Basin
Annual Hydrograph at
CO-UT state line
Data from usgs.gov

Yampa River at Deerlodge
Photo by G. Richard

Yampa River at Deerlodge
Photo by G. Richard

Yampa River at Deerlodge
June 11, 2011 - 23,600 cfs
Peak flow, 25,700 cfs on June 9, 2011 Photo by G. Richard

Yampa River at Deerlodge
The picnic table
at campsite 2!!
Photo by G. Richard
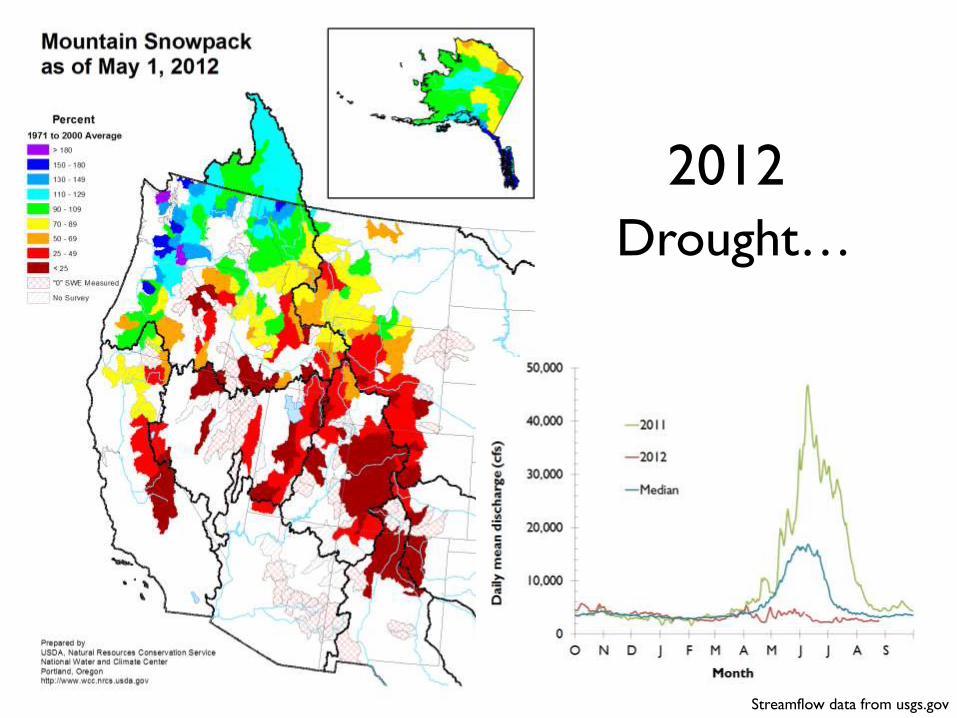
2012
Drought…
Streamflow data from usgs.gov

2013
Rollercoaster
Drought? Flood!
Maps from http://climate.colostate.edu/~drought/
Streamflow data from usgs.gov

GEOL 355 - Introduction 13
80% of the
Population
80% of the
Water
What do we do
when we don’t have
water when and
where we need it?

GEOL 355 - Introduction 14

Diversions
One of the largest irrigation canals in the
world - carries 26,000 cfs and irrigates
more than 750 mi2 in California
The Central Arizona Project canal pumps
Colorado River water out of Lake Havasu and
336 miles east and uphill to supply Phoenix,
Tucson, and 12 sets of aquifer recharge ponds.
Photo by Peter McBridge
All-American Canal Photo from Nasa.gov
Colorado River Aqueduct
Los Angeles & San Diego
Consumptive use has
increased to about
90% of the long-term
average annual flow at
Yuma (Schmidt 2007)

Storage
Hoover Dam, 1935
Lake Mead 29 million ac-ft
storage capacity
Glen Canyon Dam, 1963
Lake Powell 27 million ac-ft
storage capacity
1911 - 1st major dam in basin - Theodore Roosevelt
dam on the Salt River, 1.6 million ac-ft
Photo by Peter McBride Photo by Peter McBride
18 major dams with storage
capacity > 800,000 ac-ft
Total storage capacity is now 60 million ac-ft
about 4 times the long-term mean annual
flow at Lees Ferry (USBR 2012)

”the Colorado River is among the
most controlled, legislated and
managed rivers in the world.”
Largest ratio of reservoir storage to
mean annual flow of any large river in
North America (Schmidt 2007)
International Treaties and
Interstate Compacts
“…most regulated river
in the world”
From High Country News

Oct.
1921
Natural
Variability
Filling Lake
Powell
1983 Flood
Controlled
Variability


Resulting impacts
Water quality
• Salinity increase
• Selenium increase
• Temperature changes +/-
Ecology – riparian and aquatic
• Endemic fish threatened and endangered
• Invasive riparian species – tamarisk
and others
• Impacts on fauna – e.g., SW
willow flycatcher
Delta and marine environments
• Significant decrease in size of delta
• Reversed circulation patterns in Gulf
of California
• Bidiversity of delta decline
• Ecological impacts in Gulf
• Sediment impacts in gulf – loss of beaches
Pre-dam Mean Annual
Flood 82,700 cfs Post-dam Mean
Annual Flood
30,000 cfs
Hydrology
Sediment supply &
channel morphology
Ecological – riparian & aquatic
Water Quality
From VanSteeter &
Pitlick 1998
Data from usgs.gov

How do we use water in
Colorado?
Data from Kenny, J.F., Barber, N.L., Hutson, S.S., Linsey, K.S., Lovelace, J.K., and Maupin, M.A., 2009,
Estimated use of water in the United States in 2005: U.S. Geological Survey Circular 1344, 52 p.
Use ac-ft/yr
Public Supply 969,000
Domestic Fresh 38,600
Irrigation 13,800,000
Livestock 37,100
Aquaculture 98,600
Industrial 160,000
Mining 24,020
Thermoelectric 138,000
Total 15,300,000
Irrigation
91%

Irrigation withdrawals by state, 2005
From Kenny, J.F., Barber, N.L., Hutson, S.S., Linsey, K.S., Lovelace, J.K., and Maupin, M.A., 2009,
Estimated use of water in the United States in 2005: U.S. Geological Survey Circular 1344, 52 p.
#1
CA #2
ID #3
CO

Groundwater Use in Colorado, 2005
388 mgd
352 mgd
1 mgd
284 mgd
Data from Kenny, J.F., Barber, N.L., Hutson, S.S., Linsey, K.S., Lovelace, J.K., and Maupin, M.A., 2009, Estimated use of water in the
United States in 2005: U.S. Geological Survey Circular 1344, 52 p.

Surface Water Use in Colorado, 2005
925 mgd
704 mgd
652 mgd
557 mgd
463 mgd
Data from Kenny, J.F., Barber, N.L., Hutson, S.S., Linsey, K.S., Lovelace, J.K., and Maupin, M.A., 2009, Estimated use of water in the
United States in 2005: U.S. Geological Survey Circular 1344, 52 p.

Total Freshwater Use in Colorado, 2005
926 mgd
773 mgd
730 mgd
706 mgd
560 mgd
Data from Kenny, J.F., Barber, N.L., Hutson, S.S., Linsey, K.S., Lovelace, J.K., and Maupin, M.A., 2009, Estimated use of water in the
United States in 2005: U.S. Geological Survey Circular 1344, 52 p.

What about 2014?
4
Maps from http://climate.colostate.edu/~drought/

Current
Snowpack
About
Average
Below
Average
2014
2014
Maps from http://climate.colostate.edu/~drought/

Current Soil
Moisture

Current Storage
Maps from http://climate.colostate.edu/~drought/


The Future…Climate Change
Projected annual temperature change for
Colorado under SRES A1B, RCP 4.5, and RCP
8.5 for 2050 (2035-2064) compared with the
1971-2000 average.
The black dots show the median change across
the model runs, and the bars show the range
between the 10th percentile of the model runs
and the 90th percentile.
Graph provided by J. Lukas, Western Water
Assessment, Boulder, CO

The Future…Climate Change
Projected annual precipitation change for
Colorado under SRES A1B, RCP 4.5, and
RCP 8.5 for 2050 (2035-2064) compared
with the 1971-2000 average.
The black dots show the median change
across the model runs, and the bars show
the range between the 10th percentile of
the model runs and the 90th percentile.
Graph provided by J. Lukas, Western Water
Assessment, Boulder, CO

Currently Evaporates
>600,000 ac-ft/yr
Lake Powell
With global climate change
As Temperature Evaporation will

Western Colorado’s annual water balance – average year
Image: D. Meko, U. of Arizona
Precip: 40 MAF
ET : -30 MAF
Runoff: 10 MAF
(MAF = million acre-feet)
Runoff
ET
Slide provided by J. Lukas, Western Water
Assessment, Boulder, CO

Western Colorado’s annual water balance – drought year
Image: D. Meko, U. of Arizona
Precip: 30 MAF
ET : -24 MAF
Runoff: 6 MAF
While precipitation declines
only 25% vs. average year, runoff
declines 40% due to ET
component increasing as
proportion of precipitation
(MAF = million acre-feet)
Runoff
ET
Slide provided by J. Lukas, Western Water
Assessment, Boulder, CO

Western Colorado’s annual water balance – average year,
median 2050 projection (+4oF, no precip change)
Image: D. Meko, U. of Arizona
Precip: 40 MAF
ET : -31 MAF
Runoff: 9 MAF
Even though precipitation
doesn’t change, runoff
declines ~10% to 9 MAF
due to increasing ET
+
-
Runoff
ET
Slide provided by J. Lukas, Western Water
Assessment, Boulder, CO

Looking toward a sustainable
water future for Colorado…
Thank you