Embed Size (px)
Citation preview

AbstractThis chapter summarizes the physical property measure-
ments performed on sediment samples obtained in the north-ern Gulf of Mexico during July 2002. During this cruise on the RV Marion Dufresne, 17 giant piston cores up to 38-meters long, 4 giant box cores up to 10-meters long, and 8 gravity (heat flow) cores up to 9-meters long were recovered in widely different geologic environments in water depths ranging from about 580 to 2,260 meters. Gas hydrate was recovered in three cores at subbottom depths of about 3 to 9 meters, and gas bubbles indicative of gas hydrate dissociation were noticed in a fourth core. Numerous shipboard measurements were performed, including shear strength (mini-vane, Torvane, and pocket penetrometer) and electrical resistivity. Water content, grain-density, grain-size, and carbon content measurements were performed in a shore-based laboratory on samples col-lected at sea. Bulk density, porosity, and unit weight were determined from phase relations.
IntroductionGas hydrate, an ice-like crystalline solid containing high
concentrations of methane, is a potential energy resource. It is also a potential hazard to hydrocarbon exploration and produc-tion, and may influence global climate change. Although the amount of gas hydrate in the natural environment is inferred to be enormous, little is known about its distribution in shal-low sediment or even exactly how it forms. Exploring these and other topics was among the goals of a July 2002 cruise conducted on board the research vessel (RV) Marion Dufresne within four continental slope regions of the northern Gulf of Mexico (Tunica Mound, Orca and Pigmy Basins, Bush Hill, and the Mississippi Canyon region) (fig. 1).
Determining physical properties of core sediment is a useful complement to sedimentologic studies (see Bout- Roumazeilles and Trentesaux, this volume, chapter 5), petrophysical analyses, and well-log interpretations. These measurements are important to relate the location of gas hydrate occurrences to the physical nature of the host material. These data also are used in a variety of modeling investiga-tions, and similar data have been correlated with engineering behavior (Lambe and Whitman, 1969; Holtz and Kovacs, 1981).
Seventeen giant Calypso piston cores up to 38 meters (m) in length (500-m total recovery) and 2 box cores (desig-nated either C2 or C2) (14-m total recovery) were collected for gas hydrate-related studies (Winters and others, this volume, chapter 3) (figs. 2–4). Eight gravity cores, rigged to measure
Physical Properties of Sediment Obtained During the IMAGES VIII/PAGE 127 Gas Hydrate and Paleoclimate Cruise on the RV Marion Dufresne in the Gulf of Mexico, 2–18 July 2002
William J. Winters1, Ivana Novosel2, Olya Boldina3, William F. Waite1, Sarah A. Kelsey1, and Benjamin W. Hallett1
Physical properties of sediment obtained during the IMAGES VIII/PAGE 127 gas hydrate and paleoclimate cruise on the RV Marion Dufresne in the Gulf of Mexico, 2–18 July 2002; chapter 4 in Winters, W.J., Lorenson, T.D., and Paull, C.K., eds., 2007, Initial report of the IMAGES VIII/PAGE 127 gas hydrate and paleoclimate cruise on the RV Marion Dufresne in the Gulf of Mexico, 2–18 July 2002: U.S. Geological Survey Open-File Report 2004–1358.
1U.S. Geological Survey, 384 Woods Hole Road, Woods Hole, MA 02543 USA.
2Rice University, Department of Earth Science, 6100 Main Street, Houston, TX 77005 USA.
3Moscow State University, Department of Geology, Chair of Geocryology, Moscow, Russia 119992.
Chapter 4

Figure 1. Northern Gulf of Mexico study areas.
Figure 2. Core locations in Tunica Mound region.
4-2 Initial Report of the IMAGES VIII/PAGE 127 Gas Hydrate and Paleoclimate Cruise in the Gulf of Mexico, 2–18 July 2002
Sigsbee Escarpment
Texas-Louisiana Shelf
Mississippi Slope
Central Slope
-95
-95
-90
-90
-85
-85
-80
-80
20 20
25 25
30 30
0 200 400
km
Gulf of Mexico
92o0'0"W
92o0'0"W
91o0'0"W
91o0'0"W
90o0'0"W
90o0'0"W
89o0'0"W
89o0'0"W
27o0'0"N 27o0'0"N
28o0'0"N 28o0'0"N
29o0'0"N 29o0'0"N
0 50 10025
Kilometers
Louisiana
Tunica Mound
Pigmy and OrcaBasins
BushHill
Mississippi Canyon
N
Mississippi Canyon
Henderson RidgeKane Spur
Pigmy B.
Orca B.
SP2
MD02-2548
MD02-2546
MD02-2541
MD02-2539
MD02-2538MD02-2537MD02-2535
MD02-2545G
MD02-2544GMD02-2543G
MD02- 2542GHF
MD02-2540GHF-2 MD02-2540GHF-1
MD02-2536GHF-3MD02-2536GHF-2
MD02-2536GHF-1MD02-2547GHF
92 15'0"W
92 o15'0"W
27 o40'0"N 27 40'0"N
Tunica Mound
0 0.9 1.8 2.7 3.60.45
Kilometers
N40
0
800
700
600
500
o
o

Figure 3. Core locations in Bush Hill region.
Figure 4. Core locations in Mississippi Canyon region.
Physical Properties 4-3
600
800
700
N
SP17
MD02-2556MD02-2555MD02-2554
MD02-2557GHF3MD02-2557GHF2MD02-2557GHF1
91°30'0"W
91°30'0"W
91°29'0"W
91°29'0"W
91°28'0"W
91°28'0"W
27°46'0"N 27°46'0"N
27°47'0"N 27°47'0"N
27°48'0"N 27°48'0"N
0 0.5 1 1.5 20.25
Kilometers
Bush Hill
N
MD02-2568GHFc
MD02-2568GHFb
90°5'0"W
90°5'0"W
89°55'0"W
89°55'0"W
89°45'0"W
89°45'0"W
89°35'0"W
89°35'0"W
89°25'0"W
89°25'0"W
89°15'0"W
89°15'0"W
89°5'0"W
89°5'0"W
88°55'0"W
88°55'0"W
27°50'0"N 27°50'0"N
28°60'0"N 28°60'0"N
28°10'0"N 28°10'0"N
28°20'0"N 28°20'0"N
28°30'0"N 28°30'0"N
28°40'0"N 28°40'0"N
0 10 20 30 405
Kilometers
100
500
1500
1000
1000500
100
1000
Mississippi Canyon
Henderson Ridge
Kane Spur
MD02-2570
MD02-2569
MD02-2567
MD02-2566
MD02-2565
MD02-2562
MD02-2561
MD02-2560
MD02-2559
MD02-2558MD02-2571C2
MD02-2563C2MD02-2573GHF
MD02-2572GHF
MD02-2568GHFa
MD02-2564GHFdMD02-2564GHFc
MD02-2564GHFbMD02-2564GHFa
SP26
58
SP24
Slide Area

in-place temperature, were also obtained as part of a heat-flow study (Labails and others, this volume, chapter 6). In addi-tion, 9-m and 10-m-long box cores were taken from Orca and Pigmy Basins (fig. 5), respectively, for studies related to the International Marine Past Global Changes Study (IMAGES) program and Paleoceanography of the Atlantic and Geo-chemistry (PAGE) program, and for measuring anthropogenic contaminant input of Holocene age to the northern Gulf of Mexico from the Mississippi River (Flocks and Swarzenski, this volume, chapter 13).
Numerous shipboard geotechnical measurements were performed on longitudinally split cores, including shear strength (mini-vane, Torvane, and pocket penetrometer) and electrical resistivity. Water content, grain-density, grain-size, and carbon content measurements were performed in shore-based laboratories on samples collected at sea. Bulk density, porosity, void ratio, and unit weight were determined from phase relations.
Geologic Setting and Gas Hydrate Presence
The northern Gulf of Mexico hosts numerous near-sea-floor (<7-m subbottom) occurrences of gas hydrate. The sea floor is dominated by salt-tectonic basin structures, high
sedimentation rates, and complex stratigraphy with common sea-floor failures (Cooper and Hart, 2002). Natural oil and gas seeps are abundant, usually associated with fault conduits resulting in numerous hydrocarbon vents, often capped by gas hydrate when the seeps are within the hydrate stability zone. Whereas gas hydrate is relatively common at the sea floor, the lack of geophysical indicators on seismic records leaves the existence of deeper gas hydrates unresolved. Thus, it is unknown if there are significant gas hydrate accumulations in reservoir sediments away from structural conduits inferred to
underlie the sea-floor mounds. Additional discussion of the geologic setting of the north-ern Gulf of Mexico is provided in Lorenson and others (this volume, chapter 2), and seismic reflection profiles for regional and core locations are presented in Appendix D.
Gas hydrate has been inferred from Bottom Simulat-ing Reflections (BSR’s) in many continental margins around the world (Kvenvolden and Loren-son, 2001). However, they are noticeably rare in the northern Gulf of Mexico. This may be in part because of the complicated geologic nature of the subsur-face, including various geother-mal gradients and hyper-saline pore waters that influence the formation of hydrate deposits.
Gas hydrate was recovered in three cores at subbottom depths of about 3 to 9 m, and gas bubbles indicative of gas hydrate dissociation were noticed in a fourth core. Because of
safety concerns, however, entire cores containing gas hydrate typically were not split on board ship. Instead, subsectioned intervals surrounding gas hydrate occurrences in the cores were visually observed.
Methods and Equipment
Shipboard Measurements
Coring and procedures related to handling the giant piston cores, box cores, and gravity cores collected during this cruise are discussed in Winters and others (this volume, chapter 3). After thermal conductivity measurements were performed on whole-round core sections (Novosel and others, this volume, chapter 7), the cores were split longitudinally, and the working half-round cores were brought into the shipboard
Figure 5. Core locations in Pigmy and Orca Basins region.
4-4 Initial Report of the IMAGES VIII/PAGE 127 Gas Hydrate and Paleoclimate Cruise in the Gulf of Mexico, 2–18 July 2002
MD02-2552MD02-2551
MD02-2549
MD02-2553C2
MD02-2550C2
91°35'0"W
91°35'0"W
91°30'0"W
91°30'0"W
91°25'0"W
91°25'0"W
91°20'0"W
91°20'0"W
91°15'0"W
91°15'0"W
91°10'0"W
91°10'0"W
26°55'0"N 26°55'0"N
27°60'0"N 27°60'0"N
27°5'0"N 27°5'0"N
27°10'0"N 27°10'0"N
0 4 8 12 162
Kilometers
Pigmy Basin
Orca Basin
N
St. Tammany Basin
N. TerrebonneBasin
JeffersonBasin

physical properties laboratory for further analysis. After elec-trical resistivity measurements were completed, shear strength was determined using a mini-vane shear strength apparatus. Pocket penetrometer and Torvane shear strength measure-ments were then performed. Lastly, subsamples to be used for shore-based water content, grain-density, and grain-size measurements were obtained by removing sediment (typi-cally with a spatula) from areas proximal to the previously performed shear strength measurements. The subsamples were placed into Whirl-Pak plastic bags and stored in a refrigerator at a temperature of approximately 4 degrees Celsius (°C) to minimize pore-water evaporation and biological effects.
Electrical ResistivityTo minimize evaporation and thereby preserve pore-water
salinity, electrical resistivity measurements were performed on freshly split core sections. The measurements were typically performed every 1.5 m, in the vicinity of a thermal conductiv-ity measurement. The measurements were omitted if the sedi-ment was visibly altered during core recovery or if evidence of gas expansion was present.
The equipment was designed by D. Heffer, D. Mosher, and T. Hewitt of the Geological Survey of Canada (GSC). The measuring device consisted of a 4-pin Wenner array and a digital temperature probe. The pins were gold plated and approximately 3 millimeters (mm) in length, separated from each other by 2 mm. The outer two pins were connected to a circuit board with an AC voltage source acting through current-limiting resistors. The inner two pins were connected to a Fluke voltmeter. The entire instrument was connected to a PC through an RS-232 output, thus allowing all raw data processing and display to be automated.
Electrical resistivity, R, is defined by the following for-mula:
CI
VR
*=
where V is voltage, I is current, and C is a cell constant.
The cell constant was determined using seawater prior to each sediment measurement. Standard seawater has a known resis-tivity,
†
RW , which can be described by the following formula:
†
RW = (2.8 + 0.1* T )- 1,
where T is the temperature, in degrees Celsius.
Measurement of the temperature, voltage, and current for a standard seawater sample allows the cell constant to be
determined. The instrument is thus calibrated by adjusting the cell constant until
†
RW equals 0.209 ohm-meters for a tem-perature of 20 °C.
Sample resistivity,
†
RO , was derived using the following formula (Hewitt, 1998):
†
RO = R * (1+ 0.025* (T - 20)),
where R is the measured sample resistivity, uncorrected for
temperature; and T is the temperature, in degrees Celsius.
A Labview data logging and processing program, written by T. Hewitt, calculated resistivity formation factor, F, using the following relation:
W
O
R
RF =
Errors produced by small variations in the depth of the pin penetration into the sediment were assumed to be negligible.
Shear StrengthShipboard miniature-vane shear tests were performed at
approximately 1.5-m intervals down core with a 12.7-mm-diameter by 12.7-mm high four bladed vane. Vane shear strength tests were performed proximal to the sites of the thermal conductivity and electrical resistivity measurements. The vane was inserted so that the top of the vane was one vane height deep into the sediment and was turned by applying a constant rotation rate to the top of a calibrated spring. Because the sediment shear strengths throughout the study areas were similar, only one spring was used. Vane shear strength, Svs, was determined from:
Svs = τ γ / K ,
where τ is a spring constant relating differential rotation
across the spring to applied torque; γ is the spring rotation required to reach maximum
torque at failure, in degrees; and K is the vane constant (Hewitt, 1998) relating shear
strength to torque applied to the vane.
If cracking, which invalidates the measurement, was observed during shear, the measurement was not reported.
A pocket penetrometer (Hunt, 1984) was also used to determine shear strength. This device consists of a 6.35-mm diameter spring-loaded plunger that was pushed to a depth of 6.35 mm into the exposed sediment surface. A direct reading scale indicates the unconfined compressive strength (UCS) in kilograms per square centimeter. The maximum shear strength
,
.
Physical Properties 4-5

that can be determined with this device is 220 kilopascals (kPa).
Pocket penetrometer shear strength, Spp, is determined from:
Spp (kPa) = UCS (kg/cm2) * 49,
where UCS is the unconfined compressive strength reading from the pocket penetrometer strength scale.
If very soft sediment was tested, a 25.4-mm-diameter adapter was applied to the end of the plunger. The maximum shear strength that can be determined with the adapter is 13.8 kPa.
If this adapter was used, the shear strength, Spp, is deter-mined from:
Spp (kPa) = UCS (kg/cm2) * 3.1,
where UCS is the unconfined compressive strength reading from the pocket penetrometer strength scale.
A Torvane device (Hunt, 1984) was also used to measure the shear strength, Stv, near the exposed sediment surface of the longitudinally split cores. This device is operated by inserting a 25-mm-diameter eight-bladed adapter 5 mm into the exposed sediment surface. The top of the spring-loaded Torvane is rotated, thereby producing a torque that shears the sediment. A pointer records the maximum torque value, which is proportional to the shear strength. One full revolution of the Torvane top produces a shear strength value of approximately 100 kPa.
Shore-Based Measurements
Physical property index measurements, including water content, grain density, and grain size, were performed post-cruise at the U.S. Geological Survey, Woods Hole, MA. Other properties, such as porosity, wet and dry bulk density, void ratio, and unit weights, were calculated from the index proper-ties. Carbon content of the sediment was also determined.
Water Content and Index PropertiesBecause sediment subsamples were irregular in shape,
making volume difficult to measure, phase relations were back-calculated, assuming 100-percent water saturation of the pore voids. Visible drainage from the core sections at sea was not observed, primarily because of the fine-grained nature of the sediment.
The specimens were oven dried incrementally at tempera-tures between 50 and 110 °C for at least 24 hours at each tem-perature to obtain the amount of fresh water and solids pres-ent. Results for samples dried at the 110 °C temperature are presented in this report. The effect of drying at the lower tem-
peratures will be made available in a subsequent report. After drying, the specimen was broken into finer-sized particles, and the volume of dried solids was determined with an automatic gas pycnometer, using helium as the purge and expansion gas (American Society for Testing and Materials, 1997). The grain density of the pycnometer specimen was calculated using the measured volume and the mass of solids that was determined immediately prior to insertion of the sample into the pycnom-eter. All mass determinations were made quickly and sealed containers were used to prevent moisture in the air from being adsorbed by clay minerals that may have been present.
All physical property calculations, except those speci-fied, were corrected for the presence of residual salt left on the solid particles after driving off the pore fluid by oven drying. In the natural environment, salt and other particles that are dis-solved in the pore fluid behave as part of the aqueous phase. The calculations remove the salt precipitate mass and volume from the solids and add it back to the fluid phase. A default 35 parts per thousand (ppt) value of pore-fluid salinity was assumed for samples without a nearby salinity measurement.
The following equations were used in calculating the physical property values:
ρd = Ms/Vtwhere ρd is the dry bulk density, Ms is the mass of solid sediment grains, and Vt is the calculated total specimen volume;
ρw = Mt/Vtwhere ρw is the wet bulk density, Mt is the total mass of the specimen, and Vt is the calculated total specimen volume;
γd = (Ms/ Vt ) g
where γd is the dry unit weight, Ms is the mass of solid sediment grains, Vt is the calculated total specimen volume, and g is the constant of acceleration due to gravity;
γw = (Mt/ Vt) g
where γw is the wet unit weight, Mt is the total mass of the specimen, Vt is the calculated total specimen volume, and g is the constant of acceleration due to gravity;
4-6 Initial Report of the IMAGES VIII/PAGE 127 Gas Hydrate and Paleoclimate Cruise in the Gulf of Mexico, 2–18 July 2002

γsub = [(Mt/ Vt) g] - γswwhere γsub is the submerged unit weight, Mt is the total mass of the specimen, Vt is the calculated total specimen volume, g is the constant of acceleration due to gravity, and γsw is the unit weight of seawater;
ρs = Mss/Vsswhere ρs is the uncorrected grain density, Mss is the mass of solid sediment grains plus mass of
salt, and Vss is the volume of the sediment grains and salt
measured with a gas pycnometer;
ρsc = Ms/Vswhere ρsc is the corrected grain density, Ms is the mass of solid sediment grains without salt,
and Vs is the volume of the sediment grains without salt
measured with a gas pycnometer;
n = Vsw/(Vs +Vsw)
where n is the porosity based on calculated specimen
volume, Vsw is the volume of seawater, and Vs is the volume of solid sediment grains;
e = Vv/Vswhere e is the void ratio, Vv is the volume of voids (assumed equal to volume of
seawater), and Vs is the volume of solid sediment grains;
WCt = Mfw/Mtwhere WCt is the uncorrected water content based on the total
specimen mass, Mfw is the mass of fresh water in the pore space, and Mt is the total mass of the specimen;
WCs = Mfw/Msswhere WCs is the uncorrected water content based on the solid
grain mass, Mfw is the mass of fresh water in the pore space, and Mss is the mass of the solid sediment grains and
residual salt;
WCtc = Msw/Mtwhere WCtc is the corrected water content based on the total
specimen mass, Msw is the mass of seawater in the void space, and Mt is the total mass of the specimen;
WCsc = Msw/Mswhere WCsc is the corrected water content based on the solid
grain mass, Msw is the mass of seawater in the void space, and Ms is the mass of the solid sediment grains without
residual salt.
Grain SizeA sediment subsample was dried in a convection oven at
90 °C to obtain the dry mass and water content of the sample. The dry mass was corrected for the salinity of the pore water. The sample was then wet-sieved through a number 230 sieve (0.062-mm opening) to separate the sand fraction from the silt and clay fraction. Because of the potential damage to the equipment caused by contamination from hydrocarbons, the typical Coulter Counter (Syvitski, 1991) analysis was not performed on these samples. Rather, the fine-grained material was further classified using a hydrometer technique (Syvitski, 1991). Most of the tests included enough readings to define the silt-clay boundary; however, some tests included additional readings to better define the entire grain-size distribution curve.
Carbon AnalysisThe Carbon-Hydrogen-Nitrogen (CHN) Analyzer
(Verardo and others, 1990) uses a combustion method to con-vert sample elements to simple gases, such as CO2, H
2O, and
N2. The resulting gases are homogenized, depressurized, and
quantified as a function of their thermal conductivities. In order to measure the amount of organic carbon in
sediment samples, the samples were first acidified to remove all inorganic carbonate matter by the addition of sulfurous acid. Using this method, only the organic material was further analyzed by the CHN Analyzer.
Physical Properties 4-7

Multi-Sensor Core LoggerThe Multi-Sensor Core Logger (MSCL) system is an
automated apparatus that measures various properties remotely as a core section is conveyed by or through different sensors. During this cruise, P-wave velocity and amplitude, wet bulk density by gamma-ray attenuation, and magnetic susceptibility were measured. The MSCL is further discussed in this report in chapters by Bout-Roumazeilles and Trentesaux (this vol-ume, chapter 5), and Winters and others (this volume, chapter 3). The MSCL operating manual is supplied in Appendix H.
Results and DiscussionThe sedimentologic history of marine sediment is partly
recorded in its physical characteristics. Additionally, knowing the relative quantity of and relation among the various com-ponents making up that sediment enable us to predict how the sediment will react to internal processes and external stresses. Many physical property measurements define those relations between solid sediment grains and occupied non-grain void space.
Water Content and Index Properties
Water content and porosity values are fundamental characteristics of sediment. These values also describe how much water is available to form gas hydrate in the pore space. Although porosity is important to the formation of gas hydrate,
absolute values of porosity are not as important as individual pore sizes to the formation of gas hydrate (Winters and others, 1999).
A total of 35 cores were recovered from four different study areas in the northern Gulf of Mexico (table 1; fig. 1), including two cores dedicated for the IMAGES/PAGE pro-gram. Statistical information (table 2) and regression equations relating measured properties to subbottom depth (table 3) indicate that most properties fall within several fairly well-defined groups, even though they are from study areas that are considerable distances from each other. Bryant and Trabant (1972) were able to develop statistical relations between water content, shear strength, and bulk density, and subbottom depth in cores within two major areas in the northern Gulf of Mexico. Therefore, it is reasonable that we also are able to present properties that indicate fairly uniform distribution with subbottom depth of physical properties across the northern Gulf of Mexico (except for sediments with hyper-saline pore fluids located in Orca Basin).
Salt-corrected water contents, WCsc, determined for 420 sediment samples ranged from 47.8 to 800.7 percent, with a mean of 94.9 percent, and a median of 75.6 percent (tables 2; 4, p. 29). The higher water content values are from Orca Basin and are related to the presence of dense hyper-saline pore water. Pore-water salinities range from 21.3 to 305.9 ppt for all cores. Values of salinity used in making salt corrections were determined by linearly interpolating between other sedi-ment samples with known salinity (Paull and others, 2005; W. Ussler, Monterey Bay Aquarium Research Institute, oral commun., 2003). Therefore, the salinity values reported in this chapter are to be treated as approximations only.
Table 1. Core information including location, water depth, recovered core length, and core type. — Continued
[ID, identification; deg, degrees; m, meters; PC, piston core; C2 (box), square box core; GHF, gravity core with heat-flow temperature sensors attached; Grav, gravity core without thermal sensors; **, denotes successful determination of geothermal gradient]
Core IDLatitude
(deg)Longitude
(deg)Site name
Water depth
(m)
Core length
(m)PC
C2 (box)
GHF Grav Comments
MD02-2535 27.6198 -92.2410 Tunica Mound 605 37.84 *
MD02-2536GHF-1 27.6198 -92.2410 Tunica Mound 608 8.88 **
MD02-2536GHF-2 27.6253 -92.2460 Tunica Mound 564 8.88 **
MD02-2536GHF-3 27.6270 -92.2375 Tunica Mound 585 8.88 **
MD02-2537 27.6160 -92.2487 Tunica Mound 600 33.58 *
MD02-2538G 27.6167 -92.2472 Tunica Mound 599 7.76 *
MD02-2539 27.6397 -92.1922 Tunica Mound 622 31.1 *
MD02-2540GHF-1 27.6403 -92.1920 Tunica Mound 617 5.65 **
MD02-2540GHF-2 27.6402 -92.1952 Tunica Mound 620 - *
MD02-2541 27.6325 -92.2123 Tunica Mound 615 35.34 *
MD02-2542GHF 27.6322 -92.2120 Tunica Mound 617 7.7 **
MD02-2543G 27.6123 -92.2555 Tunica Mound 579 0.15 *
MD02-2544G 27.6130 -92.2535 Tunica Mound 584 0.1 *
MD02-2545G 27.6140 -92.2517 Tunica Mound 588 9.27 *
4-8 Initial Report of the IMAGES VIII/PAGE 127 Gas Hydrate and Paleoclimate Cruise in the Gulf of Mexico, 2–18 July 2002

Table 1. Core information including location, water depth, recovered core length, and core type. — Continued
[ID, identification; deg, degrees; m, meters; PC, piston core; C2 (box), square box core; GHF, gravity core with heat-flow temperature sensors attached; Grav, gravity core without thermal sensors; **, denotes successful determination of geothermal gradient]
Core IDLatitude
(deg)Longitude
(deg)Site name
Water depth
(m)
Core length
(m)PC
C2 (box)
GHF Grav Comments
MD02-2546 27.6157 -92.2470 Tunica Mound 595 31.21 *
MD02-2547GHF 27.6165 -92.2483 Tunica Mound 607 5.73 **
MD02-2548 27.6375 -92.1995 Tunica Mound 610 32.92 *
MD02-2550C2 26.9462 -91.3457 Orca Basin 2,249 9.09 *
MD02-2553C2 27.1835 -91.4167 Pigmy Basin 2,259 10.03 *
MD02-2554 27.7833 -91.4990 Bush Hill Basin 602 31.05 *
MD02-2555 27.7832 -91.4892 Bush Hill Basin 636 35.68 *
MD02-2556 27.7830 -91.4775 Bush Hill Basin 654 34.25 *
MD02-2557GHF-1 27.7830 -91.4987 Bush Hill Basin 613 7.59 **
MD02-2557GHF-2 27.7830 -91.4890 Bush Hill Basin 639 - **
MD02-2557GHF-3 27.7828 -91.4805 Bush Hill Basin 659 - **
MD02-2559 28.2225 -89.0882 Kane Spur 1,132 33.39 *
MD02-2560 28.2433 -89.1550 Kane Spur 1,029 28.24 *
MD02-2561 28.2052 -89.0202 Kane Spur 1,268 28.8 *
MD02-2562 28.0798 -89.1402 Kane Spur 1,051 26.09 *
MD02-2563C2 28.1233 -89.1363 MC853 Diapir 1,070 3.86 * recovered hy-drate (gas bubbles)
MD02-2564GHF-1 28.2433 -89.1545 Kane Spur 1,027 7.63 **
MD02-2564GHF-2 28.2223 -89.0883 Kane Spur 1,261 - **
MD02-2564GHF-3 28.2052 -89.0200 Kane Spur 1,269 - **
MD02-2564GHF-4 28.2070 -89.0200 Kane Spur 1,269 - **
MD02-2565 28.1235 -89.1395 MC853 Diapir 1,068 22.5 * recovered hydrate
MD02-2566 28.1192 -89.1032 Kane Spur 1,186 26.05 *
MD02-2567 28.1002 -89.0198 Kane Spur 1,318 26.65 *
MD02-2568GHF-1 28.0790 -89.1400 MC853 Diapir 1,049 6.96 **
MD02-2568GHF-2 28.0810 -89.1370 MC853 Diapir 1,057 - **
MD02-2568GHF-3 28.1193 -89.1030 MC853 Diapir 1,190 - **
MD02-2568GHF-4 28.1233 -89.1395 MC853 Diapir 1,068 - *
MD02-2568GHF-5 28.1235 -89.1362 MC853 Diapir 1,049 - *
MD02-2569 28.1522 -89.4797 Mississippi Canyon
1,032 10.35 * recovered hydrate
MD02-2570 28.0710 -89.6898 West Mississippi 631 28.35 *
MD02-2571C2 28.0667 -89.7192 West Mississippi 664 10.38 *
MD02-2572GHF 28.0710 -89.6897 West Mississippi 628 4.9 **
MD02-2573GHF 28.1520 -89.4798 Mississippi Canyon
1,027 4.2 * recovered hydrate
MD02-2574 28.6267 -88.2248 East Mississippi 1,963 32.28 *
Note: Cores obtained during the cruise that are not listed in this table and cores MD02-2548 in Tunica Mound, MD02-2550C2 in Orca Basin, and MD02-2574 in East Mississippi region are IMAGES/PAGE cores, not dedicated USGS cores.
Physical Properties 4-9

Table 2. Statistical information on sediment properties.
[ppt, parts per thousand; WCtc, water content based on total sample mass corrected for salinity; %, percent; WCsc, water content based on solids mass corrected for salinity; ρsc, grain density corrected for salinity; g/cm3, grams per cubic centimeter; n, porosity; e, void ratio; ρw, wet bulk density; ρd, dry bulk density; γw, wet unit weight; kN/m3, kiloNewton per cubic meter; γd, dry unit weight; γsub, submerged unit weight; min, minimum; max, maximum; stnd dev, standard deviation; Svs, vane shear strength; kPa, kilopascal; Spp, pocket penetrometer strength; Stv, Torvane strength; ER, electrical resistivity; FF, formation factor; TC, total carbon; H, hydro-gen; N, nitrogen; OC, organic carbon; ON, organic nitrogen; IC, inorganic carbon; IN, inorganic nitrogen]
Salinity (ppt) WCtc (%) WCsc (%) ρsc (g/cm3) n (%) e ρw (g/cm3)
min 21.3 32.4 47.8 2.36 55.7 1.26 1.31
max 305.9 88.9 800.7 3.52 95.7 22.34 1.77
range 284.6 56.6 752.9 1.16 40 21.08 0.46
mean 47.7 45.8 94.9 2.7 68.1 2.47 1.57
median 36.7 43.1 75.6 2.7 66.3 1.97 1.59
stnd dev 42.6 9.6 72.6 0.08 7.6 1.92 0.12
ρd (g/cm3) γw (kN/m3) γd (kN/m3) γsub (kN/m3) Svs (kPa) Spp (kPa) Stv (kPa)
min 0.15 12.83 1.44 0.9 6.1 0 0
max 1.2 17.36 11.74 7.28 100 196 49
range 1.05 4.53 10.3 6.38 93.9 196 49
mean 0.86 15.37 8.43 5.2 34.5 15.1 17.1
median 0.91 15.63 8.91 5.5 30.2 8.2 15.7
stnd dev 0.21 1.2 2.03 1.28 19.4 23.9 10.9
ER (ohm-m) FFGrain size
TC (%)Gravel (%) Sand (%) Silt (%) Clay (%)
min 0.26 1.22 0 0.01 5.17 53.81 0.92
max 1.06 5.08 15.18 6.54 40.02 94.71 5.83
range 0.81 3.86 15.18 6.53 34.85 40.9 4.91
mean 0.59 2.8 0.13 0.73 22.32 76.81 2.58
median 0.59 2.83 0 0.24 22.1 76.7 2.61
stnd dev 0.14 0.65 1.24 1.15 7.75 7.76 0.69
H (%) N (%) OC (%) ON (%) IC (%) IN (%)
min 0.22 0.04 0.49 0 0.15 -0.06
max 0.89 0.17 2.19 0.12 4.08 0.08
range 0.67 0.13 1.7 0.12 3.93 0.14
mean 0.56 0.08 1.17 0.07 1.42 0.01
median 0.57 0.07 1.19 0.07 1.41 0.01
stnd dev 0.12 0.03 0.33 0.02 0.56 0.03
4-10 Initial Report of the IMAGES VIII/PAGE 127 Gas Hydrate and Paleoclimate Cruise in the Gulf of Mexico, 2–18 July 2002

Table 3. Equations for physical properties.
[WCsc, water content related to solid grains corrected for pore-water salinity; SD, subbottom depth (mbsf, meters below sea floor); n, porosity; ρw, wet bulk density; Svs, vane-shear strength; Spp, pocket penetrometer strength; Stv, Torvane strength; ER, electrical resistivity; FF, formation factor]
Parameter(s) Core(s)/Comments R Equation
WCsc (%) SD<15 mbsf; WCsc < 200 % 0.79 SD (mbsf) = 98897 * WCsc ^(-2.1134)
n (%) SD < 15 mbsf 0.741 SD (mbsf) = 8.859e + 15 * n ^(-8.2159)
ρw (g/cm3) SD < 15 mbsf 0.736 SD (mbsf) = 7.3719e-05 * e^(7.4019ρw)
Svs (kPa) All 0.831 Svs (kPa) = [SD (mbsf) - 0.55]/0.41
Spp (kPa) 0<Spp<18 kPa 0.761 Spp (kPa) = [SD (mbsf) - 0.31]/1.75
Stv (kPa) All 0.868 Stv (kPa) = [SD (mbsf) - 1.61]/0.77
ER (ohm-m) All cores (SD > 5 mbsf) 0.611 SD (mbsf) = 52.769 * ER^(3.0051)
FF All cores (SD > 5 mbsf) 0.612 SD (mbsf) = 0.49145 * FF^(2.9831)
Both water content and porosity decrease significantly between the sea floor and about 10 meters below sea floor (mbsf) (figs. 6–8). Below about 10 mbsf, both properties decrease at a lower rate. The high water content and porosity values near the sea floor may be related to electro-chemical effects between fine-grained particles (with high specific sur-face) at subbottom depths too shallow for normal compaction to occur (Francisca and others, 2005). This probably is a more accurate explanation for the non-linear sediment behavior as opposed to subbottom depth than disturbance caused by the piston-coring technique for a number of reasons: (1) the sedi-
ment characteristics are widespread even in sediment obtained with other coring methods, (2) the grain size is too fine to allow quick changes in water content, (3) strength measure-ments do not exhibit a similar asymptotic decrease in strength near the sea floor, and (4) the stratigraphic descriptions do not indicate a pervasive disturbed region of sediment in the tops of cores. An exponential curve fit (table 3) for samples shallower than 15 mbsf is in contrast with the linear fit of Bryant and Trabant (1972).
Derived index properties, such as void ratio (fig. 9) and wet bulk density (fig. 10), show trends related to the normal
Figure 6. Water content, WCsc, for all cores in relation to subbottom depth.
Figure 7. Water content, WCsc, (less than 200 percent) in relation to subbottom depth.
Physical Properties 4-11
0
5
10
15
20
25
30
35
400 200 400 600 800 1000
Water Content (all cores)
Subb
otto
m d
epth
(mbs
f)
WCsc (%)
0
5
10
15
20
25
30
35
400 50 100 150 200
Water Content (all cores)
y = 98897 * x^(-2.1134) R= 0.79046
Subb
otto
m d
epth
(mbs
f)
WCsc (%)

Figure 8. Porosity in relation to subbottom depth.
Figure 10. Wet bulk density in relation to subbottom depth. Figure 11. Grain density in relation to subbottom depth.
4-12 Initial Report of the IMAGES VIII/PAGE 127 Gas Hydrate and Paleoclimate Cruise in the Gulf of Mexico, 2–18 July 2002
compaction process, as expected. Void ratio decreases and bulk density increases with depth below the sea floor. Grain density ranges from 2.36 to 3.53 grams per cubic centimeter (g/cm3) (fig. 11), with a mean and median of 2.7 g/cm3. Many of the outliers are related to the presence of hyper-saline pore water. At high salinity values, assumptions such as salt density (2.17 g/cm3) have a much more pronounced effect and can
produce considerable uncertainty in calculated values. These extreme values in grain density probably are not real, and caution should be exercised in using values from core MD02-2550C2 from Orca Basin. The values are only reported here because of the uniqueness of the environment from which the core was obtained.
0
5
10
15
20
25
30
35
4050 60 70 80 90 100
Porosity (all cores)
y = 8.859e+15 * x^(-8.2159) R= 0.7407
Su
bb
ott
om
dep
th (
mb
sf)
Porosity (%)
0
5
10
15
20
25
30
35
401.3 1.4 1.5 1.6 1.7 1.8
Wet Bulk Density (all cores)
y = 7.3719e-05 * e^(7.4019x) R= 0.73579
Su
bb
ott
om
dep
th (
mb
sf)
Wet bulk density (g/cm3)
0
5
10
15
20
25
30
35
402.2 2.4 2.6 2.8 3 3.2 3.4 3.6
Grain Density (all cores)
Su
bb
ott
om
dep
th (
mb
sf)
Grain density (g/cm3)
Figure 9. Void ratio in relation to subbottom depth.
0
5
10
15
20
25
30
35
401 1.5 2 2.5 3 3.5 4 4.5 5
Void Ratio (all cores)
Su
bb
ott
om
dep
th (
mb
sf)
Void Ratio

To determine if regional variability occurs in physical properties, water content (figs. 12–17) and porosity (figs. 18–23) profiles from each study area were plotted individually. The change in slope of physical property profiles that occurs between 10 and 15 mbsf is nearly universal across the northern Gulf of Mexico and within each study area. Cores from Orca and Pigmy Basins were not long enough to determine if this sediment behavior is present at those locations. In the Missis-sippi Canyon, the effect of overburden removal is apparent in the low water content values of core MD02-2569 to a subbot-tom depth of 10 mbsf.
MSCL results (Appendix H) corroborate the same break in property slope between 10 and 15 mbsf in 9 of 13 of the longer cores. Magnetic susceptibility changes between 10 and 13 mbsf in 7 to 8 of the cores. However, because the indirectly measured values from the MSCL in most cases were not checked by independent physical tests, the data should be used with caution. For example, values of wet bulk density deter-mined with the MSCL were routinely greater than 2.0 g/cm3, whereas the maximum value determined by oven drying was 1.77 g/cm3.
Shear Strength
Mini-vane shear strength values range from little or no strength close to the sea floor to as much as 100 kPa near the base of longer piston cores (tables 2; 5, p. 39). Each of the three methods—mini-vane, pocket penetrometer, and Tor-vane—produced strength values within fairly well-defined
Figure 12. Water content, WCsc, in relation to subbottom depth in the Tunica Mound region.
Figure 13. Water content, WCsc, in relation to subbottom depth in the Orca and Pigmy Basins region.
Figure 14. Water content, WCsc, in relation to subbottom depth in the Bush Hill region.
Physical Properties 4-13
0
5
10
15
20
25
30
35
4050 100 150 200
Tunica Mound
25352536GHF25372538G253925412542GHF2545G2546
Su
bb
ott
om
dep
th (
mb
sf)
WCsc (%)
0
2
4
6
8
10
120 200 400 600 800 1000
Orca and Pigmy Basins
2550C22553C2
Su
bb
ott
om
dep
th (
mb
sf)
WCsc (%)
Orca Basin
Pigmy Basin
0
5
10
15
20
25
30
35
4040 60 80 100 120 140 160 180
Bush Hill
2554
2555
2556
Su
bb
ott
om
dep
th (
mb
sf)
WCsc (%)

Figure 15. Water content, WCsc, in relation to subbottom depth in the overall Mississippi Canyon region.
Figure 16. Water content, WCsc, in relation to subbottom depth in West of the Mississippi Canyon (MC), in the Mississippi Canyon, and at the MC853 diapir.
Figure 17. Water content, WCsc, in relation to subbottom depth in the Kane Spur region.
Figure 18. Porosity in relation to subbottom depth in the Tunica Mound region.
4-14 Initial Report of the IMAGES VIII/PAGE 127 Gas Hydrate and Paleoclimate Cruise in the Gulf of Mexico, 2–18 July 2002
0
5
10
15
20
25
30
3540 60 80 100 120 140 160 180 200
Mississippi Canyon Region
25592560256125622563C22567256925702571C2
Su
bb
ott
om
dep
th (
mb
sf)
WCsc (%)
0
5
10
15
20
25
3040 60 80 100 120 140 160
Mississippi Canyon Region
MC853 Diapir, MC, West MC
2563C2256925702571C2
Su
bb
ott
om
dep
th (
mb
sf)
WCsc (%)
0
5
10
15
20
25
30
3540 60 80 100 120 140 160 180 200
Mississippi Canyon Region
Kane Spur
25592560256125622567
Su
bb
ott
om
dep
th (
mb
sf)
WCsc (%)
0
5
10
15
20
25
30
35
4055 60 65 70 75 80 85
Tunica Mound
25352536GHF25372538G253925412542GHF2545G2546
Su
bb
ott
om
dep
th (
mb
sf)
Porosity (%)

Figure 22. Porosity in relation to subbottom depth in West of the Mississippi Canyon (MC), in the Mississippi Canyon, and at the MC853 diapir.
Figure 19. Porosity in relation to subbottom depth in the Orca and Pigmy Basins region.
Figure 20. Porosity in relation to subbottom depth in the Bush Hill region.
Figure 21. Porosity in relation to subbottom depth in the overall Mississippi Canyon region.
Physical Properties 4-15
0
2
4
6
8
10
1265 70 75 80 85 90 95 100
Orca and Pigmy Basins
2550C22553C2
Su
bb
ott
om
dep
th (
mb
sf)
Porosity (%)
Orca Basin
Pigmy Basin
0
5
10
15
20
25
30
35
4055 60 65 70 75 80 85
Bush Hill
2554
25552556
Su
bb
ott
om
dep
th (
mb
sf)
Porosity (%)
0
5
10
15
20
25
30
3555 60 65 70 75 80 85
Mississippi Canyon Region
25592560256125622563C22567256925702571C2
Su
bb
ott
om
dep
th (
mb
sf)
Porosity (%)
0
5
10
15
20
25
3060 65 70 75 80
Mississippi Canyon Region
MC853 Diapir, MC, West MC
2563C2256925702571C2
Su
bb
ott
om
dep
th (
mb
sf)
Porosity (%)

Figure 23. Porosity in relation to subbottom depth in the Kane Spur region.
Figure 24. Shear strength results for all cores produced with a pocket penetrometer (Spp), Torvane (Stv), and a mini-vane (Svs), device in relation to subbottom depth.
zones related to subbottom depth (figs. 24–27). Except for some outlying values produced with the pocket penetrometer, the mini-vane strength test invariably produced higher strength results than the other methods. This may be due to its deeper penetration measuring the strength in zones away from the dis-turbed surface of the split core. We do not have any explana-tion for the occasional high strength values produced with the pocket penetrometer. Perhaps these values are related to the presence of carbonate or a diagenetic effect in the sediment. In some offshore areas, including the Gulf of Mexico, shear strength values can be related to sedimentation rate (Moore, 1964; Keller, 1974).
Linear regression analysis between the strength mea-surements and subbottom depth indicates that shear strength increases with subbottom depth likely are a result of the nor-mal compaction process. Although we determined a linear fit for the strength data in a similar manner to Bryant and Trabant (1972), our strength values were lower near the sea floor and increased more rapidly with subbottom depth. The weaker zone near the sea floor may reflect the presence of higher water content.
Figure 25. Vane-shear strength (Svs) in relation to subbottom depth for all cores.
4-16 Initial Report of the IMAGES VIII/PAGE 127 Gas Hydrate and Paleoclimate Cruise in the Gulf of Mexico, 2–18 July 2002
0
5
10
15
20
25
30
3555 60 65 70 75 80 85
Mississippi Canyon Region
Kane Spur
25592560256125622567
Su
bb
ott
om
dep
th (
mb
sf)
Porosity (%)
0
5
10
15
20
25
30
35
400 50 100 150 200
Dep
th (
mb
sf)
Spp, Stv, Svs (kPa)
Spp Stv Svs
0
5
10
15
20
25
30
35
400 20 40 60 80 100 120
y = 0.54836 + 0.40846x R= 0.83052
Su
bb
ott
om
dep
th (
mb
sf)
Svs (kPa)
Svs (kPa) = [SD (mbsf) - 0.548]/0.41
Svs (all cores)

Figure 27. Pocket penetrometer strength (Spp) less than 18 kilopascals (kPa) in relation to subbottom depth.
Figure 26. Torvane strength (Stv) in relation to subbottom depth for all cores.
Shear strength measurements were plotted for each of the main study areas (figs. 28–32). Because mini-vane tests were not possible with box cores, the pocket penetrometer strength was plotted for Orca Basin (fig. 29). The following shear strength characteristics were observed:
At Tunica Mound, the shear strength for core MD02-2545 1. (fig. 28), located near the crest of a mound at one end of the coring transect (fig. 2), is stronger than those of nearby cores.
Although Orca Basin has very high pore-water salinity, 2. it does not appear to have pocket penetrometer strengths (fig. 29) significantly different from other cores (fig. 27).
Shear strengths are uniformly consistent at Bush Hill even 3. though the cores were obtained at different water depths (fig. 3).
Core MD02-2570 on the western flank of the Mississippi 4. Canyon is significantly weaker (fig. 31) than the uniform grouping of cores from Kane Spur located on the eastern side of the Mississippi Canyon (fig. 32).
Figure 28. Vane-shear strength (Svs) in relation to subbottom depth for Tunica Mound.
Physical Properties 4-17
0
5
10
15
20
25
30
35
400 10 20 30 40 50
Stv (all cores)
y = 1.611 + 0.77286x R= 0.86761
Su
bb
ott
om
dep
th (
mb
sf)
Stv (kPa)
Stv (kPa) = [SD (mbsf)-1.61]/0.77
0
5
10
15
20
25
30
350 2 4 6 8 10 12 14 16
Spp (0<Spp<18 kPa)
y = 0.31348 + 1.7457x R= 0.76153
Su
bb
ott
om
dep
th (
mb
sf)
Spp (kPa)
Spp (kPa) = [SD (mbsf) - 0.31]/1.75
0
5
10
15
20
25
30
35
400 20 40 60 80 100 120
Tunica Mound
253525362537253825392541254225452546
Su
bb
ott
om
dep
th (
mb
sf)
Svs (kPa)

Figure 32. Vane-shear strength (Svs) in relation to subbottom depth for Kane Spur.
Figure 29. Pocket penetrometer strength (Spp) in relation to subbottom depth for Orca Basin.
Figure 30. Vane-shear strength (Svs) in relation to subbottom depth for Bush Hill.
Figure 31. Vane-shear strength (Svs) in relation to subbottom depth for west of the Mississippi Canyon.
4-18 Initial Report of the IMAGES VIII/PAGE 127 Gas Hydrate and Paleoclimate Cruise in the Gulf of Mexico, 2–18 July 2002
0
2
4
6
8
100 2 4 6 8 10 12
2550C2
Su
bb
ott
om
dep
th (
mb
sf)
Spp (kPa)
Orca Basin
0
5
10
15
20
25
30
35
400 10 20 30 40 50 60
Bush Hill
2554
2555
2556
Su
bb
ott
om
Dep
th (
mb
sf)
Svs (kPa)
0
5
10
15
20
25
300 5 10 15 20 25 30 35 40
W. Mississippi
2570
Su
bb
ott
om
dep
th (
mb
sf)
Svs (kPa)
0
5
10
15
20
25
30
350 10 20 30 40 50 60 70 80
Kane Spur
255925602561256225662567
Su
bb
ott
om
dep
th (
mb
sf)
Svs (kPa)

Electrical Resistivity
Although electrical resistivity for natural geologic materi-als ranges from close to that of seawater (0.18 to 0.24 ohm-m) to greater than 2,400 ohm-m (Hunt, 1984), the entire data set from the northern Gulf of Mexico only ranges from 0.26 to 1.06 ohm-m, with a mean value of 0.59 ohm-m (tables 2; 6, p. 49). As a result of higher water content, these values are somewhat lower than those reported for sediments rich in clay, which have resistivity values ranging from 3 to 100 ohm-m (Sharma, 1997) and from 3 to 15 ohm-m (Hunt, 1984). As anticipated, electrical resistivity and formation factor values increase with depth (figs. 33 and 34) because of the decrease in water content and porosity.
Grain Size
Grain-size analyses were performed on 147 sediment samples from various subbottom depths in 29 cores (tables 7, p. 59, and 8). According to the Wentworth grade scale (Wentworth, 1929) and the Shepard classification scheme (Shepard, 1954), 56 percent of the samples classify as clay and the remaining classify as silty clay (figs. 35 and 36), with the exception of one sample that classifies as gravelly (Schlee, 1973). Full grain-size distribution curves are presented in figure 37 for six samples from throughout the northern Gulf of Mexico (table 8). Grain sizes (gravel, sand, silt, and clay) are distributed in wide, but uniform bands with subbottom depth (fig. 38) and are a byproduct of rapid sedimentation rates (Bouma and others, 1990). The uniform nature of the sediment texture is a contributing factor to the uniformity of physical properties across the northern Gulf of Mexico.
Visual observations indicate that the lithology of sedi-ment containing gas hydrate was not substantially different from that of adjacent material. This is in contrast to other studies where hydrate was concentrated in coarser-grained sediment (for example, Winters and others (1999); Dallimore and others (2002); Matsumoto and others (2004)).
Figure 34. Formation factor in relation to subbottom depth.
Figure 33. Electrical resistivity in relation to subbottom depth.
Physical Properties 4-19
0
5
10
15
20
25
30
35
400.2 0.4 0.6 0.8 1 1.2
Electrical Resistivity (all cores)
y = 52.769 * x^(3.0051) R= 0.61072
Su
bb
ott
om
dep
th (
mb
sf)
Electrical Resistivity (ohm-m)
0
5
10
15
20
25
30
35
401 2 3 4 5 6
Formation Factor (all cores)
y = 0.49145 * x^(2.9831) R= 0.61225
Su
bb
ott
om
dep
th (
mb
sf)
Formation Factor

Table 8. Grain-size distributions.
[Values are in phi sizes. STDEV, standard deviation; SKEW, skewness; KURT, kurtosis; M1PHI, mode 1 phi size; M1FRQ, mode 1 frequency; Cfp3, cumulative frequency percent of 3 phi size class; Cfpm3, cumulative frequency percent of –3 phi size; Fp4, frequency percent of 4 phi size class; Fpm4, frequency percent of –4 phi size]
CORESUBBOT DEPTH
(m)
WATER DEPTH
(m)
GRVL (%)
SAND (%)SILT (%)
CLAY (%)
SHEPARD CLASS
MEDIAN MEAN STDEV SKEW
2537 5.2 600 0.00 0.50 15.89 83.60 CLAY 10.29 9.64 1.56 -1.14
2553 5.01 2,259 0.00 0.01 11.10 88.89 CLAY 10.28 9.80 1.24 -1.05
2554 5.18 602 0.00 0.16 5.17 94.67 CLAY 10.43 10.14 1.10 -2.01
2565 6.315 1,068 0.06 0.35 19.54 79.98 CLAY 10.2 9.47 1.58 -0.90
2569 4.215 1,032 0.00 1.57 24.96 73.49 SILTY CLAY 10.17 9.09 2.05 -0.63
2570 5.13 631 0.00 0.07 5.21 94.71 CLAY 10.31 9.99 0.96 -1.39
CORE KURT M1PHI M1FRQ M2PHI M2FRQ M3PHI M3FRQ Modes Cfp11 Cfp10 Cfp9
2537 5.90 7.50 7.7 0.00 0.0 0.00 0.0 1.00 99.99 29.68 23.21
2553 3.62 0.00 0.0 0.00 0.0 0.00 0.0 0.00 100 30.45 20.17
2554 15.53 0.00 0.0 0.00 0.0 0.00 0.0 0.00 100 12.70 9.51
2565 4.03 6.50 8.8 0.00 0.0 0.00 0.0 1.00 100 37.40 28.30
2569 0.21 5.50 7.0 7.50 7.0 0.00 0.0 2.00 100.02 39.72 32.80
2570 9.35 0.00 0.0 0.00 0.0 0.00 0.0 0.00 100 27.01 16.07
CORE Cfp8 Cfp7 Cfp6 Cfp5 Cfp4 Cfp3 Cfp2 Cfp1 Cfp0 Cfpm1 Cfpm2
2537 16.39 8.70 3.97 1.93 0.50 0.40 0.32 0.24 0.22 0.00 0.00
2553 11.11 5.24 2.17 0.59 0.01 0.01 0.01 0.00 0.00 0.00 0.00
2554 5.33 4.17 3.35 0.85 0.16 0.10 0.06 0.02 0.00 0.00 0.00
2565 20.02 11.67 2.89 0.55 0.48 0.42 0.39 0.26 0.09 0.06 0.00
2569 26.53 19.51 13.55 6.53 1.57 0.18 0.09 0.04 0.02 0.00 0.00
2570 5.29 1.34 0.99 0.33 0.08 0.05 0.03 0.02 0.00 0.00 0.00
CORE Cfpm3 Cfpm4 Cfpm5 Fp11 Fp10 Fp9 Fp8 Fp7 Fp6 Fp5 Fp4
2537 0.00 0.00 0.00 70.31 6.47 6.82 7.69 4.73 2.04 1.43 0.10
2553 0.00 0.00 0.00 69.55 10.28 9.06 5.87 3.07 1.58 0.58 0.00
2554 0.00 0.00 0.00 87.30 3.19 4.18 1.16 0.82 2.50 0.69 0.06
2565 0.00 0.00 0.00 62.60 9.10 8.28 8.35 8.78 2.34 0.07 0.06
2569 0.00 0.00 0.00 60.30 6.92 6.27 7.02 5.96 7.02 4.96 1.39
2570 0.00 0.00 0.00 72.99 10.94 10.78 3.95 0.35 0.66 0.25 0.03
CORE Fp3 Fp2 Fp1 Fp0 Fpm1 Fpm2 Fpm3 Fpm4 Fpm5
2537 0.08 0.08 0.02 0.22 0.00 0.00 0.00 0.00 0.00
2553 0.00 0.01 0.00 0.00 0.00 0.00 0.00 0.00 0.00
2554 0.04 0.04 0.02 0.00 0.00 0.00 0.00 0.00 0.00
2565 0.03 0.13 0.17 0.03 0.06 0.00 0.00 0.00 0.00
2569 0.09 0.05 0.02 0.02 0.00 0.00 0.00 0.00 0.00
2570 0.02 0.01 0.02 0.00 0.00 0.00 0.00 0.00 0.00
4-20 Initial Report of the IMAGES VIII/PAGE 127 Gas Hydrate and Paleoclimate Cruise in the Gulf of Mexico, 2–18 July 2002

Table 8. Grain-size distributions.
[Values are in phi sizes. STDEV, standard deviation; SKEW, skewness; KURT, kurtosis; M1PHI, mode 1 phi size; M1FRQ, mode 1 frequency; Cfp3, cumulative frequency percent of 3 phi size class; Cfpm3, cumulative frequency percent of –3 phi size; Fp4, frequency percent of 4 phi size class; Fpm4, frequency percent of –4 phi size]
CORESUBBOT DEPTH
(m)
WATER DEPTH
(m)
GRVL (%)
SAND (%)SILT (%)
CLAY (%)
SHEPARD CLASS
MEDIAN MEAN STDEV SKEW
2537 5.2 600 0.00 0.50 15.89 83.60 CLAY 10.29 9.64 1.56 -1.14
2553 5.01 2,259 0.00 0.01 11.10 88.89 CLAY 10.28 9.80 1.24 -1.05
2554 5.18 602 0.00 0.16 5.17 94.67 CLAY 10.43 10.14 1.10 -2.01
2565 6.315 1,068 0.06 0.35 19.54 79.98 CLAY 10.2 9.47 1.58 -0.90
2569 4.215 1,032 0.00 1.57 24.96 73.49 SILTY CLAY 10.17 9.09 2.05 -0.63
2570 5.13 631 0.00 0.07 5.21 94.71 CLAY 10.31 9.99 0.96 -1.39
CORE KURT M1PHI M1FRQ M2PHI M2FRQ M3PHI M3FRQ Modes Cfp11 Cfp10 Cfp9
2537 5.90 7.50 7.7 0.00 0.0 0.00 0.0 1.00 99.99 29.68 23.21
2553 3.62 0.00 0.0 0.00 0.0 0.00 0.0 0.00 100 30.45 20.17
2554 15.53 0.00 0.0 0.00 0.0 0.00 0.0 0.00 100 12.70 9.51
2565 4.03 6.50 8.8 0.00 0.0 0.00 0.0 1.00 100 37.40 28.30
2569 0.21 5.50 7.0 7.50 7.0 0.00 0.0 2.00 100.02 39.72 32.80
2570 9.35 0.00 0.0 0.00 0.0 0.00 0.0 0.00 100 27.01 16.07
CORE Cfp8 Cfp7 Cfp6 Cfp5 Cfp4 Cfp3 Cfp2 Cfp1 Cfp0 Cfpm1 Cfpm2
2537 16.39 8.70 3.97 1.93 0.50 0.40 0.32 0.24 0.22 0.00 0.00
2553 11.11 5.24 2.17 0.59 0.01 0.01 0.01 0.00 0.00 0.00 0.00
2554 5.33 4.17 3.35 0.85 0.16 0.10 0.06 0.02 0.00 0.00 0.00
2565 20.02 11.67 2.89 0.55 0.48 0.42 0.39 0.26 0.09 0.06 0.00
2569 26.53 19.51 13.55 6.53 1.57 0.18 0.09 0.04 0.02 0.00 0.00
2570 5.29 1.34 0.99 0.33 0.08 0.05 0.03 0.02 0.00 0.00 0.00
CORE Cfpm3 Cfpm4 Cfpm5 Fp11 Fp10 Fp9 Fp8 Fp7 Fp6 Fp5 Fp4
2537 0.00 0.00 0.00 70.31 6.47 6.82 7.69 4.73 2.04 1.43 0.10
2553 0.00 0.00 0.00 69.55 10.28 9.06 5.87 3.07 1.58 0.58 0.00
2554 0.00 0.00 0.00 87.30 3.19 4.18 1.16 0.82 2.50 0.69 0.06
2565 0.00 0.00 0.00 62.60 9.10 8.28 8.35 8.78 2.34 0.07 0.06
2569 0.00 0.00 0.00 60.30 6.92 6.27 7.02 5.96 7.02 4.96 1.39
2570 0.00 0.00 0.00 72.99 10.94 10.78 3.95 0.35 0.66 0.25 0.03
CORE Fp3 Fp2 Fp1 Fp0 Fpm1 Fpm2 Fpm3 Fpm4 Fpm5
2537 0.08 0.08 0.02 0.22 0.00 0.00 0.00 0.00 0.00
2553 0.00 0.01 0.00 0.00 0.00 0.00 0.00 0.00 0.00
2554 0.04 0.04 0.02 0.00 0.00 0.00 0.00 0.00 0.00
2565 0.03 0.13 0.17 0.03 0.06 0.00 0.00 0.00 0.00
2569 0.09 0.05 0.02 0.02 0.00 0.00 0.00 0.00 0.00
2570 0.02 0.01 0.02 0.00 0.00 0.00 0.00 0.00 0.00
Figure 35. Grain sizes, including sand, silt, and clay. Figure 36. Grain sizes, including gravel, sand, silt, and clay. Gravel has been added to the sand quantity for these six samples (table 7).
Figure 37. Grain-size distribution curves.
Physical Properties 4-21
25
50
75
25 50 75
25
50
75
Sand
Con
tent
(%)
Silt Content (%)
Clay C
ontent (%)
Clay
SandyClay
SiltyClay
ClayeySand
ClayeySilt
Sand+
Silt+
Clay
Sand SiltySand
SandySilt Silt
25
50
75
25 50 75
25
50
75
Sand
Con
tent
(%)
Silt Content (%)
Clay C
ontent (%)
Clay
SandyClay
SiltyClay
ClayeySand
ClayeySilt
Sand+
Silt+
Clay
Sand SiltySand
SandySilt Silt
110100100010000
0
10
20
30
40
50
60
70
80
90
100
Grain Size (µm)
−5 −4 −3 −2 −1 0 1 2 3 4 5 6 7 8 9 10 11 12 130
10
20
30
40
50
60
70
80
90
100
φ
% F
iner
AT440AT478AT532AT560AT566AT585
PEBBLES SAND SILT CLAY
Coa
rse
Med
ium
Fine Ver
yFi
ne
Ver
yC
oars
e
Coa
rse
Med
ium
Fine Ver
yFi
ne
Coa
rse
Med
ium
Fine Ver
yFi
ne

Figure 38. Grain size, including gravel, sand, silt, and clay in relation to subbottom depth.
Organic Carbon Content
Carbon and nitrogen content were determined in 144 sediment samples from 27 cores at various subbottom depths (table 9). All components are present in small quantities within the samples and are less than 5.8 percent of the total sample dry mass (table 2; fig. 39). Inorganic carbon, IC, (assumed to be carbonate) ranges from 0.15 to 2.8 percent (with a single measurement at 4.08 percent; fig. 40). The pres-ence of carbonate must be geographically localized because unlike some samples retrieved from nearby MC852, which contained carbonate contents over 70 percent (Francisca and others, 2005), cores obtained during this cruise contained much smaller amounts. Organic carbon, OC, ranges from 0.5 to 2.2 percent (fig. 41). Considering the high sedimenta-tion rates in the northern Gulf of Mexico (Bouma and others, 1990), this amount of organic carbon is sufficient to gener-ate some biogenic methane gas (G. Claypool, oral commun., 2005). Of course, thermogenic gas seeps are responsible for many of the widely known gas hydrate outcrops that have been documented in the Gulf of Mexico (Brooks and others, 1984; MacDonald and others, 1994; Sassen, 2001).
Table 9. Geochemistry results. — Continued
[CHN ID, carbon, hydrogen, nitrogen identification number; TC, total carbon; %, percent; N, nitrogen; OC, organic carbon; IC, inorganic carbon]
CHN ID CoreSubbottom depth (m)
TC (%) N (%) OC (%) IC (%)
1 2535 0.67 3.7 0.08 1.28 2.42
4 2535 5.18 2.56 0.06 0.76 1.8
7 2535 9.78 3.51 0.05 1.76 1.75
11 2535 15.72 2.68 0.06 0.72 1.96
14 2535 20.19 1.81 0.06 0.54 1.27
17 2535 24.76 0.96 0.07 0.61 0.35
20 2535 29.19 1.99 0.08 0.63 1.36
23 2535 33.6 1.12 0.07 0.51 0.61
1 2536GHF 0.64 2.53 0.09 1 1.53
6 2536GHF 8.18 2.58 0.07 1.01 1.57
1 2537 0.83 2.46 0.09 0.55 1.91
4 2537 5.2 2.35 0.07 1.43 0.92
9 2537 12.67 3.21 0.05 0.87 2.34
11 2537 15.79 3.8 0.04 1.05 2.75
14 2537 20.07 2.55 0.07 1.14 1.41
17 2537 24.58 1.69 0.05 1.16 0.53
20 2537 28.87 1.04 0.07 0.89 0.15
23 2537 33.08 1.84 0.07 0.52 1.32
1 2538G 0.65 3.15 0.1 0.97 2.18
5 2538G 6.67 3.28 0.06 1.56 1.73
4-22 Initial Report of the IMAGES VIII/PAGE 127 Gas Hydrate and Paleoclimate Cruise in the Gulf of Mexico, 2–18 July 2002
0
5
10
15
20
25
30
35
400 20 40 60 80 100
Grain Size Components (all cores)
Gravel (%)Sand (%)Silt (%)Clay (%)
Su
bb
ott
om
dep
th (
mb
sf)
Gravel, sand, silt, clay (%)

Table 9. Geochemistry results. — Continued
[CHN ID, carbon, hydrogen, nitrogen identification number; TC, total carbon; %, percent; N, nitrogen; OC, organic carbon; IC, inorganic carbon]
CHN ID CoreSubbottom depth (m)
TC (%) N (%) OC (%) IC (%)
1 2539 0.67 3.36 0.09 1.04 2.32
4 2539 5.17 2.69 0.07 1.06 1.63
7 2539 9.71 2.94 0.05 1.18 1.76
11 2539 15.68 3.51 0.05 1.31 2.2
14 2539 19.97 3.02 0.05 0.93 2.09
1 2540GHF 0.59 3.51 0.08 1 2.51
4 2540GHF 5.11 3.18 0.06 1.31 1.87
1 2541 0.55 3.7 0.08 1.02 2.68
4 2541 5.17 2.5 0.08 0.59 1.91
7 2541 9.67 2.92 0.07 1.17 1.76
11 2541 15.66 2.43 0.08 1.08 1.35
14 2541 20.18 2.93 0.07 0.75 2.18
20 2541 29.14 0.92 0.07 0.49 0.43
24 2541 34.88 1.06 0.08 0.57 0.49
5 2542GHF 6.77 2 0.07 0.61 1.39
1 2545G 0.37 3.68 0.1 0.99 2.69
6 2545G 5.27 2.02 0.07 0.86 1.16
10 2545G 9.16 3.2 0.06 1.8 1.4
1 2546 0.53 2.34 0.1 0.91 1.43
7 2546 9.58 2.79 0.07 0.52 2.27
11 2546 15.67 2.03 0.07 0.9 1.13
14 2546 20.28 3.31 0.05 1.49 1.82
17 2546 24.71 1.37 0.07 0.93 0.44
21 2546 30.57 1.79 0.08 0.49 1.3
1 2547GHF 0.72 2.24 0.1 0.83 1.41
4 2547GHF 4.98 2.74 0.07 1.09 1.65
1 2554 0.74 2.23 0.1 0.84 1.39
4 2554 5.18 2.34 0.12 1.54 0.8
7 2554 9.78 2.65 0.08 1.09 1.56
11 2554 15.58 2.32 0.07 0.83 1.49
14 2554 19.97 2.61 0.07 1.03 1.58
17 2554 24.29 2.6 0.07 1.12 1.48
21 2554 30.32 3.03 0.07 1.25 1.78
1 2555 1.08 2.54 0.1 1.42 1.12
4 2555 5.17 1.96 0.1 1.19 0.77
7 2555 9.67 2.65 0.08 1.52 1.13
11 2555 15.75 2.97 0.06 1.4 1.57
14 2555 20.21 2.52 0.06 1.55 0.97
18 2555 26.17 3.2 0.07 1.11 2.09
21 2555 30.67 3.09 0.07 1.24 1.85
22 2555 32.15 3.31 0.06 1.47 1.84
24 2555 35.05 3.22 0.06 1.3 1.92
Physical Properties 4-23

Table 9. Geochemistry results. — Continued
[CHN ID, carbon, hydrogen, nitrogen identification number; TC, total carbon; %, percent; N, nitrogen; OC, organic carbon; IC, inorganic carbon]
CHN ID CoreSubbottom depth (m)
TC (%) N (%) OC (%) IC (%)
1 2556 0.67 2.61 0.1 0.94 1.67
4 2556 5.17 2.08 0.1 1.35 0.73
7 2556 9.68 3.14 0.07 1.5 1.64
11 2556 15.38 2.67 0.05 1.15 1.52
14 2556 20.18 2.82 0.06 1.34 1.48
16 2556 23.27 3 0.07 1.35 1.65
17 2556 24.78 3.01 0.06 1.19 1.82
21 2556 30.67 2.92 0.07 1.3 1.62
23 2556 33.78 3.26 0.06 1.27 1.99
1 2557GHF 0.6 1.74 0.08 0.76 0.98
1 2559 0.21 1.47 0.09 0.78 0.69
4 2559 5.11 2.52 0.08 1.65 0.87
7 2559 9.54 2.54 0.08 1.3 1.25
11 2559 15.68 2.55 0.06 1.14 1.41
14 2559 20.08 2.33 0.08 1.21 1.12
17 2559 24.67 2.8 0.07 1.25 1.55
21 2559 30.65 3.29 0.06 1.65 1.64
23 2559 33.15 3.28 0.06 1.64 1.64
1 2560 0.57 2.74 0.11 0.92 1.82
11 2560 15.67 2.68 0.07 1.22 1.46
14 2560 20.09 2.78 0.06 1.4 1.38
17 2560 24.72 2.71 0.07 1.28 1.43
1 2561 0.61 3.47 0.1 1.25 2.22
4 2561 5.23 2.03 0.07 1.15 0.88
7 2561 9.68 2.23 0.07 1.08 1.15
11 2561 15.66 2.87 0.07 1.34 1.53
14 2561 20.15 2.75 0.07 1.23 1.53
19 2561 27.57 2.74 0.06 1.28 1.46
1 2562 0.48 1.81 0.06 1.06 0.75
4 2562 5.18 2.34 0.07 1.21 1.13
8 2562 10.97 2.82 0.07 1.33 1.49
11 2562 15.58 2.59 0.07 1.18 1.41
14 2562 20.31 2.9 0.07 1.31 1.59
18 2562 25.77 2.93 0.06 1.35 1.58
1 2564GHF 0.99 3.63 0.17 1.38 2.25
5 2564GHF 6.69 2.78 0.07 1.33 1.45
1 2565 0.025 2.42 0.1 1.5 0.92
2 2565 1.51 2.83 0.1 1.68 1.15
3 2565 3.01 2.43 0.1 1.57 0.86
4 2565 4.525 2.97 0.08 1.77 1.2
5 2565 6.315 2.6 0.09 1.5 1.1
6 2565 7.515 2.59 0.08 1.45 1.14
4-24 Initial Report of the IMAGES VIII/PAGE 127 Gas Hydrate and Paleoclimate Cruise in the Gulf of Mexico, 2–18 July 2002

Table 9. Geochemistry results. — Continued
[CHN ID, carbon, hydrogen, nitrogen identification number; TC, total carbon; %, percent; N, nitrogen; OC, organic carbon; IC, inorganic carbon]
CHN ID CoreSubbottom depth (m)
TC (%) N (%) OC (%) IC (%)
7 2565 9.015 2.47 0.1 1.37 1.1
8 2565 10.515 2.51 0.1 1.33 1.18
9 2565 12.015 2.59 0.09 1.45 1.14
10 2565 13.515 5.83 0.09 1.75 4.08
11 2565 15.015 2.46 0.1 1.44 1.02
12 2565 16.515 2.64 0.09 1.53 1.11
13 2565 18.015 2.75 0.08 1.41 1.34
14 2565 19.515 2.44 0.1 1.44 1
15 2565 21.015 2.54 0.09 1.4 1.14
16 2565 22.515 2.25 0.1 1.04 1.21
1 2566 0.57 2.79 0.14 1.01 1.79
4 2566 5.17 2 0.13 1.18 0.82
7 2566 9.68 2.81 0.14 1.61 1.2
11 2566 15.67 2.89 0.12 1.46 1.43
14 2566 20.15 3 0.12 1.48 1.52
18 2566 25.78 3.87 0.12 2.19 1.68
1 2567 0.53 3.09 0.14 1.03 2.06
4 2567 5.18 1.91 0.11 1.08 0.83
7 2567 9.68 2.3 0.11 1.16 1.14
11 2567 15.68 2.86 0.13 1.33 1.53
14 2567 20.18 2.5 0.12 1.33 1.17
18 2567 26.04 2.24 0.14 0.99 1.25
1 2568GHF 0.015 3.28 0.15 1.4 1.88
3 2568GHF 4.485 2.54 0.08 1.3 1.24
1 2569 0.015 1.46 0.1 0.9 0.56
2 2569 1.015 1.6 0.06 0.76 0.84
6 2569 4.215 1.22 0.07 0.74 0.48
7 2569 5.225 1.27 0.07 0.75 0.52
9 2569 7.385 1.39 0.07 0.84 0.55
10 2569 7.54 1.18 0.07 0.74 0.45
12 2569 9.935 1.25 0.07 0.71 0.54
1 2570 0.57 1.49 0.07 0.71 0.78
4 2570 5.13 2.2 0.07 1.15 1.05
7 2570 10.22 2.76 0.07 1.49 1.27
11 2570 15.69 2.17 0.08 1.3 0.87
15 2570 21.51 2.76 0.12 1.28 1.49
18 2570 26.1 2.64 0.14 1.21 1.43
1 2572GHF 0.015 2.27 0.17 0.92 1.35
2 2572GHF 1.515 3.25 0.16 1.4 1.85
3 2572GHF 1.805 3.35 0.16 1.98 1.37
Physical Properties 4-25

Figure 39. Carbon, hydrogen, and nitrogen content of sediment samples.
Figure 40. Carbon content of sediment samples.
Figure 41. Organic carbon content of sediment samples.
Conclusions Our results confirm that gas hydrates are present at dis-
crete locations in the northern Gulf of Mexico, but they do not appear to be pervasive. In other terrestrial and marine regions, gas hydrate has been recovered in coarser-grained sediment. In the northern Gulf of Mexico, however, factors other than lithology, such as gas quantity and composition, pore-water salinity, and geothermal gradient, likely play a significant role in determining where and how much, if any, gas hydrate is present.
With the exception of a core from Orca Basin contain-ing hyper-saline pore water, most cores possess physical properties that fall within wide, but predictable, bands. For example, almost all sediment classifies texturally as clay or silty clay. Such uniformity in properties is evidence of regionally pervasive depositional conditions. This is not to say that geologic conditions are currently uniform. Faulting, salt diapirs, directed fluid flow, and thermogenic gas seeps are all examples of localized processes occurring in the study region.
Nearly all texture samples were classified as clay or silty clay. In addition, the shipboard lithologic descriptions (Appen-dix F) indicate that few sandy layers were encountered during the cruise. Therefore, one of the challenges for developing gas hydrate in the Gulf of Mexico as a resource is to discover thick permeable coarse-grained layers containing substantial quantities of gas hydrate. However, from a hazards standpoint, the recovered pure hydrate layers would substantially increase pore pressure upon dissociation, thereby adversely affecting sea-floor stability.
4-26 Initial Report of the IMAGES VIII/PAGE 127 Gas Hydrate and Paleoclimate Cruise in the Gulf of Mexico, 2–18 July 2002
0
5
10
15
20
25
30
35
400 1 2 3 4 5 6
TC (%)H (%)N (%)OC (%)ON (%)IC (%)IN (%)
Subb
otto
m d
epth
(mbs
f)
CHN content (%)
Carbon and Nitrogen Content(all cores)
0
5
10
15
20
25
30
35
400 1 2 3 4 5 6
Carbon Content (all cores)
TC (%)OC (%)IC (%)
Su
bb
ott
om
dep
th (
mb
sf)
TC, OC, IC (%)
0
5
10
15
20
25
30
35
400 0.5 1 1.5 2 2.5
Organic Carbon (all cores)
Su
bb
ott
om
dep
th (
mb
sf)
OC (%)

Overall, physical properties show similar trends in the Tunica Mound, Bush Hill, and Mississippi Canyon regions. There is a pervasive break in slope of depth profiles of water content and related properties at 10 to 15 mbsf. This change in behavior is not believed to coincide with the last glacial maximum (Bout-Roumazeilles and Trentesaux, this volume, chapter 5) or with obvious textural changes.
The sedimentation rate, in conjunction with an ample amount of organic carbon, indicates that biogenic methane gas production is sufficient to form some gas hydrate at most locations. However, the fact that gas hydrate has not been per-vasively observed indicates that other factors control hydrate formation and distribution.
AcknowledgmentsCaptain Jean-Michel Nicolas and the crew of the RV
Marion Dufresne are thanked for their assistance in perform-ing shipboard activities. Cruise logistical support was provided by the French Polar Institute [Institut Polaire Francais − Paul-Emile Victor (IPEV)].
Considerable at-sea help was provided by an international group of approximately 40 scientists under the IMAGES and PAGE programs. The IMAGES program is an international effort to understand the mechanisms and consequences of climatic changes using the oceanic sedimentary record.
The following people provided assistance with laboratory testing and technical assistance with data compilation: Sandy Milbert, Lauren Gilbert, Dave Mason, and Mario Santos.
Financial support of U.S. Geological Survey (USGS)- related activities was provided by the USGS Coastal and Marine Geology Program, the USGS Energy Program, and the U.S. Department of Energy's Gas Hydrate Program.
The U.S. Minerals Management Service provided infor-mation used to determine core locations and avoid existing sea-floor infrastructure.
The Integrated Ocean Drilling Program provided facili-ties to store and archive recovered cores.
References Cited
American Society for Testing and Materials, 1997, Standard test method for specific gravity of solids by gas pycnometer D5550-94, Annual Book of ASTM Standards, v. 04.09, Soil and Rock: West Conshohocken, PA, American Society for Testing and Materials, p. 380–383.
Bouma, A.H., Roberts, H.H., and Coleman, J.M., 1990, Acoustical and geological characteristics of near-surface sediments, upper continental slope of northern Gulf of Mexico: Geo-Marine Letters, v. 10, p. 200–208.
Brooks, J.M., Kennicutt, M.C., II, Fay, R.R., McDonald, T.J., and Sassen, R., 1984, Thermogenic gas hydrates in the Gulf of Mexico: Science, v. 25, p. 409–411.
Bryant, W., and Trabant, P., 1972, Statistical relationships between geotechnical properties and Gulf of Mexico sedi-ments, in Offshore Technology Conference (OTC ), Hous-ton, TX, 1972, p. II/363–II/368.
Cooper, A.K., and Hart, P.E., 2002, High-resolution seismic-reflection investigation of the northern Gulf of Mexico gas-hydrate-stability zone: Marine and Petroleum Geology, v. 19, no. 10, p. 1275–1293.
Dallimore, S.R., Collett, T.S., Uchida, T., Weber, M., Taka-hashi, H., and Mallik Gas Hydrate Research Team, 2002, Overview of the 2002 Mallik gas hydrate production research well program: Fourth International Conference on Gas Hydrates, May 19–23, 2002, Yokohama, Japan, p. 36–39.
Francisca, F., Yun, T.-S., Ruppel, C., and Santamarina, J.C., 2005, Geophysical and geotechnical properties of near-sea-floor sediments in the northern Gulf of Mexico gas hydrate province: Earth and Planetary Science Letters, v. 237, p. 924-939.
Hewitt, A.T., 1998, PGC sediment physical properties manual—compilation: Ocean Mapping Group, Geodesy & Geomatics Engineering, University of New Brunswick.
Holtz, R.D., and Kovacs, W.D., 1981, An introduction to geo-technical engineering: Englewood Cliffs, NJ, Prentice-Hall, Inc., 733 p.
Hunt, R.E., 1984, Geotechnical engineering investigation manual: New York, McGraw-Hill Book Co., 983 p.
Keller, G., 1974, Marine geotechnical properties—interrela-tionships and relationships to depth of burial, in Inderbitzen, A., ed., Deep sea sediments: New York, Plenum Publishing Corp., p. 77–100.
Kvenvolden, K.A., and Lorenson, T.D., 2001, The global occurrence of natural gas hydrate, in Paull, C.K., and Dil-lon, W.P., eds., Natural gas hydrates—occurrence, distribu-tion, and detection: Washington, DC, American Geophysi-cal Union, Geophysical Monograph 124, p. 3–18.
Lambe, T.W., and Whitman, R.V., 1969, Soil mechanics: New York, John Wiley & Sons, 553 p.
MacDonald, I.R., Guinasso, N.L., Jr., Sassen, R., Brooks, J.M., Lee, L., and Scott, K.T., 1994, Gas hydrate that breaches the sea floor on the continental slope of the Gulf of Mexico: Geology (Boulder), v. 22, no. 8, p. 699–702.
Physical Properties 4-27

Matsumoto, R., Tomaru, H., and Lu, H., 2004, Detection and evaluation of gas hydrates in the Eastern Nankai Trough by geochemical and geophysical methods: Resource Geology, v. 54, no. 1, p. 53–67.
Moore, D., 1964, Shear strength and related properties of sedi-ments from Experimental Mohole (Guadalupe Site): Journal of Geophysical Research, v. 69, no. 20, p. 4271–4291.
Paull, C.K., Ussler, W., III, Lorenson, T., Winters, W., and Dougherty, J., 2005, Geochemical constraints on the distri-bution of gas hydrates in the Gulf of Mexico: Geo-Marine Letters, DOI 10.1007/s00367–005–001–3.
Sassen, R., 2001, Gas hydrates in the Gulf of Mexico; a geochemical perspective—Outer Continental Shelf report: Minerals Management Service, Report MMS 2001-082, p. 92-105.
Schlee, J., 1973, Atlantic Continental Shelf and Slope of the United States—sediment texture of the Northeastern Part: U.S. Geological Survey Professional Paper 529–L, 64 p.
Sharma, P.V., 1997, Environmental and Engineering Geophys-ics: Cambridge, UK, Cambridge University Press, 475 p.
Shepard, F.P., 1954, Nomenclature based on sand-silt-clay ratios: Journal of Sedimentary Petrology, v. 24, p. 151–158.
Syvitski, J.P.M., ed., 1991, Principles, methods, and applica-tion of particle size analysis: New York, Cambridge Univer-sity Press, 368 p.
Verardo, D.J., Froelich, P.N., and McIntyre, A., 1990, Deter-mination of organic carbon and nitrogen in marine sedi-ments using the Carlo Erba NA–1500 analyzer—Deep Sea Research Part A: Oceanographic Research Papers, v. 37, p. 157-165.
Wentworth, C.K., 1929, Method of computing mechanical composition of sediments: Geological Society of America Bulletin, v. 40, p. 771–790.
Winters, W.J., Dallimore, S.R., Collett, T.S., Katsube, T.J., Jenner, K.A., Cranston, R.E., Wright, J.F., Nixon, F.M., and Uchida, T., 1999, Physical properties of sediments from the JAPEX/JNOC/GSC Mallik 2L–38 gas hydrate research well: Bulletin, Geological Survey of Canada, Report 544, p. 95–100.
4-28 Initial Report of the IMAGES VIII/PAGE 127 Gas Hydrate and Paleoclimate Cruise in the Gulf of Mexico, 2–18 July 2002

Table 4. Water content and index properties. — Continued
[m, meters; Sal Est, salinity estimated; ppt, parts per thousand; WCt, water content based on total sample mass not corrected for salinity; %, percent; WCs, water content based on solids mass not corrected for salinity; WCtc, water content based on total sample mass corrected for salinity; WCsc, water content based on solids mass corrected for salinity; ρs, grain density not corrected for salinity; g/cm3, grams per cubic centimeter; ρsc, grain density corrected for salinity; n, porosity; e, void ratio; ρw, wet bulk density; ρd, dry bulk density; γw, wet unit weight; kN/m3, kiloNewton per cubic meter; γd, dry unit weight; γsub, submerged unit weight]
Core no.
Sec-tion
Mid-depth
(m)
Sal Est (ppt)
WCt (%)
WCs (%)
WCtc (%)
WCsc (%)
ρs (g/
cm3)
ρsc (g/
cm3)
n (%)
eρw (g/
cm3)
ρd (g/
cm3)
γw (kN/m3)
γd (kN/m3)
γsub (kN/m3)
2535 1 0.7 36 57.7 136.3 59.8 149 2.66 2.69 79.6 3.9 1.37 0.55 13.4 5.38 3.33
2535 2 2.2 36.1 61.1 157.1 63.4 173.2 2.64 2.67 81.8 4.5 1.33 0.49 13.01 4.76 2.93
2535 3 3.68 36.1 40.1 67 41.6 71.3 2.7 2.72 65.3 1.89 1.61 0.94 15.81 9.23 5.74
2535 4 5.2 36.3 48.7 95.1 50.6 102.4 2.67 2.7 72.9 2.69 1.48 0.73 14.52 7.17 4.44
2535 5 6.8 36.8 39.9 66.4 41.4 70.7 2.71 2.72 65.2 1.87 1.62 0.95 15.87 9.29 5.78
2535 6 8.5 37 37.3 59.4 38.7 63.1 2.71 2.72 62.6 1.67 1.66 1.02 16.31 10 6.22
2535 7 9.8 36.9 38.3 62.1 39.8 66 2.7 2.71 63.5 1.74 1.64 0.99 16.11 9.71 6.03
2535 8 11.2 37.2 33.5 50.4 34.8 53.4 2.71 2.72 58.5 1.41 1.73 1.13 16.96 11.05 6.87
2535 8 11.2 37.2 33.5 50.4 34.8 53.4 2.71 2.72 58.5 1.41 1.73 1.13 16.96 11.05 6.87
2535 9 12.7 37.4 36.7 58.1 38.2 61.7 2.72 2.73 62.1 1.64 1.67 1.03 16.42 10.15 6.33
2535 10 14.2 37.5 40 66.6 41.5 71 2.7 2.71 65.2 1.87 1.61 0.94 15.84 9.26 5.75
2535 11 15.7 37.6 41.8 71.8 43.4 76.8 2.69 2.71 66.9 2.02 1.58 0.9 15.54 8.79 5.45
2535 12 17.2 37.6 41.1 69.9 42.8 74.7 2.68 2.69 66.2 1.95 1.59 0.91 15.61 8.94 5.52
2535 13 18.6 37.6 38.3 62 39.8 66.1 2.69 2.71 63.5 1.74 1.64 0.99 16.09 9.69 6.01
2535 14 20.22 37.9 40.9 69.2 42.5 74 2.68 2.7 66 1.94 1.6 0.92 15.66 9 5.57
2535 15 21.62 38.1 40.9 69.3 42.6 74.1 2.68 2.7 66 1.94 1.6 0.92 15.65 8.99 5.56
2535 16 23.2 38.2 39.5 65.4 41.1 69.8 2.67 2.68 64.5 1.82 1.62 0.95 15.85 9.33 5.75
2535 16 23.2 38.2 40.9 69.3 42.6 74.1 2.67 2.68 65.9 1.93 1.59 0.92 15.63 8.98 5.53
2535 17 24.8 38.4 37.7 60.4 39.2 64.4 2.69 2.71 62.8 1.69 1.65 1.01 16.2 9.86 6.11
2535 19 27.5 38.7 39.8 66.2 41.4 70.7 2.68 2.7 64.9 1.85 1.61 0.95 15.83 9.27 5.73
2535 19 27.5 38.7 39.8 66.2 41.4 70.7 2.68 2.7 64.9 1.85 1.61 0.95 15.83 9.27 5.73
2535 20 29.22 39 41 69.4 42.6 74.3 2.68 2.69 66 1.94 1.6 0.91 15.64 8.97 5.54
2535 21 30.6 38.8 38.6 62.9 40.2 67.1 2.69 2.71 63.8 1.77 1.64 0.98 16.05 9.6 5.95
2535 22 32.3 39.1 37 58.7 38.5 62.6 2.69 2.7 62.1 1.64 1.66 1.02 16.31 10.03 6.21
2535 23 33.6 39.6 38.2 61.8 39.8 66 2.69 2.71 63.4 1.73 1.64 0.99 16.12 9.71 6.02
2535 24 34.8 39.8 38.2 61.7 39.7 65.9 2.68 2.7 63.3 1.72 1.64 0.99 16.1 9.7 5.99
2535 25 37 39.9 39.3 64.8 40.9 69.3 2.68 2.7 64.5 1.82 1.62 0.96 15.92 9.4 5.81
2535 26 37.6 40.1 37.9 60.9 39.4 65.1 2.68 2.69 63 1.7 1.65 1 16.14 9.77 6.03
2536GHF 1 0.65 35 57.7 136.3 59.8 148.6 2.65 2.69 79.5 3.88 1.37 0.55 13.4 5.39 3.33
2536GHF 2 2.2 35 56.8 131.4 58.8 142.9 2.64 2.67 78.8 3.72 1.38 0.57 13.49 5.55 3.42
2536GHF 3 3.6 35 49.2 96.7 51 103.9 2.68 2.7 73.2 2.73 1.48 0.72 14.47 7.1 4.4
2536GHF 4 5.2 35 44.7 80.8 46.3 86.3 2.69 2.71 69.5 2.28 1.54 0.83 15.1 8.11 5.04
2536GHF 5 6.8 35 37.5 60 38.9 63.6 2.71 2.72 62.7 1.68 1.66 1.01 16.26 9.94 6.19
2536GHF 6 8.2 35 40.3 67.4 41.7 71.6 2.69 2.7 65.3 1.88 1.61 0.94 15.77 9.19 5.7
2537 1 0.85 21.3 56.9 131.9 58.1 138.7 2.66 2.68 78.5 3.65 1.37 0.58 13.46 5.64 3.5
2537 2 2.35 36.8 57.1 133 59.3 145.4 2.65 2.69 79.2 3.8 1.37 0.56 13.47 5.49 3.39
2537 3 3.75 37.7 48.3 93.4 50.2 100.7 2.68 2.71 72.6 2.65 1.49 0.74 14.6 7.27 4.51
2537 4 5.25 39.1 46.5 86.7 48.3 93.6 2.69 2.72 71.2 2.47 1.52 0.78 14.87 7.68 4.77
2537 6 8.25 42.8 40.1 67.1 41.9 72.2 2.69 2.71 65.5 1.9 1.61 0.94 15.81 9.18 5.69
2537 8 11.1 45.3 42.1 72.7 44.1 78.9 2.69 2.71 67.4 2.07 1.58 0.88 15.51 8.67 5.36
2537 9 12.7 47.4 35.7 55.4 37.4 59.8 2.72 2.74 61.2 1.58 1.7 1.06 16.63 10.4 6.46
2537 10 14.2 48.4 34 51.6 35.8 55.7 2.72 2.74 59.5 1.47 1.72 1.11 16.92 10.87 6.75
2537 11 15.8 48.3 34.5 52.7 36.3 56.9 2.72 2.73 60 1.5 1.72 1.09 16.82 10.72 6.65
2537 13 18.7 50.1 37.2 59.2 39.1 64.3 2.71 2.73 62.8 1.69 1.67 1.01 16.35 9.95 6.17
2537 14 20.1 50.6 40.6 68.2 42.7 74.6 2.69 2.71 66.1 1.95 1.61 0.92 15.75 9.02 5.57
2537 15 21.5 51.1 38.2 61.7 40.2 67.3 2.69 2.71 63.7 1.76 1.65 0.98 16.14 9.65 5.95
2537 16 23.2 52.2 40.4 67.7 42.6 74.2 2.69 2.71 65.9 1.93 1.61 0.92 15.79 9.06 5.59
Physical Properties 4-29

Table 4. Water content and index properties. — Continued
[m, meters; Sal Est, salinity estimated; ppt, parts per thousand; WCt, water content based on total sample mass not corrected for salinity; %, percent; WCs, water content based on solids mass not corrected for salinity; WCtc, water content based on total sample mass corrected for salinity; WCsc, water content based on solids mass corrected for salinity; ρs, grain density not corrected for salinity; g/cm3, grams per cubic centimeter; ρsc, grain density corrected for salinity; n, porosity; e, void ratio; ρw, wet bulk density; ρd, dry bulk density; γw, wet unit weight; kN/m3, kiloNewton per cubic meter; γd, dry unit weight; γsub, submerged unit weight]
Core no.
Sec-tion
Mid-depth
(m)
Sal Est (ppt)
WCt (%)
WCs (%)
WCtc (%)
WCsc (%)
ρs (g/
cm3)
ρsc (g/
cm3)
n (%)
eρw (g/
cm3)
ρd (g/
cm3)
γw (kN/m3)
γd (kN/m3)
γsub (kN/m3)
2537 17 24.6 53.2 39.3 64.9 41.6 71.1 2.69 2.71 64.9 1.85 1.63 0.95 15.95 9.32 5.75
2537 18 26.3 54.7 39 64.1 41.3 70.4 2.68 2.71 64.6 1.83 1.63 0.96 15.99 9.38 5.77
2537 20 28.9 55.3 37 58.7 39.1 64.3 2.69 2.72 62.6 1.68 1.67 1.01 16.36 9.95 6.13
2537 22 32.2 57.1 40.3 67.4 42.7 74.5 2.69 2.71 65.9 1.94 1.61 0.92 15.81 9.06 5.57
2537 23 33.1 58.5 38.8 63.4 41.2 70.1 2.68 2.71 64.5 1.82 1.64 0.96 16.04 9.43 5.79
2538G 1 0.7 36.2 56.4 129.4 58.5 141.2 2.65 2.68 78.7 3.68 1.38 0.57 13.54 5.61 3.46
2538G 2 2.2 36.7 56.9 132.1 59.1 144.4 2.65 2.68 79 3.76 1.37 0.56 13.48 5.52 3.4
2538G 3 3.7 37.4 48.9 95.9 50.8 103.4 2.68 2.7 73.1 2.72 1.48 0.73 14.5 7.13 4.41
2538G 4 5.2 39.3 44 78.4 45.8 84.4 2.7 2.72 69 2.23 1.55 0.84 15.23 8.26 5.13
2538G 5 6.7 42.5 35.3 54.7 36.9 58.5 2.71 2.72 60.7 1.54 1.7 1.07 16.65 10.5 6.52
2539 1 0.7 36.3 58.5 140.9 60.7 154.4 2.66 2.7 80.2 4.05 1.36 0.53 13.32 5.23 3.24
2539 2 2.2 36.3 58.1 138.7 60.3 151.9 2.67 2.7 80 3.99 1.36 0.54 13.36 5.31 3.29
2539 3 3.7 36.2 57.3 134 59.4 146.4 2.65 2.69 79.3 3.83 1.37 0.56 13.45 5.46 3.37
2539 4 5.2 36.2 49.4 97.5 51.2 105 2.68 2.7 73.4 2.76 1.47 0.72 14.44 7.04 4.36
2539 5 6.55 36.3 47.6 90.9 49.4 97.7 2.68 2.7 71.9 2.56 1.5 0.76 14.67 7.42 4.6
2539 5 6.85 36.4 44.8 81.1 46.5 86.8 2.69 2.71 69.6 2.29 1.54 0.82 15.1 8.09 5.02
2539 6 8.1 36.4 39.4 65.1 40.9 69.3 2.7 2.72 64.7 1.83 1.62 0.96 15.93 9.41 5.85
2539 7 9.73 36.4 36 56.2 37.3 59.6 2.71 2.73 61.2 1.58 1.69 1.06 16.54 10.36 6.46
2539 8 11.22 36.5 38.6 62.8 40 66.8 2.71 2.73 63.9 1.77 1.64 0.98 16.09 9.65 6.01
2539 9 12.7 36.6 40.3 67.5 41.9 72 2.7 2.72 65.5 1.9 1.61 0.94 15.79 9.18 5.71
2539 10 14.2 36.5 36.5 57.4 37.9 60.9 2.71 2.73 61.8 1.61 1.68 1.04 16.45 10.22 6.37
2539 11 15.7 36.5 35.8 55.8 37.2 59.1 2.72 2.74 61.1 1.57 1.69 1.06 16.59 10.42 6.51
2539 12 17.2 36.8 32.7 48.5 33.9 51.3 2.72 2.74 57.7 1.37 1.75 1.16 17.16 11.35 7.08
2539 13 18.7 36.8 42.6 74.2 44.2 79.2 2.69 2.71 67.6 2.09 1.57 0.88 15.42 8.6 5.34
2539 14 20 36.7 37 58.7 38.4 62.4 2.71 2.73 62.3 1.66 1.67 1.03 16.36 10.08 6.28
2539 15 21.7 37.2 39.1 64.1 40.6 68.3 2.7 2.72 64.3 1.8 1.63 0.97 15.99 9.5 5.9
2539 16 23.2 37.3 39.9 66.4 41.4 70.8 2.69 2.7 65 1.86 1.61 0.95 15.83 9.27 5.74
2539 18 26.2 36.7 41 69.4 42.5 74 2.69 2.7 66 1.94 1.6 0.92 15.66 9 5.57
2539 19 27.7 37 38.8 63.4 40.3 67.5 2.7 2.71 64.1 1.78 1.63 0.98 16.02 9.57 5.94
2539 20 29.2 37.2 38.9 63.8 40.4 67.9 2.68 2.69 64 1.78 1.63 0.97 15.96 9.51 5.88
2539 21 30.5 37.8 39.5 65.3 41.1 69.6 2.68 2.7 64.6 1.83 1.62 0.95 15.88 9.36 5.79
2541 1 0.55 35.8 56.7 130.7 58.8 142.5 2.66 2.69 78.8 3.73 1.38 0.57 13.52 5.57 3.44
2541 1 0.75 35.8 53.3 113.9 55.2 123.3 2.65 2.68 76.3 3.22 1.42 0.64 13.92 6.23 3.84
2541 2 2.2 36 57.6 136 59.8 148.7 2.65 2.68 79.5 3.87 1.37 0.55 13.4 5.39 3.32
2541 2 2.2 36 58.8 142.8 61 156.5 2.65 2.68 80.3 4.08 1.35 0.53 13.26 5.17 3.19
2541 3 3.7 36.2 50.2 100.6 52 108.5 2.68 2.7 74.1 2.85 1.46 0.7 14.34 6.88 4.26
2541 4 5.2 36.2 49.3 97.3 51.2 104.8 2.67 2.7 73.3 2.75 1.47 0.72 14.44 7.05 4.36
2541 5 6.75 36.1 41.8 71.7 43.3 76.4 2.7 2.72 66.9 2.02 1.59 0.9 15.56 8.82 5.48
2541 5 6.7 36.1 42.9 75.2 44.5 80.2 2.7 2.72 68 2.12 1.57 0.87 15.39 8.54 5.31
2541 6 8.2 36.1 39.8 66.1 41.3 70.3 2.7 2.72 65 1.86 1.62 0.95 15.87 9.32 5.79
2541 7 9.7 36.8 39.2 64.5 40.7 68.6 2.71 2.72 64.5 1.82 1.63 0.97 15.98 9.48 5.9
2541 7 9.8 36.8 36 56.2 37.4 59.7 2.71 2.72 61.2 1.58 1.68 1.06 16.52 10.35 6.44
2541 8 11.2 37.3 36.6 57.7 38 61.3 2.71 2.72 61.9 1.62 1.67 1.04 16.42 10.18 6.34
2541 8 11.2 37.3 37.9 61.1 39.4 65.1 2.71 2.73 63.3 1.72 1.65 1 16.19 9.81 6.11
2541 9 12.7 37 36.5 57.5 37.9 61 2.72 2.73 61.8 1.62 1.68 1.04 16.46 10.22 6.38
2541 10 14.2 36.9 34.5 52.7 35.8 55.8 2.72 2.74 59.8 1.49 1.72 1.1 16.82 10.79 6.74
4-30 Initial Report of the IMAGES VIII/PAGE 127 Gas Hydrate and Paleoclimate Cruise in the Gulf of Mexico, 2–18 July 2002

Table 4. Water content and index properties. — Continued
[m, meters; Sal Est, salinity estimated; ppt, parts per thousand; WCt, water content based on total sample mass not corrected for salinity; %, percent; WCs, water content based on solids mass not corrected for salinity; WCtc, water content based on total sample mass corrected for salinity; WCsc, water content based on solids mass corrected for salinity; ρs, grain density not corrected for salinity; g/cm3, grams per cubic centimeter; ρsc, grain density corrected for salinity; n, porosity; e, void ratio; ρw, wet bulk density; ρd, dry bulk density; γw, wet unit weight; kN/m3, kiloNewton per cubic meter; γd, dry unit weight; γsub, submerged unit weight]
Core no.
Sec-tion
Mid-depth
(m)
Sal Est (ppt)
WCt (%)
WCs (%)
WCtc (%)
WCsc (%)
ρs (g/
cm3)
ρsc (g/
cm3)
n (%)
eρw (g/
cm3)
ρd (g/
cm3)
γw (kN/m3)
γd (kN/m3)
γsub (kN/m3)
2541 11 15.7 37 42.1 72.8 43.8 77.8 2.69 2.71 67.2 2.05 1.58 0.89 15.49 8.71 5.4
2541 12 17.2 37.1 39.7 65.9 41.3 70.2 2.7 2.72 65 1.85 1.62 0.95 15.88 9.33 5.8
2541 13 18.7 36.9 41.7 71.5 43.3 76.4 2.68 2.69 66.7 2 1.58 0.9 15.53 8.8 5.44
2541 14 20.2 36.8 35 53.8 36.3 57 2.7 2.71 60 1.5 1.7 1.08 16.68 10.63 6.6
2541 15 21.7 36.9 41.2 70.1 42.8 74.8 2.69 2.71 66.3 1.97 1.59 0.91 15.63 8.95 5.55
2541 16 23.25 37 40.3 67.4 41.8 71.9 2.7 2.72 65.5 1.9 1.61 0.94 15.8 9.19 5.72
2541 17 24.7 36.9 41.2 70.2 42.8 74.9 2.69 2.71 66.3 1.97 1.59 0.91 15.63 8.94 5.54
2541 18 26.2 36.9 38.5 62.7 40 66.7 2.69 2.7 63.7 1.75 1.64 0.98 16.05 9.63 5.96
2541 19 27.7 37.2 38.4 62.4 39.9 66.4 2.69 2.71 63.6 1.75 1.64 0.99 16.08 9.66 5.99
2541 20 29.2 37.7 39.8 66.2 41.4 70.7 2.7 2.72 65.1 1.87 1.62 0.95 15.87 9.3 5.78
2541 21 30.2 37.7 35.2 54.4 36.6 57.8 2.69 2.7 60.3 1.52 1.69 1.07 16.61 10.53 6.52
2541 21 30.7 37.4 40.3 67.4 41.8 71.9 2.69 2.71 65.4 1.89 1.61 0.94 15.77 9.18 5.69
2541 22 31.6 37.1 38.8 63.3 40.2 67.3 2.7 2.71 64 1.78 1.63 0.98 16.03 9.58 5.95
2541 23 33.7 37.8 38.6 62.8 40.1 66.9 2.7 2.71 63.8 1.77 1.64 0.98 16.06 9.62 5.97
2541 24 34.9 38.5 32.3 47.8 33.6 50.7 2.68 2.7 57 1.33 1.75 1.16 17.12 11.36 7.02
2542GHF 3 3.7 35 46.4 86.4 48 92.5 2.68 2.7 70.8 2.43 1.51 0.79 14.84 7.71 4.78
2542GHF 4 5.2 35 39.7 65.8 41.1 69.8 2.7 2.72 64.9 1.85 1.62 0.95 15.89 9.36 5.82
2542GHF 5 6.8 35 43.3 76.4 44.9 81.5 2.69 2.71 68.3 2.15 1.56 0.86 15.31 8.44 5.24
2545G 1 0.4 42.4 53.2 113.9 55.6 125.2 2.66 2.69 76.6 3.27 1.42 0.63 13.94 6.19 3.82
2545G 2 1.5 43.3 57.7 136.2 60.3 151.8 2.64 2.68 79.7 3.93 1.37 0.54 13.4 5.32 3.27
2545G 3 2.43 57.4 53.2 113.5 56.4 129.3 2.66 2.71 77 3.35 1.43 0.62 13.98 6.1 3.74
2545G 4 3.35 67 32.7 48.5 35 53.9 2.7 2.73 58.3 1.4 1.75 1.14 17.16 11.15 6.85
2545G 5 4.35 75.1 48.1 92.8 52 108.5 2.65 2.7 73.5 2.77 1.49 0.72 14.64 7.02 4.27
2545G 6 5.3 80.8 48.2 93.2 52.5 110.4 2.65 2.7 73.7 2.81 1.49 0.71 14.63 6.95 4.22
2545G 7 6.46 86.1 41.9 72.2 45.9 84.7 2.67 2.72 68.4 2.16 1.59 0.86 15.59 8.44 5.13
2545G 8 7.4 91.8 39.3 64.8 43.3 76.3 2.68 2.72 66 1.94 1.63 0.93 16 9.08 5.51
2545G 9 8.5 95.5 35.5 55.1 39.3 64.7 2.69 2.73 62.2 1.65 1.7 1.03 16.67 10.12 6.15
2545G 10 9.2 99.6 33.4 50.2 37.1 59 2.67 2.7 59.7 1.48 1.73 1.09 16.98 10.68 6.43
2546 1 0.55 35.8 59.4 146.2 61.6 160.3 2.65 2.69 80.7 4.19 1.35 0.52 13.21 5.07 3.13
2546 2 2.15 35.9 58.5 140.8 60.7 154.1 2.65 2.68 80.1 4.02 1.36 0.53 13.3 5.23 3.23
2546 3 3.5 36.1 63.1 170.9 65.4 189.4 2.66 2.71 83.3 4.98 1.31 0.45 12.83 4.43 2.75
2546 4 5.2 36.8 49.1 96.5 51 104 2.66 2.68 73.1 2.71 1.47 0.72 14.45 7.08 4.36
2546 5 6.35 37.6 48.3 93.4 50.2 100.7 2.7 2.72 72.7 2.66 1.49 0.74 14.62 7.28 4.53
2546 6 7.8 39.2 44.9 81.6 46.8 87.8 2.7 2.72 69.9 2.32 1.54 0.82 15.1 8.04 5
2546 7 9.6 40.2 39.5 65.3 41.2 69.9 2.7 2.71 64.8 1.84 1.62 0.96 15.92 9.37 5.81
2546 8 11.05 43 38.1 61.5 39.8 66.1 2.71 2.73 63.6 1.74 1.65 0.99 16.18 9.75 6.06
2546 9 12.65 44.4 37.2 59.3 38.9 63.8 2.71 2.73 62.7 1.68 1.67 1.02 16.34 9.98 6.2
2546 10 14.25 45.6 36.2 56.8 38 61.2 2.71 2.73 61.8 1.62 1.68 1.05 16.52 10.25 6.37
2546 11 15.7 46.5 44.5 80.1 46.6 87.4 2.68 2.71 69.5 2.28 1.54 0.82 15.14 8.08 4.99
2546 12 17.2 47.4 38.6 63 40.6 68.2 2.7 2.72 64.2 1.79 1.64 0.97 16.08 9.56 5.92
2546 13 18.45 47.9 40.6 68.3 42.6 74.3 2.69 2.72 66.1 1.95 1.61 0.92 15.76 9.04 5.59
2546 14 20.4 48.6 37 58.8 38.9 63.8 2.69 2.71 62.5 1.67 1.67 1.02 16.33 9.97 6.16
2546 15 21.65 50.6 39.9 66.3 42 72.4 2.69 2.72 65.4 1.89 1.62 0.94 15.87 9.21 5.69
2546 16 23.05 49.8 39.7 65.8 41.8 71.7 2.69 2.71 65.2 1.87 1.62 0.94 15.89 9.26 5.71
2546 17 24.75 52.9 39.9 66.3 42.1 72.7 2.68 2.71 65.4 1.89 1.62 0.94 15.85 9.18 5.65
2546 18 26.2 53.7 33.3 49.9 35.2 54.3 2.69 2.71 58.5 1.41 1.73 1.12 16.98 11.01 6.77
Physical Properties 4-31

Table 4. Water content and index properties. — Continued
[m, meters; Sal Est, salinity estimated; ppt, parts per thousand; WCt, water content based on total sample mass not corrected for salinity; %, percent; WCs, water content based on solids mass not corrected for salinity; WCtc, water content based on total sample mass corrected for salinity; WCsc, water content based on solids mass corrected for salinity; ρs, grain density not corrected for salinity; g/cm3, grams per cubic centimeter; ρsc, grain density corrected for salinity; n, porosity; e, void ratio; ρw, wet bulk density; ρd, dry bulk density; γw, wet unit weight; kN/m3, kiloNewton per cubic meter; γd, dry unit weight; γsub, submerged unit weight]
Core no.
Sec-tion
Mid-depth
(m)
Sal Est (ppt)
WCt (%)
WCs (%)
WCtc (%)
WCsc (%)
ρs (g/
cm3)
ρsc (g/
cm3)
n (%)
eρw (g/
cm3)
ρd (g/
cm3)
γw (kN/m3)
γd (kN/m3)
γsub (kN/m3)
2546 19 27.65 52.5 36 56.2 38 61.2 2.69 2.71 61.4 1.59 1.68 1.05 16.52 10.25 6.31
2546 20 29.2 53.1 39.5 65.4 41.7 71.6 2.7 2.73 65.3 1.88 1.63 0.95 15.96 9.3 5.75
2546 21 30.6 54.4 39.5 65.2 41.7 71.6 2.68 2.71 65.1 1.86 1.62 0.95 15.93 9.28 5.71
2547GHF 1 0.74 35 57.5 135.5 59.6 147.7 2.65 2.69 79.4 3.86 1.37 0.55 13.41 5.41 3.34
2547GHF 2 2.1 35 56.8 131.2 58.8 142.7 2.66 2.69 78.9 3.73 1.38 0.57 13.51 5.56 3.44
2547GHF 3 3.7 35 48.3 93.4 50.1 100.2 2.67 2.69 72.4 2.63 1.49 0.74 14.57 7.28 4.5
2547GHF 4 5 35 38.1 61.6 39.5 65.3 2.7 2.72 63.3 1.73 1.65 1 16.14 9.77 6.08
2550C2 1 0.5 305.9 61.6 160.2 88.7 785.2 2.45 3.52 95.7 22.34 1.33 0.15 13.07 1.48 0.96
2550C2 2 1 299.8 62.1 163.8 88.7 782.2 2.41 3.24 95.4 20.61 1.32 0.15 12.98 1.47 0.91
2550C2 2 1 299.8 62.3 164.9 88.9 800.7 2.41 3.27 95.5 21.27 1.32 0.15 12.97 1.44 0.9
2550C2 3 1.5 297.1 59.5 147.1 84.7 553.6 2.43 3.04 93.2 13.69 1.35 0.21 13.26 2.03 1.21
2550C2 4 2 292.2 54 117.5 76.3 322.4 2.48 2.86 88.3 7.53 1.42 0.34 13.89 3.29 1.88
2550C2 5 3 275.5 47.8 91.6 66 193.9 2.54 2.8 81.7 4.48 1.5 0.51 14.73 5.01 2.84
2550C2 6 4 275.4 49.4 97.5 68.1 213.7 2.55 2.83 83.3 4.99 1.48 0.47 14.54 4.63 2.65
2550C2 6 4 275.4 49.1 96.3 67.7 209.6 2.55 2.83 83 4.89 1.49 0.48 14.57 4.71 2.69
2550C2 7 5 234.4 50.1 100.5 65.5 189.5 2.51 2.69 81.2 4.32 1.46 0.51 14.36 4.96 2.78
2550C2 7 5 234.4 51 104 66.6 199.4 2.51 2.7 82 4.56 1.45 0.49 14.26 4.76 2.68
2550C2 8 6 209.9 45.4 83 57.4 134.8 2.59 2.73 76 3.17 1.54 0.65 15.08 6.42 3.69
2550C2 9 6.9 167.8 41.9 72.1 50.3 101.3 2.6 2.69 70.7 2.42 1.59 0.79 15.56 7.73 4.49
2550C2 9 6.9 167.8 41.8 71.7 50.2 100.7 2.6 2.69 70.6 2.4 1.59 0.79 15.58 7.76 4.51
2550C2 10 8 207.8 41.5 70.8 52.3 109.8 2.6 2.72 72 2.57 1.6 0.76 15.65 7.46 4.27
2550C2 10 8 207.8 38.4 62.3 48.4 94 2.6 2.7 68.6 2.19 1.64 0.85 16.11 8.31 4.74
2550C2 11 8.9 183.9 38.8 63.3 47.5 90.4 2.63 2.72 68.3 2.15 1.64 0.86 16.1 8.46 4.91
2550C2 11 8.9 183.9 38.4 62.3 47 88.8 2.63 2.72 67.9 2.11 1.65 0.87 16.16 8.56 4.96
2553C2 1 0.6 35.7 56.9 131.8 59 143.7 2.67 2.71 79.1 3.79 1.38 0.57 13.52 5.55 3.44
2553C2 2 1 35.7 53.6 115.6 55.6 125.3 2.68 2.71 76.8 3.3 1.42 0.63 13.91 6.17 3.83
2553C2 2 1 35.7 53.6 115.6 55.6 125.2 2.68 2.71 76.8 3.3 1.42 0.63 13.91 6.17 3.83
2553C2 3 1.7 35.9 53.8 116.3 55.8 126.1 2.68 2.71 76.9 3.32 1.42 0.63 13.88 6.14 3.81
2553C2 3 1.7 35.9 53.9 116.7 55.9 126.6 2.68 2.71 76.9 3.33 1.41 0.62 13.87 6.12 3.8
2553C2 4 2 38 50.2 100.7 52.2 109 2.69 2.72 74.2 2.88 1.46 0.7 14.36 6.87 4.27
2553C2 4 2 38 49.7 98.8 51.7 106.8 2.69 2.72 73.8 2.82 1.47 0.71 14.42 6.97 4.33
2553C2 5 3.1 36.1 50.2 100.7 52.1 108.5 2.69 2.71 74.1 2.86 1.46 0.7 14.35 6.88 4.27
2553C2 5 3.1 36.1 49.4 97.5 51.2 105 2.69 2.71 73.5 2.77 1.47 0.72 14.45 7.05 4.38
2553C2 6 4 36.2 49.1 96.4 50.9 103.8 2.68 2.7 73.2 2.73 1.48 0.72 14.48 7.11 4.4
2553C2 6 4 36.2 49.9 99.8 51.8 107.5 2.68 2.7 73.9 2.83 1.47 0.71 14.37 6.92 4.29
2553C2 7 5 36.3 51.6 106.5 53.5 115.1 2.66 2.69 75.1 3.01 1.44 0.67 14.14 6.57 4.06
2553C2 7 5 36.3 51.7 106.9 53.6 115.5 2.66 2.69 75.1 3.02 1.44 0.67 14.13 6.56 4.05
2553C2 8 6.1 36.5 52.3 109.7 54.3 118.8 2.66 2.69 75.7 3.11 1.43 0.65 14.05 6.42 3.97
2553C2 8 6.1 36.5 52.2 109.3 54.2 118.4 2.66 2.69 75.6 3.1 1.43 0.66 14.06 6.44 3.98
2553C2 9 7 36.6 50.1 100.5 52 108.4 2.65 2.67 73.8 2.82 1.46 0.7 14.3 6.86 4.22
2553C2 9 7 36.6 50.1 100.2 52 108.1 2.65 2.67 73.7 2.81 1.46 0.7 14.31 6.88 4.23
2553C2 10 8 36.7 48.8 95.4 50.7 102.8 2.65 2.67 72.7 2.67 1.48 0.73 14.47 7.13 4.39
2553C2 10 8 36.7 48.5 94 50.3 101.2 2.65 2.67 72.4 2.63 1.48 0.74 14.52 7.21 4.43
2553C2 11 9 36.8 50 100.2 52 108.1 2.65 2.67 73.8 2.81 1.46 0.7 14.32 6.88 4.23
2553C2 11 9 36.8 49.3 97.2 51.2 104.8 2.65 2.67 73.2 2.72 1.47 0.72 14.41 7.04 4.33
2553C2 11 9 36.8 49.8 99.3 51.7 107.2 2.65 2.67 73.6 2.79 1.46 0.71 14.34 6.92 4.26
4-32 Initial Report of the IMAGES VIII/PAGE 127 Gas Hydrate and Paleoclimate Cruise in the Gulf of Mexico, 2–18 July 2002

Table 4. Water content and index properties. — Continued
[m, meters; Sal Est, salinity estimated; ppt, parts per thousand; WCt, water content based on total sample mass not corrected for salinity; %, percent; WCs, water content based on solids mass not corrected for salinity; WCtc, water content based on total sample mass corrected for salinity; WCsc, water content based on solids mass corrected for salinity; ρs, grain density not corrected for salinity; g/cm3, grams per cubic centimeter; ρsc, grain density corrected for salinity; n, porosity; e, void ratio; ρw, wet bulk density; ρd, dry bulk density; γw, wet unit weight; kN/m3, kiloNewton per cubic meter; γd, dry unit weight; γsub, submerged unit weight]
Core no.
Sec-tion
Mid-depth
(m)
Sal Est (ppt)
WCt (%)
WCs (%)
WCtc (%)
WCsc (%)
ρs (g/
cm3)
ρsc (g/
cm3)
n (%)
eρw (g/
cm3)
ρd (g/
cm3)
γw (kN/m3)
γd (kN/m3)
γsub (kN/m3)
2553C2 12 10 36.8 45.9 84.7 47.6 90.9 2.67 2.69 70.4 2.38 1.52 0.8 14.91 7.81 4.82
2553C2 12 10 36.8 45.9 85 47.7 91.2 2.67 2.69 70.5 2.39 1.52 0.79 14.9 7.79 4.81
2554 1 0.7 36 59.8 148.8 62 163.4 2.64 2.68 81 4.26 1.34 0.51 13.16 4.99 3.08
2554 2 2.2 35.9 55 122.3 57.1 132.9 2.66 2.69 77.7 3.48 1.4 0.6 13.71 5.89 3.64
2554 3 3.7 35.6 54.2 118.2 56.2 128.2 2.67 2.7 77.1 3.37 1.41 0.62 13.82 6.06 3.75
2554 4 5.2 35.5 55.2 123 57.2 133.6 2.63 2.66 77.5 3.45 1.39 0.6 13.66 5.85 3.59
2554 5 6.8 35.8 48.5 94.1 50.3 101.1 2.66 2.69 72.6 2.64 1.48 0.74 14.54 7.23 4.46
2554 6 8.2 36.1 44.6 80.4 46.2 86 2.68 2.7 69.3 2.26 1.54 0.83 15.11 8.12 5.03
2554 7 9.8 36.5 45.3 82.7 47 88.6 2.66 2.68 69.8 2.31 1.53 0.81 14.98 7.94 4.9
2554 8 11.2 36.5 42.1 72.7 43.7 77.6 2.69 2.71 67.1 2.04 1.58 0.89 15.49 8.72 5.41
2554 9 12.6 36.4 37.9 61.1 39.4 65 2.7 2.72 63.2 1.72 1.65 1 16.17 9.81 6.09
2554 10 14 36.6 35.5 54.9 36.8 58.2 2.71 2.72 60.7 1.54 1.69 1.07 16.62 10.5 6.54
2554 11 15.6 37 36.6 57.8 38 61.4 2.7 2.71 61.8 1.62 1.67 1.04 16.39 10.15 6.31
2554 12 17.3 37.4 35.8 55.8 37.2 59.2 2.7 2.72 61 1.57 1.69 1.06 16.55 10.39 6.46
2554 13 19.1 37.2 38.5 62.5 40 66.5 2.69 2.7 63.6 1.75 1.64 0.98 16.06 9.64 5.98
2554 14 20 36.7 35.1 54 36.4 57.2 2.7 2.71 60.1 1.51 1.7 1.08 16.66 10.6 6.58
2554 15 21.45 40.2 36.1 56.6 37.6 60.3 2.7 2.72 61.4 1.59 1.68 1.05 16.49 10.29 6.39
2554 16 23.1 37.2 36.4 57.2 37.8 60.8 2.7 2.71 61.6 1.6 1.68 1.04 16.43 10.22 6.35
2554 17 24.6 37 34.1 51.7 35.4 54.8 2.7 2.71 59.1 1.45 1.72 1.11 16.84 10.88 6.76
2554 18 26.05 36.3 32.8 48.9 34.1 51.7 2.71 2.72 57.8 1.37 1.74 1.15 17.1 11.27 7.02
2554 19 27.5 36.7 31.4 45.7 32.6 48.3 2.7 2.71 56 1.28 1.77 1.19 17.35 11.69 7.26
2554 20 29 30.9 32.6 48.4 33.6 50.7 2.7 2.72 57.4 1.34 1.74 1.16 17.11 11.35 7.07
2554 21 30.35 37.1 32.5 48.2 33.8 51 2.71 2.72 57.4 1.35 1.75 1.16 17.14 11.35 7.06
2555 1 1.1 35.8 59.7 147.8 61.9 162.2 2.64 2.68 80.9 4.23 1.34 0.51 13.17 5.02 3.1
2555 2 2 35.8 57.2 133.6 59.3 145.8 2.65 2.68 79.2 3.81 1.37 0.56 13.45 5.47 3.38
2555 3 3.5 35.9 54.8 121.1 56.8 131.6 2.65 2.67 77.4 3.42 1.4 0.6 13.72 5.93 3.65
2555 4 5.2 36 54.7 120.9 56.8 131.3 2.65 2.68 77.4 3.42 1.4 0.61 13.73 5.94 3.66
2555 5 6.7 36.1 51.4 105.9 53.4 114.4 2.63 2.66 74.7 2.96 1.44 0.67 14.12 6.59 4.04
2555 6 8.2 36.1 48.2 93.2 50.1 100.2 2.67 2.7 72.5 2.63 1.49 0.74 14.59 7.29 4.51
2555 7 9.7 36.3 44.4 79.8 46.1 85.3 2.68 2.7 69.1 2.24 1.54 0.83 15.13 8.16 5.05
2555 8 11.2 36.4 44.3 79.6 46 85.1 2.68 2.7 69.1 2.24 1.54 0.83 15.15 8.18 5.07
2555 9 12.65 36.3 43 75.4 44.6 80.5 2.68 2.7 67.9 2.11 1.56 0.87 15.33 8.49 5.25
2555 10 14.2 36.4 37.8 60.7 39.2 64.4 2.7 2.72 63 1.7 1.65 1.01 16.21 9.86 6.13
2555 11 15.8 36.4 36.6 57.8 38 61.3 2.7 2.72 61.9 1.62 1.67 1.04 16.4 10.17 6.32
2555 12 17.2 36.2 34.8 53.3 36.1 56.4 2.71 2.72 59.9 1.49 1.71 1.09 16.74 10.7 6.66
2555 13 18.7 36.4 36.8 58.3 38.2 61.8 2.7 2.71 62 1.63 1.67 1.03 16.36 10.11 6.28
2555 14 20.2 36.7 36.7 57.9 38.1 61.5 2.69 2.7 61.8 1.61 1.67 1.03 16.36 10.13 6.28
2555 15 21.6 36.6 35.1 54.1 36.4 57.3 2.71 2.72 60.2 1.52 1.7 1.08 16.67 10.6 6.59
2555 16 23.2 36.5 35.7 55.6 37.1 58.9 2.69 2.71 60.8 1.55 1.69 1.06 16.54 10.41 6.46
2555 17 24.9 36.3 34 51.6 35.3 54.6 2.68 2.7 58.9 1.43 1.71 1.11 16.81 10.87 6.73
2555 18 26.2 36.3 33.2 49.8 34.5 52.6 2.72 2.73 58.3 1.4 1.74 1.14 17.05 11.17 6.97
2555 19 27.6 36.4 32.7 48.5 33.9 51.3 2.7 2.72 57.6 1.36 1.74 1.15 17.11 11.31 7.03
2555 20 29.2 36.4 32 47 33.2 49.7 2.69 2.7 56.7 1.31 1.75 1.17 17.2 11.49 7.12
2555 21 30.7 36.3 32.5 48.2 33.7 50.9 2.71 2.72 57.4 1.35 1.75 1.16 17.14 11.36 7.06
2555 22 32.2 36.2 33.1 49.6 34.4 52.4 2.71 2.72 58.1 1.39 1.74 1.14 17.03 11.17 6.95
2555 23 33.85 36.7 31.7 46.5 33 49.2 2.72 2.73 56.6 1.3 1.77 1.18 17.32 11.61 7.24
2555 24 35.1 36.1 32 47 33.2 49.6 2.71 2.72 56.8 1.31 1.76 1.18 17.25 11.53 7.18
Physical Properties 4-33

Table 4. Water content and index properties. — Continued
[m, meters; Sal Est, salinity estimated; ppt, parts per thousand; WCt, water content based on total sample mass not corrected for salinity; %, percent; WCs, water content based on solids mass not corrected for salinity; WCtc, water content based on total sample mass corrected for salinity; WCsc, water content based on solids mass corrected for salinity; ρs, grain density not corrected for salinity; g/cm3, grams per cubic centimeter; ρsc, grain density corrected for salinity; n, porosity; e, void ratio; ρw, wet bulk density; ρd, dry bulk density; γw, wet unit weight; kN/m3, kiloNewton per cubic meter; γd, dry unit weight; γsub, submerged unit weight]
Core no.
Sec-tion
Mid-depth
(m)
Sal Est (ppt)
WCt (%)
WCs (%)
WCtc (%)
WCsc (%)
ρs (g/
cm3)
ρsc (g/
cm3)
n (%)
eρw (g/
cm3)
ρd (g/
cm3)
γw (kN/m3)
γd (kN/m3)
γsub (kN/m3)
2556 1 0.7 35.5 59.6 147.3 61.8 161.5 2.65 2.68 80.8 4.21 1.34 0.51 13.18 5.04 3.11
2556 2 2.2 35.6 54.6 120 56.6 130.2 2.66 2.69 77.3 3.41 1.4 0.61 13.77 5.98 3.69
2556 3 3.7 35.9 54.8 121.3 56.9 131.8 2.66 2.69 77.5 3.44 1.4 0.6 13.73 5.93 3.66
2556 4 5.2 36 55.5 124.5 57.5 135.5 2.65 2.68 77.9 3.53 1.39 0.59 13.64 5.79 3.57
2556 5 6.7 36 51.8 107.4 53.7 116.1 2.65 2.67 75.1 3.02 1.44 0.67 14.09 6.52 4.02
2556 6 8.1 35.9 47 88.8 48.8 95.2 2.67 2.69 71.4 2.49 1.5 0.77 14.74 7.55 4.66
2556 7 9.7 35.8 42.2 73.1 43.8 77.9 2.68 2.7 67.2 2.05 1.58 0.89 15.45 8.69 5.38
2556 8 11.6 35.6 43.5 76.9 45.1 82.1 2.67 2.68 68.2 2.15 1.55 0.85 15.24 8.37 5.17
2556 9 12.7 35.5 44.5 80.2 46.2 85.7 2.67 2.69 69.1 2.24 1.54 0.83 15.09 8.13 5.02
2556 10 14.17 35.5 36.7 57.9 38 61.4 2.71 2.72 61.9 1.62 1.67 1.04 16.4 10.16 6.32
2556 11 15.4 35.5 38.3 62 39.7 65.8 2.7 2.72 63.5 1.74 1.64 0.99 16.12 9.73 6.05
2556 12 17.15 35.9 38.1 61.5 39.5 65.2 2.7 2.71 63.3 1.72 1.65 1 16.14 9.77 6.07
2556 13 18.7 36.1 37.2 59.3 38.6 62.9 2.7 2.72 62.5 1.66 1.66 1.02 16.29 10 6.22
2556 14 20.2 36.3 37.3 59.4 38.7 63 2.69 2.71 62.4 1.66 1.66 1.02 16.27 9.98 6.19
2556 15 21.7 36.3 36.7 58 38.1 61.6 2.69 2.71 61.9 1.62 1.67 1.03 16.36 10.13 6.28
2556 16 23.3 36.4 33.5 50.4 34.8 53.3 2.7 2.72 58.5 1.41 1.73 1.13 16.95 11.06 6.87
2556 17 24.8 36.2 33.9 51.3 35.2 54.3 2.71 2.73 59 1.44 1.72 1.12 16.9 10.96 6.83
2556 18 26.3 36.1 33.7 50.9 35 53.9 2.7 2.71 58.7 1.42 1.72 1.12 16.89 10.98 6.82
2556 19 27.7 36.1 32.7 48.5 33.9 51.3 2.7 2.72 57.5 1.36 1.74 1.15 17.11 11.31 7.03
2556 20 29.2 36.1 33.7 50.9 35 53.8 2.7 2.72 58.7 1.42 1.72 1.12 16.91 10.99 6.83
2556 21 30.7 36.2 34.1 51.8 35.4 54.8 2.7 2.71 59.1 1.45 1.72 1.11 16.82 10.86 6.74
2556 22 32.1 36.3 31.4 45.8 32.6 48.4 2.71 2.72 56.1 1.28 1.77 1.19 17.35 11.69 7.27
2556 23 33.75 36.1 31.5 46 32.7 48.6 2.71 2.72 56.2 1.28 1.77 1.19 17.33 11.67 7.25
2559 2 2.1 36.3 55.1 122.8 57.2 133.6 2.53 2.56 76.9 3.32 1.38 0.59 13.54 5.8 3.46
2559 3 3.7 36.2 58.9 143 61.1 156.8 2.64 2.67 80.3 4.08 1.35 0.53 13.25 5.16 3.18
2559 4 5.1 36.1 53 112.6 55 122 2.62 2.64 75.8 3.13 1.42 0.64 13.9 6.26 3.82
2559 5 6.6 36 52.4 110.2 54.4 119.2 2.58 2.6 75.1 3.02 1.42 0.65 13.92 6.35 3.84
2559 6 8.1 36.1 46.8 87.9 48.5 94.3 2.64 2.66 70.9 2.44 1.5 0.77 14.73 7.58 4.65
2559 7 9.6 36.3 41.1 69.9 42.7 74.5 2.68 2.69 66.1 1.95 1.59 0.91 15.61 8.95 5.53
2559 8 11.2 36.2 41.5 70.9 43 75.6 2.67 2.68 66.4 1.97 1.58 0.9 15.54 8.85 5.46
2559 9 12.6 36.1 37.8 60.7 39.2 64.5 2.68 2.7 62.8 1.69 1.65 1 16.16 9.83 6.08
2559 10 14.1 36.1 42 72.5 43.6 77.3 2.66 2.67 66.8 2.01 1.57 0.89 15.43 8.7 5.36
2559 11 15.7 36.1 38.4 62.4 39.9 66.3 2.69 2.71 63.6 1.75 1.64 0.99 16.07 9.66 5.99
2559 12 17.2 36.2 37.2 59.2 38.6 62.8 2.68 2.7 62.3 1.65 1.66 1.02 16.26 9.99 6.18
2559 13 18.6 36.3 37.4 59.6 38.8 63.3 2.67 2.69 62.3 1.65 1.65 1.01 16.2 9.92 6.13
2559 14 20.1 36.4 36.2 56.8 37.6 60.2 2.68 2.69 61.2 1.58 1.67 1.04 16.41 10.24 6.33
2559 15 21.7 36.6 33.4 50.2 34.7 53.1 2.68 2.7 58.2 1.39 1.73 1.13 16.92 11.05 6.84
2559 16 23.2 36.7 32.7 48.5 33.9 51.3 2.69 2.7 57.4 1.35 1.74 1.15 17.06 11.27 6.97
2559 17 24.7 36.5 33.2 49.7 34.5 52.6 2.69 2.71 58 1.38 1.73 1.13 16.98 11.13 6.9
2559 18 26.2 36.2 34.9 53.6 36.2 56.8 2.68 2.7 59.8 1.49 1.7 1.08 16.65 10.62 6.57
2559 19 27.6 36.2 33.7 50.9 35 53.9 2.69 2.7 58.6 1.41 1.72 1.12 16.86 10.96 6.79
2559 20 29.1 36.3 31.4 45.7 32.6 48.3 2.7 2.71 56 1.27 1.77 1.19 17.33 11.69 7.25
2559 21 30.7 36.4 31.4 45.8 32.6 48.3 2.7 2.71 56 1.27 1.77 1.19 17.32 11.68 7.24
2559 22 32.1 36.6 31.2 45.3 32.4 47.8 2.69 2.7 55.7 1.26 1.77 1.2 17.36 11.74 7.28
2559 23 33.2 36.4 32.9 48.9 34.1 51.8 2.68 2.69 57.6 1.36 1.73 1.14 17.01 11.21 6.93
2560 1 0.6 35.6 62.7 168.1 65 185.9 2.63 2.67 82.9 4.83 1.31 0.46 12.84 4.49 2.76
4-34 Initial Report of the IMAGES VIII/PAGE 127 Gas Hydrate and Paleoclimate Cruise in the Gulf of Mexico, 2–18 July 2002

Table 4. Water content and index properties. — Continued
[m, meters; Sal Est, salinity estimated; ppt, parts per thousand; WCt, water content based on total sample mass not corrected for salinity; %, percent; WCs, water content based on solids mass not corrected for salinity; WCtc, water content based on total sample mass corrected for salinity; WCsc, water content based on solids mass corrected for salinity; ρs, grain density not corrected for salinity; g/cm3, grams per cubic centimeter; ρsc, grain density corrected for salinity; n, porosity; e, void ratio; ρw, wet bulk density; ρd, dry bulk density; γw, wet unit weight; kN/m3, kiloNewton per cubic meter; γd, dry unit weight; γsub, submerged unit weight]
Core no.
Sec-tion
Mid-depth
(m)
Sal Est (ppt)
WCt (%)
WCs (%)
WCtc (%)
WCsc (%)
ρs (g/
cm3)
ρsc (g/
cm3)
n (%)
eρw (g/
cm3)
ρd (g/
cm3)
γw (kN/m3)
γd (kN/m3)
γsub (kN/m3)
2560 2 2.2 35.9 56.1 128 58.2 139.4 2.65 2.68 78.4 3.64 1.38 0.58 13.57 5.67 3.5
2560 3 3.7 36.2 56.9 131.9 59 143.9 2.64 2.67 78.9 3.74 1.37 0.56 13.48 5.53 3.4
2560 4 5.1 36.4 52.4 110.1 54.4 119.2 2.61 2.63 75.3 3.05 1.42 0.65 13.96 6.37 3.88
2560 5 6.55 36.7 53.3 113.9 55.3 123.6 2.58 2.61 75.8 3.13 1.41 0.63 13.83 6.18 3.74
2560 6 8.22 36.7 45.4 83.2 47.1 89.2 2.64 2.66 69.7 2.31 1.52 0.8 14.92 7.88 4.83
2560 7 9.7 36.7 47 88.8 48.8 95.4 2.63 2.65 71.1 2.46 1.5 0.77 14.69 7.52 4.61
2560 8 11.15 36.7 40.9 69.3 42.5 73.9 2.66 2.68 65.8 1.93 1.59 0.92 15.62 8.98 5.53
2560 9 12.6 36.8 41 69.5 42.6 74.2 2.68 2.69 66 1.94 1.59 0.92 15.63 8.98 5.55
2560 10 14.2 36.7 38.3 62.1 39.8 66 2.67 2.68 63.3 1.72 1.64 0.99 16.04 9.66 5.96
2560 11 15.7 36.7 38.3 62 39.7 65.9 2.67 2.68 63.2 1.72 1.64 0.99 16.04 9.67 5.96
2560 12 17.25 36.7 35.7 55.6 37.1 59 2.69 2.7 60.8 1.55 1.68 1.06 16.52 10.39 6.44
2560 13 18.7 36.9 38.5 62.6 40 66.6 2.66 2.68 63.4 1.74 1.63 0.98 16 9.6 5.92
2560 14 20.1 37 36.1 56.5 37.5 59.9 2.69 2.71 61.2 1.58 1.68 1.05 16.47 10.3 6.38
2560 15 21.8 36.6 36.7 58.1 38.1 61.6 2.66 2.67 61.6 1.6 1.66 1.03 16.28 10.07 6.2
2560 17 24.7 36.6 35.4 54.9 36.8 58.2 2.68 2.69 60.4 1.52 1.69 1.07 16.55 10.46 6.47
2560 18 26.1 36.5 36.3 56.9 37.7 60.4 2.68 2.7 61.3 1.58 1.67 1.04 16.41 10.23 6.33
2560 19 27.6 36.3 33.7 50.8 34.9 53.7 2.69 2.7 58.5 1.41 1.72 1.12 16.89 10.99 6.81
2561 1 0.7 35.4 60.8 154.8 63 170.2 2.64 2.67 81.6 4.43 1.33 0.49 13.04 4.83 2.97
2561 2 1.8 35.5 58.1 138.6 60.2 151.4 2.66 2.69 79.9 3.97 1.36 0.54 13.36 5.31 3.29
2561 3 3.7 35.9 60.6 153.6 62.8 169 2.64 2.68 81.5 4.4 1.33 0.5 13.07 4.86 2.99
2561 4 5.25 36.1 53.5 115 55.5 124.7 2.64 2.67 76.4 3.24 1.42 0.63 13.88 6.18 3.8
2561 5 6.6 36.2 53.9 117 55.9 127 2.6 2.63 76.4 3.25 1.4 0.62 13.77 6.07 3.69
2561 6 8.2 36.6 46.5 86.9 48.3 93.3 2.66 2.68 70.8 2.43 1.51 0.78 14.8 7.66 4.71
2561 7 9.7 36.8 45.9 84.8 47.6 91 2.68 2.7 70.5 2.39 1.52 0.8 14.91 7.81 4.83
2561 8 10.9 36.8 42.6 74.2 44.2 79.3 2.67 2.69 67.5 2.08 1.57 0.87 15.38 8.58 5.3
2561 9 12.7 36.8 37.6 60.2 39 64 2.68 2.69 62.6 1.68 1.65 1.01 16.18 9.86 6.1
2561 10 14.2 36.8 35.5 55.1 36.9 58.4 2.69 2.71 60.6 1.54 1.69 1.07 16.57 10.46 6.49
2561 11 15.7 36.9 36.2 56.6 37.5 60.1 2.69 2.7 61.2 1.58 1.68 1.05 16.45 10.27 6.36
2561 12 17.5 37 37.2 59.2 38.6 62.9 2.68 2.7 62.3 1.65 1.66 1.02 16.26 9.98 6.17
2561 13 18.7 36.9 33.5 50.3 34.8 53.3 2.68 2.69 58.3 1.4 1.72 1.12 16.9 11.03 6.82
2561 14 20.2 36.9 36.2 56.8 37.6 60.3 2.68 2.7 61.3 1.58 1.67 1.04 16.42 10.25 6.34
2561 15 21.7 36.8 34.1 51.7 35.4 54.7 2.69 2.7 59 1.44 1.72 1.11 16.82 10.87 6.74
2561 16 23.3 36.7 34.5 52.7 35.8 55.8 2.69 2.71 59.5 1.47 1.71 1.1 16.74 10.75 6.66
2561 17 24.6 36.7 35.9 56.1 37.3 59.5 2.68 2.7 61 1.56 1.68 1.05 16.47 10.33 6.39
2561 18 26.2 36.6 32.8 48.8 34.1 51.6 2.7 2.71 57.6 1.36 1.74 1.15 17.06 11.25 6.98
2561 19 27.6 36.3 32.4 48 33.7 50.7 2.7 2.71 57.2 1.34 1.75 1.16 17.13 11.37 7.05
2562 1 0.5 35.7 53.4 114.7 55.4 124.3 2.65 2.67 76.4 3.23 1.42 0.63 13.88 6.19 3.81
2562 2 2.05 35.6 52.3 109.6 54.2 118.4 2.65 2.68 75.5 3.09 1.43 0.66 14.04 6.43 3.96
2562 3 3.7 35.6 52.4 109.9 54.3 118.8 2.66 2.68 75.6 3.1 1.43 0.65 14.03 6.41 3.95
2562 4 5.2 36 46.4 86.6 48.2 92.9 2.66 2.68 70.8 2.43 1.51 0.78 14.82 7.68 4.74
2562 5 6.4 36.2 41.7 71.6 43.3 76.3 2.65 2.67 66.5 1.98 1.58 0.89 15.47 8.77 5.39
2562 6 8.2 36.5 43.4 76.7 45.1 82 2.66 2.68 68.1 2.14 1.55 0.85 15.24 8.37 5.16
2562 7 9.7 36.7 38.7 63.1 40.2 67.2 2.69 2.71 63.9 1.77 1.63 0.98 16.03 9.59 5.95
2562 8 11 36.7 37.6 60.3 39 64.1 2.68 2.69 62.6 1.68 1.65 1.01 16.18 9.86 6.09
2562 9 12.6 36.6 37.2 59.3 38.7 63 2.68 2.7 62.3 1.65 1.66 1.02 16.25 9.97 6.17
2562 10 14.2 36.6 39.7 65.9 41.3 70.2 2.68 2.7 64.8 1.84 1.62 0.95 15.84 9.31 5.76
2562 11 15.6 36.5 38.4 62.2 39.8 66.2 2.66 2.67 63.2 1.72 1.63 0.98 16.01 9.64 5.93
Physical Properties 4-35

Table 4. Water content and index properties. — Continued
[m, meters; Sal Est, salinity estimated; ppt, parts per thousand; WCt, water content based on total sample mass not corrected for salinity; %, percent; WCs, water content based on solids mass not corrected for salinity; WCtc, water content based on total sample mass corrected for salinity; WCsc, water content based on solids mass corrected for salinity; ρs, grain density not corrected for salinity; g/cm3, grams per cubic centimeter; ρsc, grain density corrected for salinity; n, porosity; e, void ratio; ρw, wet bulk density; ρd, dry bulk density; γw, wet unit weight; kN/m3, kiloNewton per cubic meter; γd, dry unit weight; γsub, submerged unit weight]
Core no.
Sec-tion
Mid-depth
(m)
Sal Est (ppt)
WCt (%)
WCs (%)
WCtc (%)
WCsc (%)
ρs (g/
cm3)
ρsc (g/
cm3)
n (%)
eρw (g/
cm3)
ρd (g/
cm3)
γw (kN/m3)
γd (kN/m3)
γsub (kN/m3)
2562 12 17.2 36.4 33 49.4 34.3 52.2 2.69 2.7 57.8 1.37 1.73 1.14 16.99 11.16 6.91
2562 13 18.6 36.5 33.5 50.4 34.8 53.3 2.69 2.7 58.4 1.4 1.73 1.13 16.92 11.03 6.84
2562 14 20.35 36.4 33.3 50 34.6 52.8 2.68 2.7 58.1 1.39 1.73 1.13 16.94 11.08 6.86
2562 15 21.7 36.4 33.5 50.4 34.8 53.3 2.68 2.69 58.3 1.4 1.72 1.12 16.89 11.02 6.82
2562 16 23.2 36.4 32.8 48.8 34 51.6 2.68 2.69 57.5 1.35 1.74 1.14 17.02 11.23 6.94
2562 17 24.7 36.5 32 47.1 33.2 49.7 2.69 2.7 56.6 1.31 1.75 1.17 17.2 11.49 7.12
2563C2 1 0.12 36.9 57.9 137.5 60.1 150.7 2.55 2.57 79 3.77 1.35 0.54 13.26 5.29 3.17
2563C2 1.5 0.2 37.6 58.8 142.9 61.1 157.2 2.58 2.61 79.9 3.98 1.35 0.52 13.19 5.13 3.1
2563C2 2 0.7 41.8 56.4 129.5 58.9 143.3 2.64 2.68 78.8 3.71 1.38 0.57 13.54 5.56 3.42
2563C2 3 1.3 48.1 53.2 113.5 55.9 126.5 2.6 2.63 76.2 3.21 1.42 0.62 13.88 6.13 3.71
2563C2 4 2.27 60.1 49.3 97.3 52.5 110.4 2.59 2.62 73.5 2.77 1.46 0.7 14.36 6.83 4.11
2563C2 5 2.85 66.8 49.3 97.4 52.9 112.2 2.54 2.58 73.3 2.75 1.46 0.69 14.3 6.74 3.99
2563C2 6 3.6 73.5 45.7 84 49.3 97.1 2.51 2.54 70 2.34 1.5 0.76 14.72 7.47 4.36
2565 3 3.9 122.1 46.4 86.4 52.8 111.9 2.57 2.64 73 2.7 1.51 0.71 14.83 7 4.1
2565 3.1 3.9 122.1 45 81.9 51.3 105.2 2.59 2.65 71.8 2.55 1.53 0.75 15.03 7.32 4.3
2565 3.2 3.9 122.1 44.4 80 50.6 102.5 2.6 2.66 71.4 2.49 1.54 0.76 15.13 7.47 4.4
2567 1 0.6 36 61.9 162.7 64.2 179.7 2.65 2.68 82.4 4.69 1.32 0.47 12.93 4.62 2.85
2567 1 0.6 36 62 163.3 64.3 180.4 2.65 2.68 82.5 4.71 1.32 0.47 12.92 4.61 2.84
2567 2 2.05 36.2 58.8 142.5 61 156.2 2.65 2.69 80.3 4.08 1.35 0.53 13.28 5.18 3.2
2567 3 3.6 36.4 60.4 152.4 62.7 167.8 2.65 2.68 81.4 4.38 1.34 0.5 13.1 4.89 3.02
2567 4 5.2 36.6 54 117.5 56.1 127.6 2.66 2.69 76.9 3.34 1.41 0.62 13.84 6.08 3.75
2567 5 6.4 36.7 49.2 96.9 51.1 104.5 2.63 2.65 73 2.7 1.47 0.72 14.39 7.04 4.31
2567 6 8.2 36.7 48.1 92.7 49.9 99.7 2.62 2.64 71.9 2.56 1.48 0.74 14.52 7.27 4.44
2567 7 9.7 36.8 46.8 88 48.6 94.5 2.63 2.65 70.9 2.44 1.5 0.77 14.72 7.57 4.63
2567 8 11 36.9 43.6 77.3 45.3 82.8 2.66 2.68 68.3 2.15 1.55 0.85 15.21 8.32 5.12
2567 9 12.5 37 39.6 65.6 41.1 69.9 3.32 3.37 69.6 2.29 1.74 1.02 17.06 10.04 6.97
2567 10 14.2 36.8 38 61.2 39.4 65.1 2.69 2.71 63.1 1.71 1.65 1 16.14 9.78 6.06
2567 11 15.7 36.8 36 56.2 37.4 59.7 2.69 2.7 61 1.57 1.68 1.05 16.47 10.31 6.39
2567 12 17.2 37 34.5 52.6 35.8 55.8 2.69 2.7 59.4 1.47 1.71 1.1 16.75 10.75 6.66
2567 13 18.6 37 38.3 62 39.7 65.9 2.67 2.69 63.3 1.72 1.64 0.99 16.06 9.68 5.97
2567 14 20.2 36.9 37.5 60 39 63.8 2.68 2.69 62.5 1.67 1.65 1.01 16.19 9.88 6.11
2567 15 21.7 37 36.4 57.2 37.8 60.7 2.68 2.7 61.4 1.59 1.67 1.04 16.39 10.2 6.31
2567 16 23.2 37 32 47.2 33.3 49.9 2.7 2.71 56.8 1.32 1.76 1.17 17.22 11.49 7.13
2567 17 24.55 36.8 33.8 51.1 35.1 54.1 2.7 2.71 58.8 1.42 1.72 1.12 16.88 10.96 6.8
2567 18 26.05 36.6 35.7 55.4 37 58.7 2.69 2.7 60.7 1.54 1.69 1.06 16.53 10.41 6.45
2569 1 0.95 35.8 42.1 72.6 43.6 77.4 2.66 2.68 66.9 2.02 1.58 0.89 15.45 8.71 5.37
2569 2 1.95 35.7 44.3 79.6 46 85.1 2.67 2.69 69 2.23 1.54 0.83 15.12 8.17 5.05
2569 2 1.95 35.7 43.6 77.3 45.2 82.5 2.66 2.68 68.3 2.15 1.55 0.85 15.21 8.33 5.13
2569 3 2.95 23.9 56.2 128.2 57.6 135.6 2.65 2.67 78 3.55 1.38 0.59 13.54 5.75 3.55
2569 3 2.95 23.9 51.9 108.1 53.2 113.7 2.65 2.67 74.9 2.98 1.43 0.67 14.05 6.57 4.06
2569 1? 3.5 32.4 47.3 89.8 48.9 95.7 2.67 2.69 71.5 2.51 1.5 0.77 14.7 7.52 4.65
2569 4 4.05 48.3 43.8 78 46 85.3 2.66 2.68 68.8 2.2 1.55 0.84 15.2 8.2 5.03
2569 4 4.05 48.3 43.3 76.5 45.5 83.6 2.66 2.68 68.4 2.16 1.56 0.85 15.27 8.32 5.1
2569 5 5.95 37 41.9 72.2 43.5 77.1 2.66 2.67 66.7 2 1.58 0.89 15.45 8.73 5.37
2569 5 5.95 37 41.9 72.1 43.5 77 2.65 2.67 66.6 2 1.57 0.89 15.45 8.72 5.36
4-36 Initial Report of the IMAGES VIII/PAGE 127 Gas Hydrate and Paleoclimate Cruise in the Gulf of Mexico, 2–18 July 2002

Table 4. Water content and index properties. — Continued
[m, meters; Sal Est, salinity estimated; ppt, parts per thousand; WCt, water content based on total sample mass not corrected for salinity; %, percent; WCs, water content based on solids mass not corrected for salinity; WCtc, water content based on total sample mass corrected for salinity; WCsc, water content based on solids mass corrected for salinity; ρs, grain density not corrected for salinity; g/cm3, grams per cubic centimeter; ρsc, grain density corrected for salinity; n, porosity; e, void ratio; ρw, wet bulk density; ρd, dry bulk density; γw, wet unit weight; kN/m3, kiloNewton per cubic meter; γd, dry unit weight; γsub, submerged unit weight]
Core no.
Sec-tion
Mid-depth
(m)
Sal Est (ppt)
WCt (%)
WCs (%)
WCtc (%)
WCsc (%)
ρs (g/
cm3)
ρsc (g/
cm3)
n (%)
eρw (g/
cm3)
ρd (g/
cm3)
γw (kN/m3)
γd (kN/m3)
γsub (kN/m3)
2569 2? 6.45 44.8 41.9 72 43.8 78 2.68 2.7 67 2.03 1.58 0.89 15.52 8.72 5.38
2569 6 6.6 47.1 41.4 70.6 43.4 76.7 2.65 2.67 66.4 1.98 1.58 0.9 15.54 8.79 5.38
2569 6 6.6 47.1 41.1 69.7 43.1 75.7 2.65 2.67 66.1 1.95 1.59 0.9 15.59 8.87 5.43
2569 7 7.45 60.4 35.7 55.6 38 61.4 2.65 2.67 61 1.57 1.68 1.04 16.47 10.21 6.21
2569 3 8.16 49.5 41 69.6 43.2 76 2.66 2.68 66.2 1.96 1.59 0.9 15.61 8.87 5.44
2569 8 8.25 46.6 42.6 74.2 44.7 80.7 2.65 2.67 67.6 2.08 1.57 0.87 15.36 8.5 5.21
2569 9 10 54.6 36.9 58.4 39 64 2.65 2.68 62.2 1.64 1.66 1.01 16.28 9.93 6.06
2570 1 0.5 35.8 53.7 115.9 55.7 125.6 2.65 2.68 76.6 3.27 1.41 0.63 13.86 6.14 3.79
2570 2 2.05 35.9 51.1 104.3 53 112.6 2.69 2.71 74.8 2.97 1.45 0.68 14.23 6.7 4.16
2570 3 3.7 36.1 56.8 131.5 58.9 143.5 2.64 2.67 78.8 3.73 1.37 0.56 13.48 5.54 3.4
2570 4 5.1 36 51.8 107.4 53.7 116.1 2.65 2.68 75.2 3.02 1.44 0.67 14.1 6.52 4.02
2570 5 6.5 36.2 51.9 108 53.9 116.8 2.6 2.63 74.9 2.98 1.43 0.66 14.01 6.46 3.93
2570 6 8.1 36.4 48.4 93.7 50.2 100.8 2.63 2.65 72.2 2.59 1.48 0.74 14.49 7.22 4.41
2570 7 10.2 36.4 47 88.8 48.8 95.3 2.63 2.65 71.1 2.46 1.5 0.77 14.68 7.52 4.6
2570 8 11 36.7 42.6 74.2 44.2 79.2 2.66 2.67 67.3 2.06 1.57 0.87 15.36 8.57 5.27
2570 9 12.9 37.1 44.2 79.1 45.9 84.8 2.64 2.66 68.7 2.19 1.54 0.83 15.1 8.17 5.02
2570 10 14.3 36.8 47.2 89.4 49 96.1 2.64 2.66 71.3 2.49 1.5 0.76 14.67 7.48 4.59
2570 11 15.7 36.6 45.7 84.2 47.4 90.3 2.66 2.68 70.2 2.35 1.52 0.8 14.91 7.84 4.83
2570 12 17.4 36.7 43.7 77.6 45.4 83.1 2.64 2.66 68.3 2.15 1.55 0.84 15.17 8.29 5.09
2570 13 18.6 36.7 39.6 65.4 41.1 69.7 2.68 2.7 64.6 1.83 1.62 0.95 15.87 9.35 5.79
2570 14 20.3 36.7 40.7 68.5 42.2 73.1 2.68 2.7 65.7 1.92 1.6 0.93 15.7 9.07 5.62
2570 15 21.5 36.7 35.5 55.1 36.9 58.4 2.71 2.73 60.7 1.55 1.69 1.07 16.62 10.49 6.53
2570 16 23 36.7 39.3 64.6 40.8 68.8 2.66 2.68 64.2 1.79 1.62 0.96 15.87 9.4 5.79
2570 17 24.7 36.7 38.3 62.1 39.8 66.1 2.68 2.69 63.4 1.73 1.64 0.99 16.06 9.67 5.98
2570 18 26.1 36.6 40.2 67.1 41.7 71.5 2.67 2.69 65.1 1.87 1.61 0.94 15.75 9.18 5.67
2570 19 27.7 36.6 38.9 63.6 40.4 67.6 2.66 2.68 63.8 1.76 1.63 0.97 15.94 9.51 5.86
2571C2 1 0.42 36.2 53.5 115.2 55.5 124.9 3.19 3.26 79.8 3.96 1.48 0.66 14.49 6.44 4.41
2571C2 1 0.42 36.2 53.1 113.4 55.1 122.9 2.66 2.69 76.3 3.21 1.42 0.64 13.94 6.25 3.86
2571C2 1 0.42 36.2 53.2 113.5 55.2 123 2.66 2.69 76.3 3.21 1.42 0.64 13.93 6.25 3.86
2571C2 2 1 35.8 52.1 108.7 54 117.4 2.68 2.71 75.6 3.09 1.44 0.66 14.1 6.48 4.02
2571C2 3 1.96 36 53.2 113.8 55.2 123.2 2.64 2.67 76.2 3.2 1.42 0.64 13.91 6.23 3.83
2571C2 4 3 37.1 51.7 107.1 53.7 116.1 2.35 2.36 72.7 2.66 1.39 0.64 13.64 6.31 3.56
2571C2 5 5 37.2 51.2 104.7 53.1 113.4 2.62 2.65 74.5 2.92 1.44 0.68 14.13 6.62 4.05
2571C2 5 5 37.2 51.4 105.7 53.4 114.4 2.62 2.65 74.6 2.94 1.44 0.67 14.11 6.58 4.02
2571C2 6 4 36.7 53 112.9 55.1 122.5 2.64 2.67 76.1 3.18 1.42 0.64 13.93 6.26 3.85
2571C2 7 6.8 35.7 47.9 92 49.7 98.7 2.6 2.62 71.5 2.51 1.48 0.74 14.5 7.3 4.43
2571C2 8 8 37.8 48.3 93.2 50.1 100.6 2.63 2.65 72.1 2.59 1.48 0.74 14.52 7.24 4.43
2571C2 9 9.95 37.7 42.9 75.1 44.6 80.4 2.65 2.67 67.6 2.09 1.56 0.86 15.3 8.48 5.21
2571C2 9 9.95 37.7 44.5 80.1 46.2 86 2.65 2.67 69 2.23 1.54 0.83 15.06 8.1 4.97
2571C2 9 9.95 37.7 41.6 71.4 43.3 76.3 2.63 2.65 66.2 1.96 1.58 0.89 15.45 8.76 5.36
2571C2 9 9 37.9 43.7 77.5 45.4 83.1 2.64 2.66 68.3 2.15 1.55 0.84 15.17 8.29 5.08
2573GHF 2 0.3 35 46.5 86.8 48.2 92.9 2.67 2.69 70.9 2.43 1.51 0.78 14.82 7.68 4.75
2573GHF 5 1.37 35 39.2 64.5 40.6 68.4 2.66 2.67 64 1.78 1.62 0.96 15.87 9.42 5.8
2573GHF 3 2.45 35 34.7 53.2 36 56.2 2.67 2.68 59.5 1.47 1.7 1.09 16.65 10.66 6.58
2573GHF 4 3.25 35 40.7 68.6 42.2 72.9 2.67 2.68 65.6 1.9 1.6 0.92 15.66 9.06 5.59
2573GHF 6 3.65 35 42.2 73.1 43.8 77.8 2.65 2.67 66.9 2.02 1.57 0.88 15.4 8.66 5.33
Physical Properties 4-37

Table 4. Water content and index properties. — Continued
[m, meters; Sal Est, salinity estimated; ppt, parts per thousand; WCt, water content based on total sample mass not corrected for salinity; %, percent; WCs, water content based on solids mass not corrected for salinity; WCtc, water content based on total sample mass corrected for salinity; WCsc, water content based on solids mass corrected for salinity; ρs, grain density not corrected for salinity; g/cm3, grams per cubic centimeter; ρsc, grain density corrected for salinity; n, porosity; e, void ratio; ρw, wet bulk density; ρd, dry bulk density; γw, wet unit weight; kN/m3, kiloNewton per cubic meter; γd, dry unit weight; γsub, submerged unit weight]
Core no.
Sec-tion
Mid-depth
(m)
Sal Est (ppt)
WCt (%)
WCs (%)
WCtc (%)
WCsc (%)
ρs (g/
cm3)
ρsc (g/
cm3)
n (%)
eρw (g/
cm3)
ρd (g/
cm3)
γw (kN/m3)
γd (kN/m3)
γsub (kN/m3)
2573GHF 9 3.78 35 38.6 62.7 40 66.5 2.65 2.66 63.3 1.72 1.63 0.98 15.95 9.58 5.88
2573GHF 9 3.78 35 38.5 62.5 39.9 66.3 2.65 2.66 63.2 1.72 1.63 0.98 15.96 9.6 5.89
2573GHF 9 3.78 35 37.9 60.9 39.2 64.5 2.65 2.66 62.6 1.67 1.64 1 16.06 9.76 5.99
2573GHF 7 4 35 39 63.9 40.4 67.8 2.65 2.67 63.8 1.76 1.62 0.97 15.89 9.48 5.83
4-38 Initial Report of the IMAGES VIII/PAGE 127 Gas Hydrate and Paleoclimate Cruise in the Gulf of Mexico, 2–18 July 2002

Table 5. Shear strength results. — Continued
[mbsf, meters below sea floor; Svs, vane shear strength; kPa, kilopascal; Spp, pocket penetrometer strength; Stv, Torvane strength]
Core
Sub- bottom depth (mbsf)
Svs (kPa) Core
Sub- bottom depth (mbsf)
Spp (kPa) Core
Sub- bottom depth (mbsf)
Stv (kPa)
2535 0.9 8.41 2535 0.8 0 2535 0.9 9.8
2535 2.2 9.15 2535 2.1 24.5 2535 2 9.8
2535 3.7 17.85 2535 3.8 49 2535 3.9 19.6
2535 5.2 21.97 2535 5.4 61.3 2535 5.3 32.4
2535 8.3 15.41 2535 6.7 54.9 2535 6.5 38.2
2535 9.8 23.8 2535 8.4 73.5 2535 8.5 9.8
2535 11.2 27.92 2535 9.7 102.9 2535 9.6 9.8
2535 12.7 30.21 2535 11 122.5 2535 11.3 12.3
2535 14.2 45.77 2535 12.6 134.8 2535 12.5 13.7
2535 15.7 43.02 2535 14 14.7 2535 13.9 23.5
2535 17.2 62.7 2535 15.8 196 2535 15.9 24.5
2535 23.2 75.51 2535 17.1 24.5 2535 17 29.4
2535 24.8 70.02 2535 18.6 14.7 2535 18.5 31.4
2535 25.8 72.31 2535 20.4 25 2535 20.5 31.4
2535 27.6 73.23 2535 21.2 14.7 2535 21.25 30.4
2535 29.2 71.85 2535 21.5 25 2535 21.8 33.3
2535 33.6 85.13 2535 23 14.7 2535 22.9 27
2535 37.6 70.02 2535 24.6 24.5 2535 24.4 25.5
2536 0.6 7.15 2535 26.1 14.7 2535 26.2 31.4
2536 2.2 12.64 2535 27.5 29.4 2535 27.4 33.3
2536 3.6 15.18 2535 29.5 36.8 2535 29 36.8
2536 3.7 13.87 2535 30.7 36.8 2535 29.6 35.3
2536 5.1 13.04 2535 32.5 29.4 2535 30.8 31.4
2536 5.2 23.8 2535 33.7 36.8 2535 32 39.2
2536 6.8 21.51 2535 34.88 29.4 2535 33.8 40.2
2536 7.75 47.14 2535 36.8 19.6 2535 34.8 30.4
2536 8.2 40.27 2535 37.7 36.8 2535 36.7 40.2
2537 0.85 78.03 2536 0.67 0 2535 37.8 35.3
2537 2.3 21.97 2536 2.15 0 2536 0.69 2
2537 3.75 14.42 2536 3.55 0 2536 2.13 3.9
2537 5.25 10.35 2536 5.15 0 2536 3.55 6.9
2537 6.75 17.85 2536 6.75 0 2536 5.13 6.9
2537 8.2 17.87 2536 8.18 4.9 2536 6.75 9.8
2537 9.8 21.97 2537 0.8 0 2536 8.15 18.6
2537 11.2 29.75 2537 2.45 0 2537 0.95 0
2537 12.75 33.18 2537 5.1 61.3 2537 2.5 2.9
2537 17.1 61.56 2537 8.3 61.3 2537 3.6 4.9
2537 18.7 33.41 2537 12.9 159.3 2537 5 4.9
2537 20.1 59.72 2537 14.3 147 2537 12.6 13.7
Physical Properties 4-39

Table 5. Shear strength results. — Continued
[mbsf, meters below sea floor; Svs, vane shear strength; kPa, kilopascal; Spp, pocket penetrometer strength; Stv, Torvane strength]
Core
Sub- bottom depth (mbsf)
Svs (kPa) Core
Sub- bottom depth (mbsf)
Spp (kPa) Core
Sub- bottom depth (mbsf)
Stv (kPa)
2537 21.5 60.87 2537 15.75 134.8 2537 14.15 17.2
2537 23.2 62.24 2537 17 24.5 2537 15.75 10.8
2537 24.6 73.68 2537 18.9 12.3 2537 17 24.5
2537 26.2 77.35 2537 20 24.5 2537 19 26.5
2537 27.3 69.57 2537 21.6 29.4 2537 20.2 24.5
2537 28.9 70.94 2537 23.1 24.5 2537 21.3 33.3
2537 30.2 56.75 2537 24.4 36.8 2537 23.1 31.9
2537 31.6 100 2537 26.2 36.8 2537 24.45 35.3
2537 33.1 75.06 2537 27.93 36.8 2537 26.4 36.8
2538 2.2 12.44 2537 29 36.8 2537 28.75 41.2
2538 3.7 17.39 2537 32.1 0 2537 32.3 35.3
2538 5.2 16.48 2537 33.2 39.2 2537 32.95 44.1
2538 6.7 27 2538 0.6 0 2538 0.75 0
2539 0.7 8.24 2538 2.15 0 2538 2.13 4.9
2539 2.2 9.61 2538 3.7 0 2538 3.7 6.9
2539 3.7 13.73 2538 5.15 0 2538 5.15 7.8
2539 5.2 28.83 2538 6.42 0 2538 6.45 11.8
2539 6.85 18.76 2539 0.6 0 2539 0.62 0
2539 8.1 19.22 2539 2.1 0 2539 2.15 2
2539 9.65 30.21 2539 5.3 0 2539 5.25 7.8
2539 11.23 27.92 2539 6.6 0 2539 6.5 8.8
2539 12.7 27.92 2539 6.8 0 2539 6.9 9.8
2539 14.2 34.78 2539 9.77 4.9 2539 8.5 8.8
2539 15.7 28.38 2539 11.25 9.8 2539 9.8 15.7
2539 17.2 33.41 2539 12.63 19.6 2539 11.3 17.7
2539 18.7 53.55 2539 14.2 19.6 2539 12.6 17.7
2539 20 30.66 2539 15.73 0 2539 14.26 21.6
2539 21.7 55.38 2539 17.2 19.6 2539 15.7 17.7
2539 23.2 63.62 2539 20 14.7 2539 17.25 19.6
2539 25.2 84.67 2539 21.6 9.8 2539 18.75 31.4
2539 26.2 81.79 2539 23.15 34.3 2539 20.05 17.7
2539 27.7 79.18 2539 26.3 36.8 2539 21.6 22.6
2539 30.5 75.51 2539 27.8 24.5 2539 23.25 29.4
2541 0.6 6.06 2539 29.3 39.2 2539 26.3 39.2
2541 2.2 10.03 2539 30.6 24.5 2539 27.8 31.4
2541 3.7 11.52 2541 0.53 0 2539 29.35 46.1
2541 6.7 16.61 2541 0.7 25 2539 30.6 41.2
2541 8.2 15.56 2541 2.15 93.1 2541 0.51 2
2541 9.7 21.97 2541 2.15 0 2541 0.85 9.8
4-40 Initial Report of the IMAGES VIII/PAGE 127 Gas Hydrate and Paleoclimate Cruise in the Gulf of Mexico, 2–18 July 2002

Table 5. Shear strength results. — Continued
[mbsf, meters below sea floor; Svs, vane shear strength; kPa, kilopascal; Spp, pocket penetrometer strength; Stv, Torvane strength]
Core
Sub- bottom depth (mbsf)
Svs (kPa) Core
Sub- bottom depth (mbsf)
Spp (kPa) Core
Sub- bottom depth (mbsf)
Stv (kPa)
2541 11.2 24.7 2541 3.62 0 2541 2.1 20.6
2541 12.7 20.93 2541 3.8 2.3 2541 2.13 2.9
2541 14.2 26.02 2541 5.15 0 2541 3.65 4.9
2541 15.7 49.43 2541 5.3 55.1 2541 3.8 4.9
2541 17.2 44.85 2541 6.65 4.9 2541 5.15 7.8
2541 18.7 59.95 2541 6.8 4 2541 5.35 4.9
2541 20.2 42.56 2541 6.9 61.3 2541 6.7 28.4
2541 21.7 61.1 2541 8.3 4.6 2541 6.8 7.8
2541 23.15 64.99 2541 9.65 0 2541 6.85 6.9
2541 24.7 64.53 2541 9.7 110.3 2541 8.3 9.8
2541 26.2 65.45 2541 11.15 134.8 2541 9.6 14.7
2541 27.7 61.33 2541 11.3 6.7 2541 9.6 11.8
2541 29.2 67.73 2541 12.65 0 2541 11.1 14.2
2541 30.7 72.31 2541 14.3 24.5 2541 11.3 11.8
2541 33.7 53.4 2541 15.8 13.2 2541 12.75 11.8
2541 34.9 77.8 2541 17.3 4.9 2541 14.3 18.6
2542 0.8 10.26 2541 18.8 24.5 2541 15.8 19.6
2542 2.2 9.89 2541 20.3 24.5 2541 17.3 24.5
2542 0.7 12.81 2541 21.8 27 2541 18.8 30.4
2542 3.7 17.41 2541 23.15 24.5 2541 20.35 28.4
2542 5.2 19.22 2541 24.75 29.4 2541 21.85 27
2542 5.2 19.22 2541 26.15 29.4 2541 23.1 24.5
2542 6.8 37.99 2541 27.6 19.6 2541 24.8 25.5
2545 1.5 16.48 2541 29.3 29.4 2541 26.3 28.4
2545 2.43 22.88 2541 30.25 36.8 2541 27.6 29.4
2545 3.35 22.88 2541 30.8 29.4 2541 29.3 29.4
2545 4.35 29.75 2541 31.65 36.8 2541 30.3 34.3
2545 5.3 27.92 2541 33.65 34.3 2541 30.8 37.3
2545 6.45 23.3 2541 34.85 29.4 2541 31.7 35.3
2545 7.4 38.44 2545 0.5 0 2541 33.6 39.2
2545 8.5 29.75 2545 1.4 0 2541 34.83 37.3
2545 9.15 40.62 2545 2.27 0 2545 0.5 2
2546 0.9 10.98 2545 2.57 0 2545 1.4 1
2546 3.7 10.07 2545 4.4 0 2545 2.15 8.8
2546 5.2 16.02 2545 5.4 0 2545 2.6 9.8
2546 6.7 14.65 2545 6.6 0 2545 4.4 0
2546 7.8 16.48 2545 7.53 0 2545 5.4 0
2546 9.7 24.26 2545 8.57 0 2545 6 0
2546 11.1 23.34 2545 9.1 0 2545 7.4 11.8
Physical Properties 4-41

Table 5. Shear strength results. — Continued
[mbsf, meters below sea floor; Svs, vane shear strength; kPa, kilopascal; Spp, pocket penetrometer strength; Stv, Torvane strength]
Core
Sub- bottom depth (mbsf)
Svs (kPa) Core
Sub- bottom depth (mbsf)
Spp (kPa) Core
Sub- bottom depth (mbsf)
Stv (kPa)
2546 12.8 20.14 2546 0.5 0 2545 8.6 14.7
2546 15.1 24.99 2546 2.24 0 2545 9.15 0
2546 15.7 45.31 2546 3.63 0 2546 0.6 2
2546 17.2 31.08 2546 5.1 0 2546 2.2 4.9
2546 18.65 45.31 2546 6.4 0 2546 3.63 4.9
2546 20.4 49.89 2546 8 0 2546 5.1 4.9
2546 21.7 56.29 2546 9.72 0 2546 6.42 8.8
2546 23.2 63.62 2546 11.4 0 2546 8 9.8
2546 24.7 65.45 2546 12.5 0 2546 9.75 11.8
2546 26.2 65.9 2546 14.23 0 2546 11.5 11.8
2546 27.7 63.16 2546 15.8 4.9 2546 12.55 12.7
2546 29.2 71.4 2546 16.3 24.5 2546 14.2 13.7
2546 30.6 70.02 2546 17.4 4.9 2546 15.8 14.7
2547 0.75 14.19 2546 18.55 19.6 2546 16.3 29.4
2547 2.2 14.19 2546 20.5 9.8 2546 17.4 19.6
2547 3.7 18.31 2546 21.7 24.5 2546 18.6 25.5
2547 5.1 21.51 2546 23.13 44.1 2546 20.5 26.5
2554 0.7 10.53 2546 24.5 34.3 2546 21.7 19.6
2554 2.2 7.43 2546 27.8 36.8 2546 23.1 30.4
2554 3.7 14.65 2546 29.16 29.4 2546 24.56 31.4
2554 5.2 16.93 2546 30.7 49 2546 27.8 34.3
2554 6.8 23.8 2547 0.8 0 2546 29.1 31.4
2554 8.2 15.56 2547 2.04 0 2546 30.7 29.4
2554 9.75 24.26 2547 3.84 0 2547 0.85 1
2554 11.2 25.63 2547 5.08 0 2547 2 3.9
2554 12.6 21.05 2550 0.5 0 2547 3.8 8.8
2554 14 30.21 2550 1 0 2547 5.14 9.8
2554 15.6 39.88 2550 1.5 0 2554 0.8 0
2554 17.3 30.66 2550 2 1.8 2554 2.3 2.9
2554 19.1 34.32 2550 3 2.9 2554 3.8 6.9
2554 20 22.88 2550 4 3.7 2554 5.3 7.8
2554 21.45 35.24 2550 5 4.6 2554 6.9 9.8
2554 23 39.82 2550 6 6.9 2554 8.3 7.4
2554 24.6 39.82 2550 6.9 8.6 2554 9.9 12.3
2554 26.05 33.87 2550 8 10.1 2554 11.3 14.7
2554 27.4 44.85 2550 8.9 9.5 2554 12.5 7.8
2554 29 43.48 2552 0.6 0.9 2554 13.9 14.7
2554 30.35 37.53 2552 1 2.3 2554 15.5 4.9
2555 1.1 8.7 2552 1.7 2.8 2554 17.4 15.7
4-42 Initial Report of the IMAGES VIII/PAGE 127 Gas Hydrate and Paleoclimate Cruise in the Gulf of Mexico, 2–18 July 2002

Table 5. Shear strength results. — Continued
[mbsf, meters below sea floor; Svs, vane shear strength; kPa, kilopascal; Spp, pocket penetrometer strength; Stv, Torvane strength]
Core
Sub- bottom depth (mbsf)
Svs (kPa) Core
Sub- bottom depth (mbsf)
Spp (kPa) Core
Sub- bottom depth (mbsf)
Stv (kPa)
2555 2 8.7 2552 2 3.1 2554 18.9 15.2
2555 3.5 13.27 2552 3.1 4 2554 20.1 15.7
2555 5.2 16.02 2552 4 5.4 2554 21.35 14.7
2555 6.7 21.97 2552 5 6.4 2554 22.9 19.6
2555 8.2 16.02 2552 6.1 7.2 2554 24.73 21.6
2555 9.7 26.09 2552 7 8 2554 25.87 19.6
2555 11.2 27 2552 8 9.3 2554 27.6 20.6
2555 12.65 36.16 2552 9 11.5 2554 29.1 27
2555 14.2 30.6 2552 10 11 2554 30.45 24.5
2555 15.8 31.58 2554 0.8 0 2555 1.2 2.9
2555 17.2 29.48 2554 2.3 1.5 2555 2.1 3.9
2555 18.7 35.24 2554 3.8 4.6 2555 3.6 11.8
2555 20.2 37.53 2554 5.3 4.6 2555 5.3 7.4
2555 21.6 31.58 2554 6.9 5.8 2555 6.8 8.8
2555 23.2 43.94 2554 8.3 4.6 2555 8.3 7.8
2555 24.9 45.31 2554 9.9 5.5 2555 9.8 9.8
2555 26.2 32.04 2554 11.3 7 2555 11.3 14.2
2555 27.6 43.48 2554 12.5 5.4 2555 12.75 19.6
2555 29.2 49.89 2554 13.9 7.7 2555 14.2 14.7
2555 30.7 47.14 2554 15.5 8.6 2555 15.7 13.7
2555 32.2 45.77 2554 17.4 6.9 2555 17.3 17.7
2555 33.85 39.17 2554 18.9 7.7 2555 18.8 22.1
2555 35.1 53.55 2554 20.1 7.7 2555 20.3 22.1
2556 0.7 10.98 2554 21.35 8.6 2555 21.7 20.6
2556 2.2 13.38 2554 22.9 10.7 2555 23.3 20.6
2556 3.7 16 2554 24.5 14.7 2555 25 27
2556 5.2 19.68 2554 25.87 4.9 2555 26.3 24.5
2556 6.7 15.56 2554 27.6 4.9 2555 27.5 27.5
2556 8.1 18.18 2554 29.1 19.6 2555 29.1 25.5
2556 9.7 22.88 2554 30.45 9.8 2555 30.6 24.5
2556 11.6 24.26 2555 1.2 0 2555 32.1 24
2556 12.7 32.49 2555 2.1 2.1 2555 33.9 25.5
2556 14.2 31.15 2555 3.6 4.6 2556 0.8 0
2556 15.4 32.95 2555 5.3 4.6 2556 2.3 3.9
2556 17.15 38.9 2555 6.8 5.4 2556 3.8 4.9
2556 18.7 36.16 2555 8.3 4 2556 5.3 6.9
2556 20.2 34.19 2555 9.8 5.4 2556 6.6 7.8
2556 21.7 44.85 2555 11.3 8 2556 8.2 6.9
2556 23.3 36.61 2555 12.75 8.4 2556 9.8 10.8
Physical Properties 4-43

Table 5. Shear strength results. — Continued
[mbsf, meters below sea floor; Svs, vane shear strength; kPa, kilopascal; Spp, pocket penetrometer strength; Stv, Torvane strength]
Core
Sub- bottom depth (mbsf)
Svs (kPa) Core
Sub- bottom depth (mbsf)
Spp (kPa) Core
Sub- bottom depth (mbsf)
Stv (kPa)
2556 24.8 43.02 2555 14.2 8 2556 11.7 14.2
2556 26.2 38.44 2555 15.7 7.7 2556 12.6 14.7
2556 27.7 44.39 2555 17.3 9.2 2556 14.3 20.6
2556 29.2 53.09 2555 18.8 10.4 2556 15.5 17.2
2556 30.7 59.5 2555 20.3 9.2 2556 17.25 18.6
2556 32.1 41.19 2555 21.7 10.7 2556 18.5 21.6
2556 33.75 49.43 2555 23.3 10.4 2556 20.35 24.5
2559 2.1 20.14 2555 25 11.6 2556 21.6 19.6
2559 3.7 16.48 2555 26.3 11.6 2556 23.4 22.6
2559 5.1 12.81 2555 27.5 13 2556 24.95 37.8
2559 6.6 16.32 2555 29.1 11 2556 26.4 27
2559 8.1 19.22 2555 30.6 12.3 2556 27.8 22.1
2559 9.6 18.76 2555 32.1 10 2556 28.95 22.1
2559 11.2 27 2555 33.9 12.6 2556 30.6 29.4
2559 12.6 25.63 2556 0.8 0 2556 32 25.5
2559 14.1 35.24 2556 2.3 0 2556 33.85 29.9
2559 15.7 37.52 2556 3.8 3.8 2559 0.2 0
2559 17.2 36.61 2556 5.3 3.7 2559 2 1
2559 18.6 46.68 2556 6.6 4.9 2559 3.8 4.4
2559 20.1 43.02 2556 8.2 3.8 2559 5.2 5.9
2559 21.7 44.85 2556 9.8 6.4 2559 6.7 7.8
2559 23.2 53.09 2556 11.7 6.7 2559 8.2 9.8
2559 24.7 51.26 2556 12.6 9.2 2559 9.7 10.8
2559 26.2 67.28 2556 14 7.4 2559 11.3 12.7
2559 27.6 55.38 2556 15.3 9.2 2559 12.7 15.7
2559 29.1 31.58 2556 17 10.9 2559 14.2 17.7
2559 30.7 30.04 2556 18.8 10.7 2559 15.8 19.6
2559 32.1 34.32 2556 20.3 10.7 2559 17.1 16.7
2559 33.2 40.27 2556 21.6 11.6 2559 18.7 19.6
2560 0.6 10.07 2556 23.4 10.1 2559 20.2 24.5
2560 2.2 9.61 2556 24.9 7.4 2559 21.6 24
2560 3.7 10.07 2556 26.4 11.6 2559 23.1 26.5
2560 5.1 17.39 2556 27.8 10.7 2559 24.6 29.4
2560 6.55 20.59 2556 29.05 11.6 2559 26.1 29.9
2560 8.2 19.68 2556 30.6 24.5 2559 27.5 29.4
2560 9.7 27 2556 32.2 14.5 2559 29.2 21.6
2560 11.15 37.07 2556 33.85 24.5 2559 30.8 19.1
2560 15.7 39.36 2559 0.2 0 2559 32.2 19.1
2560 14.2 38.9 2559 2 0.6 2559 33.3 21.6
4-44 Initial Report of the IMAGES VIII/PAGE 127 Gas Hydrate and Paleoclimate Cruise in the Gulf of Mexico, 2–18 July 2002

Table 5. Shear strength results. — Continued
[mbsf, meters below sea floor; Svs, vane shear strength; kPa, kilopascal; Spp, pocket penetrometer strength; Stv, Torvane strength]
Core
Sub- bottom depth (mbsf)
Svs (kPa) Core
Sub- bottom depth (mbsf)
Spp (kPa) Core
Sub- bottom depth (mbsf)
Stv (kPa)
2560 12.6 31.58 2559 3.8 2.8 2560 0.7 0
2560 17.25 41.65 2559 5.2 3.1 2560 2 4.9
2560 18.7 48.51 2559 6.7 5.4 2560 3.6 5.9
2560 20.1 48.05 2559 8.2 5.4 2560 5 5.9
2560 21.8 51.78 2559 9.7 6.1 2560 6.6 9.8
2560 24.7 48.97 2559 11.3 7 2560 8.3 9.8
2560 26.1 72.77 2559 12.7 8.9 2560 9.8 14.7
2560 27.6 65.45 2559 14.2 9.5 2560 11.03 0
2561 0.7 9.7 2559 15.8 9.2 2560 12.45 12.7
2561 2 10.07 2559 17.1 10.7 2560 14.05 14.7
2561 3.7 10.43 2559 18.7 12.3 2560 15.5 27.5
2561 5.25 6.69 2559 20.2 13 2560 17.15 19.6
2561 6.6 17.39 2559 21.6 13.8 2560 18.65 21.6
2561 8.2 12.81 2559 23.1 14.7 2560 20.05 24.5
2561 9.7 17.53 2559 23.1 15.3 2560 21.7 19.6
2561 10.9 22.5 2559 24.6 24.5 2560 24.6 25.5
2561 12.7 25.63 2559 26.1 24.5 2560 26.05 38.2
2561 14.1 27.9 2559 27.5 22.1 2560 27.55 37.3
2561 15.7 31.58 2559 29.2 8.6 2561 0.6 6.9
2561 17.5 37.07 2559 30.8 9.2 2561 3.7 0
2561 18.7 39.82 2559 32.2 9.8 2561 5.35 4.9
2561 20.2 55.84 2559 33.3 10.1 2561 6.7 8.8
2561 21.7 50.8 2560 0.75 2.8 2561 8.3 8.8
2561 24.6 55.38 2560 2.3 2.3 2561 9.8 9.8
2561 23.3 38.9 2560 3.8 3.7 2561 11 11.8
2561 26.2 60.87 2560 5.2 4 2561 12.8 14.7
2561 27.6 67.28 2560 6.4 5.8 2561 14.3 14.7
2562 0.5 16.02 2560 8.1 6.1 2561 15.8 19.6
2562 2.05 15.56 2560 9.6 7.4 2561 17.6 20.6
2562 3.7 19.68 2560 11 6.4 2561 18.8 20.6
2562 5.2 24.71 2560 12.45 7.3 2561 20.3 26.5
2562 6.4 21.51 2560 14 9.8 2561 21.8 22.6
2562 8.2 27.92 2560 15.6 10.3 2561 23.2 27.5
2562 9.7 19.04 2560 17 11.6 2561 24.8 23.5
2562 11 25.17 2560 18.65 11.6 2561 26.3 45.1
2562 12.6 31.58 2560 20.05 11.5 2561 27.7 49
2562 14.2 45.31 2560 21.7 61.3 2562 0.4 0
2562 15.6 51.72 2560 21.7 13.8 2562 2.1 4.9
2562 17.2 46.22 2560 24.6 11 2562 3.53 4.9
Physical Properties 4-45

Table 5. Shear strength results. — Continued
[mbsf, meters below sea floor; Svs, vane shear strength; kPa, kilopascal; Spp, pocket penetrometer strength; Stv, Torvane strength]
Core
Sub- bottom depth (mbsf)
Svs (kPa) Core
Sub- bottom depth (mbsf)
Spp (kPa) Core
Sub- bottom depth (mbsf)
Stv (kPa)
2562 18.6 41.65 2560 26.05 44.1 2562 5.17 9.8
2562 20.35 51.72 2560 26.05 14.5 2562 5.33 8.8
2562 21.7 48.97 2560 27.55 53.9 2562 8.1 12.3
2562 23.2 59.5 2560 27.55 14.4 2562 9.8 10.8
2562 24.6 58.58 2561 0.6 2.5 2562 11.1 12.7
2562 25.8 60.87 2561 1.9 3.8 2562 12.7 17.2
2566 0.6 10.95 2561 3.7 3.1 2562 14.3 19.6
2566 2 6.72 2561 5.15 3.1 2562 15.7 19.6
2566 3.7 16.48 2561 6.4 4 2562 17.1 22.6
2566 5.2 13.27 2561 8.3 4.9 2562 18.7 25.5
2566 6.25 16.93 2561 9.8 4.9 2562 20.4 27
2566 8.2 17.39 2561 11 6.1 2562 21.8 27.5
2566 9.7 28.22 2561 12.8 7.8 2562 23.3 29.4
2566 11 26.24 2561 14.3 9.5 2562 24.7 27
2566 12.55 24.26 2561 15.8 11.5 2562 25.9 31.9
2566 14.2 27 2561 17.6 10 2566 0.7 0
2566 15.7 38.9 2561 18.8 11.3 2566 2.1 2.5
2566 17.2 40.27 2561 20.3 13 2566 3.8 2.9
2566 18.5 44.39 2561 21.8 12.3 2566 5.3 5.9
2566 20.1 45.77 2561 23.2 13 2566 6.35 6.9
2566 21.7 50.8 2561 24.8 15 2566 8.3 9.8
2566 23.2 53.55 2561 26.3 3.7 2566 9.8 9.8
2566 24.8 59.04 2561 27.7 3.1 2566 11.1 14.7
2566 25.8 57.67 2562 0.4 2.4 2566 12.65 14.7
2567 0.6 11.9 2562 2.1 26.6 2566 14.3 16.7
2567 2.05 9.61 2562 3.57 3.4 2566 15.8 17.2
2567 3.6 10.98 2562 5.17 4.3 2566 17.3 17.7
2567 5.2 16.02 2562 5.35 4.3 2566 18.6 19.6
2567 6.4 16.02 2562 8.1 6.7 2566 20.1 21.6
2567 8.2 24.26 2562 9.8 5.2 2566 21.8 25.5
2567 9.7 22.88 2562 11.1 6.9 2566 23.3 25.5
2567 11 27.46 2562 12.7 7 2566 24.9 27.5
2567 12.5 28.38 2562 14.3 10.7 2566 25.9 24.5
2567 14.2 30.21 2562 15.7 10.7 2567 0.75 2
2567 15.7 33.87 2562 17.1 12.7 2567 1.8 2.5
2567 17.2 33.41 2562 18.7 19.6 2567 3.55 2.5
2567 18.5 52.17 2562 20.4 24.5 2567 4.95 2.9
2567 20.2 56.75 2562 21.8 24.5 2567 8.1 8.8
2567 21.7 57.21 2562 23.3 29.4 2567 9.75 9.8
4-46 Initial Report of the IMAGES VIII/PAGE 127 Gas Hydrate and Paleoclimate Cruise in the Gulf of Mexico, 2–18 July 2002

Table 5. Shear strength results. — Continued
[mbsf, meters below sea floor; Svs, vane shear strength; kPa, kilopascal; Spp, pocket penetrometer strength; Stv, Torvane strength]
Core
Sub- bottom depth (mbsf)
Svs (kPa) Core
Sub- bottom depth (mbsf)
Spp (kPa) Core
Sub- bottom depth (mbsf)
Stv (kPa)
2567 23.2 55.38 2562 24.7 29.4 2567 10.85 9.8
2567 24.55 49.43 2562 25.9 29.4 2567 12.37 10.8
2567 26.05 55.84 2563 0.65 2.5 2567 14.25 15.7
2570 0.5 10.98 2563 1.3 2.8 2567 15.55 15.7
2570 2.05 10.53 2563 2.27 5.5 2567 17.3 22.1
2570 3.7 12.35 2563 2.82 4.6 2567 18.5 19.6
2570 5.1 17.1 2563 3.58 4.9 2567 20.3 21.6
2570 6.5 14.65 2566 0.7 0 2567 21.8 23.5
2570 8.1 17.44 2566 2.1 1.5 2567 23.3 24.5
2570 10.2 19.22 2566 3.8 2.1 2567 24.4 29.4
2570 12.9 16.04 2566 5.3 2.5 2567 25.9 27.5
2570 14.3 26.09 2566 6.35 3.7 2570 0.6 0
2570 15.7 37.99 2566 8.3 4.9 2570 1.95 4.9
2570 17.4 28.1 2566 9.8 6.1 2570 3.8 4.9
2570 18.6 26.09 2566 11.1 6.6 2570 5.2 7.8
2570 20.3 27.46 2566 12.65 6.9 2570 6.6 6.9
2570 21.5 29.75 2566 14.3 8.4 2570 8.2 8.8
2570 23 30.66 2566 15.8 9.2 2570 10.1 9.3
2570 24.7 26.02 2566 17.3 10.1 2570 11.2 9.8
2570 26.1 31.12 2566 18.6 12.3 2570 13 9.3
2570 27.7 37.54 2566 20.1 12.3 2570 14.4 14.2
2566 21.8 19.6 2570 15.9 16.7
2566 23.3 19.6 2570 17.58 17.7
2566 24.9 27 2570 18.62 15.7
2566 25.9 24.5 2570 20.33 13.7
2567 0.75 0 2570 21.4 13.7
2567 1.8 0.6 2570 23.1 14.7
2567 3.55 1.5 2570 24.8 14.7
2567 5.1 2.8 2570 26.2 17.2
2567 6.45 2.8 2570 27.8 19.6
2567 8.1 5 2573 0.3 1
2567 9.75 5.8 2573 1.37 5.9
2567 10.7 6.4 2573 2.45 5.9
2567 12.4 6.9 2573 3.25 10.8
2567 14.25 8.9
2567 15.6 8
2567 17.3 9.5
2567 18.5 12.6
2567 20.3 14.1
Physical Properties 4-47

Table 5. Shear strength results. — Continued
[mbsf, meters below sea floor; Svs, vane shear strength; kPa, kilopascal; Spp, pocket penetrometer strength; Stv, Torvane strength]
Core
Sub- bottom depth (mbsf)
Svs (kPa) Core
Sub- bottom depth (mbsf)
Spp (kPa) Core
Sub- bottom depth (mbsf)
Stv (kPa)
2567 21.8 13.8
2567 23.3 13.8
2567 24.4 13.2
2567 25.9 34.3
2570 0.6 0
2570 1.95 1.5
2570 3.8 2.9
2570 5.2 4.4
2570 6.6 3.8
2570 8.2 3.7
2570 10.1 5.4
2570 11.2 4.9
2570 13 4.4
2570 14.4 5.4
2570 15.9 6.9
2570 17.58 8
2570 18.62 6.7
2570 20.33 6.4
2570 21.4 8.4
2570 23.1 8.4
2570 24.8 8.4
2570 26.2 8.4
2570 27.8 9.2
2573 0.3 2.1
2573 1.37 4.2
2573 2.45 8.9
2573 3.25 5.8
4-48 Initial Report of the IMAGES VIII/PAGE 127 Gas Hydrate and Paleoclimate Cruise in the Gulf of Mexico, 2–18 July 2002

Table 6. Electrical resistivity and formation factor results. — Continued
[mbsf, meters below sea floor; cm, centimeters]
Core SectionSub-
bottom depth (mbsf)
Resistivity (ohm-m)
Formation factor
Comments
2535 1 0.9 0.399 1.908 soupy sediments
2535 2 2.2 0.399 1.907
2535 3 3.7 0.704 3.367
2535 4 5.2 0.306 1.463
2535 5 6.8 0.567 2.711
2535 6 8.3 0.573 2.741
2535 7 9.8 0.57 2.729
2535 8 11.2 0.718 3.437
2535 9 12.7 0.595 2.849
2535 10 14.2 0.573 2.74
2535 11 15.7 0.664 3.175 vane shear measurement taken @ 1575
2535 12 17.2 0.654 3.13
2535 16 23.2 0.616 2.946
2535 17 24.8 0.611 2.923
2535 18 25.8 0.602 2.88
2535 19 27.6 0.818 3.915
2535 20 29.2 0.621 2.973
2535 23 33.6 0.676 3.236
2535 26 37.6 ?
2536 1 0.6 0.375 1.795 soupy
2536 2 2.2 0.398 1.904
2536 3 3.6 0.441 2.117
2536 3 3.7 0.44 2.103
2536 4 5.1 0.471 2.255
2536 4 5.2 0.481 2.302
2536 5 6.8 0.52 2.488
2536 6 7.75 0.517 2.475 light brown
2536 6 8.2 0.548 2.622 dark brown
2537 1 0.85 0.44 2.105
2537 2 2.3 0.372 1.779 vane shear at 235 cm, soupy
2537 3 3.75 0.603 2.887
2537 4 5.25 0.459 2.198 fairly soupy for this depth
2537 5 6.75 0.52 2.488
2537 6 8.2 0.48 2.298 fairly soupy for this depth
2537 7 9.8 0.516 2.469
2537 8 11.2 0.525 2.512
2537 9 12.75 0.79 3.781
Physical Properties 4-49

Table 6. Electrical resistivity and formation factor results. — Continued
[mbsf, meters below sea floor; cm, centimeters]
Core SectionSub-
bottom depth (mbsf)
Resistivity (ohm-m)
Formation factor
Comments
2537 12 17.1 0.544 2.602
2537 13 18.7 0.715 3.421 gas crack 10 cm away on each side
2537 14 20.1 0.527 2.519 gas crack 10 cm away from thermal conductivity
2537 15 21.5 0.626 2.998 gas crack @ 2166 close to thermal conductivity measurement
2537 16 23.2 0.571 2.73
2537 17 24.6 0.529 2.532
2537 18 26.2 0.591 2.829
2537 19 27.3 0.54 2.586
2537 20 28.9 0.572 2.735
2537 21 30.2 0.591 2.827 small gas cracks
2537 22 31.6 0.573 2.741 too large for spring
2537 23 33.1 0.528 2.525
2538 2 2.2 0.417 1.997
2538 3 3.7 0.483 2.309
2538 4 5.2 0.502 2.402 TO DATE: no significant sediment drying observed (IN) (July 08, 04:30)
2538 5 6.7 0.55 2.63
2539 1 0.65 0.413 1.976
2539 1 0.7 0.436 2.087
2539 2 2.2 0.406 1.942
2539 3 3.7 0.424 2.029
2539 4 5.2 0.479 2.29 vane shear @ 525 cm
2539 5 6.55 0.501 2.397
2539 5 6.85 0.487 2.193
2539 6 8.1 0.567 2.715
2539 7 9.65 0.53 2.535 vane shear @ 973 cm
2539 7 9.7 0.668 3.198
2539 8 11.23 0.839 4.013
2539 9 12.7 0.69 3.299
2539 10 14.2 0.604 2.889
2539 11 15.7 0.598 2.863
2539 12 17.2 0.674 3.223
2539 13 18.7 0.608 2.91
2539 14 20 0.596 2.852
2539 15 21.7 0.736 3.521
2539 16 23.2 0.653 3.122
2539 17 25.2 0.66 3.158
2539 18 26.2 0.616 2.946
4-50 Initial Report of the IMAGES VIII/PAGE 127 Gas Hydrate and Paleoclimate Cruise in the Gulf of Mexico, 2–18 July 2002

Table 6. Electrical resistivity and formation factor results. — Continued
[mbsf, meters below sea floor; cm, centimeters]
Core SectionSub-
bottom depth (mbsf)
Resistivity (ohm-m)
Formation factor
Comments
2539 19 27.7 0.636 3.044
2539 21 30.5 0.65 3.111
2541 1 0.6 0.42 2.01
2541 2 2.2 0.361 1.73
2541 3 3.7 0.472 2.258
2541 4 5.2 0.489 2.34
2541 5 6.7 0.518 2.48
2541 6 8.2 0.568 2.719
2541 7 9.7 0.637 3.046
2541 8 11.2 0.652 3.118
2541 9 12.7 0.571 2.731
2541 10 14.2 0.574 2.747
2541 11 15.7 0.601 2.873
2541 12 17.2 0.586 2.806
2541 13 18.7 0.604 2.889
2541 14 20.2 0.72 3.444
2541 15 21.7 0.664 3.177
2541 16 23.15 0.653 3.122
2541 17 24.7 0.599 2.868
2541 18 26.2 0.72 3.445
2541 19 27.7 0.602 2.881
2541 20 29.2 0.721 3.448
2541 21 30.7 0.609 2.915
2541 23 33.7 0.624 2.988
2541 24 34.9 0.621 2.97
2542 1 0.8 0.522 2.49
2542 2 2.2 0.618 2.959
2542 1 0.7 0.457 2.185
2542 3 3.7 0.511 2.447
2542 4 5.2 0.528 2.256 repeated resistivity
2542 4 5.2 0.554 2.65
2542 5 6.8 0.573 2.74
2545 1 0.4 0.421 2.013
2545 2 1.5 0.337 1.612
2545 2 2.43 0.32 1.53
2545 2 2.53 0.301 1.44
Physical Properties 4-51

Table 6. Electrical resistivity and formation factor results. — Continued
[mbsf, meters below sea floor; cm, centimeters]
Core SectionSub-
bottom depth (mbsf)
Resistivity (ohm-m)
Formation factor
Comments
2545 4 3.35 0.405 1.938
2545 5 4.35 0.29 1.388 gas cracks - not sure if resistivity is meaningful
2545 6 5.3 0.255 1.218
2545 6 5.35 0.268 1.283 strong smell of H2S; lots of large gas cracks throughout the core
2545 7 6.45 0.28 1.341 small air pockets
2545 8 7.4 0.31 1.482
2545 9 8.5 0.339 1.623
2545 10 9.15 0.366 1.753
2546 1 0.9 0.405 1.938
2546 2 2.2 0.428 2.047
2546 3 3.7 0.401 1.918
2546 4 5.2 0.424 2.03
2546 5 6.7 0.509 2.437
2546 6 7.8 0.49 2.343
2546 7 9.7 0.541 2.588
2546 8 11.1 0.497 2.374
2546 9 12.8 0.467 2.235 gas cracks on each side
2546 10 15.1 0.486 2.325
2546 11 15.7 0.483 2.31
2546 12 17.2 0.489 2.34
2546 13 18.65 0.449 2.147 gas crack next to thermal conductivity measurement, many small gas cracks
2546 14 20.4 0.538 2.574
2546 15 21.7 0.471 2.253 gas cracks on each side
2546 16 23.2 0.481 2.302
2546 17 24.7 0.459 2.196
2546 18 26.2 0.549 2.629
2546 19 27.7 0.543 2.6
2546 20 29.2 0.452 2.164
2546 21 30.6 0.482 2.305
2547 1 0.75 0.427 2.043
2547 2 2.2 0.44 2.105
2547 3 3.7 0.486 2.324
2547 4 5.1 0.528 2.526
2554 1 0.7 0.393 1.88
2554 2 2.2 0.41 1.962
2554 3 3.7 0.425 2.033
4-52 Initial Report of the IMAGES VIII/PAGE 127 Gas Hydrate and Paleoclimate Cruise in the Gulf of Mexico, 2–18 July 2002

Table 6. Electrical resistivity and formation factor results. — Continued
[mbsf, meters below sea floor; cm, centimeters]
Core SectionSub-
bottom depth (mbsf)
Resistivity (ohm-m)
Formation factor
Comments
2554 4 5.2 0.443 2.122
2554 5 6.8 0.501 2.395
2554 6 8.2 0.546 2.615
2554 7 9.75 0.611 2.924
2554 8 11.2 0.644 3.083
2554 9 12.6 0.761 3.64
2554 10 14 0.774 3.704
2554 11 15.6 0.877 4.198
2554 12 17.3 0.844 4.04
2554 13 19.1 0.867 4.148 large gas crack @ ~1720
2554 14 20 0.799 3.823
2554 15 21.45 0.739 3.534
2554 16 23 0.74 3.539
2554 17 24.6 0.806 3.856 banding pull downs 2340–2432 cm?
2554 18 26.05 0.857 4.099
2554 19 27.4 0.891 4.264
2554 20 29 0.858 4.107
2554 21 30.35 0.797 3.814
2555 1 1.1 0.427 2.041
2555 2 2 0.462 2.208
2555 3 3.5 0.449 2.149
2555 4 5.2 0.5 2.391
2555 5 6.7 0.552 2.64
2555 6 8.2 0.565 2.702
2555 7 9.7 0.649 3.104
2555 8 11.2 0.624 2.983
2555 9 12.65 0.667 3.19
2555 10 14.2 0.704 3.367
2555 11 15.8 0.944 4.519
2555 12 17.2 0.765 3.661
2555 13 18.7 0.906 4.336
2555 14 20.2 0.846 4.047
2555 15 21.6 0.935 4.476
2555 16 23.2 0.891 4.265
2555 17 24.9 0.878 4.201
2555 18 26.2 0.876 4.189
2555 19 27.6 1.062 5.081
2555 20 29.2 0.954 4.566
Physical Properties 4-53

Table 6. Electrical resistivity and formation factor results. — Continued
[mbsf, meters below sea floor; cm, centimeters]
Core SectionSub-
bottom depth (mbsf)
Resistivity (ohm-m)
Formation factor
Comments
2555 21 30.7 0.904 4.324
2555 22 32.2 0.726 3.476
2555 23 33.85 0.758 3.628
2555 24 35.1 0.811 3.879
2556 1 0.7 0.375 1.792
2556 2 2.2 0.461 2.207
2556 3 3.7 0.429 2.054
2556 4 5.2 0.456 2.18
2556 5 6.7 0.482 2.307
2556 6 8.1 0.534 2.556
2556 7 9.7 0.573 2.743
2556 8 11.6 0.571 2.733
2556 9 12.7 0.574 2.746
2556 10 14.2 0.624 2.184
2556 11 15.4 0.636 3.045
2556 12 17.15 0.731 3.496
2556 13 18.7 0.661 3.164
2556 14 20.2 0.672 3.213
2556 15 21.7 0.646 3.089
2556 16 23.3 0.68 3.252
2556 17 24.8 0.689 3.297
2556 18 26.2 0.717 3.432
2556 19 27.7 0.759 3.629
2556 20 29.2 0.7 3.349
2556 21 30.7 0.67 3.204
2556 22 32.1 0.766 3.665
2556 23 33.75 0.778 3.725
2559 1 0.2 0.353 1.69
2559 2 2.1 0.445 2.129
2559 3 3.7 0.431 2.06
2559 4 5.1 0.475 2.274
2559 5 6.6 0.499 2.39
2559 6 8.1 0.489 2.338
2559 7 9.6 0.573 2.742
2559 8 11.2 0.631 3.018
2559 9 12.6 0.672 3.214
2559 10 14.1 0.654 3.13
4-54 Initial Report of the IMAGES VIII/PAGE 127 Gas Hydrate and Paleoclimate Cruise in the Gulf of Mexico, 2–18 July 2002
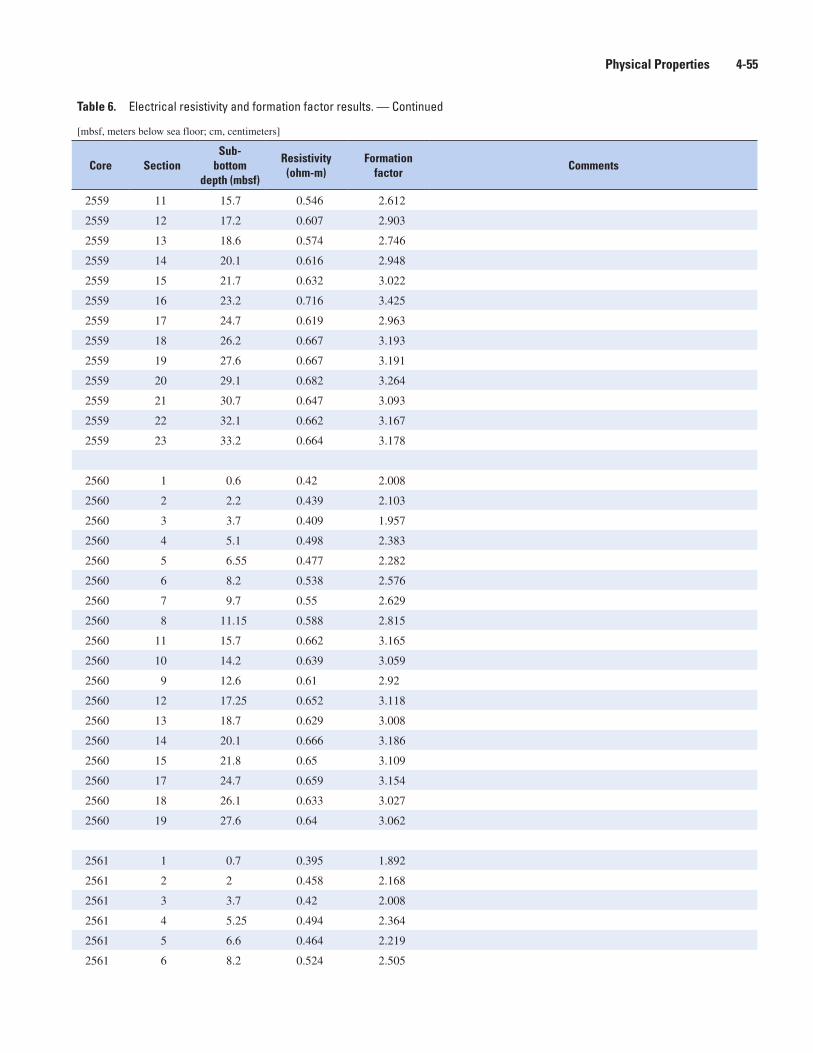
Table 6. Electrical resistivity and formation factor results. — Continued
[mbsf, meters below sea floor; cm, centimeters]
Core SectionSub-
bottom depth (mbsf)
Resistivity (ohm-m)
Formation factor
Comments
2559 11 15.7 0.546 2.612
2559 12 17.2 0.607 2.903
2559 13 18.6 0.574 2.746
2559 14 20.1 0.616 2.948
2559 15 21.7 0.632 3.022
2559 16 23.2 0.716 3.425
2559 17 24.7 0.619 2.963
2559 18 26.2 0.667 3.193
2559 19 27.6 0.667 3.191
2559 20 29.1 0.682 3.264
2559 21 30.7 0.647 3.093
2559 22 32.1 0.662 3.167
2559 23 33.2 0.664 3.178
2560 1 0.6 0.42 2.008
2560 2 2.2 0.439 2.103
2560 3 3.7 0.409 1.957
2560 4 5.1 0.498 2.383
2560 5 6.55 0.477 2.282
2560 6 8.2 0.538 2.576
2560 7 9.7 0.55 2.629
2560 8 11.15 0.588 2.815
2560 11 15.7 0.662 3.165
2560 10 14.2 0.639 3.059
2560 9 12.6 0.61 2.92
2560 12 17.25 0.652 3.118
2560 13 18.7 0.629 3.008
2560 14 20.1 0.666 3.186
2560 15 21.8 0.65 3.109
2560 17 24.7 0.659 3.154
2560 18 26.1 0.633 3.027
2560 19 27.6 0.64 3.062
2561 1 0.7 0.395 1.892
2561 2 2 0.458 2.168
2561 3 3.7 0.42 2.008
2561 4 5.25 0.494 2.364
2561 5 6.6 0.464 2.219
2561 6 8.2 0.524 2.505
Physical Properties 4-55

Table 6. Electrical resistivity and formation factor results. — Continued
[mbsf, meters below sea floor; cm, centimeters]
Core SectionSub-
bottom depth (mbsf)
Resistivity (ohm-m)
Formation factor
Comments
2561 7 9.7 0.553 2.646
2561 8 10.9 0.613 2.933
2561 9 12.7 0.65 3.108
2561 10 14.1 0.66 3.159
2561 11 15.7 0.664 3.177
2561 12 17.5 0.628 3.006
2561 13 18.7 0.733 3.507
2561 14 20.2 0.705 3.374
2561 15 21.7 0.693 3.316
2561 16 24.6 0.69 3.3
2561 17 23.3 0.691 3.307
2561 18 26.2 0.748 3.581
2561 19 27.6 0.753 3.603
2562 1 0.5 0.508 2.43
2562 2 2.05 0.481 2.303
2562 3 3.7 0.628 3.006
2562 4 5.2 0.569 2.721
2562 5 6.4 0.637 3.049
2562 6 8.2 0.629 3.011
2562 7 9.7 0.798 3.817
2562 8 11 0.708 3.387
2562 9 12.6 0.727 3.478
2562 10 14.2 0.656 3.14
2562 11 15.6 0.583 2.97
2562 12 17.2 0.676 3.233
2562 13 18.6 0.648 3.1
2562 14 20.35 0.719 3.442
2562 15 21.7 0.675 3.228
2562 16 23.2 0.714 3.415
2562 17 24.6 0.715 3.419
2562 18 25.8 0.692 3.311
2566 1 0.6 0.362 1.734
2566 2 2 0.417 2.045
2566 3 3.7 0.396 1.894
2566 4 5.2 0.425 2.033
2566 5 6.25 0.498 2.384
2566 6 8.2 0.58 2.776
4-56 Initial Report of the IMAGES VIII/PAGE 127 Gas Hydrate and Paleoclimate Cruise in the Gulf of Mexico, 2–18 July 2002

Table 6. Electrical resistivity and formation factor results. — Continued
[mbsf, meters below sea floor; cm, centimeters]
Core SectionSub-
bottom depth (mbsf)
Resistivity (ohm-m)
Formation factor
Comments
2566 7 9.7 0.466 2.223
2566 8 11 0.598 2.859
2566 9 12.55 0.591 2.78
2566 10 14.2 0.602 2.879
2566 11 15.7 0.623 2.981
2566 12 17.2 0.675 3.23
2566 13 18.5 0.647 3.096
2566 14 20.1 0.716 3.472
2566 15 21.7 0.69 3.301
2566 16 23.2 0.7 3.35
2566 17 24.8 0.708 3.387
2566 18 25.8 0.739 3.534
2567 1 0.6 0.339 1.621
2567 2 2.05 0.392 1.875
2567 3 3.6 0.38 1.81
2567 4 5.2 0.465 2.224
2567 5 6.4 0.537 2.569
2567 6 8.2 0.509 2.436
2567 7 9.7 0.55 2.632
2567 8 11 0.524 2.506
2567 9 12.5 0.602 2.882
2567 10 14.2 0.604 2.891
2567 11 15.7 0.621 2.97
2567 12 17.2 0.674 3.224
2567 13 18.5 0.734 3.511
2567 14 20.2 0.703 3.365
2567 15 21.7 0.619 2.961
2567 16 23.2 0.725 3.469
2567 17 24.55 0.678 3.246
2567 18 26.05 0.666 3.187
2570 1 0.5 0.386 1.845
2570 2 2.05 0.444 2.123
2570 3 3.7 0.475 2.274 highly gas cracked sediment throughout the core
2570 4 5.1 0.503 2.405
2570 5 6.5 0.512 2.452
2570 6 8.1 0.567 2.712
2570 7 10.2 0.522 2.499
Physical Properties 4-57

Table 6. Electrical resistivity and formation factor results. — Continued
[mbsf, meters below sea floor; cm, centimeters]
Core SectionSub-
bottom depth (mbsf)
Resistivity (ohm-m)
Formation factor
Comments
2570 8 11 0.588 2.184
2570 9 12.9 0.56 2.679
2570 10 14.3 0.679 3.251
2570 11 15.7 0.632 3.022
2570 12 17.4 0.598 2.862
2570 13 18.6 0.617 2.951
2570 14 20.3 0.626 2.996
2570 15 21.5 0.733 3.509
2570 16 23 0.691 3.304
2570 17 24.7 0.699 3.346
2570 18 26.1 0.704 3.368
2570 19 27.7 0.68 3.256
2574 1 1 0.41 1.962 French core - no vane shear measurements
2574 2 2.1 0.437 2.093
2574 3 4 0.487 2.332
2574 5 6.7 0.509 2.435
2574 6 8.3 0.556 2.659
2574 7 9.8 0.607 2.904
2574 8 11.2 0.587 2.81
2574 8 11.2 0.547 2.619
2574 9 12.8 0.617 2.953
2574 10 14.3 0.674 3.227
2574 11 15.8 0.672 3.214
2574 12 17.4 0.665 3.18
2574 13 20.2 0.665 3.181
2574 15 21.8 0.945 4.523
2574 16 23.4 0.824 3.941
2574 17 24.8 1.02 4.879
2574 18 26.2 0.788 3.773
2574 19 27.8 0.99 4.736
2574 20 29.2 1.012 4.843
2574 21 30.8 1.043 4.987
2574 22 31.9 1.069 5.115
4-58 Initial Report of the IMAGES VIII/PAGE 127 Gas Hydrate and Paleoclimate Cruise in the Gulf of Mexico, 2–18 July 2002

Table 7. Grain size results. — Continued
[m, meters; %, percent]
CoreSec-tion
Sub- bottom depth
(m)
Gravel (%)
Sand (%)
Silt (%)
Clay (%)
Gravel notes
SHEPARD CLASS
Comments
2535 1 0.67 0 6.54 12.51 80.95 CLAY
2535 4 5.18 0 0.56 18.44 81 CLAY
2535 7 9.78 0 0.1 31.98 67.92 SILTY CLAY
2535 11 15.72 0 0.75 12.55 86.7 CLAY
2535 14 20.19 0 0.92 11.32 87.76 CLAY
2535 17 24.76 1.03 0.53 19.78 78.66 wood frag-ments
CLAY
2535 20 29.19 0 1.25 15.55 83.2 CLAY
2535 23 33.6 0 0.57 8.86 90.57 CLAY
2536 1 0.64 0 0.95 14.67 84.39 CLAY
2536 6 8.18 0 0.82 12.03 87.15 CLAY
2537 1 0.83 0 1.25 16.7 82.05 CLAY
2537 4 5.2 0 0.5 15.89 83.6 CLAY full pipette analysis performed
2537 9 12.67 0 0.11 23.87 76.02 CLAY
2537 11 15.79 0 0.15 33.09 66.76 SILTY CLAY
2537 14 20.07 0 0.76 11.38 87.86 CLAY
2537 17 24.58 0 1.06 15.78 83.16 CLAY
2537 20 28.87 0 0.69 22.23 77.08 CLAY
2537 23 33.08 0 2.34 17.99 79.67 CLAY
2538 1 0.65 0 2.4 14.63 82.97 CLAY
2538 5 6.67 0 0.13 28.42 71.45 SILTY CLAY
2539 1 0.67 0 3.43 20.95 75.61 CLAY
2539 4 5.17 0 0.56 24.28 75.16 CLAY
2539 7 9.71 0 0.09 31.49 68.42 SILTY CLAY
2539 11 15.68 0 0.09 29.43 70.48 SILTY CLAY
2539 14 19.97 0 0.18 24.91 74.91 SILTY CLAY
2540 1 0.59 0 4.21 18.7 77.09 CLAY
2540 4 5.11 0 0.24 23.69 76.06 CLAY
2541 1 0.55 0 6.49 11.67 81.84 CLAY
2541 4 5.17 0 0.21 18.79 80.99 CLAY
2541 7 9.67 0 0.24 23.98 75.78 CLAY
2541 11 15.66 4 1.18 12.01 82.8 nodules CLAY
Physical Properties 4-59

Table 7. Grain size results. — Continued
[m, meters; %, percent]
CoreSec-tion
Sub- bottom depth
(m)
Gravel (%)
Sand (%)
Silt (%)
Clay (%)
Gravel notes
SHEPARD CLASS
Comments
2541 14 20.18 0 0.38 20.96 78.66 CLAY
2541 20 29.14 0 0.13 15.91 83.95 CLAY
2541 24 34.88 0 0.66 24.03 75.31 CLAY
2542 5 6.77 0 0.69 12.7 86.62 CLAY
2545 1 0.37 0 2.5 15.44 82.07 CLAY
2545 6 5.27 0 0.17 24.35 75.48 CLAY
2545 10 9.16 0 0.11 40.02 59.87 SILTY CLAY
2546 1 0.53 0 1.05 13.15 85.8 CLAY
2546 7 9.58 0 0.25 27.63 72.13 SILTY CLAY
2546 11 15.67 0 0.78 14.97 84.24 CLAY
2546 14 20.28 0 0.57 21.34 78.09 CLAY
2546 17 24.71 0 0.35 16.9 82.74 CLAY
2546 21 30.57 0.17 1.61 17.19 81.03 shell frag-ments
CLAY
2547 1 0.72 0 1.1 9.43 89.47 CLAY
2547 4 4.98 0 0.19 27.82 71.99 SILTY CLAY
2550 1 4.01 0 1.42 20.08 78.5 CLAY
2550 2 5.01 0 0.74 20.28 78.99 CLAY
2550 3 6.01 0 0.34 15.47 84.19 CLAY
2550 4 6.91 0 0.12 19.33 80.56 CLAY
2550 5 8.01 0 0.1 19.31 80.58 CLAY
2550 6 8.91 0 0.04 26.53 73.42 SILTY CLAY
2553 1 1.01 0 0.85 19.01 80.14 CLAY
2553 2 1.71 0 1.07 18.51 80.43 CLAY
2553 3 2.01 0 0.72 21.58 77.7 CLAY
2553 4 3.11 0 1.64 20.43 77.92 CLAY
2553 5 4.01 0 5.58 20.19 74.23 SILTY CLAY
2553 6 5.01 0 0.01 11.1 88.89 CLAY full pipette analysis performed
2553 7 6.11 0 0.19 10.89 88.92 CLAY
2553 8 7.01 0 0.03 9.41 90.56 CLAY
2553 9 8.01 0 0.03 10.84 89.13 CLAY
2553 10 9.01 0 0.03 6.63 93.34 CLAY
4-60 Initial Report of the IMAGES VIII/PAGE 127 Gas Hydrate and Paleoclimate Cruise in the Gulf of Mexico, 2–18 July 2002

Table 7. Grain size results. — Continued
[m, meters; %, percent]
CoreSec-tion
Sub- bottom depth
(m)
Gravel (%)
Sand (%)
Silt (%)
Clay (%)
Gravel notes
SHEPARD CLASS
Comments
2553 11 10.01 0 0.03 18.71 81.26 CLAY
2554 1 0.74 0 1.38 24.04 74.58 SILTY CLAY
2554 4 5.18 0 0.16 5.17 94.67 CLAY full pipette analysis performed
2554 14 5.18 0 0.09 37.19 62.72 SILTY CLAY
2554 7 9.78 0 0.26 27.74 72 SILTY CLAY
2554 11 15.58 0 0.08 24.84 75.07 CLAY
2554 17 24.29 0 0.15 36.01 63.84 SILTY CLAY
2554 21 30.32 0 0.07 33.28 66.65 SILTY CLAY
2555 1 1.08 0 1.07 12.65 86.28 CLAY
2555 4 5.17 0 0.48 6.78 92.74 CLAY
2555 7 9.67 0 0.59 24.53 74.88 SILTY CLAY
2555 11 15.75 0 0.08 25.64 74.28 SILTY CLAY
2555 14 20.21 0 0.07 37.52 62.41 SILTY CLAY
2555 18 26.17 0 0.08 27.16 72.76 SILTY CLAY
2555 21 30.67 0 0.1 30.01 69.89 SILTY CLAY
2555 22 32.15 0 0.06 35.4 64.54 SILTY CLAY
2555 24 35.05 0 0.11 22.1 77.79 CLAY
2556 1 0.67 0 0.77 17.42 81.81 CLAY
2556 4 5.17 0 0.21 12.35 87.43 CLAY
2556 7 9.68 0 0.14 29.68 70.18 SILTY CLAY
2556 11 15.38 0 0.05 37.73 62.22 SILTY CLAY
2556 14 20.18 0 0.09 26.21 73.7 SILTY CLAY
2556 16 23.27 0 0.08 33 66.92 SILTY CLAY
2556 17 24.78 0 0.09 27.93 71.98 SILTY CLAY
2556 21 30.67 0 0.24 19.7 80.06 CLAY
2556 23 33.78 0 0.05 33.15 66.8 SILTY CLAY
2557 1 0.6 0 0.52 13.59 85.89 CLAY
2559 1 0.21 0 0.25 14.36 85.39 CLAY
2559 4 5.11 0 0.08 22.49 77.43 CLAY
2559 7 9.54 0 0.18 23.13 76.7 CLAY
2559 11 15.68 0 0.06 23.43 76.51 CLAY
2559 14 20.08 0 0.15 23.95 75.89 CLAY
2559 17 24.67 0 0.04 36.57 63.39 SILTY CLAY
Physical Properties 4-61

Table 7. Grain size results. — Continued
[m, meters; %, percent]
CoreSec-tion
Sub- bottom depth
(m)
Gravel (%)
Sand (%)
Silt (%)
Clay (%)
Gravel notes
SHEPARD CLASS
Comments
2559 21 30.65 0 0.07 29.18 70.75 SILTY CLAY
2559 23 33.15 0 0.08 18.9 81.01 CLAY
2560 1 0.57 0 0.61 11.63 87.75 CLAY
2560 11 15.67 0 0.07 28.87 71.06 SILTY CLAY
2560 14 20.09 0 0.04 34.77 65.19 SILTY CLAY
2560 17 24.72 0 0.03 37.31 62.66 SILTY CLAY
2561 1 0.61 0 1.42 12.8 85.79 CLAY
2561 4 5.23 0 0.05 24.88 75.08 CLAY
2561 7 9.68 0 0.19 17.53 82.28 CLAY
2561 11 15.66 0 0.04 35.52 64.43 SILTY CLAY
2561 14 20.15 0 0.05 32.03 67.91 SILTY CLAY
2561 19 27.57 0 0.03 27.58 72.38 SILTY CLAY
2562 1 0.48 0 0.04 13.33 86.63 CLAY
2562 4 5.18 0 0.03 19.09 80.87 CLAY
2562 8 10.97 0 0.04 26.39 73.56 SILTY CLAY
2562 11 15.58 0 0.06 21.48 78.46 CLAY
2562 14 20.31 0 0.04 24.77 75.19 CLAY
2562 18 25.77 0 0.05 23.97 75.97 CLAY
2564 1 0.99 0 3.46 15.59 80.95 CLAY
2564 5 6.69 0 0.04 24.79 75.16 CLAY
2565 1 0.025 0 0.09 21.31 78.6 CLAY
2565 2 1.51 0 0.43 26.58 73 SILTY CLAY
2565 3 3.01 0 1.16 21.98 76.86 CLAY
2565 4 4.51 0 0.06 34.4 65.53 SILTY CLAY
2565 5 6.315 0.06 0.35 19.54 79.98 CLAY full pipette analysis performed
2565 6 7.515 0 1.95 28.65 69.4 SILTY CLAY
2565 7 9.015 0 1.07 23 75.93 CLAY
2565 8 10.515 0 0.3 20.94 78.76 CLAY
2565 9 12.015 0 0.24 25.86 73.9 SILTY CLAY
2565 10 13.515 0 0.31 25.97 73.72 SILTY CLAY
2565 11 15.015 0 2.1 23.5 74.4 SILTY CLAY
2565 12 16.515 0 0.3 30.43 69.27 SILTY CLAY
2565 13 18.015 0 0.12 24.94 74.94 SILTY CLAY
4-62 Initial Report of the IMAGES VIII/PAGE 127 Gas Hydrate and Paleoclimate Cruise in the Gulf of Mexico, 2–18 July 2002

Table 7. Grain size results. — Continued
[m, meters; %, percent]
CoreSec-tion
Sub- bottom depth
(m)
Gravel (%)
Sand (%)
Silt (%)
Clay (%)
Gravel notes
SHEPARD CLASS
Comments
2565 14 19.515 0 0.13 25.42 74.45 SILTY CLAY
2565 15 21.015 0 0.27 25.7 74.03 SILTY CLAY
2565 16 22.515 0 0.11 16.15 83.73 CLAY
2566 1 0.57 0 1.02 19.99 78.99 CLAY
2566 4 5.17 0 0.06 18.58 81.36 CLAY
2566 7 9.68 0 0.2 18.47 81.33 CLAY
2566 11 15.67 0 0.06 26.1 73.84 SILTY CLAY
2566 14 20.15 0 0.04 32.28 67.68 SILTY CLAY
2566 18 25.78 0 0.04 35.7 64.26 SILTY CLAY
2567 1 0.53 0 2.29 11.68 86.03 CLAY
2567 4 5.18 0 0.05 15.66 84.28 CLAY
2567 7 9.68 0 0.04 29.38 70.58 SILTY CLAY
2567 11 15.68 0 0.06 25.46 74.49 SILTY CLAY
2567 14 20.18 0 0.05 34.43 65.52 SILTY CLAY
2567 18 26.04 0 0.03 16.54 83.43 CLAY
2568 1 0.015 0 3.15 17.6 79.25 CLAY
2568 3 4.485 0 0.03 27.53 72.43 SILTY CLAY
2569 1 0.015 15.18 0.97 30.05 53.81 bricks/nod-ules?
GRAVELLY SEDIMENT
2569 2 1.015 0 2.41 35.42 62.17 SILTY CLAY
2569 6 4.215 0 1.57 24.96 73.49 SILTY CLAY full pipette analysis performed
2569 7 5.225 0 1.63 25.86 72.5 SILTY CLAY
2569 9 7.385 0 2.17 30.73 67.1 SILTY CLAY
2569 10 7.54 0 2.59 32.97 64.44 SILTY CLAY
2569 12 9.935 0.8 3.15 36.94 59.11 coral/nod-ule?
SILTY CLAY
2570 1 0.57 0 0.43 24.31 75.27 CLAY
2570 4 5.13 0 0.07 5.21 94.71 CLAY full pipette analysis performed
2570 7 10.22 0 1.27 21.9 76.82 CLAY
2570 11 15.69 0 0.91 16.71 82.38 CLAY
2570 15 21.51 0 0.03 25.56 74.41 SILTY CLAY
2570 18 26.1 0 0.15 21.47 78.38 CLAY
Physical Properties 4-63

Table 7. Grain size results. — Continued
[m, meters; %, percent]
CoreSec-tion
Sub- bottom depth
(m)
Gravel (%)
Sand (%)
Silt (%)
Clay (%)
Gravel notes
SHEPARD CLASS
Comments
2572 1 0.015 0 0.68 20.38 78.94 CLAY
2572 2 1.515 0 2.64 22.48 74.88 SILTY CLAY
2572 3 1.805 0 4.27 21.76 73.97 SILTY CLAY
4-64 Initial Report of the IMAGES VIII/PAGE 127 Gas Hydrate and Paleoclimate Cruise in the Gulf of Mexico, 2–18 July 2002