Embed Size (px)
Citation preview

Meteoritics & Planetary Science 39, Nr 6, 799–812 (2004)Abstract available online at http://meteoritics.org
799 © Meteoritical Society, 2004. Printed in USA.
Physical properties of rocks from the upper part of the Yaxcopoil-1 drill hole, Chicxulub crater
Y. POPOV,1 R. ROMUSHKEVICH,1 I. BAYUK,1 D. KOROBKOV,1 S. MAYR,2H. BURKHARDT,2* and H. WILHELM3
1Moscow State Geological Prospecting University, Moscow, Russia2Department of Applied Geosciences, Technical University, Berlin, Germany
3Geophysical Institute, University Karlsruhe, Germany*Corresponding author. E-mail: [email protected]
(Received 10 September 2003; revision accepted 22 April 2004)
Abstract–Physical properties were determined in a first step on post-impact tertiary limestones fromthe depth interval of 404–666 m of the Yaxcopoil-1 (Yax-1) scientific well, drilled in the Chicxulubimpact crater (Mexico). Thermal conductivity, thermal diffusivity, density, and porosity weremeasured on 120 dry and water-saturated rocks with a core sampling interval of 2–2.5 m. Non-destructive, non-contact optical scanning technology was used for thermal property measurementsincluding thermal anisotropy and inhomogeneity. Supplementary petrophysical properties (acousticvelocities, formation resisitivity factor, internal surface, and hydraulic permeability) were determinedon a selected subgroup of representative samples to derive correlations with the densely measuredparameters, establishing estimated depth logs to provide calibration values for the interpretation ofgeophysical data. Significant short- and long-scale variations of porosity (1–37%) turned out to be thedominant factor influencing thermal, acoustic, and hydraulic properties of this post impact limestoneformation. Correspondingly, large variations of thermal conductivity, thermal diffusivity, acousticvelocities, and hydraulic permeability were found. These variations of physical properties allow us tosubdivide the formation into several zones. A combination of experimental data on thermalconductivity for dry and water-saturated rocks and a theoretical model of effective thermalconductivity for heterogeneous media have been used to calculate thermal conductivity of mineralskeleton and pore aspect ratio for every core under study. The results on thermal parameters are thenecessary basis for the determination of heat flow density, demonstrating the necessity of densesampling in the case of inhomogeneous rock formations.
INTRODUCTION
From geothermal investigations for the KTB (Germany)and Kola (Russia) superdeep wells (Huenges et al. 1990;Burkhardt et al. 1991; Clauser et al. 1997; Popov et al. 1999a),it was found that measurements of thermal conductivity witha spacing of 1–2.5 m are necessary to study vertical variationsof geothermal parameters and to determine the terrestrial heatflow density value reliably.
Geothermal investigations performed in recent years atthe Vorotilovo deep scientific well drilled in the Puchezh-Katunk impact structure (Russia) (rock thermal conductivitymeasured for 3715 cores) and the Noerdlingen-1973 scientificwell drilled in the Ries impact structure (Germany) (rockthermal conductivity measured for 517 cores) showed certainpeculiarities that may be typical of impact structures: 1) low
thermal anisotropy of rocks; 2) low values of impact rockthermal conductivity in comparison with similar rocks outsideimpact structures that could be caused by shock-thermalmetamorphism of rocks; 3) substantial vertical localvariations of temperature gradient and heat flow densitycaused by paleoclimate and fluid motions through relativelypermeable rocks of the impact structures are typical for entiresection; and 4) the heat flow density in the lower parts of theimpact structures was found to be lower than regional heatflow density due to the local refraction of heat flow on impactstructures (Popov et al. 1998, 2000).
Therefore, numerous measurements of rock thermalproperties of the cores from the Yaxcopoil-1 (Yax-1) welldrilled within the Chicxulub impact crater (Dressler et al.2003) were carried out for geothermal investigations and tostudy petrophysical aspects of the well section with regard to

800 Y. Popov et al.
the influence of the impact on physical properties of rocks aswell as correlations between thermal and other physicalproperties measured in the cores and with logging methods.These correlations provide calibration values for theinterpretation of geophysical data of the impact structure.
Due to an unexpected delay in sample access, the presentinvestigation had to be restricted to the post-impact Tertiarysection in the depth range of 404–666 m.
DESCRIPTION OF ROCK COLLECTION
The post-impact rocks of the Chicxulub structurepresently studied are, in general, represented by tertiarylimestones. The rock color varies from white, cream, andlight-grey (practically without impurities) to brown, dark-brown, and grey (with impurities of iron oxide, coaly, andclayey components). The rock structure is massive,horizontal bedding (horizontal-lamination), wave-likebedding (wave-like lamination), and cross-bedding. The rocktexture is mainly pelitomorphic and fine-grained. The rock-forming components of studied limestones are, in general,represented by foraminiferas; in some cases, these arelongitudinal and transverse sections of Porifera spiculas. Thesize of foraminifera shells varies from 0.02 to 0.16 mm. Thewalls of foraminifera shells have, in general, densemicrogranular texture. In particular cases, one can see radialorientation of calcite forming the shell walls. The size ofPorifera spiculas ranges from 0.01 to 0.3 mm. Commonly,the spiculas are uniaxial and composed by silica material(chalcedony) along which calcite develops, and chalcedonyof small Poriferas (0.01 mm) is completely replaced bycalcite. The binding material consists of fine-grained orpelitomorphic calcite; some of the material is composed ofneogenic calcite having greater size. In some samples (at thedepths of 478.4 and 512 m), idiomorphic-grained (rhomboid)metacrystalline dolomite occurs. Impurities of blackcarbonaceous substance are seen in the majority of thesamples, both in binding material and in rock-formingcomponents.
A total of 120 cores recovered from the depth interval of404.35–666.33 m have been studied in this first stage of theresearch. The core sampling interval was 2–2.5 m. Physicalproperty measurements have been performed on cores with alength range of 40–80 mm. For the 120 cores, thermalproperties were studied in a dry state. Only 101 cores werestudied in a water-saturated state because of the danger ofdestroying the other 19 cores by the water-saturationprocedure.
Supplementary petrophysical properties have beendetermined on 12 representative samples (cf., Fig. 13g)selected according to the results of thermophysicalmeasurements.
EXPERIMENTAL METHODS
Thermophysical Properties, Density, and Porosity
Non-contact optical scanning technology was found tobe best suited for geothermal and petrophysicalinvestigations (Popov 1997; Popov et al. 1999b). Themeasurement procedure is described in detail in Popov andMandel (1998).
The thermal conductivity tensor components λ|| and λ⊥(parallel and perpendicular to rock bedding, respectively) andcorresponding thermal diffusivity a tensor components weremeasured on dry samples and on samples after saturation withwater. Rock saturation with water was carried out undervacuum conditions. Optical scanning allows us to recordthermal conductivity and diffusivity values along each core,with the spatial resolution of λ recording about 1 cm and arecording about 1.5 cm (Fig. 1). The total errors of thermalproperty measurements (taking into account accuracy and
Fig. 1. Thermal conductivity profile along a dry core (sample 1394,depth 613.79 m).

Physical properties of rocks from the upper part of Yaxcopoil-1 801
precision) are about 2.5% for thermal conductivity and 4% forthermal diffusivity (for a confidence probability of 0.95)(Popov 1984).
Volumetric heat capacity Cρ (where C is specific heatcapacity and ρ is rock density) was determined as Cρ = λ/a,and the specific heat capacity was calculated from the formulaC = λ/aρ after λ, a, and ρ were determined independently fordry and water-saturated samples. The anisotropy coefficient Kwas determined as K = λ||/λ⊥. The thermal inhomogeneityfactor β (β = [λmax−λmin]/λaver, where λmax, λmin, and λaver aremaximum, minimum, and average thermal conductivitiesrecorded along each scanning line) was determined for eachscanning line and for each core sample to characterize thethermal inhomogeneity of rocks (see Fig. 1).
The porosity Φ and density ρ of rock samples weredetermined using the water saturation method with a basicerror of ±0.005 and 0.005 g/cm3, respectively.
S u p p l e m e n t a r y P e t ro p h y s i c a l P ro p e r t i e s f o rRepresentative Samples
Acoustic compressional vp and shear vs wave velocities indry and water-saturated samples were determined with a pulsetransmission technique in the ultrasonic frequency range(0.4–1 MHz) (Wulff and Burkhardt 1996, 1997; Mayr 2002).Velocities were measured in radial and axial directions of thesamples, i.e., parallel and perpendicular to the horizontallayering of the limestones. For the measurementsperpendicular to layering, the samples had to be prepared.This was not possible for all 12 samples; therefore, theseresults are available for only seven samples. The maximumerror of measured velocities is 5% in the parallel and 3% inthe perpendicular direction.
The resistivity formation factor F (e.g., Schoen 1996)was determined for 11 samples perpendicular to layering witha four-point configuration.
The absolute internal surface Sabs (Schopper 1982) wasmeasured with the BET-method (nitrogen gas) for 10samples. The nuclear magnetic resonance (NMR) relaxationtime T2 (Kenyon 1997) was determined for six water-saturated samples. The gas-permeability k was measured onfive samples. Due to the necessary sample size required forthe measurements, permeability could only be determinedperpendicular to layering. All measurements were performedunder ambient conditions since, in the investigated depthrange up to 660 m, the influence of pressure is expected to berather small for the compact limestones (e.g., Schoen 1996).
EXPERIMENTAL RESULTS
Thermophysical Properties, Density, and Porosity
Thermal conductivity λ and thermal diffusivity a tensorcomponents, volumetric heat capacity Cρ, specific heat
capacity C, the anisotropy coefficient K, the thermalinhomogeneity factor β, porosity Φ, and density ρ have beendetermined on 120 samples from the depth interval of404.35–666.33 m with average sampling of about 2.2 m.
The measured rock porosity ranges from 0.017 to 0.366at an average value of 0.237. For 70% of the cores, porosity iswithin the range of 0.20–0.37, therefore, the studiedlimestones should be considered as high-porous rocks.
According to the measurement results, the thermalconductivity ranges are 0.65–2.69 W/(m · K) and 1.57–2.73W/(m · K), the thermal diffusivity ranges are (0.69–1.44) ×10−6 m2/s and (0.59–1.56) × 10−6 m2/s, the volumetric heatcapacity ranges are 0.94–2.01 MJ/(m2 · K) and 1.55–3.17 MJ/(m2 · K), and the specific heat capacity ranges are (0.57–0.88)× 103 J/kg · K and (0.62–1.52) × 103 J/(kg · K) for dry andwater-saturated rock samples, respectively.
As was established earlier, the λ|| component is preferablefor studying correlations between λ and other physicalproperties (Popov et al. 2003). The experimental data (meanvalues for each sample [see Fig. 1 and thermal inhomogeneityfactor β in Fig. 7]) from λ|| for dry (λ||d) and water-saturated(λ||s) cores are shown in Fig. 2 together with data on solidity,which is determined as 1 − Φ, where Φ is porosity. Thefollowing peculiarities in λ data should be noted:
• Significant short-scale and long-scale variations in λvalues along the section (within a range of 0.6–2.5 W/(m · K) for dry cores and 1.6–2.6 W/(m · K) for water-saturated cores; that is, up to 70% for dry and 50% forwater-saturated samples relative to the average λ values);
• A coincidence in vertical variations of λ and solidity(porosity) (Fig. 3).
Three sections may be distinguished from the λd (dry) and λs(saturated) cores and porosity data from Fig. 2:
1. 404.35–533.38 m with large variations within the depthinterval where the average λd value is λd aver = 1.28 W/(m· K), RMSλd = 0.41 W/(m · K), λs aver = 1.88 W/(m · K),RMSλs = 0.22 W/(m · K), Φaver = 25.4, and RMSΦ =0.084;
2. 533.38–576.57 m, which should be considered asrelatively homogeneous with RMSλd = 0.14 W/(m · K) atlow thermal conductivity, λd aver = 1.07 W/(m · K) for dryrocks, RMSλs = 0.08 W/(m · K) and λs aver = 1.72 W/(m ·K), and high and stable porosity, Φaver =0.284 and RMSΦ= 0.029;
3. 576.57–666.33 m, with large variations (RMSλd = 0.40W/[m · K] and RMSλs = 0.25 W/[m · K]) at higher λvalues (λd aver = 1.62 W/[m · K] and λs aver = 2.09 W/[m ·K]) and lower Φ values (Φaver = 0.190 and RMSΦ =0.077). The third zone, 576.57–666.33 m, can be dividedinto two sub-zones with a boundary at 645 m.
Using statistical analysis based on the Wilcockson criteria χ2,it was established that intervals (1) and (2) should be united inone zone because the difference in λd aver is statisticallyinsignificant. Zone (3) is distinguished from zones (1) and (2)

802 Y. Popov et al.
by λd aver. Statistical analysis based on the Fisher criteria(comparison RMSλ values for two statistical groups) showedthat zones (1) and (2) can be distinguished on essentiallydifferent RMSλ values (0.41 and 0.14 W/[m · K]). Thus,zoning found from rock thermal conductivity is caused by λvariability that is connected with variations in rock porosity.
These results, as well as our previous data (Popov et al.2002, 2003), show that variations in thermal conductivity ofmost types of sedimentary rocks with porosity Φ > 0.10 arecaused by porosity variations when variations inmineralogical composition are of secondary importance.Fig. 3 illustrates these very close correlations betweenthermal conductivity for dry and water-saturated samples andporosity (correlation coefficient 0.97 and 0.86, respectively).
Experimental data on the thermal anisotropy coefficient K
= λ||/λ⊥ are shown in Fig. 4a. According to visual analysis ofevery core, the principal axes of thermal conductivity werechosen for the majority of samples to be oriented horizontally(sub-horizontally) and vertically (sub-vertically). Errors up to15% in orientation cannot influence essentially the results ofdetermination of the thermal conductivity tensor componentsand the anisotropy coefficient (Popov et al. 1999a). Theanisotropy coefficient was found to be not very significant—nomore than 1.22 for dry (1.06 on average) and no more than 1.13for water-saturated cores (1.02 on average). A decrease in theanisotropy coefficient after the water-saturation of cores (Fig.4a) should be explained by essential rock fracturing orientedmainly along the bedding plane. Filling open cracks with waterhaving thermal conductivity of 0.60 W/(m · K) increases the λ⊥component more than the λ|| component, which leads to adecrease in the thermal anisotropy of the rock samples.
Experimental data on volumetric heat capacity Cρ areshown in Fig. 4b as logs together with solidity (porosity) data.Correlations between Cρ (for dry and water-saturated cores)and porosity Φ are presented in Fig. 5. The close correlationbetween the Cρ of dry rocks and porosity can be explained bythe high contrast in Cρ values for air and rock skeleton. Inliterature data on rock thermal properties, the Cρ of the rockmatrix is generally assumed to be 2.23 MJ/(m3 · K) (Beck1988). Hartmann et al. (2003) measured heat capacity anddensity on 30 samples of Jurassic and older sandstones, aswell as shaly sandstones, and determined the rock matrix Cρto be (2.09 ± 0.07) MJ/(m3 · K). From our measurements(Popov et al. 2002), we found that, in general, sedimentaryrock matrix Cρ can vary substantially within the range of 1.7–2.2 MJ/(m3 · K) and depends on the sedimentary rock type(for an example, see Fig. 5).
Experimental data on thermal diffusivity a|| (tensorcomponent parallel to bedding plane) are presented in Fig. 6in correlation with corresponding λ values for dry and water-saturated cores. The data show significant variations in (a) forlimestone ([0.57–1.57] × 10−6 m2/s) along the section. Afterwater-saturation, the values of λ, Cρ, and C regularly increase
Fig. 2. Distribution of mean rock thermal conductivity λpar, measuredparallel to layering, and solidity (1 − Φ) along the depth section.
Fig. 3. Correlation between rock thermal conductivity λpar andporosity Φ.

Physical properties of rocks from the upper part of Yaxcopoil-1 803
by 40–55%. However, the thermal diffusivity of studiedsamples demonstrates a different behavior. On average, adecreases by 6% for water-saturated samples. Some samplesexhibit an increase of up to 16%. At the same time, no changein a is observed for many samples after water-saturation.
From our present and previous measurements performedon many sedimentary rock collections, it can be concludedthat there are typical situations with a variations after water-saturation: 1) for some sedimentary rock samples, a valuesincrease after rock water-saturation; 2) in other cases a candecrease; and 3) in still other situations, a values are stable(within measurement accuracy).
According to theoretical modelling of rock thermalproperties (see below), in our situation with the Yax-1 well,saturation of rocks with water can both decrease and increaseor even leave thermal diffusivity unchanged, depending on
the pore’s aspect ratio defined for ellipsoids of revolution asthe ratio of ellipsoid semi-axis along the axis of symmetry tothe axis in the symmetry plane of the ellipsoid. If the aspectratio is small (around 0.05), one can expect that the a valuesof saturated samples will be greater than the values of drysamples. For an aspect ratio around 0.1, the a values ofsaturated samples can be both greater and smaller than the avalues of dry samples, or these values can even coincidewithin a porosity range. If the pores are close to spheres orhave the shape of needles (aspect ratio >1), the a values of drysamples are greater than those of saturated samples.
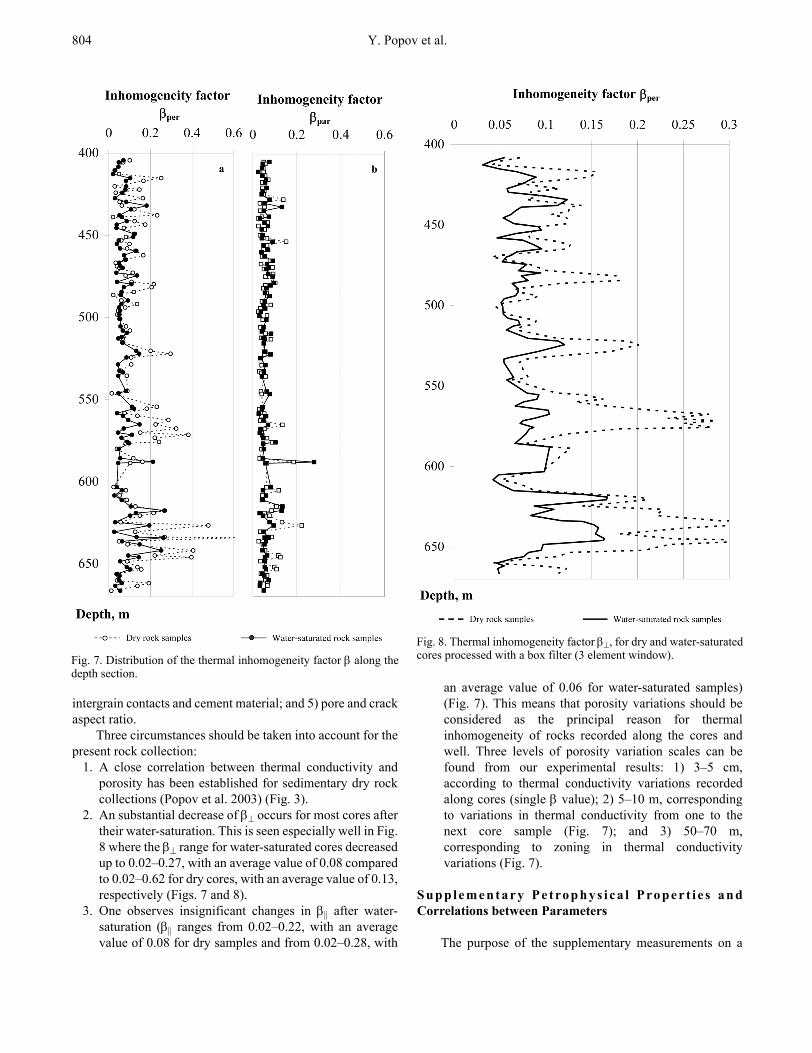
The inhomogeneity factor β was determined for everyscanning line on every core for the scanning direction alongthe bedding β|| as well as for the scanning direction across thebedding β⊥. Distributions of β|| and β⊥ along the section fordry and water-saturated cores are shown in Fig. 7. Oneobserves much larger values of β⊥ (range of 0.02–0.62 withan average value of 0.13) than β|| (0.02–0.22 and 0.06,respectively).
Spatial variations in thermal conductivity along everycore could, in principle, be caused by variations in: 1)mineralogical composition; 2) porosity; 3) crack density; 4)
Fig. 4. Distribution of (a) the thermal anisotropy coefficient K = λ||/λ⊥ and (b) the volumetric heat capacity (Cρ) along the depth section.
Fig. 5. Correlation between the volumetric heat capacity (Cρ) and theporosity (Φ).
Fig. 6. Correlation between rock thermal diffusivity a|| and thermalconductivity λ|| for components parallel to layering.
804 Y. Popov et al.
intergrain contacts and cement material; and 5) pore and crackaspect ratio.
Three circumstances should be taken into account for thepresent rock collection:
1. A close correlation between thermal conductivity andporosity has been established for sedimentary dry rockcollections (Popov et al. 2003) (Fig. 3).
2. An substantial decrease of β⊥ occurs for most cores aftertheir water-saturation. This is seen especially well in Fig.8 where the β⊥ range for water-saturated cores decreasedup to 0.02–0.27, with an average value of 0.08 comparedto 0.02–0.62 for dry cores, with an average value of 0.13,respectively (Figs. 7 and 8).
3. One observes insignificant changes in β|| after water-saturation (β|| ranges from 0.02–0.22, with an averagevalue of 0.08 for dry samples and from 0.02–0.28, with
an average value of 0.06 for water-saturated samples)(Fig. 7). This means that porosity variations should beconsidered as the principal reason for thermalinhomogeneity of rocks recorded along the cores andwell. Three levels of porosity variation scales can befound from our experimental results: 1) 3–5 cm,according to thermal conductivity variations recordedalong cores (single β value); 2) 5–10 m, correspondingto variations in thermal conductivity from one to thenext core sample (Fig. 7); and 3) 50–70 m,corresponding to zoning in thermal conductivityvariations (Fig. 7).
S u p p l e m e n t a r y P e t ro p h y s i c a l P ro p e r t i e s a n dCorrelations between Parameters
The purpose of the supplementary measurements on a
Fig. 7. Distribution of the thermal inhomogeneity factor β along thedepth section.
Fig. 8. Thermal inhomogeneity factor β⊥, for dry and water-saturatedcores processed with a box filter (3 element window).

Physical properties of rocks from the upper part of Yaxcopoil-1 805
selected number of representative rock samples is to derivepossible correlations with the densely measured parameters ofthermal conductivity, porosity, and density. Thesecorrelations, either empirical or based on theoretical models(see below), will be used to establish estimated depth logs foracoustic velocities and hydraulic permeability.
Figure 9 shows a clear negative correlation between theformation resistivity factor F and porosity Φ, in accordancewith the literature (“Archie’s first law”). The resultingexponent (m = −2.47 ± 0.25) is an indicator of poremorphology (e.g., tortuosity) for a specific rock type and istypical for carbonates with vugular porosity (Schoen 1996).The correlation is restricted to the porosity range from 0.08 to0.33, omitting sample 1368 (617.53 m), which has the lowestporosity and the lowest permeability (see also Fig. 10).
The total internal surface (Sabs) of a sample, as measuredwith the BET-method (Schopper 1982), is normalized to thepore volume: Spor = ρdrySabs/(mΦ), where ρdry is the density ofthe dry sample, m is the mass of the sample, and Φ is theporosity. Using nitrogen, the resolved minimum fine structureis approximately 10−10 m.
The correlation of Spor Φ = Stot (specific internal surfacenormalized to the sample volume), with porosity Φ in therange of 0.08–0.36, shows (Fig. 10) that, for most samples,Stot is approximately independent of porosity. Two samples(1377 [636.24 m] and 1391 [666.33 m]) do not fit into thiscorrelation because of a distinctly smaller internal surfacewith regard to their porosity, suggesting a different type ofinternal structure (e.g., grain size distribution, morphology ofgrain surfaces).
From measured values of the formation factor F andspecific internal surface Spor, the hydraulic permeability k wasestimated using the fractal PaRiS-model (Pape et al. 1982):log(k) = −log(F) − 3.1085 log(Spor) + 2.6770; (k[Darcy]).
The PaRiS-model is a further development of thestandard Kozeny-Carman equation and takes the increase ofinternal surface by fine structures, as found in solid rocks, intoaccount. These fine structures are modelled with generationsof self-similar (fractal) geometrical structures, with thesmallest structures being in the range of nitrogen atoms, as thegas used in the BET-method for the Spor measurements. Thus,the model takes the limited experimental resolution of themeasurements into account.
The correlation of these estimated k values with thermalconductivity λsat yields a satisfactory empirical relationshipbetween both parameters (Fig. 11). This correlation is used toderive a permeability log from densely measured thermalconductivities (Fig. 13).
The correlation between the measured acousticvelocities vp and vs and thermal conductivity λ is shown inFig. 12. Since no clear systematic difference for velocitiesmeasured in parallel and perpendicular directions was found,all acoustic data are used for the correlation. The resultinglinear relation between velocities and thermal conductivity isin accordance with similar empirical relations for different
rocks (Schoen 1996; Zamora et al. 1993). In the presentcase, this is mainly due to a similar dependence of bothparameters on porosity, which is the dominant influencingfactor. However, the scattering of individual values makes itclear that there are also other influences, which are different
Fig. 9. Formation resistivity factor (F) in dependence with porosity(Φ). The fit log[F(logΦ)] between both parameters is restricted to theporosity range from 0.08 to 0.37. (See Figs. 13a and 13e.)
Fig. 10. Internal surface with respect to the total volume Stot = Spor Φin dependence with porosity Φ. The indicated correlation has thesame area of validity as log[F(logΦ)] in Fig. 9. Two samples (1377[636.42 m] and 1391 [666.33 m]) with distinctly smaller internalsurface with regard to their porosity are omitted from the correlation.

806 Y. Popov et al.
for the two properties. In addition, for these inhomogeneoussamples, the different experimental methods may contributeto this scattering: measured velocities are bulk values (pulsetransmission method), while thermal conductivities containinformation from a surface layer only (1–2 cm). Again,these correlations are used to establish estimated velocitylogs from the densely measured thermal conductivities(Fig. 13).
A compilation of results for measured and estimatedparameter logs is shown in Fig. 13. The matrix density log(Fig. 13b), with values generally below 2.7 g/cm3, which isthe density expected from the mineralogical composition ofthe limestones (95% calcite), indicates the presence of closedporosity, which is typical of carbonate rocks.
The velocity logs (Figs. 13c and 13d) are calculated fromthe correlation with thermal conductivity (Fig. 12). The solidsymbols denote single measured values of supplementaryexperiments, and the lines stand for the interpolated orestimated results from dense measurement profiles of thermalconductivity. With one exception (sample 1305 [479.77 m]),there is a rather satisfactory correspondence of singlemeasured values with the estimated logs, taking thediscussion of Fig. 12 into account. This correspondence againreflects the dominant influence of porosity on both velocityand thermal conductivity for the rocks studied. Due to thelarge variations of porosity, acoustic velocities range from2.7–5.3 km/s for vp and from 1.3–3.2 km/s for vs, with only
small variations in mineralogical composition (e.g., Assefa etal. 2003).
In Fig. 13e, five different determinations of hydraulicpermeability (k) are shown:
1. The black squares denote five direct measurements of kwith the gas-permeameter. The permeability of sample1368 of approximately 10−5 mD was at the resolutionlimit of the instrument.
2. The black triangles are k-estimations for six samples byNMR-measurements of relaxation time T2: k (mD) = 0.1Φ4 (T2)2 (ms) (Kenyon 1997).
3. The gray triangles are estimations, calculated forindividual values from formation factor (F) and specificinternal surface (Spor), using the PaRiS-model.
4. The solid line is an estimated k-log with k = k [F(Φ), Spor(Φ)], using the correlations of Figs. 9 and 10 and thePaRiS-model.
5. The dashed line is an estimated k-log, using thecorrelation with thermal conductivity (Fig. 11).The directly measured permeabilities for samples 1343
(562.43 m) and 1386 (656.08 m) are distinctly lower than theestimated ones. These two samples are clearly layered. Since
Fig. 11. Estimated permeability k (PaRiS-model) by means ofmeasured (resp. for two values estimated from porosity; Fig. 10)specific internal surface Spor and formation factor F in dependencewith thermal conductivity λsat mean (arithmetic mean of λsat paralleland perpendicular to layering), measured under fully water-saturatedconditions. Again, the fit is valid in the porosity range of0.08 <Φ <0.37.
Fig. 12. Ultrasonic P and S wave velocities vp sat and vs sat independence with thermal conductivity λsat. For the fit, the propertiesmeasured parallel and perpendicular to layering are combined.Validity of the fit: 0.01 <Φ <0.37.

Physical properties of rocks from the upper part of Yaxcopoil-1 807
the gas-permeability could only be measured perpendicularto the layering and the estimated permeabilities are bulkvalues, the measured values are underestimated due toanisotropy.
In general, there is a satisfactory correspondence betweenthe different estimations, taking the complicated nature ofpermeability into account. This is particularly true for theestimated values from NMR measurements and from thePaRiS-model, i.e., from two completely independent methods.Therefore, we conclude that the resulting permeability logsgive at least a rough estimate of the order of magnitude for theintrinsic bulk permeabilities of the section. Again, acomparison with Fig. 13a shows a strong correlation betweenpermeability and porosity. Nevertheless, despite very highporosities (up to 0.35) the permeabilities are, in general, below10 mD, i.e., the tertiary limestones are characterized by largepores with only small interconnections. These small bulkpermeabilities indicate that the effective hydraulic properties
of this formation should be dominated by macroscopic karsticeffects (see Wilhelm et al. 2004).
No clear correlation with the other logs can be seen in thegamma-log measured by the ICDP-logging team (Fig. 13f),except in the depth range of 400 m–530 m, as there are largevariations in all logs.
In general, all petrophysical logs indicate that it is theporosity that dominates the physical properties rather thanchanges in mineral composition.
The log compilation confirms the approximatesubdivision of the depth section with regard to physicalproperties, as seen in the thermal conductivity and porosity.From the velocity logs (Figs. 13c and 13d), an additionalboundary could be identified somewhere around 600 m,marked by the transition of a relatively smooth linear increaseof velocities from 3–4 km/s for vp and 1.5–2 km/s for vsbetween 570–600 m to a range of large velocity variations of3–5.5 km/s for vp and 1.5–3.2 km/s for vs below 600 m.
Fig. 13. Depth logs of different parameters: a) porosity; b) density of saturated rocks (ρsat) and matrix density (ρmtx); c and d) ultrasonic P wave(c) and S wave (d) velocities (fully saturated conditions) measured parallel to layering (vp sat par and vs sat par) and estimated logs for the meanvalues vp(λsat mean) and vs(λsat mean) (see Fig. 12.); e) estimated permeability log from formation factor F(Φ) and Spor(Φ): k(F[Φ], S[Φ]), usingcorrelations in Figs. 9 and 10 and the PaRiS-model. The estimated permeability log is from correlation with thermal conductivity: k(λsat mean)(see Fig. 11). The estimated permeability values are from measured Spor and formation factor F (PaRiS-model), as well as from NMR-T2measurements (NMR). The gas-permeability measured perpendicular to layering (axial direction); f) gamma log measured by the ICDP-logging team; g) sample number and depth for supplementary petrophysical measurements.

808 Y. Popov et al.
DETERMINATION OF INTERNAL STRUCTURE OF ROCKS FROM THERMAL CONDUCTIVITIES
Theoretical Background
The experimental measurements on core samples providethermal conductivity λ for the sample as a whole, being amacroscopic characteristic. However, each sample ismicroscopically inhomogeneous and consists of componentshaving different thermal properties (mineral grains, pores,and cracks filled with different fluids). According to thedefinition of effective thermal conductivity, this is a tensorconnecting the heat flow density and temperature gradientaveraged over the sample volume. To date, many theoreticalmethods exist for calculating the effective thermalconductivity from the rock composition. If a rock containscomponents having contrasting physical properties (the caseof sedimentary rocks), the methods that take the parameters ofrock’s internal structure into account, should be used. Themost suitable theory for calculating the effective thermalconductivity of porous, cracked and, in general, anisotropicrocks is presented in Popov et al. (2003). The resultingformula includes thermal conductivity of components (thethermal conductivity of matrix and fluid filling the pores andcracks), their volume concentrations, and distributionfunctions of the orientation of pores and cracks in space andof the pore/crack shape. In limestones, the matrix includesmineral grains, residuals of organic material, and isolatedpores/cracks. The shape of pores and cracks is assumed to beellipsoids of revolution. In theoretical modeling, the pore/crack shape is commonly characterized by the depolarizationfactor. However, in practice, it is more convenient tocharacterize the pore/crack shape by aspect ratio: a ratio of theellipsoid semi-axis along the axis of symmetry to the axis inthe symmetry plane of the ellipsoid. The depolarization factorand pore/crack aspect ratio are related to each other by anexplicit formula (Popov and Mandel 1998).
Technique of Reconstruction of the Internal StructureParameters
We assume that cracks are ellipsoidal pores with a verylow aspect ratio (less than 0.01). We called the other voidspores. Variability in the depolarization factor characterizingthe pore/crack shape are described by the Beta distributionfunction having the parameters α and γ:
The mean value of F is found by:
and dispersion is:
This function is very flexible and, depending on the α and γ
chosen, can provide different shapes, including thoseresembling normal, logarithmically normal, and many otherdistribution functions. If α = 100 and γ = 0.05, the Betafunction shape is similar to delta function and describes verythin cracks (oblate ellipsoids). If α = 4 and γ = 2, the Betafunction is related to pores. In this case, we have a mean valueof F equal to 2/3, which corresponds to an aspect ratio of 0.3.
When modeling pore/crack structure, we assume that theresulting distribution function of the depolarization factor is alinear combination of the two previously mentioneddistribution functions (for cracks and pores), Pres = c1Pcrack(Fcrack, α1, γ1) + (1 − c1)Ppores(Fpores, α2, γ2), i.e., we assumethat the resulting distribution function can be bimodal, havingmaxima in the domains of cracks and pores.
Thus, we have five unknowns in the resulting distributionfunction. These parameters are as follows: α1, γ1, α2, γ2, and c1.The other (sixth) unknown parameter in our modeling is thethermal conductivity of matrix λ(matrix). Hereafter, we assumethat all pores and cracks are randomly oriented in space, whichresults in isotropic effective thermal conductivity.
The previously mentioned six unknowns are found fromthe minimization of the functional, which is a sum of squaredrelative residuals between experimental and theoreticalvalues of effective thermal conductivity when saturating withN different fluids having contrasting thermal conductivity.The values λ(matrix), α1, γ1, α2, γ2, and c1, providing theminimum of functional, are the solution to the problem.Since, as a rule, N = 3 or even N = 2 in experimental study ofsamples, i.e., we have three or two types of saturating fluids,but the number of unknowns is six, we should use all a prioriinformation to find the parameters that provide a minimum ina physically reliable domain. Thus, information on mineralcomposition is rather valuable because it allows one to set aproper initial value of matrix thermal conductivity. Todetermine the initial approach to the Beta functionparameters, it is useful to solve a similar inverse problem fordetermining a single aspect ratio of pores (i.e., for the casewhen the distribution function is a delta function), whichgives information on the dominant pore shape. If thin sectionsare available for a collection, they can provide preliminaryknowledge on the distribution function character.
Results of the Determination of the Internal Structure ofRocks
Since the majority of the studied rock samples exhibitsisotropic or only slightly anisotropic thermal properties, weapply the previously mentioned technique to find the internalstructure parameters.
Minimization of the functional for the rock samples withan initial approach and with bounds for sought-forparameters, chosen as varying in a physically reliable domain,gives the following averaged relative deviation betweenexperimental and theoretical thermal conductivity values,
P F( ) Γ α γ+( )Γ α( )Γ γ( )------------------------Fα 1– 1 F–( )γ 1– α 0 γ 0>,>( )=
m αα γ+------------= d αγ
α γ+( )2 α γ 1+ +( )-----------------------------------------------=

Physical properties of rocks from the upper part of Yaxcopoil-1 809
calculated with optimum parameters: 0.05% for dry samplesand −0.05% for water-saturated samples. The maximumdeviations are 2.2% and −2.3% for dry and saturated samples,respectively. Note that, for optimization, we use the thermalconductivity component λ|| (Popov et al. 2003).
The thermal conductivity values of matrix found from theinverse problem solution vary, in general, between 2.3 to2.8 W/(m · K), averaging 2.58 W/(m · K), which correspondswell to the extrapolation of experimental results to zeroporosity (Fig. 3). No specific depth intervals in the behaviorof the thermal conductivity of matrix are revealed. The factthat this value is smaller than that of calcite (3.2 W/[m · K])despite the fact that the samples consist of about 95% calcitecan be accounted for by the following factors. According toliterature data (Amyx et al. 1960), carbonate rocks cancontain closed porosity that decreases the thermalconductivity of matrix. Another factor is related to the qualityof contacts between mineral grains. The weaker the contacts,the smaller the matrix thermal conductivity.
The parameters of the Beta distribution functions,determined with the proposed technique, indicate that, ingeneral, the samples have stable pore/crack structure over thewhole depth range studied. Note that, for all samples, theparameter c1 is found to be 0, i.e., the distribution function hasa unimodal character. Figure 14 shows the distributionfunctions over the pore/crack aspect ratio that are typical ofthe three previously mentioned depth intervals. Thedistribution functions have a maximum aspect ratio of about0.1–0.2 with long tails in the domain of thinner cracks (up toan aspect ratio of 10−3–10−4). Pores having the shape ofprolate ellipsoids (aspect ratio >1) with aspect ratios varyingfrom 1 (spherical pores) to 3 can be also observed. At firstglance, the three distribution functions shown in Fig. 14 havesimilar shapes. However, one can observe that samples fromthe second zone (533.38–576.57 m) exhibit stable enhancedporosity and are characterized by thinner cracks compared tothe other zones. This fact can also contribute (together withenhanced porosity) to the decrease in the measured thermal
Fig. 14. Examples of distribution functions over pore/crack aspect ratios found for the three depth intervals (zones) revealed. Zone 1: 404–533 m; zone 2: 533–577 m; zone 3: 577–666 m.

810 Y. Popov et al.
conductivity values because, according to the theoreticalmodels, the thinner the cracks at a given porosity, the smallerthe calculated values of thermal conductivity. The third zone(576.570–666.23 m) is characterized by less-fractured rockscompared to the other zones.
Figure 15 shows images of thin sections of limestonesamples and the related distribution functions over the pore/crack aspect ratio determined with the proposed technique.The grey, fine-grained mass is calcite, and the black colorshows pores and fractures. Image (a) corresponds to the
Fig. 15. Thin section photos and related distribution functions found for characteristic rock samples.

Physical properties of rocks from the upper part of Yaxcopoil-1 811
typical case of distribution function shape (α is around 4, andγ is around 2). Images (b) and (c) are related to uncommoncases of distribution functions. One can conclude that theshape of the distribution functions found from the inverseproblem solution is in good correspondence with the structureseen in the images. Thus, open pores are well-seen in images(a) and (b). However, sample (b) seems to be more fractured.This fact is reflected by the enhanced value of the distributionfunction of sample (b) in the domain of thin cracks. Image (c)shows a sample with spherical pores. The related distributionfunction has a maximum around 1.5 and indicates that theaspect ratio cannot be smaller than 0.1, i.e., this sample is notfractured.
CONCLUSIONS
1. Sedimentary rocks from the upper part of the Yax-1 drillhole are characterized by significant short- and long-scale variations in thermal properties as well as inacoustic velocities and hydraulic permeability. Thesestrong variations in thermal properties have to be takeninto account in the interpretation of borehole-temperature logs, impeding the determination of heatflow density (see Wilhelm et al. 2004). On the otherhand, these results demonstrate the necessity for thedense sampling of thermal rock parameters for reliableheat flow determinations.
2. Short- and long-scale variations in thermal conductivityof rocks established along the section and along the coresamples are caused mainly by spatial variations in rockporosity. The same is true for acoustic velocities and forhydraulic permeability throughout the section.
3. For rocks with an essential thermal anisotropycoefficient (up to K = 1.22), the anisotropy effect shouldbe explained basically by oriented fracturing of rocksamples.
4. From supplementary petrophysical measurements onselected representative samples, estimated depth logs foracoustic velocities and for hydraulic permeability wereestablished by correlation with densely measuredthermal conductivity, density, and porosity. All logs canbe used as input parameters for the interpretation ofvarious geophysical data (e.g., geothermal, seismic, andgravity data). This is especially important in depthsections, where the petrophysical borehole logs are notavailable, as is the case in the depth range under study.
5. The studied thermal conductivity of rock matrix,determined as the inverse problem solution based onthermal conductivity measurements on dry and water-saturated samples, is found to vary from 2.3 to 2.8 W/(m· K), averaging 2.58 W/(m · K).
6. In general, the shape of the distribution function over thepore/space aspect ratio remains rather stable in the wholerange of the studied depth interval. The aspect ratio
maximum is observed around 0.1–0.2, with a long tailtoward thin cracks (aspect ratio up to 10−3–10−4). Crackshaving the shape of prolate ellipsoids are also observed,which have an aspect ratio no greater than 3. However,the three revealed depth zones exhibit specific features inthe distribution function behavior. Thus, the secondzone, having stable enhanced porosity, mainly containsthe rocks being most fractured compared to other zones.The least-fractured rocks are observed in the third zone.
7. The same experimental procedure and interpretationstrategy will be followed for the impact and pre-impactsection of the Yax-1 drill hole.
Acknowledgments–The research was funded by the DeutscheForschungsgemeinschaft (DFG grant BU 298/16) within theChicxulub ICDP-project. The authors also wish toacknowledge support from Schlumberger Oilfield Services(an international company in the oil and gas industry). Theauthors thank Dr. H. Urrutia and Dr. A. M. Soler from UNAM(Mexico) for their help in core collection, preparation, anddelivery, A. Pakhomov (from MSGPU) for his active help inthermal property measurements, U. Trautwein (GFZPotsdam) for permeability measurements, and J. Urrutia andJ. Šafanda for helpful comments.
Editorial Handling—Dr. Jaime Urrutia-Fucugauchi
REFERENCES
Amyx J. W., Bass D. M., and Whiting R. L., Jr. 1960. Petroleumreservoir engineering. Physical properties. New York: McGraw-Hill. 570 p.
Assefa S., McCann C., and Sothcott J. 2003. Velocities ofcompressional and shear waves in limestones. GeophysicalProspecting 51:1–13.
Beck A. E. 1988. Methods for determining thermal conductivity andthermal diffusivity. In Handbook on terrestrial heat flow densitydetermination, edited by Haenel R., Rybach L., and Stegena L.Dordrecht: Kluwer. pp. 87–124.
Burkhardt H., Erbas K., Giese P., Haack U., Honarmand H., HuengesE., Stiefel A., Wilhelm H., Zoth G., Buntebarth G., and Schulz R.1991. The measured and the predicted temperature profile in theKTB pilot-hole. Scientific Results/Proceedings of the OceanDrilling Program (Scientific Drilling) 2:224–257.
Clauser C., Giese P., Huenges E., Kohl T., Lehmann H., Rybach L.,Safanda J., Wilhelm H., Windloff K., and Zoth G. 1997. Thethermal regime of the crystalline continental crust: Implicationsfrom the KTB. Journal of Geophysical Research—Solid Earth102:18417–18441.
Dressler B. O., Sharpton V. L., Morgan J., Buffler R., Moran D., SmitJ., Stöffler D., and Urrutia J. 2003. Investigating a 65 Ma-oldsmoking gun: Deep drilling of the Chicxulub impact structure.Eos Transactions 84:125.
Hartmann A., Rath V., and Clauser C. 2003. Thermal conductivity fromcore and well log data (abstract #06667). Geophysical ResearchAbstracts. EGS-AGU-EUG Joint Assembly 5. CD-ROM.
Huenges E., Burkhardt H., and Erbas K. 1990. Thermal conductivityprofile of the KTB pilot corehole. Scientific Results/Proceedingsof the Ocean Drilling Program (Scientific Drilling) 2:224–230.

812 Y. Popov et al.
Kenyon W. E. 1997. Petrophysical principles of application of NMRlogging. Log Analyst 38:21–43.
Mayr S. 2002. Der Einfluss der Mikrostruktur auf dieUltraschalleigenschaften von Sandsteinen bei hydrostatischenDruckbedingungen (The influence of the microstructure on theultrasonic behavior of sandstones under hydrostatic pressure).Ph.D. thesis, Technical University of Berlin, Berlin, Germany.
Pape H., Rieper L., and Schopper J. R. 1982. A Pigeon-hole modelfor relating permeability to specific surface. Log Analyst 23:5–13.
Popov Y. 1997. Optical scanning technology for nondestructivecontactless measurements of thermal conductivity and diffusivityof solid matters. In Experimental heat transfer, fluid mechanicsand thermodynamics. Proceedings of the 4th World Conference.pp. 109–117.
Popov Y. 1984. Theoretical models of the method of determination ofthe thermal properties of rocks on the basis of movable sources.Geologiya i Razvedka 2:83–86. In Russian.
Popov Y. and Mandel A. M. 1998. Geothermal study of anisotropicrock masses. Izvestiya, Physics of the Solid Earth 34:903–915.
Popov Y., Pimenov V. P., Pevzner L. A., Romushkevich R. A., andPopov E. A. 1998. Geothermal characteristics of the Vorotilovodeep borehole drilled into the Puchezh-Katunk impact structure.Tectonophysics 291:205–223.
Popov Y., Pevzner S. L., Pimenov V. P., and Romushkevich R. A.1999a. New geothermal data from the Kola superdeep well SG-3. Tectonophysics 30:177–196.
Popov Y., Pribnow D., Sass J., Williams C., and Burkhardt H. 1999b.Characterisation of rock thermal conductivity by high-resolutionoptical scanning. Geothermics 28:253–276.
Popov Y., Pohl J., Romushkevich R., Tertychnyi V., and Soffel H.2000. Geotermicheskiye kharakteristiki impaktnoy strukturyRiis (Germaniya). In The Earth’s thermal field and relatedresearch methods, edited by Khutorskoy M. Moscow: RPFUPublications. pp. 99–106. In Russian.
Popov Y. and Romushkevich R. 2002. Thermal conductivity of rocksof oil-gas fields. Proceedings, International Conference “TheEarth’s Thermal Field and Related Research Methods. pp. 219–223.
Popov Y., Korobkov D., and Miklashevskiy D. 2002. Thermaldiffusivity measurements: New experimental data and theoreticalbackground and results. Proceedings, International Conference“The Earth’s Thermal Field and Related Research Methods. pp.214–218.
Popov Y., Tertychnyi V. V., Romushkevich R. A., Korobkov D. A.,and Pohl J. 2003. Interrelations between thermal conductivityand other physical properties of rocks: Experimental data. Pureand Applied Geophysics 160:1137–1161.
Schoen J. H. 1996. Physical properties of rocks: Fundamentals andprinciples of petrophysics, 1st ed. Oxford: Pergamon Press. 583 p.
Schopper J. R. 1982. Porosity and permeability. In Landolt-Boernstein, group V geophysics, volume 1, subvolume A, editedby Angenheister G. New York: Springer-Verlag. pp. 184–303.
Wilhelm H., Heidinger P., Šafanda J., »ermák V., Burkhardt H., andPopov Y. 2004. High resolution temperature measurements in theborehole Yaxcopoil-1, Mexico. Meteoritics & Planetary Science.This issue.
Wulff A. M. and Burkhardt H. 1996. The influence of local fluid flowand the microstructure on elastic and anelastic rock properties.Surveys in Geophysics 17:347–360.
Wulff A. M. and Burkhardt H. 1997. Mechanisms affectingultrasonic wave propagation in fluid-containing sandstonesunder high hydrostatic pressure. Journal of GeophysicalResearch—Solid Earth 102:3043–3050.
Zamora M., Thanh D. V., Bienfait G. P., and Poirier J. P. 1993. Anempirical relationship between thermal conductivity and elasticwave velocities in sandstone. Geophysical Research Letters 20:1679–1682.