Embed Size (px)
Citation preview

231
Physical
Education

232
1. INTERDEPENDENCE BETWEEN SELECTED FUNDAMENTAL MOTOR PATTERNS
OF 4-6 YEARS OLD HEALTHY CHILDREN................................................................... 233 2. PRESCHOOL TEACHERS VS. PHYSICAL EDUCATION TEACHERS: WHO IS MORE
EFFICIENT AT DEVELOPING MOTOR ABILITIES OF PRESCHOOL CHILDREN? . 239 3. THE EVALUATION OF MOTOR DEVELOPMENT IN ELEMENTARY SCHOOLS ... 245 4. THE GENDER DIFFERENCES IN ANTHROPOMETRIC CHARACTERISTICS, BODY
COMPOSITION AND MOTORICAL ABILITIES AT CHILDREN OF JUNIOR SCHOOL AGE ...................................................................................................................................... 250
5. DIFFERENCES IN PERCENTILE DISTRIBUTION OF BMI, HEIGHT AND WEIGHT BETWEEN IV AND V GRADE PUPILS............................................................................ 259
6. DIFFERENCES BETWEEN MOTOR ABILITIES OF GIRLS OF YOUNGER SCHOOL AGE AND DIFFERENT MORPHOLOGICAL STATUS .................................................. 267
7. CHARACTERISTICS OF MOTOR DEVELOPMENT IN FEMALE FIFTH GRADE STUDENTS PARTICIPATING IN ADDITIONAL PROGRAMS OF JUDO AND TRACK AND FIELD.......................................................................................................................... 275
8. DIFFERENCES IN MOTORIC ABILITIES BETWEEN FEMALE ADOLESCENTS, ATHLETES AND NON-ATHLETES IN THE MUNICIPALITY OF LEBANE............... 279
9. RELATIONS BETWEEN SPORTS MOTIVATION IN PHYSICAL EDUCATION CLASSES AND DROPPING OUT OF ORGANIZED KINESIOLOGICAL ENGAGEMENT IN ADOLESCENCE................................................................................ 285
10. Determining distinction in the ATTITUDES OF male and female students on individual segments in the teaching of physical education in primary schools in the Republic of Srpska............................................................................................................................................... 291
11. Differences in characteristics of kinanthropological status in students aged 10 to 12 years 297 12. THE INFLUENCE OF DIFFERENT TEACHING CONTENTS ON THE INTENSITY OF
THE INTRODUCTORY PART OF THE LESSON ............................................................ 303 13. APPLICATION OF “FUNCTIONAL” METHOD IN TRUNK MUSCLE STRENGTH
DEVELOPMENT IN PRIMARY SCHOOL SEVENTH FORM STUDENTS................... 309 14. HIGH SCHOOL STUDENTS' ATTITUDES AND INTERESTS TOWARD SPORTING
ACTIVITIES AND PHYSICAL EDUCATION SYLLABUS CONTENT......................... 315 15. EFFECTS OF THEMATIC UNIT FITNESS TRAINING AT HIGH SCHOOL ................ 321 16. REALIZATION OF PHYSICAL EDUCATION CURRICULUM IN HIGH SCHOOL .... 325 17. Psycho-physical factors which cause children’s exemption from the lessons of physical
education ............................................................................................................................... 331 18. RELATIONSHIP BETWEEN MOTOR ABILITIES AND MORPHOLOGICAL
CHARACTERISTIC AND EFFICIENCY IN TEACHING SAILING TECHNIQUE ....... 337 19. The Attitudes of Future and Currently Working PE Teachers towards Inclusive Physical
Education .............................................................................................................................. 343

233
INTERDEPENDENCE BETWEEN SELECTED FUNDAMENTAL
MOTOR PATTERNS OF 4-6 YEARS OLD HEALTHY
CHILDREN
Uroš Marušič and Rado Pišot
University of Primorska, Science and Research Centre, Institute for Kinesiology Research, Koper, Slovenia
Abstract
Fundamental motor patterns (FMP) like walking, running, climbing, crawling and jumping are the basis of human movement – playing the key role in human survival. Rapid changes of lifestyle bring a lack of movement in the individual lives, thus causing numerous, mostly health related problems. Appropriately learned phylogenetic FMP are the crucial factor for a harmonised and efficient motor development. Inappropriately learned FMP can negatively impact the upgrade of motor patterns to motor stereotypes which can result in incoherent body development, improper adaptations of the motor apparatus, reduction of motor competences and excessive body mass in early childhood. In order to determine the coherence of FMP and its role in different situations in lives of the individuals we need the knowledge about the development and characteristics of FMP through a longer child’s development phase. The authors in this paper present connections between FMP of 4-6 years old healthy children. There were found some statistically significant correlations longitudinally and some high and statistically significant correlations in each year of the study.
Keywords: Children, physical activity, fundamental motor patterns, correlations, longitudinal study
Introduction
The spiral model of motor passivity (Pišot, 2008) sets three main causes to the fore: lack of movement, excessive body mass and lack of motor skills. These mostly act simultaneously and lead to irrational motor activity, excessive energy consumption and rapid fatigue, leading to negative physical and poor motor self-image that influence bad quality of life and alienation from social activities. These are specific lifestyle indicators that apply for a large part of inactive children and youngsters. They follow a spiral model, not necessarily in this sequence, but persistently and efficiently, thus alienating an individual from activities necessary for a harmonised development already in childhood.
Some recent studies, performed in various parts of the world by Walkley et al. (1998), NSW Department of Health (2003) and Harrington (2005), have shown that the development of FMP in children is inconsistent or unsatisfactory. Appropriate development of FMP is necessary for healthy and safe lifelong physical and motor development as well as for motor efficiency (Hands, 2002, Šimunič, Volmut and Pišot, 2010). Without the appropriate motor competences of walking, running, jumping, climbing, crawling, balance, throwing and others, motor skills set by the environment will remain limited to pupils, students and adults.
The consequences of unsatisfactory development of FMP: the increase of injuries of children caused by falls from various heights (Ball, 2002); falls that are the fourth case for lethal injuries of children and the cause for 53% of hospitalisations of pre-school children due to injuries (Rok Simon, 2007); sedentary lifestyle which has in the past period led to an increase in the number of skeletal injuries, inflammatory and degenerative diseases of bones and joints, the spine (Bilban and Djomba, 2007); injuries that occur at climbing (approximately 2400 such injuries occur in the Netherlands per year) (Herrewegen and Molenbroek, 2005).

234
Gallahue and Ozmun (2005) emphasise that the assessment of FMP is necessary at least for the following three reasons: establishing the global impact of lifestyle changes, the possibility to increase motor competences and the ability to upgrade them – motor learning.
The authors in this paper present connections between FMP of 4-6 years old healthy children. The study includes longitudinal results for each separate year as well a comparison between performance groups of children (best, average and low performance).
Method
Sample
Sample (Table 1) consists of 107 (52 boys) four years old children. The present study was a part of a wide basic research project “Analysis of fundamental motor patterns - skeletal and muscular adaptation to specific sedentary lifestyle factors in children aged 4-7 years”, conducted by the Institute for Kinesiology Research, Science and Research Centre of University of Primorska. The sample of children was longitudinally monitored throughout three tests between the years of 2009 to 2012, beginning at the age of 4. Children’s parents gave their written consent prior the study initiation. All testing procedures conformed to the 1964 Declaration of Helsinki and were approved by the Slovenian National Medical Ethics Committee. The research was financially supported by the Slovenian Research Agency.
There were a number of different and demanding measurements done on the chosen subjects and they were additionally motivated with the story of astronauts travelling to space, filling the cardboard rocket with labels at every measurement station. But if they did not want to do this, we did not pressure the children to perform all of them. Therefore, 88 (40 boys) of them passed all tests.
Variables
All analyses were completed in the most common fundamental motor patterns (FMPs) – walking, running, crawling, climbing and jumping. Jumping performance was analyzed with counter movement jump with hands (Jump WH). FMPs were analyzed qualitatively and quantitatively with kinematics and biomechanics. Qualitative assessments of FMP covered four main evaluation criteria: Connectedness of movement, head posture (view direction), foot positioning (phase of support) and diagonal reciprocal movement pattern. In each condition there were 3 rating points (low, medium and high performance). Therefore each child got a minimum 4 and maximum 12 points. Correlations were done longitudinally and for each separate year. Furthermore, correlations were also done between three performance groups of children: low (4-6 points), medium (7-9 points) and best performance (10-12 points).
Data analysis
The statistical and heuristic data analysis was performed with SPSS, Weka and SAS Analytics software. Among others we used multi-regression analysis, discriminative analysis, multidimensional scaling, non-classification and classification decision trees and neural networks. Shapiro-Wilk test of normality was used to find out whether variables were distributed normally. In this paper only Spearman correlation analyses are presented with a p ≤ 0.05.

235
Results and discussion
Anthropometry
Girls and boys at the age of four had statistically significant differences in muscle (p <0.001) and fat mass (p = 0.002), while body weight, height and body mass index (BMI) did not differ significantly.
Table 1. Analysis of body weight, height and body composition of a selected sample of children in year 2009 (4 years old children).
Boys Girls All Sig.
N 52 55 107
Body weight (kg) 18.5 ± 2.5 18.5 ± 2.7 18.5 ± 2.6 n.s.
Body height (cm) 107.5 ± 4.7 108.1 ± 4.3 107.8 ± 4.5 n.s.
Body mass index (kg/m²) 16.0 ± 1.5 15.8 ± 1.5 15.9 ± 1.5 n.s.
Muscle mass (kg) 5.8 ± 0.8 5.1 ± 0.8 5.5 ± 0.9 <0.001
Fat mass (%) 15.0 ± 2.8 16.7 ± 2.7 15.9 ± 2.9 0.002
Fat free mass (%) 85.0 ± 2.8 83.3 ± 2.7 84.1 ± 2.9 0.002
Total body water (%) 64.5 ± 2.1 63.5 ± 2.3 64.0 ± 2.3 0.026
Overweight children (%) 17.3 18.2 17.7
Sig. - Statistical significance, n. s.– non significant.
All values are presented as arithmetic mean ± standard deviation. The limit of the percentage of children who are overweight is taken from Cole et al., 2000.
Correlations
Figure 1. Longitudinal correlations for 4-6 years old children between A: qualitative estimations of Climbing and Jump WH, B: qualitative estimations of Jump WH and Gait, C: Handgrip and qualitative
estimations of Jump WH.

236
Results of our longitudinal study show some statistically significant correlations between FMP. Handgrip was taken as indicator of generic strength of children’s body and then compared with the other FMP. A positive correlation was detected (r=0.50, p<0.001, N=279) between handgrip and Jump WH. Moreover, a statistically significant correlations between Jump WH and gait (r=0.48, p<0.001, N=248) and between climbing and Jump WH performance (r=0.29, p<0.001, N=277) were found.
Some correlations between FMP which were done longitudinally can be seenin the Table 2. Children were longitudinally divided in three performance groups. The "low performance group" of children which achieved the lowest range of points (4-6 points) is marked with 1 and the "high performance group" which achieved the highest range of points (10-12 points) is marked with number 3. Results of our longitudinal study show that after splitting children in three different performance groups we get some positive, statistically significant correlations. For instance in the high performance group of children who crawled best we found a positive correlation between Jump WH and gait performance (r=0.52, p<0.001, N=120). In Figure 2B is presented a correlation between Jump WH and gait performance for the high performance group of climbing children longitudinally (r=0.52, p<0.001, N=120). Finally, we found that Jump WH performance is the most correlated FMP.
Table 2. Correlations between FMP longitudinally divided in two groups (best and low performance)
FMP
3 = best performance, 1
= low performance
Correlations between:
r p N
Climbing 3 Jump WH Gait 0.415 0.06 43 1 Jump WH Gait 0.465 0.000 72 Crawling 3 Jump WH Gait 0.515 0.000 120 3 Jump WH Climbing 0.253 0.004 131 1 / / / / / Jump WH 3 Jump WH Climbing 0.159 0.028 193 3 Jump WH Gait 0.243 0.000 171 1 / / / / / Gait 3 / / / / / 1 Jump WH Climbing 0.668 0,049 9
In further analyses we looked into correlations between data obtained in each year of study also divided in three performance groups. In Figure 2A is presented a correlation between crawling and gait performance for 4 years old children in the best jumping performance group (r=0.49, p=0.023, N=21).
Figure 2. Correlations between A: crawling and gait in best jumping performance group of 4 years old children, B: Jump WH and gait in best climbing performance group longitudinally.
In Table 3 are presented all correlations between FMP that were found in each year of the study divided into three performance groups. For instance, there was a positive, statistically significant

237
correlation in best performance climbing group of children between climbing and gait performance (r=0.79, p=0.034, N=7).
Table 3. Correlations between FMP in each year of the study divided in two groups (best and low performance)
FMP and age of measured
children
3 = best performance,
1 = low performance
r p N
Climbing (4 year old)
3 Climbing Gait 0.791 0.034 7
Crawling (6year old)
3 Jump WH Gait 0.288 0.037 53
1 Climbing Gait 0.784 0.037 7 Jump WH (4 year old)
3 Crawling Gait 0.492 0.023 21
Conclusion
To the best of our knowledge this was the first longitudinal study of FMP with 4-6 years old children. In this paper authors presented correlations found between selected FMP. The most correlated FMP was found in jump performance which is also the most demanding FMP from the coordination point of view. FMP as walking, crawlingand climbing have an important common base in the diagonal reciprocal movement patternas well in the phases of support of the body during movement which defines the quality of performance. From the other side jumping with the use of hands is depending from high hand - leg (upper and lower extremities) coherency and as such more than others depending on the level of general development. Longitudinal changes can also be explained by cephalocaudal(using the upper limbs before their lower limbs)and proximodistal(development of motor skills from the center of the body outwards) trend of motor development which is in these yearsin an accelerated development. With the refinement of the walkingpattern, the development and control of a variety of locomotor(running, jumping, climbing, etc.) andmanipulative (gross as in throwing and striking, fine as inpincer grasping) abilities improve. Basic movement patternsdevelop during these ages and arethe foundation upon which other movements and combinationsof movements are developed and refined (Malinaet al., 2004). Movement patterns are refined throughappropriate modeling, instruction, and practice; performancequality improves; and the basic patterns are integratedinto more complex movement sequences and skillsrequired for specific demands.
Research, where the occurrence and characteristics of fundamental motor patterns were studied, has shown that children with more coordinated movement (high coherence) are faster and more efficient (Pišot et al, 2012). The connection between monitored motor patterns (walking, jumping, climbing, and crawling) is greater in those children whose fundamental motor patterns are more coordinated (Marušič & Pišot, 2012). Children with more knowledge and motor information (better motor memory) and more experience are more and have greater interest in being involved in physical/sports activities in adolescence (Malina, 2008).
We can conclude that the intertwining relationship between FMP is at such a high level that we need to be aware of the importance of an integrated impact of all FMP on child early motor development.Everyday elementary movement which can be offered to the child in natural environment must represent the foundation of his motor development. Not only the quantity but also emphasis on the proper implementation of the FMP is needed.
Acknowledgments
We are grateful to the parents and their children as well as kindergartens and schools for their collaboration in this study. We also thank all researchers from Institute for Kinesiology Research, Science and Research Centre of University of Primorska, Slovenia, who helped us investigate our hypothesis.

238
References
1. Ball, D.J. (2002). Playgrounds – risk, benefits and choises (Research report). London: Middlesex University, School of Health in Social Sciences.
2. Bilban, M., & Djomba, J.K. (2007). Zdravstveni absentizem in bolezni gibal. Delo in varnost, 52(5), 10-19.
3. Chester, V.L., & Wrigley, A.T. (2008). The identification of age-related differences in kinetic gait parameters using principal component analysis.23(2):212-220.
4. Chester, V.L. (2006). A comparison of kinetic gait parameters for 3-13 year olds. ClinBiomech, 21(7):726-732.
5. Gallahue, D.L., & Ozmun, J.C. (1998). Understanding motor development: Infants, children, adolescents, adults. Boston: McGraw-Hill.
6. Hands, B. (2008). Changes in motor skill and fitness measure among children with high and low motor competence: A five-year longitudinal study. Journal of Science and Medicine in Sport, 11, 155-162.
7. Harrington, G. i dr. (2005). Fundamental motor skills (Research report). Tasmania: Deputy Secretary (Education), Department of Education, Community and Cultural Development.
8. Herrewegen, J. in Molenbroek, J. (2005). Children`s climbing skills (Research report). Amsterdam: Jep Design.
9. Malina R.M. (2004). Secular trends in growth, maturation and physical performance: A review. Antropol. Review, 67, 3-31.
10. Malina, R.M. & Little, B.B. (2008). Physical Activity: The Present in the Context of the Past. American Journal of Human Biology, 20, 373–391.
11. Marušič, U. & Pišot, R. (2012). Analysis of success in mastering the elementary motor pattern of gait of 4-6 years old healthy children.In R. Pišot et al. (Eds.). Child in Motion for healthy ageing: contibutions. Koper: University of Primorska, Science and research centre, University press Annales.
12. NSW Department of Health. (2003). ‘Move It, Groove It - Physical Activity in Primary Schools. (Research report).
13. Pišot, R., Plevnik, M., Mohorko, N., Pišot, S. Marušič, U., & Šimunič, B. (2012). Fundamental motor patterns in the context of motor competences acquisition: competence oriented motor development. Odgojni I zdravstveni aspekti sporta i rekreacije. Zagreb: Kineziološki fakultet.
14. Rok Simon, M. (2007). Poškodbeotrok in mladostnikov v Sloveniji: analiza podatkov o umrljivosti in obolevnosti (Research report). Ljubljana: Inštitut za varovanje zdravja RS.
15. Toro, B., in sod. (2003). A review of observational gait assessment in clinical practice. Physiotherapy Theory and Practice. 19, 137-149.
16. Walkley, J., Armstrong, D., & Clohesy, P. (1998). Fundamental Motor Skills: An Activities Resource for Classroom Teachers. Melbourne: Department of Education.

239
PRESCHOOL TEACHERS VS. PHYSICAL EDUCATION
TEACHERS: WHO IS MORE EFFICIENT AT DEVELOPING
MOTOR ABILITIES OF PRESCHOOL CHILDREN?
Dušan Stupar1 and Boris Popović2
1 Faculty of Sport and Tourism, Novi Sad, Serbia 2 Faculty of Sport and Physical Education, University of Novi Sad, Serbia
Abstract
In order to come up with an answer to this question, we compared the classic model of practice represented in state kindergartens, whose executors were teachers employed in these institutions (The Preschool Program for Physical Education - Happy Childhood), with the other two models (The Children's School of Sport and Sport School) whose executors were professors of physical education and sport. With this purpose, the 7 motor tests were applied on a sample of 278 children classified into three groups (E1-97, E2 -95 and C-86).
The difference between the groups in the initial and final measurements for each group applied a multivariate analysis of variance (MANOVA) and univariate analysis of variance (ANOVA) to assess the differences of individual motor variables. To determine the effects of treatment on the transformation of motor abilities between groups of respondents in each age applied to multivariate analysis of covariance (MANCOVA) and univariate analysis of covariance (ANCOVA) to assess the differences of individual motor variables.
Based on these results it can be concluded that children who were involved in „Sports school” and The Children's School of Sport has made the best progres compared with children from „Happy Childhood”.
Keywords: motor abilities, preschool age, models of exercise.
Introduction
Preschool children in general, are an extremely sensitive period for motor development of children, especially when it comes to learning and adopting an extensive repertoire of motor skills. It is very important not to miss this period, and the advantages it has in the formation of the motor base. For the development of the child at this age is very important selection of appropriate motion activities. All the proceedings of the man, his mental and emotional behavior, are based on motor behavior, because it all starts movement. Motor behavior to address issues when navigating and performing various movements. It includes not only physical, but also intellectual and emotional involvement, which is most pronounced in the youngest group of children, since he proved that she is involved in motor behavior whole being (Ismail and Gruber, 1971). Preschool age is the most important period in the formation of the whole personality of man, because only later comes to learning a variety of modifications and adjustments to various situations in life (Bala, 2002). Motor functioning of young children is the general type (Ismail and Gruber, 1971; Bala, 1981, Bala and Popovic, 2007; Bala et al., 2009), which means that in this age no differentiated motor skills (children respond with his whole body and the whole motor rhythm). Moreover, a defining feature of preschool age is emphasized and conspicuous integrity of development, where the domains of child development (physical, motor, cognitive, emotional, etc.) are closely related.
The main idea of this work was to compare different models and training to determine which program is more contributed to the development of motor skills in preschool children, and whether progress is being made in respect of the children who had a classic motor activity in preschools. In the

240
first two cases, the perpetrators were professors of sport and physical education, while in the third they were teachers. They are both, in their own way qualified to work with children preschool ages.
Method
The subject sample consisted of 95 children aged 5-7 years participating in the program „Sports school“ in Novi Sad (experimental group E1), and 95 children from “Children's School of Sport” (experimental group E2) and 97 children the same age who attended regular physical activity program in the preschool “Peter Pan” (control group), also in Novi Sad.
The battery of motor tests based on the experience with adult subjects, modified for young children (Bala, Popovic, Stupar, 2002; Kulic, 2005), based on the model of motor abilities of older children and adolescents (Kurelić, Momirović, Stojanovic, Sturm, Radojevic and Viskić-Štalec (1975), and Gredelj Metikoš, constructed by Momirović (1975). The following motor ability tests were utilized:
1. 20m dash – to estimate running speed,
2. Obstacle course backwards – to estimate coordination,
3. Arm plate tapping – to estimate frequency of simple movements,
4. Seated straddle stretch – to estimate flexibility,
5. Standing broad jump –to estimate explosive strength
6. Bent-arm hang – to estimate static strength of arms,
7. Sit-ups – to estimate repetitive strength of trunk
The main objective of working with children in the "Sports School" was to develop their motor skills, and more broadly their motor behavior, as well as the posture of the body, by various means, physical exercise, but without the competing claims. During the work with the children to perform testing their motor skills, measuring anthropometric characteristics and control of posture, followed their healthcare and status, and psychological development of children (Bala, 2002). Trainings lasted one hour, twice a week, from September the 1st, 2009 to June the 1st 2010 and included all sports activities.
Exercise program in the “Children's School of Sport” (Janković, 2005) lasted nine months from September the 1st, 2009 to June the 15th 2010. Training facilities, which lasted for 30 minutes three times a week, based on exercises from gymnastics, elementary games, free exercise, and the most basic techniques of sports with a ball (football, basketball, volleyball and handball), martial arts activities (judo, wrestling, karate), athletic activities, rhythmic gymnastics and dance. The measurements were carried out in late September (initial measurement) and the end of April (final measurement).
The Preschool Program for Physical Education (Kamenov, 1995) is included in the Regulations on the principles of preschool program, with defined objectives and content of activities for physical development, mastering the skills of movement and strengthening the health of children.
Only those children who are trained for all nine consecutive months and who have met the health requirements are taken into account.
For each motor variable in each group was calculated as the main central and depression statistics: arithmetic mean (M) and standard deviation (SD). Then we applied multivariate analysis of variance (MANOVA) and univariate analysis of variance (ANOVA) at the initial and final measurements for each group. The significance of changes in the final results since the initial measure was based on the results of multivariate analysis of covariance (MANCOVA).
The entire survey was conducted within the research project “Integrated development and aberrant behavior of preschool children”, which is funded by the Ministry of Science and Technological Development of Serbia, was implemented at the Faculty of Sport and Physical Education.

241
Results
Tables 1, 2 and 3 shows the basic statistics of motor variables, and significant differences of means in relation to variability of all motor variables, as well as the individual ones (MANOVA and ANOVA).
Table 1. Basic statistical statistics of motor variables for E1 and C group
INITIAL FINAL VARIABLE
M SD f p M SD f p
E1 5,23 0,70 4,95 0,56 20m dash (s)
C 5,88
0,77 36,83 0,00
5,65 0,76 54,52 0,00
E1 23,62
9,43 19,80 7,68 Obstacle course backwards (s)
C 31,24
10,90 26,80 0,00
27,69 8,62 44,75 0,00
E1 17,02
4,07 18,92 3,15 Arm plate tapping (freq.)
C 13,24
2,47 60,91 0,00
14,69 3,41 79,41 0,00
E1 36,48 7,02 39,75 7,79 Seated straddle stretch (cm)
C 34,23 7,81 9,22 0,00
36,32 8,70 6,38 0,01
E1 121,94 21,28 133,09 19,39 Standing broad jump (cm)
C 96,80 20,83 68,37 0,00
106,19 20,54 87,10 0,00
E1 13,99 13,93 11,11 10,04 Bent-arm hang (s) C 9,39 9,53
7,20 0,01 9,01 6,26
3,04 0,08
E1 24,35 8,06 24,59 6,81 Sit-ups (freq.) C 14,88 9,56
54,97 0,00 14,85 9,20
37,04 0,00
F=14, 07 P=0,00 F=19,32 P=0,00
E- experimental group, C- control group, M - mean, S - standard deviation, F - F-test, P - level of statistical inference of the whole system of motor variables, f - f-test, p - level of statistical differences of
an individual system of motor variables
As we can see, in all of three tables in almost all variables there is a statistically significant difference in the initial and the final measure. To determine the effect of treatment on the transformation of motor abilities between groups of respondents in each age group has applied the multivariate analysis of covariance (MANCOVA), which statistically equates the results of both groups at the initial measurement. This method provides a clear picture of the effects of treatment, given that erases differences with the first measurement by incorporating them into the analysis as covariates. For the assessment of individual differences in motor variables used univariate analysis of covariance (ANCOVA).

242
Table 2. Basic statistical statistics of motor variables for E2 and C group
INITIAL FINAL VARIABLE
M SD f p M SD f p
E2 5,60 0,69 5,25 0,60 20m dash (s)
C 5,88 0,77 6,46 0,01
5,65 0,76 16,09 0,00
E2 25,23 9,28 20,34 6,89 Obstacle course backwards (s)
C 31,24 10,90 15,42 0,00
27,69 8,62 39,90 0,00
E2 16,10 3,06 17,64 2,50 Arm plate tapping (freq.)
C 13,24 2,47 49,11 0,10
14,69 3,41 43,47 0,00
E2 36,05 6,95 38,94 6,75 Seated straddle stretch (cm)
C 34,23 7,81 2,74 0,00
36,32 0,87 5,29 0,01
E2 110,81 17,52 122,76 17,52 Standing broad jump (cm)
C 96,80 20,83 23,89 0,00
96,80 20,83 34,02 0,00
E2 13,05 10,89 12,00 9,33 Bent-arm hang (s)
C 9,39 9,53 5,88 0,02
9,01 6,26 6,61 0,01
E2 22,62 8,93 22,00 8,13 Sit-ups (freq.)
C 14,88 9,56 31,77 0,00
14,85 9,20 30,71 0,00
F=10,13 P=0,00 F=10,69 P=0,00
Table 3. Basic statistical statistics of motor variables for E21 and E2 group
INITIAL FINAL
VARIABLE M SD f p M SD f p
E1 5,23 0,70 4,95 0,56
20m dash (s) E2 5,60 0,69
13,54 0,00 5,25 0,60
12,90 0,00
E1 23,62 9,43 19,80 7,68 Obstacle course backwards (s)
E2 25,23 9,28 1,50 0,22
20,34 6,89 0,25 0,62
E1 17,02 4,07 18,92 3,15 Arm plate tapping (freq.) E2 16,10 3,06
2,89 0,09 17,64 2,50
8,99 0,00
E1 36,48 7,03 39,75 7,79 Seated straddle stretch (cm) E2 36,05 6,95
0,11 0,87 38,94 6,75
0,63 0,22
E1 121,94 21,28 133,09 19,39
Standing broad jump (cm) E2 110,81 17,52
14,55 0,00 122,76 17,52
14,06 0,00
E1 13,99 13,93 11,11 10,04
Bent-arm hang (s) E2 13,05 10,89 0,26 0,61
12,00 9,33 0,38 0,54
E1 24,35 8,06 24,59 6,81 Sit-ups (freq.)
E2 22,62 8,93 1,89 0,17
22,00 8,13 5,42 0,02
F=3,19 P=0,00 F=4,88 P=0,00

243
Table 4. Post hok LSD - test with corrected arithmetic means between experimental (E1), (E2) and control (C) groups at the final measurement
VARIABLE Group ADM SE p
E1-C -1,24 0,61 0,04
E2-C -0,45 0,58 0,10 20m dash (s) E1- E2 -0,31 0,56 0,58
E1-C -19,71 9,29 0,04
E2-C -35,02 8,84 0,00 Obstacle course backwards (s)
E1- E2 15,31 8,39 0,07
E1-C 1,85 0,43 0,00
E2-C 1,40 0,41 0,00 Arm plate tapping (freq.)
E1- E2 0,45 0,39 0,24
E1-C 2,03 0,74 0,01
E2-C 1,53 0,71 0,05 Seated straddle stretch (cm)
E1- E2 0,52 0,67 0,23
E1-C 6,81 2,04 0,00
E2-C 4,99 1,94 0,01 Standing broad jump (cm) E1- E2 1,82 1,84 0,32
E1-C 1,08 12,35 0,35
E2-C 14,91 11,76 0,21 Bent-arm hang (s)
E1- E2 1,82 1,84 0,32
E1-C 2,56 1,00 0,01
E2-C 1,79 0,96 0,06 Sit-ups (freq.)
E1- E2 0,77 0,91 0,40
F=5,12 P=0,00
ADM – adjusted difference of arithmetic means, SE- standard error of the corrected arithmetic means, p-level of statistical significance
Based on the results multivariate analysis of covariance (MANCOVA), it can be concluded that there is a statistically significant difference between groups. If we observe the experimental (E1) group can be seen that compared to the control (C) group had a statistically better results in the next six motor variables: 20m dash, Obstacle course backwards, Arm plate tapping, Standing broad jump, Seated straddle stretch and Sit-ups. In the variables Bent-arm hang, the experimental group had better results but not statistically significant. Experimental (E2) is a group relative to control group was statistically better results in the following variables: Obstacle course backwards, Arm plate tapping, Seated straddle stretch, Standing broad jump. In the variables 20m dash, Bent-arm hang and Sit-ups, experimental (E2) group had better results, but not statistically significant. The control (C) group was significantly lower than the experimental results (E1) group in almost all variables. Also lower, but not statistically significant variables had in variable Bent-arm hang. Compared to the experimental (E2) group, control (C) group had significantly better results in the variable Seated straddle stretch. In variables 20m dash Bent-arm hang and Sit-ups, the control (C) group had significantly worse results. The other variables of the control (C) group are inferior, but not statistically significant.
Discussion
Overall the survey results, we can conclusion that for E2 group, it is necessary to supplement the program exercises to develop strength (static strength of arms and shoulders and repetitive force of trunk), then you should practice more out in the open, where greater opportunities for training runs. For E1 group, the

244
most important things to be improved in the future work is primarily a higher intensity exercise for developing static strength of arms and shoulders in III b and IV part of training. The experimental group had the worst results in all variables which indicate to the necessity of the correction program and the execution of the same.
In both experimental groups (in which professors of sport and physical education were the perpetrators of the program) achieved better results than the control group (in which the performance of teachers in charge). This does not mean that teachers are worse specialists than professors of sport and physical education, respectivly their program was poorer. Differences in the results did not make any sports equipment, considering that C and E2 groups worked in the same conditions. What make a difference is probably length classes (training) where we can see that the E1 group (who achieved the best results) that training lasted one hour. On the other side, and both perpetrators were educated and trained for work with preschool children, provided that professors of sport and physical education have greater physical scope of knowledge when it comes to sports and motor abilities unlike teachers who basic knowledge of physical education gained only one case during the their education. Although the title of this work written: „the teachers against professor of sport and physical education“ but general conclusion would read: teachers and professors together in the struggle to develop the motor skills of preschool children, because only in this way, together, continuous improvement of both, using modern methods of exercise, content enrichment classes, using as many props, exchange of experiences, we can come to the aim, and the aim is normal child locomotion and well-shod and ready to use their skills in everyday life.
References
1. Bala, G. (2002). Sportska školica. [Sports school]. Novi Sad: Samostalno autorsko izdanje.
2. Bala, G. i Popović, B. (2007). Motoričke sposobnosti predškolske dece. U G. Bala (ur.), Antropološke karakteristike i sposobnosti predškolske dece (str. 101-151). Novi Sad: Fakultet sporta i fizičkog vaspitanja.
3. Bala, G., Popović, B. i Jakšić, D. (2009). Trend of changes of general motor ability structure in preschool children. 1st International scientific conference – exercise and quality of life. Proceedings book (pp 113-117). Novi Sad: Faculty of sport and physical education.
4. Bala, G., Popović, B., & Stupar, D. (2002). Neophodne modifikacije nekih standardnih motoričkih testova za predškolsku decu. [Necessary modifications of some standard motor tests for preschool children]. Zbornik radova Deseti meñunarodni simpozijum "Sport, fizička aktivnost i zdravlje mladih" (str. 411-417). Novi Sad: Univerzitet u Novom Sadu, Novosadski maraton.
5. Gredelj, M., Metikoš, D., Hošek, A., & Momirović, K. (1975). Model hijerarhijske strukture motoričkih sposbnosti. 1. Rezultati dobijeni primjenom jednog neoklasičnog postupka za procjenu latentnih dimenzija. [Model of the hierarchical structure of motor and technical capacity. 1. Results obtained using a neoclassical procedure for assessing latent dimensions]. Kineziologija, 5(5), 7-81.
6. Ismail, A.H., & Gruber, J.J. (1971). Integrated development – Motor aptitude and intellectual perfomance. Columbus: Charles E. Merrill Books, INC.
7. Janković, I. (2005). Dečija škola sporta. [Children's School of Sport]. Aktuelno u praksi, 5, 86-91.
8. Kamenov, E. (1995). Model osnova programa vaspitno-obrazovnog rada sa predškolskom decom. [Basis of a model of educational work with preschool children]. Novi Sad: Odsek za pedagogiju Filozofskog fakulteta u Novom Sadu, Viša škola za obrazovanje vaspitača u Kikindi.
9. Kulić, D. (2005). Karakteristike motoričkog razvoja predškolske dece. [Characteristics of motor development of preschool children] (Diplomski rad). Novi Sad: Fakultet fizičke kulture.
10. Kurelić, N., Momirović, K., Stojanović, M., Šturm, J., Radojević, ð. i Viskić-Štalec, N. (1975). Struktura i razvoj morfoloških i motoričkih dimenzija omladine. [The structure and development of morphological and motoric dimensions of youth]. Beograd: Institut za naučna istraživanja Fakulteta za fizičko vaspitanje. [Institute for Scientific Research of the Faculty of Physical Education].

245
THE EVALUATION OF MOTOR DEVELOPMENT IN
ELEMENTARY SCHOOLS
Dragan Marinković and Valdemar Štajer
Faculty of Physical Education and Sport, University of Novi Sad, Serbia
Abstract
The aim of this research is to determine the physical education teachers' attitudes related to the issue of monitoring motor development of children in primary school. This study covered 16 primary schools and 40 teachers of physical education. Survey, as it was applied, determined the attitudes and opinions of the respondents related to this issue. The questionnaire was of mixed character, consisting of fourteen questions open and closed. Combined are descriptive, exploratory and explanatory questions in order to determine the best attitude of teachers. The results were statically analyzed using nonparametric Pearson chi-square test, Crosstabs, which was obtained by chi-square value. The results of the above analysis show that there is no statistically significant difference among respondents of different ages in terms of monitoring students' motor development. The survey conducted leads us to a conclusion about the quality and method of evaluation pupils motor development in elementary school.
Keywords: attitudes, education system, motor advancement
Introduction
Evaluation is the assessment of phenomenon, or data, in a regulated or unregulated social system. This is the systematic examination and assessment of characteristics of initiative and effects, the purpose of which is to produce information that can be used by those who have an interest in the improvement or efficiency (WHO, 2001). It is thus a process by which performance indicators are obtained as well as the course of certain processes. As defined by the American Association of Evaluation, evaluation is the assessment of strengths and weaknesses of specific programs, organizations and policies whose purpose is to improve efficiency. Evaluation is the systematic application of social research procedures for assessing the conceptualization, design, implementation and usefulness of various types of programs (Rossi, Freeman, 1993).By the term quality control of the education system we mean a set of planned activities aimed to evaluate and assess the quality of work in primary education (Manojlovic, 2011). The U.S. National Association for Sports and Physical Education (NASPET, 2007) states that a quality physical education requires a customized infrastructure, designed curriculum, defined content, appropriate teaching practices, including implementation of the plan in class, student and program assessment and evaluation. Ongoing monitoring and process control during the school year is imposed as an obligation for all teachers. Physical development and motor skills development, should be viewed as inseparable structural elements of personality with cognitive, co-native and social elements in an integrated child's maturation. For these reasons, one of the most important tasks of physical education should be to encourage physical development and improvement of motor abilities of children.
Motor development, which is an integral part of the process of physical education and a changing natural morpho-functional properties of the human body (Krsmanović, Berković, 1999). The development of motor skills in girls occur by the age of 13 and in boys by the ages of 18 to 19.With the advancement of physical education in different education systems, there arose a need for monitoring, recording of motor abilities of students. In addition to looking at the continuous and longitudinal development of students, evaluation of motor condition is aimed at changing teaching. Research and evaluation are essential factors of development of physical education and sport (Unesco, 1978).
In our country, the first organized follow-up model of motor abilities of children and youth was carried out in Belgrade from the seventies to the mid-nineties of the 20th century. "The system of

246
permanent monitoring of physical development and physical abilities of pupils in primary and secondary schools of Belgrade", as this model was called, other than standard data collection, analysis, and conclusion had a goal of making assumptions about the situation in the former physical education (Milanovic, Radisavljević, Pasic, 2010). Monitoring is a process that is tackled by physical education teachers and through regulations on the curriculum for fifth, sixth, seventh and eighth grade. Motor tests are the most common measurement instruments that teachers use to quantify the value of certain motor skills.
The aim of this research is to determine the physical education teachers' attitudes related to the issue of monitoring motor development of children in primary school and determine how much they actually applied motor tests in the classroom, how they track and handle the results recorded and use the results to improve curriculum as well as the development of motor abilities of students.
Method
This survey covered 16 primary schools and 40 teachers of physical education. Schools which employed the surveyed teachers of physical education are located in the municipalities of Novi Sad, Becej, Prokuplje. Applied research is descriptive, whose aim was to concentrate on monitoring the status and motor development problems of pupils in primary schools. Survey, as it was applied, determined the attitudes and opinions of the respondents related to this issue. The questionnaire was of mixed character, consisting of fourteen questions open and closed. Combined are descriptive, exploratory and explanatory questions in order to determine the best attitude of teachers. The results were statically analyzed using nonparametric Pearson chi-square test, Crosstabs, which was obtained by chi-square value (statistical significance level of p ≤ 0.02). The resulting values tell us whether there is a statistically significant difference among respondents of different ages in terms of monitoring students' motor development. Questions were also analyzed in order to obtain the frequency of individual responses and the percentage in relation to all the answers.
Results
The results of survey research are presented in tables and graphs. The first part the displayed the results will apply only to subjects who performed testing and monitoring of students' motor development. They state their views and answer questions related to the process and method of evaluation that they perform. The second part refers to the analysis of the Pearson Hi-square test, which shows the ratio of cross-age and attitude that you follow or not follow the motor development of students. This information was related to the overall sample of respondents.
Percentage of teachers who follow the motor development of children in primary education is 65%. This data is the basis for further formation of relationships, in order to reach a better and clearer conclusion.
Below are the results related to the teachers who responded to deal with students' assessment of motor development. The presented data show how the evaluation is done, how results are recorded and what is their practical application in order to improve teaching.

247
Table 1. Question and answer related to the process and method of evaluation
Gender of respondents
Frequency Percent
Male 19 73.1
Female 7 26.9
Age
Frequency Percent
Up to 30 years 4 15.4
Up to 40 years 8 30.8
Up to 50 years 8 30.8
More than 50 years of age 6 23.1
Years of work experience
Frequency Percent
Up to 5 years of work experience 7 26.9
From 5 to 10 years of work experience 3 11.5
More than 10 years of work experience 16 61.5
How often do you apply the tests to assess the basic motor skills in the course of a school year?
Frequency Percent
At the end of the year 3 11.5
And at the beginning and end of school year 22 84.6
Something else 1 3.8
Do parents receive information about the motor development?
Frequency Percent
Yes 3 11.5
Inform them individually as needed 12 46.2
No 11 42.3
How significant are the results of motor tests in the formation of the final grade in physical education? Frequency Percent
Is crucial for the formation of the final grade 0 0
Equally as important as other results of the evaluation 21 80.8
I do not take them into account when establishing the final grade 4 15.4
Something else 1 3.8
Table 1. Shows the gender ratio of respondents who said they monitor students' motor development. It is evident that 73.1% of male teachers out of 26 respondents.
The same number of teachers who are up to 40 years of age and those who are up to 50 years of age. In this table we can also see formed groups of teachers according to their age. The least are those up to 30 years of age, who total 15.4%.
More than two-thirds of teachers who follow motor development had 10 or more years of work experience. A large percentage of the teachers who had a tenure of up to 5 years-26.9%.
Respondents most commonly applied motor tests at the beginning and end of the school year, and there are 84.6 percent of such teachers. The only case which said that the motor testing is done in a different way said that the tests are carried out in relation to the students’ age and their level of motor skills.
Table 1. reported results that indicate that 42.3% of teachers do not inform parents about their children's motor development. The remaining 57.7% do so by informing them as part of the parents informing them of meetings or individually as needed.
According to the results even 80.8% of teachers who follow motor development, consider taking the results equally important as the other results of evaluation in education in the formation of the final

248
grade. A teacher who has not found his way in the sample said that the value of the test motor has a bearing on the students only in those cases where they show better results than their average, and on the ground that forms a higher rating.
Table 2. Monitoring the age of motor development Crosstabulation; result of the Pearson Hi-square test.
Monitoring of motor development
Yes No Total
Count 4 2 6
% within age 66.7% 33.3% 100.0%
% within tracking motor development 15.4% 14.3% 15.0%
Up to 30 years
% of Total 10.0% 5.0% 15.0%
Count 8 7 15
% within age 53.3% 46.7% 100.0%
% within tracking motor development 30.8% 50.0% 37.5%
Up to 40 years
% of Total 20.0% 17.5% 37.5%
Count 8 1 9
% within age 88.9% 11.1% 100.0%
% within tracking motor development 30.8% 7.1% 22.5%
Up to 50 years
% of Total 20.0% 2.5% 22.5%
Count 6 4 10
% within age 60.0% 40.0% 100.0%
% within tracking motor development 23.1% 28.6% 25.0%
Age
More than 50 years
% of Total 15.0% 10.0% 25.0% Total Count 26 14 40 % within age 65.0% 35.0% 100.0% % within tracking motor development 100.0% 100.0% 100.0% % of Total 65.0% 35.0% 100.0%
Value df Asymp. Sig. (2-sided)
Pearson Hi-square 3.272 3 .352
Legend: df - degrees of freedom; Asymp. Sig. (2-sided) - The statistical significance of p ≤ 0.02.
Table 2 shows the cross-relations between individual variables and categories that were recorded on the entire sample. Thus it can be seen how many teachers over the age of the motor applied in monitoring the curriculum. A total of 65% of teachers are engaged in evaluation of this dimension of personality. At the bottom of the table are a result of Pearson’s Hi-square test, its value, the degree of freedom, and the statistical significance of p ≤ 0.02. In the group of respondents, there was no statistically significant difference in the monitoring of motor development in relation to age. There are only minimal differences between those who follow and those who do not follow motor development of students in relation to age. It may be noted that the biggest difference in relation to the monitoring of motor development in the period between 40 and 50, where 88.9% of respondents declared positive. The lowest percentage of teachers who carry out evaluation of basic motor skills in a group up to 30 years of age but overall in that category and not in much of the surveyed population.
Discussion
The survey conducted is only one of the few that deal with assessment of the quality of teaching physical education in terms of evaluation. The results obtained should be looked at as a whole, and analyzed the data by itself can not complete the picture on this issue. It was therefore necessary to consider each completed questionnaire and try to perform a conclusion that could be generalized to the general population. The highest value of the research itself is a personal communication and direct contact with all respondents. Such an honest relationship could establish how many teachers actually have the

249
knowledge, skills, ability to cope with problems in the classroom. Each subject had his attitude towards the issue of motor development, of which he spoke openly. Different cases were encountered which had in common that they all found the researcher a good interlocutor with whom they could share problems that accompany them in terms of evaluation of motor development. Teachers who for some reason did not follow the motor development of students (35%) were looking for an excuse for such actions in a variety of alleged shortcomings. Some have mentioned that the problem is that students do not test conditions that do not have (conference room, returned, mats, etc.). A real reason, however, lies in other factors such as lack of commitment, knowledge, willingness and ability to organize. Although the regulations prescribed by the necessity of continued monitoring of motor development, they have not found it necessary to comply with and carry out in a certain way. Characteristic of teachers who have declared they do not follow motor development of students is that their relationship to teaching, props, and the school was bad, lacking any responsibilities or authority. According to such an attitude to work generally, and not surprisingly, there is not a form of evaluation, because it is just one link in the chain of correct teaching.
On the other hand, teachers who responded to follow the motor development of pupils in primary schools, largely proved correct and responsible attitude towards teaching, work and students. A survey of these teachers was not a problem in meeting and communicating with them, we could see that govern matter, measurement, evaluation and monitoring of various dimensions of students' abilities.
Teachers with this attitude, and they were 65%, have in common that in 73.1% were men, which is proportional to the number of enrolled students and students in undergraduate studies. Expected is a teacher by age categories.
There were least teachers who are up to 30 years of age because many end up basic academic studies in the late twenties and a variety of circumstances do not allow large numbers of teachers thirty years ago to start working. The reason for this shift is the limit for retirement and the process of rejuvenation of staff in physical education is constantly postponed.
A high percentage (84.6%), teachers conduct testing at the beginning and end of the year. This has given a full picture of the possible progress of students, on the other hand, testing them is not time consuming more than conventional obligations in the curriculum. It is a habit that teachers at the beginning of school year include testing the program in order to observe the initial state of students. The final testing supplements this in order to see how many of those progressed or stagnated in some motor skills.
The results of motor tests teachers take into account when establishing the final grade in physical education. In many cases, they are just as important as other forms of evaluation (acquired sports and technical knowledge, attitude towards work, etc.).
Only three teachers have expressed that in practice they notify parents of the value of certain motor skills of their children. Teachers often expressed the view that parents are not interested in the personality dimensions, and are rarely those who are interested. Informing the parents individually, if necessary, however, there were situations when a student achieves much less than optimal results (standard or average), or if there is stagnation in the development of skills. These are usually done to provide parents’ attention to poorer achievement and to make them opt for one of the possible sports. Still even 42.3% of teachers did not have this type of communication with parents, although as teachers and educators are obliged to inform parents about the achievements of all children.
The overall conclusion is that the monitoring of motor development of students in primary education in a sample of forty teachers takes place in 65% of cases. This is the good side of this issue, because the evaluation is still done in a way which means that teachers are able to carry out monitoring, and thus contribute to better teaching. The downside is that this study found the percentage of those who did not carry out monitoring of motor development in any form. They are not only engaged and willing to do so, but, it seems, have neither the knowledge nor the ability to perform the evaluation. Their overall attitude to work is not satisfactory and that attitude certainly can not raise educational standards. However, it is evident that the biggest problem is that there is no uniform system of monitoring and evaluation as prescribed by the competent authorities.
In the group of respondents, there was no statistically significant difference in the monitoring of motor development in relation to age. There are only minimal differences between those who follow and

250
those who do not follow motor development of students in relation to age. That mean all respondents have a same opinion about monitoring of motor developmental. There is no framework and system of evaluation for all teacher in primary school so, that can be one of reason for this kind of result. Those who follow motor developmental, are usually teacher with generally good and professional state about teaching, and that is not in relation to age.
Ministry of Education and Science Republic of Serbia within the rules prescribed duties of teachers, may be prescribed by law, rules, standards and methods of evaluation in physical education. Compilation of tests that are standardized and applied in different conditions, with additional teacher training, and control can make the first step towards raising the level of evaluation in physical education. If there would have been a personal student cards or electronic database, the Ministry may at any time control the state of motor development as well as all other values that can be measured. For example in Sweden, there were organized process of evaluation in all level of educational system (Quennerstedt, Öhman, Eriksson, 2008). Only such a unique framework and evaluation system prescribed from the top of the hierarchy can solve some problems in the implementation of monitoring motor development of pupils in primary schools.
References
1. Krsmanović, B., Berković, L. (1999). Teorija i metodika fizičkog vaspitanja. Novi Sad: Fakultet sporta i fizičko vaspitanje.
2. Manojlović, G. (2011). Sistemi praćenja i ocenjivanja kvaliteta rada u osnovnom obrazovanju. Zbornik apstrakta sa Festivala kvaliteta 2011, (Ur: Arsovski, S., Lazić, M., Stefanović, M. Kragujevac: Skver.
3. Milanović, I., Radisavljević, S., Pašić, M. (2010). Aktuelno stanje i odnos nastavnika prema praćenju fizičkog razvoja i motoričkih sposobnosti u okviru nastave fizičkog vaspitanja. Fizička kultura, 64(2), 76-88.
4. National Association for Sport and Physical Education (2007). Physical Education Teacher Evaluation Tool (Guidance document). Reston, Virginia, USA: Naspe.
5. Quennerstedt, M., Öhman, M., Eriksson, C. (2008). Physical Education in Sweden-a national evaluation. Education-line, 2008, 1-17.
6. Rossi, P. H., Freeman, H. E. (1993). Evaluation: A Systematic Approach (5th ed.). Newbury Park, CA: Sage Publications, Inc..
7. United Nations Educational Scientific and Cultural Organization (1978). International Charter of Physical Education and Sport.
8. World Health Organisation (2001). Evaluation in Health Promotion: Principles and Perspectives. Edited by Rootman, I., Goodstadt, M. , Hyndman B., McQueen, D. V., Potvin, L., Springett, J., Ziglio, E. WHO Regional Publications, European Series, No 92. Denmark: WHO.

251
THE GENDER DIFFERENCES IN ANTHROPOMETRIC
CHARACTERISTICS, BODY COMPOSITION AND MOTOR
ABILITIES OF JUNIOR SCHOOL AGE CHILDREN
Akoš Taboroši¹ and Sabolč Halaši²
¹ Grammar School for Talented Students „Kosztolányi Dezsı“, Subotica, Serbia
² Faculty of Teacher Education in Hungarian language, University of Novi Sad, Serbia
Abstract
In the current era of what is referred to as obesity pandemic, it is essential to gather and have objective information on children’s anthropometric characteristics, body composition and motor abilities. The aim of this study was to establish whether there are statistically significant differences in the analysed anthropometric characteristics, body composition and motor abilities between boys and girls of junior school age. The drawn sample consisted of 62 male and 63 female examinees aged seven, pupils of two elementary schools in Subotica. Height was measured by the use of Martin’s anthropometer, weight was measured by the use of InBody 230 and after that body mass index was also calculated. The measures of body composition (skeletal muscle mass, fat and lean body mass) were evaluated by the use of InBody 230 that is a device which functions on the base of bioelectrical impedance. The following motor abilities were tested: explosive leg strength, coordination, speed of alternative hand movement, static strength of arms and shoulders, flexibility and repetitive trunk strength. The results of the research have proved that there are no statistically significant gender differences in anthropometrical characteristics, while there are significant differences in motor abilities and in body composition between males and females of lower elementary school age.
Keywords: anthropometric characteristics, body composition, motor abilities, children, gender differences.
Introduction
The aim of the athropometric measurements of children is to determine their condition in terms of body characteristics, so that by comparing it with the standards we could get an insight into the processes of physical growth, i.e. the suitability of nutrition. Therefore, before the anthropometric measurements, it is important to collect data of height and weight and the circumference of certain body parts (Simić, 1977).
Most of the traditional methods for determination of body composition is based on the bicomponent model, according to which the total body mass consists of two parts: fat body mass and lean body mass. Lean body mass includes muscles, skeleton and the organs. Fat body mass includes „important“ and „unimportant“ fat. The „unimportant“ fat is the subcutaneous fat tissue, the yellow bone marrow and the abdominal visceral fat. As body weight can be the result of very different combinations of the tissues, which are part of the body composition, the weight of the muscle mass, the total of the fat in the organism and the total of the amount of water are needed to be determined. These data are also needed so that on the basis of the so called lean body mass the amount of active mass of the body or the functional ability of the organism could be measured (Savićević, 1970). Girls practically have more subcutaneous fat than boys at all ages, although till the age of 12-13 the accumulation of subcutaneous fat is very similar with girls and boys. The differences become significant in the adolescence (ðorñić, 2012). At the same time sexual maturity brings along significant increase in muscle mass of boys which means that the adolescence is the time when the gender-specific differences in body composition manifest themselves. After the age of 11 fat mass is a lot more present in the body composition of girls, while the lean body mass is more present with boys (Andreenko, & Nikolova, 2011). According to some authors

252
the gender-specific changes in the body composition of girls is to do with the decrease of physical activity in the adolescence, which is more characteristic for girls than for boys (Malina, Bouchard, & Bar-Or, 2004).
The motor trait of children is less differentiated than that of the adults, in other words it can be described with one general motor factor or with more factors which highly correlate with each other and so they represent a unity (Bala, Stojanović, & Stojanović, 2007). Movements are made with more or less success, but not only abilities like strength or speed manifest themselves in an isolated form, but one ability will be compensated with another, so the child, in different situations and tasks, manifests their complex motoricity. At the age of 9-11, or with girls even earlier, motor abilities gradually differentiate, which means that some of them manifest themselves earlier and some later (Nićin, 2000; Malina et al. 2004). In the studies conducted by Prskalo, Kraljević, & Kovačić (2011) the significance of the differences between boys and girls in motor abilities was stated. The following tests were carried out: high jump, bent arm hang and standing broad jump which dominate with boys, while with girls the variable forward bend dominates which is an instrument for measuring flexibility. In former studies (Trošt Bobić, Nimčević, & Bobić, 2008; ðurašković et al. 2009; Krsmanović, Batez, & Krsmanović, 2011) it was proved that there are no statistically significant differences between boys and girls in anthropometric characteristics at children of junior school age.
The aim of this study is to determine if there are statistically significant differences between boys and girls of junior school age in the analysed anthropometric characteristics, body composition and motor abilities.
Method
Sample of subjects
The drawn sample consisted of 62 male and 63 female examinees, pupils of first grade of elementary school. The sample is chosen, and all the examinee are from Subotica, from the elementary schools „Majšanski put“ and „Jovan Jovanović Zmaj“. The subjects are clinically healthy, attend the school and follow the national curriculum for the first grade of primary schools which includes three physical education lessons per week.
Sample of measuring instruments
The following athropometric measures were used: 1. Height (cm) 2. Weight (0.1 kg) 3. Body Mass Index (BMI)
Height was measured by the use of Martin’s anthropometer, and weight was measured by the use of the electronic scales of InBody 230 (Biospace Co., Ltd, Seul, Korea). From the data about height and weight a great number of indexes are calculated. One of the most often used indexes is the Body Mass Index (BMI) which represents the quotient of weight in kilogrammes and height squared in metres.
Body composition was determined with the following indicators: 1. Skeletal Muscle Mass (0.1 kg) 2. Fat (0.1 kg) 3. Lean Body Mass (Right and Left Arm Lean Mass, Trunk Lean Mass, Right and Left Leg
Lean Mass (0.1 kg) Body composition was determined with the equipment InBody 230 (Biospace Co., Ltd, Seul,
Korea), which functions on the basis of bioelectrical impedance. Bioelectrical impedance is nowadays a widely used method for determining body composition.
Motor abilities were tested with a test battery which include the following motor tests: 1. 20 m dash (0.1 s) - for the explosive leg strength 2. Obstacle course backwards (0.1 s) – for the coordination and restructuring of movement
stereotype 3. Standing broad jump (cm) - for the explosive leg strength 4. Arm plate tapping (freq.) - for the speed of alternative hand movement 5. Bent-arm hang (0.1 s) - for static strength of arms and shoulders

253
6. Seated straddle stretch (cm) - for flexibility 7. Crossed-arm sit-ups (freq.) - for the repetitive trunk strength The used motor tests are adjusted to younger children. For more precise description and
instructions see Bala, Stojanović, & Stojanović (2007).
Organisation of measuring
In terms of time and character of measurement this study was of transversal type. It was carried out in May and June in school year 2009/2010 as part of a more extensive research. All the measurements and testing were carried out in the gym of the school. The tests were conducted by physical education teachers from Subotica. Prior to testing parents gave written approval in accordance with the requirements of the Declaration of Helsinki. Height and weight were measured first, then body composition, and after that motor abilities were tested. Motor abilities were tested in the following order: 20 m dash, obstacle course backwards, standing broad jump, arm plate tapping, bent-arm hang, seated straddle stretch and crossed-arm sit-ups. Before the researches (measurements, valuation and testing) were conducted all the examiners and assisstants had got standardisation of tests in written form, they had done a training and experimental measurements had been taken in order to ensure the coherent and precise work of all the examiners.
Data analysis
The data were processed with proper statistical procedure. Central and dispersion statistics were stated first. Multivariate analysis of variance (MANOVA) and univariate analysis of variance (ANOVA) were used to test the differences.
Results
Table 1 shows data about descriptive statisctics of all measured variables (anthropometric variables, variables of body composition and motor variables) of boys and girls.
Table 1. Basic descriptive statistics of boys and girls Boys Girls
VARIABLE/GENDER M SD MIN MAX M SD MIN MAX
Height (cm) 130.96 6.57 119 148 130.52 6.51 116 146
Weight (0.1 kg) 29.01 6.89 18.70 54.90 28.02 6.91 19 53.50
Body Mass Index (BMI) 16.76 2.79 12.80 27.60 16.28 3.17 12 29.40
Skel. muscle mass (0.1 kg) 11.95 2.02 8.40 17.10 11.04 2.05 8.10 17.60
Fat (0.1 kg) 5.44 4.44 0.70 23.90 5.84 4.29 1.70 25.50
R. arm lean mass (0.1 kg) 0.96 0.49 0.50 4.40 0.76 0.25 0.30 1.50
L. arm lean mass (0.1 kg) 0.95 0.49 0.50 4.40 0.76 0.25 0.30 1.50
Trunk lean mass (0.1 kg) 10.16 3.37 6.80 33.30 8.93 1.77 6.30 13.70
R. leg lean mass (0.1 kg) 2.97 1.28 1.70 11.70 2.55 0.65 1.40 4.50
L. leg lean mass (0.1 kg) 2.96 1.27 1.80 11.60 2.56 0.63 1.60 4.40
20 m dash (0.1 s) 45.85 4.26 40 59 49.79 5.65 41 67
Obstac. c. backwards (0.1 s) 208.47 60.23 119 436 262.43 101.73 144 738
Arm plate tapping (freq.) 22.63 3.86 15 31 22.03 3.39 12 31
Seated straddle strech (cm) 35.84 6.72 19 56 41.49 7.16 20 57
Bent-arm hang (0.1 s) 119.52 95.84 0 430 111.25 98.85 0 556
Crossed-arm sit-ups (freq.) 27.48 7.26 13 51 25.94 6.30 10 38
Standing broad jump (cm) 137.93 15.84 95 173 124.62 17.85 80 159 M - mean; SD – standard deviation; MIN – minimal value; MAX – maximal value

254
Table 2. Significance of gender differences in anthropometric characteristics
VARIABLE F p
Height 0.14 0.71
Weight 0.63 0.43
Body Mass Index 0.78 0.38
MANOVA 0.31 0.82
F – value of F-test; p – level of statistical significance for ANOVA and MANOVA
The results of MANOVA (p=0.82) and ANOVA (Height (p=0.71), Weight (p=0.43) and Body Mass Index (p=0.38)) in the sub-trait of anthropometric characteristics of children showed that there are no statistically significant gender differences.
Table 3. Significance of differences between girls and boys in body composition
VARIABLE F p
Skeletal Muscle Mass 6.30 0.01
Fat 0.26 0.61
MANOVA 5.72 0.00
The results of multivariate analysis of variance (p=0.00) in body composition of children show that there are statistically significant gender differences in body composition between boys and girls of junior school age and these differences are in Skeletal Muscle Mass variable (p=0.01). Already at this age boys have significantly bigger amount of muscles. As far as the Fat variable (p=0.61) is concerned there could be seen no statistically significant differences in gender.
Table 4. Significance of gender differences related to the variable Lean Body Segment Mass
VARIABLE F p
Right Arm Lean Mass 8.76 0.00
Left Arm Lean Mass 7.90 0.01
Trunk Lean Mass 6.68 0.01
Right Leg Lean Mass 5.34 0.02
Left Leg Lean Mass 5.11 0.03
MANOVA 2.99 0.01
The results of MANOVA and ANOVA related to variables of Lean Body Mass are shown in Table 4. MANOVA (p=0.01) proved that there are significant gender differences in the analysed variables, which determine the Lean Body Segment Mass with the examinee of junior school age, in all the variables separately.
Table 5. Significance of gender differences in motor variables
VARIABLE F p
20 m dash 19.35 0.00
Obstacle course backwards 12.97 0.00
Arm plate tapping 0.85 0.36
Seated straddle stretch 20.71 0.00
Bent-arm hang 0.23 0.64
Crossed-arm sit-ups 1.62 0.21
Standing broad jump 19.44 0.00
MANOVA 11.48 0.00

255
The results of MANOVA (p=0.00) and ANOVE in the sub-traits of motor abilities of children showed that there are statistically significant gender differences in motor tests: 20 m dash (p=0.00), obstacle course backwards (p=0.00), seated straddle stretch (p=0.00) and standing broad jump (p=0.00). Significant differences appear in favour of girls only when it is about flexibility, while boys were much better than girls at tests for explosive leg strength and coordination.
Discussion
In the study gender differences were analysed in three anthropologic sub-traits: anthropometric characteristics, body composition and motor abilities of junior school age children.
In the anthropometric traits there has not been found statistically significant differences between boys and girls. Other authors (ðurašković et al. 2009; Bala, 2004; Vajda, 2008; Trošt et al. 2008; Karmen, 2009; Cetinić, & Petrić, 2010), who carried out researches on examinees of the same or similar age have come to the same conclusion, i.e. that there are no statistically significant differences between boys and girls in anthropometric characteristics. Significant differences in morphological characteristics appear in the puberty. It can be expected that girls start growing faster already at the age of 9-11, while the same happens to boys two years later on the average (Malina, Bouchard, & Bar-Or, 2004).
With two sub-traits differences between boys and girls aged 7 were defined. These sub-traits are body composition and motor abilities of children. With regard to body composition statistically significant differences can be proved in the following variables: skeletal muscle mass and lean body segment mass (right arm lean mass, left arm lean mass, trunk lean mass, right leg lean mass, left leg lean mass) in favour of boys. On one hand the explanation of the results can be the biological (genetic) characteristics of male and female organisms. The differences between boys and girls in these components of body composition are the result of gender differences in the amount and mass of skeleton and in the increase of muscle mass during growth and maturation. On the other hand the more intense and frequent physical activity of boys in this period of growth and maturation contribute to the bigger amount of active (muscle) mass in a great deal. Body composition is much more sensitive to the effects of physical activity than are height and weight (Beunen, Malina, Renson, Simons, Ostyn, & Lefevre, 1992; Mirwald, & Bailey, 1986). The physically active children have less fat and more lean body mass than the physically inactive ones. Regular physical activity does not cause changes in the speed of growth in longitudinal dimensions, but it increases active (muscle) mass of the body and decreases fat (Mészáros, 2010).
By studying individual motor variables it can be stated that there are significant gender differences: girls are better when it is about flexibility, and boys are better at explosive leg strength and coordination. The fact that girls are more flexible already at this age can be explained by that the quality of their muscle tissue is more flexible, elastic and softer, and this is especially true for the pelvic muscles and the hamstrings leg muscles. The results of this research also explains the greater explosive leg strength of boys. We can see that boys’ skeletal muscle mass and lean leg mass are significantly larger than that of girls’. The larger amount of leg muscles of boys contributes to better completion of motor tests 20 m dash and standing broad jump. There is one more thing worth mentioning, and that is that the explosive strength also depends on the size of the cross-section of the muscle. The better coordination of boys can be explained by their more frequent use of natural form of movements (walking, running, crawling, climbing, jumping, turning head over heels) already in the kindergarten and in the first grade of elementary school (ðorñić, 2006; Cvetković, Popović, & Jakšić, 2007; ðorñić, & Bala, 2006). Already in the childhood boys choose livelier games. Girls moved much less while playing a game and they were less on the move. The results of this study confirmed the results of former researches of different authors (Rodić, 1998; Cvetković et al. 2007; Prskalo et al. 2011; Trošt et al. 2008; Cetinić, & Petrić, 2010) according to which boys are more successful in motor tasks whose aim was to determine explosive leg strength and coordination, and that girls are more successful in tests that determine flexibility.

256
References
1. Andreenko, E., & Nikolova, M. (2011). Analiza telesne kompozicije kod dece i adolescenata iz Plovdiva (Bugarska) metodom bioelektrične impedance [Analysis of body composition of children and adolescents from Plovdiv (Bulgaria) with the method of bioelectrical impedance]. Glasnik Antropološkog društva Srbije, 46, 59-65.
2. Bala, G. (2004). Kvantitativne razlike osnovnih antropometrijskih karakteristika i motoričkih sposobnosti dečaka i devojčica u predškolskom uzrastu [Quantitative differences in basic anthropometric characteristics and motor abilities of preschool boys and girls]. Glasnik Antropološkog društva Jugoslavije, 39, 219-227.
3. Bala, G., Stojanović, M., & Stojanović, M. (2007). Merenje i definisanje motoričkih sposobnosti dece [Measurement and definement of motor abilities of children]. Novi Sad: Fakultet sporta i fizičkog vaspitanja.
4. Beunen, G. P., Malina, R. M., Renson, R., Simons, J., Ostyn, M., & Lefevre, J. (1992). Physical activity and growth, maturation and performance: A longitudinal study. Medicine and Science in Sports and Exercise, 24, 576-585.
5. Cetinić, J., & Petrić, V. (2010). Spolne razlike antropometrijskih obilježja, motoričkih i funkcionalnih sposobnosti te motoričkih dostignuća (skokovi, trčanja i bacanja) učenika rane školske dobi [Gender differences in anthropometric features, motor and functional abilities, i.e. motor achievements (jumping, running, throwing) with children of junior school age]. 19. Ljetna škola kineziologa Republike Hrvatske (pp. 90-97). Poreč: Hrvatski kineziološki savez.
6. Cvetković, M., Popović, B., & Jakšić, D. (2007). Razlike u motoričkim sposobnostima predškolske dece u odnosu na pol [Differences in motor abilities of preschool children with respect to gender]. U Nove tehnologije u sportu (pp. 288-293). Sarajevo: Fakultet sporta i tjelesnog odgoja.
7. ðorñić, V. (2006). Fizička aktivnost predškolske dece [Physical activity of preschool children]. U G. Bala (Ed.), Antropološke karakteristike i sposobnosti predškolske dece (pp. 331-360). Novi Sad: Fakultet sporta i fizičkog vaspitanja.
8. ðorñić, V. (2012). Školsko fizičko vaspitanje [School Physical Education]. Novi Sad: Fakultet sporta i fizičkog vaspitanja.
9. ðorñić, V., & Bala, G. (2006). Fizička aktivnost dece predškolskog uzrasta [Physical activity of preschool children]. U G. Bala (Ur.), Fizička aktivnost devojčica i dečaka predškolskog uzrasta (pp. 57-74). Novi Sad: Fakultet fizičke kulture.
10. ðurašković, R., Kostić, R., Pantelić, S., Živković, D., Uzunović, S., Purenović, T., & Živković, M. (2009). Komparativna analiza antropometrijskih parametara sedmogodišnje dece [A comparative analysis of the anthropometric parameters of seven-year-old children]. Facta Universitatis. Series Physical Education and Sport, 7(1), 79-90.
11. Karmen, P. (2009). Neke antropološke značajke djece mlañe školske dobi [Some anthropologic characteristics of children at junior school age]. Graduation work, Petrinja: Učiteljski fakultet Sveučilišta u Zagrebu.
12. Krsmanović, B., Batez, M., & Krsmanović, T. (2011). Razlike u antropometrijskim karakteristikama i uhranjenosti dečaka i devojčica [Differences in anthropometric characteristics and nutritional status of boys and girls]. Glasnik Antropološkog društva Srbije, 46, 89-94.
13. Malina, R. M., Bouchard, C., & Bar-Or, O. (2004). Growth, Maturation and Physical Activity. Champaign, IL: Human Kinetics.
14. Mészáros, Zs. (2010). A szomatikus fejlıdés, a testösszetétel és a motorikus teljesítmény változása alsó tagozatos fiúknál [Somatic development, body composition and change in motor achievment of junior school age boys]. Doctoral dissertation, Budapest: Semmelweis Egyetem Doktori Iskola.
15. Mirwald, R. L., & Bailey, D. A. (1986). Maximal aerobic power. London: Ontario.

257
16. Nićin, ð. (2000). Antropomotorika [Anthropomotorics]. Novi Sad: Fakultet fizičke kulture.
17. Prskalo, I., Kraljević, Ž., & Kovačić, M. (2011). Mjesto stanovanja prediktor spolnog dimorfizma nekih motoričkih sposobnosti u primarnoj edukaciji [Place of residence as predictive of gender dimorphism of some motor abilities in primary education]. U Tjelesna i zdravstvena kultura u 21. stoljeću – kompetencije učenika (pp. 394-399). Poreč: Hrvatski kineziološki savez.
18. Rodić, N. (1998). Diferencijacija eksplozivne snage učenika nižih razreda osnovne škole prema polu i uzrastu [Differentiation of explosive strength of lower-grade primary school pupils according to their gender and age]. Fizička kultura, 52(1), 1-6.
19. Savićević, M. (1970). Higijena i socijalna medicina [Hygiene and Social Medicine]. Beograd-Zagreb: Medicinska knjiga.
20. Simić, B. (1977). Medicinska dijetetika [Medical Dietetics]. Beograd-Zagreb: Medicinska knjiga.
21. Trošt Bobić, T., Nimčević, E., & Bobić, G. (2008). Razlike u nekim motoričkim i morfološkim varijablama izmeñu djevojčica i dječaka IV. razreda OŠ te utjecaj izvanškolskog tjelesnog vežbanja na iste učenike [Differences in some motor and morphological variables between girls and boys of 4th grade elementary school, i.e. effect of after-school physical exercises on these pupils]. U 17. Ljetna škola kineziologa Republike Hrvatske (pp. 225-233). Poreč: Hrvatski kineziološki savez.
22. Vajda, I. (2008). A motorikus teljesítmények és az antropometriai jellemzık kapcsolata 7-10 éves nem sportoló gyermekeknél [The correlation between motor performance and anthropometric features with 7-10 year-old, non-athletic children]. Doctoral dissertation, Budapest: Semmelweis Egyetem Sporttudományi Doktori Iskola.

258

259
DIFFERENCES IN PERCENTILE DISTRIBUTION OF BMI,
HEIGHT AND WEIGHT BETWEEN IV AND V GRADE PUPILS
Daniela Šukova-Stojmanovska, Georgi Georgiev and Lenče Aleksovska-Veličkovska
Faculty of Physical Education, University “Ss. Cyrilius and Methodius”, Skopje, R. Macedonia
Abstract
This longitudinal research was made first in September 2011, and then in September 2012, on a sample of 26 children (15 female and 11 male), both gender, on the age from 8 years and 6 months (8.06) to 9 years and 9 months (9.09) in fourth grade and from 9.06 to 10.09 in fifth grade. The aim of the study was to follow the percentiles of growth, weight and BMI of the same population of pupils, once measured in forth and then in fifth grade. In that purpose, NCHS referent values of the American Pediatric Association and Center for disease control and prevention, were used. So, for each of the children depend on its age in years and in months, percentile distribution of height, weight and BMI was estimated, separately for both sexes. From the obtained results we can conclude that in three variables existed statistical significant differences between forth and fifth grade pupils, which we expected, since children are growing and gaining weight. But the important part is to see if the children “remain” in the same percentile for the three parameters, but specially for BMI. Interesting is that 7 pupils with normal height ancestor in higher percentile and the rest 19 pupils remain in the same percentile for height. Also at 7 pupils appear change of the weight percentile and the rest 19 pupils remain in the same percentile for weight. If we consider BMI we can tell that changes appear at 12 pupils and the residual 14 pupils remain in the same BMI percentile.
Keywords: pupils, fourth grade, fifth grade, both gender, percentile distribution, height, weight, BMI.
Introduction
According to Dietz W.H. (2004) 70% of the obese children 5 to 17 years old, have at least one risk factor for heart diseases. Obese adolescents have bigger risk for prediabetes and diabetes (Li C., Ford E.S., Zhao G., Mokdad A.H., (2009)). Obese children have sleep apnea during sleeping and decreased self-confidence (Dietz W.H. (2004)), and also joint problems (Daniels S.R., Arnett D.K. and Eckel R.H. (2005). Kushi L.H., Byers T., Doyle C., Bandera E.V., McCullough M. and Gansler T, (2006), suggest that overweight is associated with increased risk for some types of cancer.
Defining obesity is really hard, because there are so many approaches, and yet not one unique criteria. Nevertheless BMI (body mass index) is the most used in that purpose and it is used not only for adults, but also in children’s population (although at first it was recommended not to be used in children). The reason for it’s wide use is that it can be calculated very easy, and there is really high correlation between BMI and the percent of body fat, measured with dual energy x-ray absorptiometry (DXA). The only minus for this index is that it can’t make difference if the bigger value is result of increase body fat or increase body muscle. But Shukova-Stojmanovska D. (1999) made a modification of the index by adding the average values of 3 and 6 skin fall thicknesses. This approach was used in a longitudinal research on a sample of 900 female (Shukova-Stojmanovska D., 1999) and 1141 male pupils (Shukova-Stojmanovska D. (2009)), 11, 12 and 13 years old. So using that modification of BMI the number and the percent of the obese pupils were determined – 14% of male and 15% of female pupils inVI grade, 15,7% of male and 15,9% of female pupils inVII grade and 14,7% of male and 17,7% of female pupils inVIII grade.
Percentile distribution of BMI is a method that uses BMI as a basic, too. After obtaining the value of BMI, it is used to compare with existing curves, constructed for both gender, from 0 to 20 years of age (and in adults, too), obtained from a really big sample of children. There are differences between male

260
and female curves because there are differences between the percent of body fat in both gender and also the body fat changes differently in both gender with aging. As we all know, there are critical periods in life when there is a bigger risk of gaining weight and become obese. So, those specifics are incorporated in the curves. If somebody has a BMI, that is in the 80th percentile, it means that the person has bigger BMI than 80 percent of the peers the same gender.
Pavlović M. (1992) tested 3 methods on same population of pupils (7-14 years old): standard deviation digress, percentile distribution of BMI and relative body mass, and realized that the second method is the strictest. With that method there were 13,5-13,9% obese pupils, with the first one – 18-21% , and with the third – 21-26,9%. Bjornelv S., Lydersen S., Holmen J., Lund Nilsen T.I. and Holmen T.L. (2009) also used the percentile distribution of BMI and realized that in Norvege there were approximately 17% obese children in the period of 1995 to 1997.
The first purpose of this research is to determine the percentile distribution of body height (BH), body weight (BW) and body mass index (BMI) separately for each pupil, and taking into account the gender and the accurate age (in years and months). The second purpose was to estimate the differences in the percentile distribution of the three variables between forth and fifth grade, and the last purpose was to establish the percent of obese pupils in forth and in fifth grade.
Method
This longitudinal study was conducted first in September 2011, and than in September 2012, on a sample of 26 pupils (15 female and 11 male), on age from 8.06 (8 years and 6 months) to 9.09 (9 years and 9 months) in forth grade and from 9.06 to 10.09 in fifth grade. Three variables were taken: body height (BH), body weight (BW) and body mass index (BMI). With 1 were marked variables took in IVth grade (BH1, BW1 and BMI1) and with 2 are marked variables taken in fifth grade (BH2, BW2 and BMI2). Than according to their gender and age (in years and months), percentile distribution of the same variables was established, with which was estimated where the child belongs – under average, average or above average values of the variables. Percentile distribution is established with software application of the Center for prevention and control of the diseases.
− for percentile distribution of body height (BH), separately for male and female − http://reference.medscape.com/calculator/height-age-percentile-boys, − http://reference.medscape.com/calculator/height-age-percentile-girls − for percentile distribution of body weight (BW), separately for male and female − http://reference.medscape.com/calculator/weight-age-percentile-boys
http://reference.medscape.com/calculator/weight-age-percentile-girls − for percentile distribution of body mass index (BMI), separately for male and female, with a
modification of the scale of nutritional status, by Frisancho A.R., (1990), so instead of 4, there are 5 scales, giving underweight also 2 scales like obesity (underweight – from 5th to 15th percentile, and expressed underweight – less than 5th percentile)
− http://reference.medscape.com/calculator/body-mass-index-percentile-boys − http://reference.medscape.com/calculator/body-mass-index-percentile-girls
At the end, T-test of small independent samples was calculated in order to see if there are differences between obtained results in IVth and Vth grade.
Results
From the results obtained in this survey and shown in tables 1, 2 and 3 we can tell that in all three variables (BH, BW and BMI) took in consideration, and in their percentile distribution as well (BHP, BWP and BMIP), statistically significant differences existed between pupils in forth and fifth grade, in favor to older children. This is logical and we expect it, because by growing children gain weight and height.

261
Table 1. Basic statistical parameters of body height (BH1), body weight (BW1) and BMI (BMI1 – body mass index) and their percentile distribution (BHP1, BWP1 and BMIP1) at mforth grade pupils
variables mean min. max. SD skewness kurtosis BH1 138,58 128,00 152,00 6,31 -1,64 -0,41 BHP1 67,85 17,00 98,90 26,03 -0,65 -0,80 BW1 35,77 24,00 57,00 8,86 0,90 -0,10 BWP1 67,65 4,60 99,70 27,53 -0,57 -0,63 BMI1 18,51 13,57 27,94 3,67 0,60 -0,04 BMIP1 66,58 5,00 99,00 34,58 -0,83 -0,95
Table 2. Basic statistical parameters of body height (BH2), body weight (BW2) and BMI (BMI2 – body mass index) and their percentile distribution (BHP2, BWP2 and BMIP2) at fifth grade pupils
variables mean min. max. SD skewness kurtosis BH2 145,00 133,50 158,00 6,47 -0,08 -0,53 BHP2 71,64 15,40 98,30 25,66 -0,89 -0,45 BW2 42,07 28,90 66,90 8,74 1,11 1,44 BWP2 76,28 12,70 99,70 22,20 -1,23 1,26 BMI2 19,95 15,20 30,10 3,26 1,01 2,32 BMIP2 73,38 18,40 99,20 26,16 -1,01 -0,42
Negative values of the skewness in body height (BH) and percentile distribution of body height (BHP), body weight (BWP) and BMI (BMIP), both in forth and in fifth grade, indicates that the results are moved to higher values, which can be validate from the percentile distribution of height, weight and BMI, too, which are around 67th percentile in IVth and around 70th percentile in Vth grade.
Table 3. T-test between body height (BH), body weight (BW) and body mass index (BMI) and their percentile distribution (BHP, BWP and BMIP) between forth mand fifth grade pupils
variables
mean IV odd.
SD IV odd.
mean V odd.
SD V odd.
T-test
Q
BH 138,58 6,31 145,00 6,47 -18,38 0,00 BHP 67,85 26,03 71,64 25,66 -2,82 0,01 BW 35,77 8,86 42,07 8,74 -12,93 0,00 BWP 67,65 27,53 76,28 22,20 -3,52 0,00 BMI 18,51 3,67 19,95 3,26 -5,31 0,00 BMIP 66,58 34,58 73,38 26,16 -2,41 0,02
Table 4. BMI (body mass index) and percentile distribution of BMI at forth and fifth grade pupils
N BMI
in IVth grade
BMI percentiles in
IVth grade
nutritional status in percentiles in IVth
grade
BMI in Vth grade
BMI percentiles
in Vth grade
nutritional status
in percentiles in Vth grade
+/- for the nutritional
status
1 22,34 97 obesity 23,7 96,6 obesity 2 21,43 95 overweight 20,8 85,3 overweight 3 23,32 98 obesity 21,8 92,6 overweight - 4 22,06 96 obesity 20,9 87,9 overweight - 5 16,84 64 normal 16,7 40,5 normal 6 13,95 6 underweight 16,1 23,9 normal + 7 21,05 94 overweight 21,0 88,5 overweight 8 16,57 66 normal 18,5 80,0 normal 9 17,04 74 normal 20,2 90,7 overweight +
10 21,11 96 obesity 21,5 91,5 overweight - 11 18,13 82 normal 19,3 79,1 normal 12 14,61 18 normal 17,4 61,0 normal 13 22,94 97 obesity 23,8 96,1 obesity 14 15,52 38 normal 17,6 55,2 normal 15 14,74 25 normal 17,1 56,0 normal 16 18,13 85 normal 20,4 90,8 overweight + 17 27,94 over 99 obesity 30,1 99,2 obesity 18 13,89 5 expressed
underweight 15,2 18,4 normal +
19 17,89 84 normal 22,1 96,2 obesity + 20 18,34 85 normal 20,6 88,1 overweight +
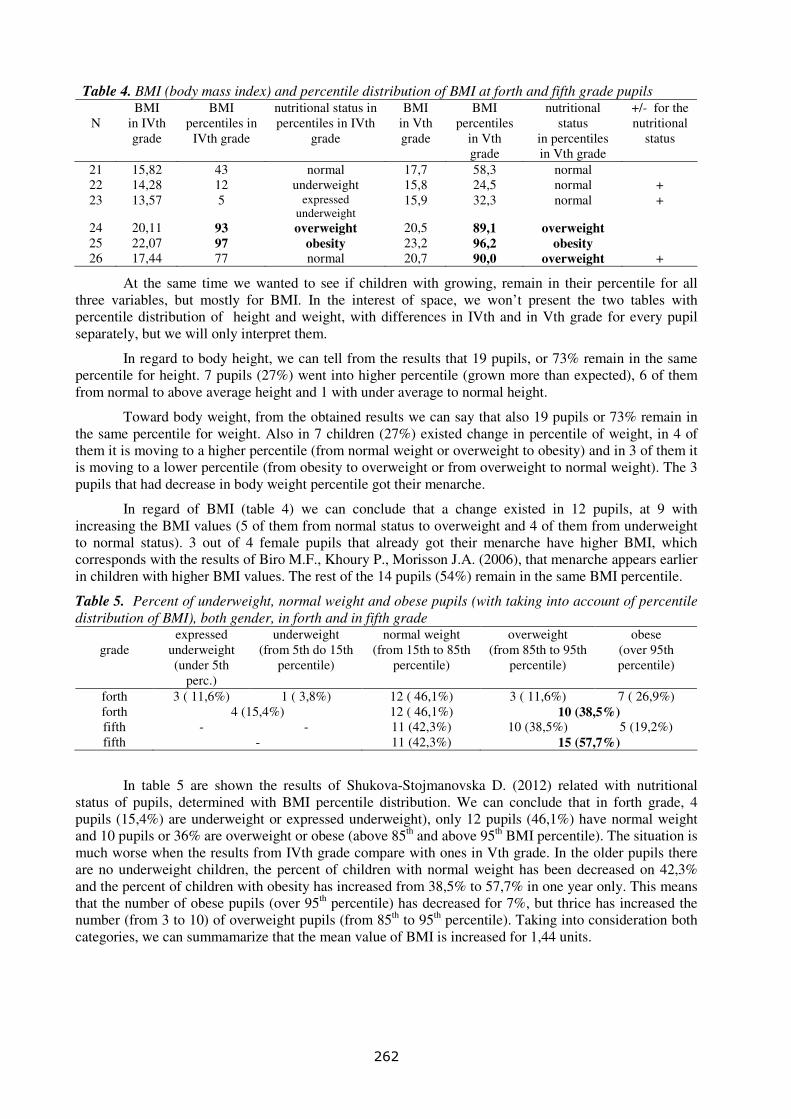
262
Table 4. BMI (body mass index) and percentile distribution of BMI at forth and fifth grade pupils
N BMI
in IVth grade
BMI percentiles in
IVth grade
nutritional status in percentiles in IVth
grade
BMI in Vth grade
BMI percentiles
in Vth grade
nutritional status
in percentiles in Vth grade
+/- for the nutritional
status
21 15,82 43 normal 17,7 58,3 normal 22 14,28 12 underweight 15,8 24,5 normal + 23 13,57 5 expressed
underweight 15,9 32,3 normal +
24 20,11 93 overweight 20,5 89,1 overweight 25 22,07 97 obesity 23,2 96,2 obesity 26 17,44 77 normal 20,7 90,0 overweight +
At the same time we wanted to see if children with growing, remain in their percentile for all three variables, but mostly for BMI. In the interest of space, we won’t present the two tables with percentile distribution of height and weight, with differences in IVth and in Vth grade for every pupil separately, but we will only interpret them.
In regard to body height, we can tell from the results that 19 pupils, or 73% remain in the same percentile for height. 7 pupils (27%) went into higher percentile (grown more than expected), 6 of them from normal to above average height and 1 with under average to normal height.
Toward body weight, from the obtained results we can say that also 19 pupils or 73% remain in the same percentile for weight. Also in 7 children (27%) existed change in percentile of weight, in 4 of them it is moving to a higher percentile (from normal weight or overweight to obesity) and in 3 of them it is moving to a lower percentile (from obesity to overweight or from overweight to normal weight). The 3 pupils that had decrease in body weight percentile got their menarche.
In regard of BMI (table 4) we can conclude that a change existed in 12 pupils, at 9 with increasing the BMI values (5 of them from normal status to overweight and 4 of them from underweight to normal status). 3 out of 4 female pupils that already got their menarche have higher BMI, which corresponds with the results of Biro M.F., Khoury P., Morisson J.A. (2006), that menarche appears earlier in children with higher BMI values. The rest of the 14 pupils (54%) remain in the same BMI percentile.
Table 5. Percent of underweight, normal weight and obese pupils (with taking into account of percentile distribution of BMI), both gender, in forth and in fifth grade
grade
expressed underweight (under 5th
perc.)
underweight (from 5th do 15th
percentile)
normal weight (from 15th to 85th
percentile)
overweight (from 85th to 95th
percentile)
obese (over 95th percentile)
forth 3 ( 11,6%) 1 ( 3,8%) 12 ( 46,1%) 3 ( 11,6%) 7 ( 26,9%) forth 4 (15,4%) 12 ( 46,1%) 10 (38,5%) fifth - - 11 (42,3%) 10 (38,5%) 5 (19,2%) fifth - 11 (42,3%) 15 (57,7%)
In table 5 are shown the results of Shukova-Stojmanovska D. (2012) related with nutritional status of pupils, determined with BMI percentile distribution. We can conclude that in forth grade, 4 pupils (15,4%) are underweight or expressed underweight), only 12 pupils (46,1%) have normal weight and 10 pupils or 36% are overweight or obese (above 85th and above 95th BMI percentile). The situation is much worse when the results from IVth grade compare with ones in Vth grade. In the older pupils there are no underweight children, the percent of children with normal weight has been decreased on 42,3% and the percent of children with obesity has increased from 38,5% to 57,7% in one year only. This means that the number of obese pupils (over 95th percentile) has decreased for 7%, but thrice has increased the number (from 3 to 10) of overweight pupils (from 85th to 95th percentile). Taking into consideration both categories, we can summamarize that the mean value of BMI is increased for 1,44 units.

263
Discussion
The percent of obese children obtained in this research (57,7%) is really much higher than the similar researches and same or similar population. According to the results of Baratta R., Degano C., Leonardi D., Vigneri R. and Frittitta L. (2006), in Sicillia, there were 40% obese children on the age of 11 and the percent decreased in 15 years old on 25%. In Denmark, this percent is drastically lower and according to the research of Matthiesen J., Velsing Groth M., Fagt S., Biltoft-Jensen A., Stockmarr A., Anderesen J.S. and Trolle E. (2008) there is an increase in the percent of obese children during the period from 1995 until 2000/2002, when the survey was repeated, from 10,9% to 14,4% obese children in all ages (4-6, 7-10, 11-14 and 15-18 years and both gender).
Bjornelv S., Lydersen S., Holmen J., Lund Nilsen T.I. and Holmen T.L. (2009) explore the presence of obesity with percentile distribution on pupils age 14 to 18. So their results show that in the period of 1996-1969 it was 10,7% (13% obese female and 8,5% male). In the period of 1995-1997 the percent of obese children increased on 17,2% (16,9% of the female and 17% at male), but there were no differences between gender (so the male become fatter). For the ones with values over 85th and 95th percentile, the value of BMI increased for 1,3 and 3 units at males, and 0,7 and 1,7 units at female.
Lissau I., Overpeck M.D., Ruan W.J., Due P., Holstein B.E. and Hediger M.L. (2004) explore the incidence of obesity with percentile distribution in USA and in many European countries - Austria, Czech Republic, Denmark, Flemish Belgium, Finland, France, Germany, Greece, Lithuania, Ireland, Israel, Portugal, Slovakia and Sweden. From their results they conclude that the most obese children (over 95th percentile of BMI) there are in the USA – 12,6% at 13 years and 13,9% at 15 years old male. There are 10,8% obese female children 13 years old and 15,1% in 15 years old female. At least obese children there were in Lithuania, only 5%. At 13 years old – 1,8% of the male and 2,6% of the female children, and at 15 years old – 0,8% of the male and 2,1% of the female pupils were obese. According to the Centers for Disease control and Prevention in the last 30 years children’s obesity has increased 3 times. So in 1980 there were only 7% obese children on age from 6 to 11 years. In 2008 this percent has increased on 20%. There is a similar situation with the adolescents, too, on age from 12 to 19 years. The percent of obese adolescents in the same period increased from 5% in 1980 to 18% in 2008. According to National center for health and National center of statistics 1/3 of the children and adolescents in USA are obese.
Chen L.J., Fox K.R., Haase A. and Wang J.M. (2006) explore the obesity incidence on a sample of 13935 pupils from Thailand, 6-18 years old in 1999, and again on a sample of 24586 in 2001. In 1999 there were 19,8% obese male and 15,2% obese female pupils. In 2001 there is an increase in male on 26,8% obese pupils and 16,5% obese female pupils.
At the end we can conclude that the increase of obese pupils from 36% to 57,7% in only one year, in our research is extremely high, and we recommend that it should be done much more with the education of the children and the parents, not only for the nutrition, but for the importance of physical activity, as well. In our country and in the neighborhood survies like this are rare. So we think that this research have to be repeated but on a bigger sample, different religion and in more municipalities.
References
1. Baratta R., Degano, C., Leonardi, D., Vigneri, R., & Frittitta, L. (2006). High prevalence of overweight and obesity in 11-15-year-old children from Sicily. Nutrition, metabolism and cardiovascular disease, 16(4), 249-55.
2. Biro, M.F., Khoury P., & Morisson, J.A. (2006). Influence of obesity on timing of puberty. International journal of andrology, 29, 272-277.
3. Bjornelv, S., Lydersen, S., Holmen, J., Lund Nilsen, T.I., & Holmen, T.L. (2009). Sex differences in time trends for overweight and obesity in adolescents: the Young-HUNT study. Scandinavian journal of public health, 37(8), 881-9.

264
4. CDC – Center for Disease Control (2011). National diabetes fact sheet: national estimates and general information on diabetes and prediabetes in the USA. Atlanta, GA: U.S. Department of Health and Human Services.
5. Chen, L.J., Fox, K.R., Haase, A., & Wang, J.M. (2006). Obesity, fitness and health in Taiwanese children and adolescents. European Journal of Clinical Nutrition, 60, 1367–1375. doi:10.1038/sj.ejcn.1602466; published online 14 June 2006.
6. Daniels, S.R., Arnett, D.K., & Eckel, R.H. (2005). Overweight in children and adolescents: pathophysiology, consequences, prevention, and treatment. Circulation; 111, 1999–2002.
7. Dietz, W.H. (2004). Overweight in childhood and adolescence. New England Journal of Medicine, 350, 855-857.
8. Freedman, D., Wang, J., & Thornton J.C. (2009). Classification of body fatness by body mass index-for-age categories among children. Archives of Pediatric and Adolescent Medicine, 163, 801–811.
9. Freedman, D.S., Kettel, L., Serdula, M.K., Dietz, W.H., Srinivasan, S.R., & Berenson G.S. (2005). The relation of childhood BMI to adult adiposity: the Bogalusa Heart Study. Pediatrics, 115, 22–27.
10. Freedman, D.S., Khan, L.K., Dietz, W.H., Srinivasan, S.A., & Berenson G.S. (2001). Relationship of childhood obesity to coronary heart disease risk factors in adulthood: the Bogalusa Heart Study. Pediatrics, 108, 712–718.
11. Freedman, D.S., Zuguo, M., Srinivasan, S.R., Berenson, G.S., & Dietz, W.H. (2007). Cardiovascular risk factors and excess adiposity among overweight children and adolescents: the Bogalusa Heart Study. Journal of Pediatrics, 150(1), 12–17.
12. Frisancho, A.R. (1990). Anthropometric standards for the assessment of growth and nutritional status. Ann Arbor. The Uiniversity of Michigan Press, 119-131.
13. Guo, S.S., & Chumlea, W.C. (1999). Tracking of body mass index in children in relation to overweight in adulthood. American Journal of Clinical Nutrition, 70, 145–148.
14. Krebs, N.F., Himes, J.H., Jacobson, D., Nicklas, T.A., Guilday, P., & Styne, D. (2007). Assessment of child and adolescent overweight and obesity. Pediatrics, 120, 193-228.
15. Kushi, L.H., Byers, T., Doyle, C., Bandera, E.V., McCullough, M., & Gansler, T. (2006). American Cancer Society guidelines on nutrition and physical activity for cancer prevention: reducing the risk of cancer with healthy food choices and physical activity. CA: A Cancer Journal for Clinicians, 56, 254–281.
16. Li, C., Ford, E.S., Zhao, G., & Mokdad, A.H. (2009). Prevalence of pre-diabetes and its association with clustering of cardio metabolic risk factors and hyperinsulinemia among US adolescents: NHANES 2005–2006. Diabetes Care, 32, 342–347.
17. Lissau, I., Overpeck, M.D., Ruan, W.J., Due, P., Holstein, B.E., & Hediger, M.L. (2004). Body mass index and overweight in adolescents in 13 European countries, Israel, and the United States. Archives of pediatrics and adolescent medicine, 158(1),27-33.
18. Matthiesen, J., Velsing Groth, M., Fagt, S., Biltoft-Jensen, A., Stockmarr, A., Anderesen, J.S., & Trolle, E. (2008). Prevalence and trends in overweight and obesity among children and adolescent in Denmark. Scandinavian Journal of Public Health, 36(2), 153-160.
19. National Center for Health Statistics. Health, United States (2011). With Special Features on Death and Dying. Hyattsville, MD; U.S. Department of Health and Human Services.
20. National Institutes of Health, National Heart, Lung, and Blood Institute (2010). Disease and Conditions Index: What are overweight and Obesity? Bethesda, MD: National Institutes of Health.
21. Office of the Surgeon General. (2010). The Surgeon General’s vision for a healthy and fit nation. Rockville, MD. U.S. Department of Health and Human Services.
22. Ogden, C.L., Carroll, M.D., Curtin, L.R., Lamb, M.M., & Flegal, K.M. (2010). Prevalence of high body mass index in US children and adolescents, 2007–2008. Journal of the American Medical Association, 303(3), 242–249.

265
23. Pavlović, M. (1992). Comparative analysis of incidence of obesity in school children in Subotica, with different criteria (Komparativna analiza kod dece školskog uzrasta u Subotici na osnovu različitih kriteriuma). International scientific meeting about obesity (abstract book). Zlatibor.
24. Shukova Stojmanovska, D. (1999). Modificated approach in selecting the female pupils toward different status of body mass. IV Symposia for sport and physical education in youth. Struga.
25. Shukova Stojmanovska, D. (2012). Percentile distribution of BMI at 9 year old children. Research in physical education, health and sport. Skopje.
26. Shukova-Stojmanovska D. (2009). Using modified BMI (BMI+3 and BMI+6) in selecting male pupils in elementary schools toward different status of body mass. Obesity facts- The European Journal of Obesity.
27. Todorovska, L. (1997). Anthropometric parameters for determine the nutritional status in children (Antropometriski parametri za odreduvanje na stepenot na ishranetost kaj deca ) (master’s thesis). Skopje: Medical faculty.

266
267
DIFFERENCES BETWEEN MOTOR ABILITIES OF GIRLS OF
YOUNGER SCHOOL AGE AND DIFFERENT
MORPHOLOGICAL STATUS
Boris Popović, Dejan Madić, Dušanka Tumin, Danilo Radanović and Valdemar Štajer Faculty of Sport and Physical Education, University of Novi Sad, Serbia
Abstract
The sample of 305 girls not engaged in an organized physical activity, at the age of 7-11, was tested by a battery of eight motor tests. According to decimal years, subjects were divided into four age groups ranging within one calendar year. Applying the procedure of cluster analysis, girls were classified in two groups within each age category based on anthropometric measures which evaluate quality of soft tissue of an organism. By means of multivariate analysis of variance, statistically significant quantitative differences between newly formed groups of girls were found in three out of four age groups at the strictest level statistical reasoning. Univariate analysis of variance indicated that the group of girls with better morphological status, which was represented by lower values of variables for assessment of voluminosity, body mass, and subcutaneous fat tissue, achieved better results in most motor abilities, especially those assessing energy regulation of movement and body coordination. Application of discriminant analysis showed that the analyzed groups of girls had significant qualitative differences in three out of four age groups, which was contributed most by variables for assessment of energy regulation of movement and body coordination. Results of this research indicate that the quality of motor status significantly affects the quality of motor abilities of girls at younger school age.
Keywords: motor abilities, motor status, girls, younger school age.
Introduction
Movement and motion significantly encourage integral development of a child. Majority of motor skills and habits are developed and acquired exclusively during the childhood, and the most important periods are preschool and younger school age. During that period the motor skills are being built based on genetic and external factors which influence the complete growth and development of children, more in qualitative than in quantitative sense. In terms of motor development, the disregarded skills at this age are often impossible to compensate later on. That period is adequate for learning and acquiring variety of motor abilities and encouraging motor behavior on the whole. Maturing itself does not provide complete realization of motor potential of children; it is necessary to have systematic and planned influence, i.e. practicing and being exposed to age appropriate motion experiences.
Physical activity is essential for healthy and balanced development of children and the youth. Growth of obesity among children has increased the interest in physical inactivity as a public health problem. Absence of insufficient evidence about increased energy consumption at the preschool age suggests that the usual physical activity has decreased and the physical inactivity has increased during the last couple of years. It is believed that physical inactivity plays essential role in children's obesity (ðorñić, 2006). Regular sports activity brings many benefits to physical and mental health, and therefore social functioning of children. It is known that physical activity contributes to forming and preserving bones, muscles and joints healthy, it helps controlling the body weight, reduces the fat tissue, and improves the cardiovascular and respiratory function. Systematic exercising presents a powerful stimulus for complete organism and all big organ systems, stimulating trophic processes and strengthening adaptive abilities of the organism.
Present day living environment harmfully influences the level of physical activity of the youth, conditioning its intense declining with age (Sallis, Prochaska & Taylor, 2000; Moore et al 2003; ðorñić, 2006. et al). Expansion of electronic media, starting with television, video games, computers, internet,

268
combined with consuming so called unhealthy food (munches, sweets, fizzy drinks), and other “benefits” of civilization (remote control, car transport, elevator, escalator etc.) conditioned a big number of children, starting with preschool and younger school age, to use their leisure time differently (more passively) outside the kindergarten and school. Instead of spontaneous, dynamic playing in their neighborhood, children are offered more passive indoor activities (foreign languages, music and art workshops etc.) which additionally passivise the youngest for whom it is vital to have physical activity. Time to play, spending time in nature and at the playgrounds, is not only significantly shortened, but also additionally limited for safety reasons, especially in the big cities. And the basis for the healthy lifestyle is formed, as many other important habits, values and attitudes, during the period of childhood and youth (ðorñić, 2006).
Physical education in our practice does not cause significant and desirable transformations in any anthropological dimensions. On the contrary, the practice has shown, as well as the everyday situations, that some abilities and characteristics of children and the youth are even deteriorating (e.g. motor abilities, postural status, increased anxiety, and decreased self-confidence) (Falkowski and ass., 2006; ðorñić, 2006; Madić, Mikalački and Popović, 2008; Madić, Popović and Kaličanin, 2009. et al).
Fat tissue is especially significant in energy balance regulation, fulfilling energy demands during exercising and various activities. Excess of fat tissue is stored in various depots, and it is evident in the form of subcutaneous fat tissue of the upper body (stomach, chest and back), arms (upper arms), and legs (upper legs and lower legs). Excess of fat tissue represents the ballast in physical activities. However, for children, this ballast (obesity) presents an obstacle to the motor development and creating motor habits. Obesity is also an obstacle to the whole balanced growth and development in all anthropological dimensions, and it can significantly influence the health status of children.
In that context, the authors had set a goal to examine whether a different quality of morphological status of the younger school age girls is conditioned exclusively by the healthier diet, determined by a smaller consumption of calories or by the increased expense of energy through daily but not organized physical activity, and whether it is a sufficient precondition for a higher quality of motor abilities of the examinees.
Method
The sample of examinees consisted of 305 girls, at the age of 7-11, not engaged in any organized physical activity, but attending the classes of physical education conducted by teachers in the lower grades of elementary schools. The research was conducted in almost all bigger cities in Vojvodina including Subotica, Sombor, Zrenjanin, Novi Sad, Sremska Mitrovica and Bačka Palanka.
According to decimal years, subjects were divided into four age groups. The first group consisted of girls aged 7.00 to 7.99 (N=78), the second one consisted of girls aged 8.00-8.99 (N=72), the third one consisted of girls aged 9.00-9.99 (N=73), and the last group consisted of girls aged 10.00-10.99 (N=82)
Considering the examinees of this research to be far from the relatively stationed phase of the growth and development (around 18 years old), in defining morphological status, there was a two-dimensional morphological model applied, where one factor merges longitudinal and transversal dimensionality of skeleton and it can be defined as a factor of “dimensionality of skeleton”, while the other one includes voluminosity and body mass and subcutaneous fat tissue, which determines soft tissues in children’s organism and can be defined as factor of “body volume and subcutaneous fat tissue” (Bala, 1980; Madić, Mikalački, Popović, 2008; Popović, 2010; Popović and Radanović, 2010; Popović, Madić, Tumin and Jezdimirović, 2012). Since the anthropometric measures for assessment of dimensionality of skeleton are mainly genetically disposed and it is difficult to influence their transformation by the means of physical activity, the authors have decided to measure the anthropometric measures for assessment of voluminosity and body mass, as well as the subcutaneous fat tissue which can be influenced and changed to a greater extent.
The sample of anthropometric measures was the following:
- for assessment of voluminosity and balance body mass - 1) body mass, 2) circumference of chest (chest girth)(medium), 3) circumference of upper arm (midarm girth)(in a relaxed position), 4) circumference of the lower arm (forearm girth);

269
- for assessment of subcutaneous fat tissue – 5) abdominal skin fold, 6) skin fold of the back (subscapular skin fold) and 7) skin fold on the upper arm (triceps skin fold).
Motor behavior of younger age children, as well as their motor abilities is, as considered, of general character, but yet for manifesting abilities of performing motor activities the terms which are used are justifiably given to motor abilities of older age children and adults. Therefore, the sample of motor tests in this study was conducted on the basis of the motor abilities model with older children and the youth, which had been applied in various studies of different authors on the sample of preschool and younger school age children (Bala, Popović and Stupar, 2002., Madić, Mikalački and Popović, 2008; Popović, 2010; Popović, Madić, Tumin and Jezdimirović, 2012 et al.).
Therefore the sample of motor tests was following:
- for coordination assessment: 1) Obstacle course backwards 2) Slalom with three balls;
- for movement frequency assessment: 3) Arm plate tapping;
- for flexibility assessment :4) Deep forward bend while seated straddled;
- for assessment of explosive strength 5) Standing broad jump 6) 20 meter dash;
- for assessment of repetitive strength of abdomen 7) Sit-ups lying on the back;
- for assessment of statistical strength of arms and shoulders 8) Bent arm hang.
For each motor variable and for each age group, there were basic central and disperse parameters calculated: arithmetic mean (AM) and standard deviation (S). Determining two qualitatively different taxons of examinees in relation to morphological status defined by variables for assessment of soft tissue, for each age group, they were obtained by applying cluster “K-means” analysis. By means of multivariate analysis of variance (MANOVA), quantitative significance of differences was determined between the girls of different morphological status quality of appropriate age in motor space of applied variables, while the difference of arithmetic means in each motor variable in relation to age groups of examinees was tested by the univariate analysis of variance (ANOVA). Application of Canonic discriminant analysis showed the qualitative differences between the groups of girls in motoric space for each age group. The level of statistical reasoning was defined at the level of significance from p= 0,05.
Results
By means of cluster “K-means” analysis the girls were, for each age group separately, classified into two groups which were significantly statistically different (p=0,00) in the quality of morphological status determined by variables for assessment of soft tissue. Accordingly, two groups of girls were formed; the first one had statistically much better quality of morphological status represented by the smaller values of all variables for assessment of both voluminosity and body mass, and variables for assessment of subcutaneous fat tissue. Two newly formed groups of girls are further in the text called the group of thinner girls (cluster 1) and the group of overweight girls (cluster 2).
Table 1. Results of Cluster Analysis of Anthropometric Measures of Girls Aged 7-8
ANTHROPOMETRIC MEASURES Group 1 (thinner)
Group 2 (overweight)
f p
1. Body mass (0,1kg) 242 299 67,77 0,00
2. Circumference of chest (mm) 572 612 49,66 0,00
3. Circumference of upper arm (mm) 199 228 59,74 0,00
4. Circumference of lower arm (mm) 182 200 76,28 0,00
5. Abdominal skin fold (0,2mm) 72 142 92,64 0,00
6. Skin fold of back (0,2mm) 62 99 77,39 0,00
7. Skin fold of upper arm (0,2mm) 91 145 94,43 0,00
Group 1 – group of girls who had better quality of morphological status - thinner Group 2 – group of girls who had worse quality of morphological status - overweight f – f-test for univariate analysis of variance p – level of statistical significance for f

270
By applying the multivariate analysis of variance (MANOVA) there have been established statistically significant differences of the whole system of motor variables between the examined groups at the strictest level statistical concluding (P=0,01).
Table 2. Analysis of Differences of Motor Variables in Two Groups of Girls Aged 7-8 VARIABLE Gr AM S f p
1 48,87 4,39 1. 20 m dash 2 49,65 4,57
0,49 0,48
1 277,46 78,58 2. Obstacle course backwards 2 267,69 80,03
0,25 0,62
1 18,09 2,52 3. Arm plate tapping 2 17,91 2,81
0,08 0,78
1 46,42 7,34 4. Deep forward bend while seated straddled 2 44,40 6,13
1,36 0,25
1 121,13 17,66 5. Standing broad jump
2 110,39 16,92 6,14 0,01
1 159,11 88,44 6. Bent-arm hang
2 99,01 67,57 8,52 0,01
1 26,15 7,39 7. Sit-ups 2 27,44 5,12
0,58 0,45
1 695,17 140,21 8. Slalom with three balls 2 663,80 117,15
1,16 0,28
F = 3,34 P = 0,01
Gr – groups of examinees: 1) thinner 2) overweight
f – f-test for univariate analysis of variance
AM – arithmetic mean p – level of statistical significance for f S – standard deviation F –F-test for multivariate analysis of variance P – level of statistical significance for F
The results of the univariate analysis of variance (ANOVA), with the aim to determine the differences between every single variable for assessment of motor status, clearly indicate that the examinees are considerably statistically different only in variables for assessment of static strength of arms and shoulders “bent-arm hang” as well as explosive strength of lower limbs, “standing broad jump” at the strictest level statistical reasoning p=0,01.
By analyzing the structure of discriminant function and centroids of groups created by canonic discriminant analysis, it is noticed that the analyzed groups of girls aged 7-8 are also qualitatively different in motor space at the level of statistical significance of p=0,01. The main reasons for these differences were the variables for assessment of static strength of arms and shoulders, as well as the explosive strength of the lower limbs. The rest of the variables contribute to discriminating two groups of examinees in motor space in much smaller amount.
Table 3. Results of Canonic Discriminant Analysis of Motor Variables Between Two Groups of Examinees Aged 7-8
VARIABLE DF
Bent-arm hang 0,58
Standing broad jump 0,49
Deep forward bend while seated straddled 0,23
Slalom with three balls 0,21
Sit-ups -0,15
20 m dash -0,14
Obstacle course backwards 0,10
Arm plate tapping 0,06
λ 0,75
CAN 0,50
χ2 20,86
p 0,01

271
Group centroids
1. Thinner girls 0,37
2. Overweight girls -0,88
DF – structure of discriminant function χ2 – hi-square distribution λ – Willks’ lambda p–the level of statistical significance CAN – coefficient of canonic correlation hi-square distribution
Based on the sign of the canonic discriminant analysis of the variables for motor abilities assessment, noticeably better results were shown in the following motor tests between the girls who had a better quality of morphological status: 20 m dash, arm plate tapping, deep forward bend while seated straddled, standing broad jump and bent-arm hang. It is interesting to notice that the thinner girls performed poorer in the tests for assessment of coordination and even more interesting they did the sit-ups in 60 seconds, which was certainly not to be expected considering the ballast mass that obese girls have and which should significantly prevent the successful performance of all motor tests.
Due to the large number of applied analyses, tables, as well as the four groups of examinees, in the further text the results are shown textually for all other age groups of girls.
After clustering the examinees aged 8-9 into two sub-samples, the multivariate analysis of variance was applied as well as the canonic discriminant analysis where it was noticed that there are no statistically significant nor quantitative or qualitative differences between the two groups of girls (P=0,23). Considering the table of central and descriptive parameters there were noticed slightly better results in all motor variables in favor of thinner girls but apparently not enough to be statistically significant.
Differences of the whole system of motor variables between the groups of girls of the two oldest age groups showed statistical significance and at the strictest level statistical reasoning of P=0,00 (F=4,33 aged 9-10, and F=5,49 aged 10-11). By analyzing quantitative and qualitative differences in each motor variable between groups of girls, there was a similar tendency as in the youngest age group. This difference is mainly contributed by the variable for assessment of static strength of arms and shoulders “bent-arm hang” and the variable for the assessment of explosive strength of the lower limbs “standing broad jump”. The only exception is statistically better result in the test for assessing the coordination of the entire body, that is, the reorganization of movement stereotypes, “obstacle course backwards” in favor of girls with better morphological status in the oldest age group. By inspecting the arithmetic means of the other motor tests in both age groups of examinees, better results are noticed in all the tests in favor of thinner girls but these differences are not statistically significant.
Discussion
The results of statistical procedures for assessment of quantitative and qualitative differences between the two sub-samples of girls discriminated by the quality of the morphological status showed that the examinees differ significantly in three out of four age groups in favor of girls with better morphological status quality (of thinner girls). In all three age groups what contributed most to the difference were the variables for assessment of different aspects of strength and static strength of arms and shoulders as well as the explosive power of the lower limbs. All other assessed motor variables in a much lower extent discriminated the two groups of examinees.
If the nature of those two tests is analyzed it can be clearly concluded that for their successful performing, except for sufficient strength amount of appropriate muscle groups, it is necessary to have the low body mass as a naturally aggravating factor in overcoming the force of gravity which is pulling the body to the surface of the earth. In fact, in all other assessed motor tests, the body of the examined girls was mainly in contact with the ground except when performing some movements like 20 m dash or performing a sit-ups. This means that the thinner girls are not much more successful in passing the tests for the evaluation of static and explosive strength due to the well-developed muscles and they also had significantly less ballast in the form of subcutaneous fat tissue and thus were more effectively confronting the efforts and gravity which was pulling them to the surface and striving to keep them on the ground.

272
It was expected that the girls with better morphological status would do the tests for assessing coordination and speed of movement significantly more successful due to less ballast mass and weight in general especially during the performance of test for assessment of repetitive strength of body. However, this difference was absent in all age groups, with the exception of the oldest one which showed a significant difference in the test “obstacle course backwards” in the favor of thinner girls. In this way it was shown that motor skills of thinner girls are not at a much higher level than their peers since it was obvious that they had better results in all the tests, but they were not statistically significant. The remaining two tests for assessment of speed of alternative movements “arm plate tapping” and the test for assessment of flexibility “deep forward bend while seated straddled”, as expected, did not show statistically significant differences in any age group because the strength is not necessary for its performance, and also the weight excess and increased amount of fat with obese girls does not disturb their successful performance.
The results of this study indicate that, in general, just having a healthier diet, determined by smaller amount of calories or increased daily energy consumption, but not the organized physical activity, which was the basis for forming the two groups of examinees, is not sufficient for significantly better developed motor abilities of younger age school girls. This also confirms the statements of the other authors that biological maturing itself is not enough, but it is necessary to have planned and directed environmental influences in terms of creating opportunities for moving, adopting and practicing the motion skills. Encouraging, organized learning and applying of motion skills create a favorable environment for development of motor potential which practically allows doing sports and recreation as the basis for a healthy lifestyle (Gallahue and Ozmun, 1998, Moore et al, 2003; ðorñić, 2006; Madić, Mikalački and Popović 2008¸ Madić, Popović and Kaličanin, 2009; Madić, Popović and Tumin, 2009; Menez, Dantas and Filh, 2009; et al).
If we want optimal development of children with all irreplaceable developmental and health benefits, if we want to create a good foundation for later inclusion in the corresponding sports clubs, to practice sports and recreational activities, and generally to have a life with improved capabilities and anthropological abilities (which are necessary later at school, faculty, work and in daily life), it is particularly important to provide children with every day, high-quality and well-designed physical activity.
References
1. Bala, G. (1980). Struktura i razvoj morfoloških i motoričkih dimenzija dece SAP Vojvodine. Novi Sad: Fakultet fizičke kulture.
2. Bala, G., Popović, B. i Stupar, D. (2002). Pouzdanost nekih kompozitnih testova za procenu motoričkog ponašanja predškolske dece [Reliability of some composite tests for evaluation of pre-school childrens motor behaviour]. Deseti meñunarodni simpozijum "Sport, fizička aktivnost i zdravlje mladih", Zbornik radova, 418-425. Novi Sad: Univerzitet u Novom Sadu, Novosadski maraton. 10. meñunarodni simpozijum "Sport, fizička aktivnost i zdravlje mladih", Novi Sad.
3. ðorñić, V. (2006). Fizička aktivnost dece predškolskog uzrasta. U: G. Bala (Ur.): Fizička aktivnost devojčica i dečaka predškolskog uzrasta (59-74). Novi Sad: Fakultet fizičke kulture.
4. Falkowski, G. & ass. (2006). Four Years of Universal Prevention in Primary Schools -Effects on BMI and Motor Abilities in Childhood. Medicine & Science in Sports & Exercise, 39 (5), S475.
5. Gallahue, D. L. and Ozmun, J. C. (1998). Understanding motor development. (fourth edition). McGraw-Hill.
6. Madić, D., Mikalački, M. and Popović, B. (2008). Effects of the traditional and modern aproach to physical education on obesity of girls at younger school age. International symposium research and education in innovation era. (p. 577-582). Arad: University „Aurel Vlaicu“.
7. Moore, L.L. et al. (2003). Does early physical activity predict body fat change throughout childhood? Preventive Medicine, 37, 10–17.

273
8. Popović, B. (2008). Trend razvoja antropometrijskih karakteristika dece 4-11 godina. [Development trend of anthropometric characteristics of 4-11 years old children]. Glasnik Antropološkog društva Srbije, sv.43, 455-465, Novi Sad.
9. Popović, B. (2010). Razlike u relacijama morfoloških karakteristika i relativne snage ruku kod ispitanica različitog nivoa fizičkog angažovanja. [Differences between relations of morphological characteristics and relative strenght of arms in female subjects of different levels of physical engagement]. Glasnik Antropološkog društva Srbije, sv 45, 253-264. Novi Sad.
10. Popović, B. i Radanović, D. (2010). Relacije morfoloških karakteristika i koordinacije kod devojčica koje se bave gimnastičkim aktivnostima. [Relations of morphological characteristics and coordination in female subjects included in gymnastic activities]. Glasnik Antropološkog društva Srbije, sv 45, 243-252. Novi Sad.
11. Popović, B., Madić, D., Tumin, D. i Jezdimirović. (2012). Razlike izmeñu devojčica mlañeg školskog uzrasta u intelektualnom funkcionisanju. [Differences in intellectual funcioning between girls at younger school age]. Zbornik radova sa Meñunarodne naučne konferencije crnogorske sportske akademije, 34, 35, 36/X, (str. 39-46). Podgorica.
12. Sallis JF, Prochaska JJ, Taylor WC. A review of correlates of physical activity of children and adolescents. Med Sci Sports Exerc 2000;32:963-75.

274

275
CHARACTERISTICS OF MOTOR DEVELOPMENT IN FEMALE
FIFTH GRADE STUDENTS PARTICIPATING IN ADDITIONAL
PROGRAMS OF JUDO AND TRACK AND FIELD
Petra ðapić Caput1, Saša Krstulović2 and Frane Žuvela2 1 Judo klub “Dubrovnik”, Dubrovnik, Croatia
2 Faculty of Kinesiology, University of Zagreb, Croatia
Abstract
The study was conducted on a sample of 70 girls, aged 11 (±6 months), fifth grade students of elementary school who, in addition to regular physical education classes, practiced judo and track and field during a nine month period. A subsample of 35 subjects, besides regular physical education classes, practiced judo for 45 minutes once a week, while another subsample of 35 subjects, besides regular physical education classes, practiced track and field in the same extent. Twelve measuring instruments were used for assessing basic motor abilities. There were no statistically significant differences found by canonical discriminant analysis between the groups in the initial testing. By analyzing the final measurement, significant differences were found between the two groups in the space of motor abilities. Significant differences between the analyzed groups in the final measurement primarily generated variables for assessing: explosive leg power, coordination, flexibility, repetitive strength and agility. Subjects in the experimental judo group were superior in variables standing long jump (MSDM), seated straddle reach (MPRR), inlocate (MISK) and arm plate tapping (MTAP); while the experimental track and field group had better results in the crossed-arms sit-ups variable (MDTR).
Keywords: girls, kinesiological treatment, anthropological characteristics.
Introduction
A primary objective of any kinesiological treatment is to transform the dimensions of anthropological status, and planning, programming and controlling kinesiological activities is a very demanding and responsible task. Physical activity is considered to be one of the most important life style factors, affecting health improvement, body composition, musculoskeletal system (Stenevi-Lundgren et al. 2009), and contributing to physical and mental child development (Denker & Andersen 2008, Ortega et al. 2008). A kinanthropological guideline of educational work in the area of physical education implies a systematic and continuous transformation, primarily of morphological, motor and functional characteristics of students (Neljak 2011). At the beginning of every school year teachers identify the initial status of each student, thus creating an important set of information to be used in designing the curriculum of the immediate classroom teaching (Milić et al. 2012). Within the physical education curriculum, physical education teachers can, based on their knowledge, contribute to the development of abilities of each student, i.e. create all preconditions necessary for efficient planning and implementing the transformational processes, in accordance with the demands and specificities of particular developmental age period. Methodology of physical education puts special emphasis on structuring quality program contents in order to achieve all goals and objectives, while innovations and supplements of existing programs contribute the improvement of physical education, in spite of the quantitative limitations of education classes.
In current paper, the analysis was performed on a sample of girls aged 11, which is, from the anthropological point of view, a very turbulent age. If the genetic factors are excluded, which cannot be influenced, there are a number of influential elements such as nutrition, socioeconomic status and physical activity, which can be used to influence the growth and development in children of this age.

276
From the kinesiological point of view, physical activity is the most interesting parameter. This is primarily due to the fact that physical activity is relatively easy to influence, but also because its contribution to growth and development is significant and of great value (Malina R. M., C. Bouchard 1991). Previous findings indicate that during young school age period motor abilities can be greatly influenced (Katić 1995, Katić et al. 2002, Krstulović 2004., Selmanović 2007., Delija et al.2005). Proper dosage of physical exercise and a properly designed kinesiological treatment provide an effective stimulus oriented towards the desired changes in the anthropological status of children (Žuvela 2005).
The aim of this study was to determine the effect of practicing judo or track and field across a nine-month period on some motor abilities of eleven-year-old girls.
Method
The subject sample included 70 girls, aged 11 (+/- 0.5), fifth grade students of elementary school. A subsample of 35 subjects, besides regular physical education classes (2 x 45 minutes), had an additional class of track and field once a week, while another subsample of 35 subjects, besides regular physical education classes, was kinesiologically engaged in an additional class of judo once a week. The only criterion for student selection was for students to be clinically healthy and not participate in any other extracurricular physical activities. The variable sample was defined by a set of 12 motor measuring instruments: standing long jump (MSD) for assessing horizontal jumping explosive power, 20 m dash from standing position (M20V) for assessing sprinting explosive power, supine medicine ball throw (MBML) for assessing explosive power of the upper extremities, crossed-arms sit-ups (MPT) for assessing repetitive strength, bent arm hang (MIV) for assessing static strength, “20 yards” test (M20J) for assessing agility, obstacle course backwards (MPN) for assessing coordination, standing on one leg lengthwise on a bench with eyes open (MBAU10) for assessing balance, forward bend on the bench (MPRK) and seated straddle reach (MPRR) for assessing flexibility of the trunk, inlocate (MISK) for assessing flexibility of the arms and shoulders, and arm plate tapping (MTR) for assessing movement frequency.
Methods of data analysis included calculating the descriptive statistical parameters: mean (M) and standard deviation (SD). Canonical discriminant analysis was used to determine the differences between the groups in the initial and final measurement, calculating: the structure of discriminant function (DF), group centroids and the coefficient of canonical discrimination (CanR).
Results
Table 1. Results of discriminant analysis between the experimental judo group and the experimental track and field group in motor variables in the initial and final measurement
M–mean, SD-standard deviation, F structure of discriminant function, CanR = coefficient of canonical discrimination; bp<0.01; #inverse scaling
variables
INITIAL MEASUREMENT FINAL MEASUREMENT Groups E-J E-TF F E-J E-TF F
Variables M SD M SD M SD M SD MSDM 141,11 13,69 142,63 19,39 0,08 158,69 25,38 151,03 22,31 0,21 M20V# 4,45 0,58 4,53 0,39 0,13 4,27 0,31 4,19 0,36 0,16 MBML 4,73 1,01 5,14 0,78 0,40 6,00 1,24 5,74 0,99 0,15 MDTR 26,09 5,44 25,09 7,76 -0,13 30,71 7,17 36,00 9,51 -0,43 MIVZ 18,81 11,65 24,68 14,80 0,39 29,93 15,37 28,28 20,33 0,06 M20J# 6,86 0,74 6,84 0,51 -0,03 6,26 0,67 6,37 0,59 -0,12
MPOL# 22,35 6,03 20,27 6,66 -0,29 16,80 4,24 16,81 3,97 0,00 MBAU 8,80 8,13 7,26 4,20 -0,21 10,28 8,84 10,20 5,22 0,01 MPRK 27.74 5,10 28,80 4,04 0,20 32,03 5,47 32.69 3,52 -0,09 MPRR 51,11 9,93 50,17 5,85 -0,10 67,16 13,70 63,29 7,88 0,23 MISK# 75,53 12,89 72,71 5,40 -0,25 62,43 10,29 68,69 7,53 -0,46 MTAP 25,46 1,01 24,14 4,06 -0,39 27,09 1,98 25,60 2,86 0,40
Centroids -0,57 0,57 0,75 -0,75 Can R 0,50 0,61 b

277
It is evident in Table 1 that the result values in all variables have increased in the final measurement (inverse scaling variables have slightly lower values), and the increase is caused by growth and development, as well as by the programmed judo, i.e. track and field treatment in both groups. By testing the significance of differences of group centroids in space of motor variables (CanR=0.50, with the significance level of p>0.05) in the initial testing of motor abilities, there were no differences found between the two groups of subjects. By examining the results in Table 1, statistically significant differences were established in the final measurement between the two groups at the significance level of p<0.01.
By comparing the aforementioned groups of subjects in the final measurement, quantitative indicators of differences indicate the formation of significant discriminant function (CanR=0.61, with the significance level of p <0.01).
Discussion
The position of group centroids defines the experimental judo group as a group with significantly better results in the final measurement in standing long jump (MSDM), seated straddle reach (MPRR), inlocate (MISK) and arm plate tapping (MTAP); while the experimental track and field group had better results in the crossed-arms sit-ups variable (MDTR). There are probably a number of reasons why these particular variables generated significant differences in favor of the E-J group, and they can be summarized to the following: seated straddle stretch MPRR and inlocate MISK variables measure flexibility, which is under a relatively small influence of the genetic factor, and is therefore relatively easily influenced by optimally dosed kinesiological operators (Bompa, O. Tudor., 2000). Through partial observation, it can be noticed that the girls of the E-J group were significantly better than the girls in the E-TF group in the arm plate tapping test even in the initial measurement, and therefore the differences in the final measurement cannot be attributed to the judo treatment. The girls of the E-TF group were expected to achieve greater improvement in the MSDM test for assessing explosive power in relation to the E-J group. However, by examining the syllabuses, it can be noticed that the track and field group had a larger number of thematic units, while the judo group had a somewhat smaller number of units, but a greater frequency, i.e. repetition of units. Therefore, it is assumed that the judo treatment generally had a greater effect on girls’ energetic-motor potential, while the track and field treatment had a greater effect on the information component, i.e. acquisition of a larger number of motor skills in girls. However, significantly better results in the test assessing repetitive strength are found in E-TF group, which can be attributed to program contents of the track and field treatment and which are related to the abdominal muscle development. Thus, it can be concluded that the judo program caused more significant changes in motor abilities in comparison to the track and field program. This study points to the necessity of increasing the number of physical education classes and creating quality kinesiological operators which would have an optimum effect on harmonious development of the somatic status and motor abilities of students, and by doing so, help physical education teachers in designing the curriculum. Valorization of the effects of additional programs could in future research also contribute to the evaluation of effects of particular contents, i.e. thematic units of these programs, because it is very important to establish the transformational value of each thematic unit in order to ensure greater precision in the selection of teaching contents during the limited period of exercise in regular physical education classes.
References
1. Bompa, O. T. (2000). Total Training for Young Champions. Human Kinetics.
2. Delija, K., Jelenić, A., & Breslauer, N. (2005). Analysis of differences between female subjects involved in different kinesiological activities, Proceedings of 15th Summer kinesiologists` school of the Republic of Croatia, Rovinj. Zagreb: Croatian Kinesiological Federation.
3. Denker, M., & Andersen, L.B. (2008). Health-related aspects of objectively measured daily physical activity in children. Journal of Sports Medicine, 28, 133-144.
4. Katić, R. (1995). Motor efficacy of athletic training applied to seven year old schoolgirls in teaching physical education. Biology of sport, 12(4), 251-256.

278
5. Katić, R., Maleš, B., & Miletić, ð. (2002.). Effect of 6-Month Athletic Training on Motor Abilities in Seven Year Old Girls. Collegium Antropologicum, 26(2), 533-538.
6. Krstulović, S. (2004). Influence of judo treatment on changes of some anthropological characteristics on seven years old boys and girls, Master thesis. Zagreb: Faculty of Kinesiology, University of Zagreb.
7. Malina, R., & Bouchard, C. (1991). Growth, maturation and physical activity. Human Kinetics Books. Champaign, Illinois.
8. Milić, M., Grgantov, Z., & Katić R. (in press.). Biomotor status and kinesiological education of girls aged 10 to 12 years – example: volleyball. Collegium Antropologicum.
9. Neljak, B. (2011). Basics of kinesiological methodology in primary and secondary school. Zagreb: Faculty of Kinesiology.
10. Ortega, F.B., Ruiz, J.R., Castillo, M.J., & Sjostrom, M. (2008). Physical fitness in childhood and adolescence: a powerful marker of health. International Journal of Obesity, 32, 1-11.
11. Selmanović, S. (2007). Influence of the additional basketball and volleyball program on changes in morphological and motor characteristics of fifth grade students, Master thesis. Zagreb: Faculty of Kinesiology, University of Zagreb.
12. Stenevi-Lundgren, S., Daly, R.M., Lindén, C., Gärdsell, P., Karlsson, M.K. (2009). Effects of a daily school based physical activity intervention program on muscle development in prepubertal girls. European Journal of Applied Physiology,105(4), 533–541.
13. Žuvela, F. (2005). Morphological and motor characteristics of seven-year-old boys participating in additional 9-month athletics program, Master thesis. Zagreb: Faculty of Kinesiology, University of Zagreb.

279
DIFFERENCES IN MOTOR ABILITIES BETWEEN FEMALE
ADOLESCENTS, ATHLETES AND NON-ATHLETES IN THE
MUNICIPALITY OF LEBANE
Bojan Mitrović and Ratomir ðurašković
Faculty of Sports and Physical Education, University of Niš, Serbia
Abstract
Physical education in schools is inadequately represented by the number of classes in the curriculum, which is a major problem in the implementation of the planned program. For this reason, schools have an increasing number of students engaged in sport. The aim of the research was to determine the differences between the motoric abilities of female adolescents engaged in sport and those who are not. The sample of 45 female students from the first and second grade of high school from Lebane, aged 14 - 16, was divided into two sub-samples (15 athletes and 30 non-athletes), and used to measure 8 variables of motoric abilities from „Eurofit“ battery tests. The results of this research indicate that statistically significant differences were determinated in favor of group of female athletes in the following tests: standing long jump (JUMP) (p = 0.013), sit ups in 30 seconds (SU30) (p = 0.002) and pin running 10x5m (10x5m) (p = 0.002). Finally, it can be concluded that differences were identified because a group of female adolescents-athletes were in the training process.
Keywords: female adolescents, athletes, non-athletes, motoric abilities
Introduction
Physical education represents the main component of quality education and it is an important part in life-long learning. Neglecting the physical education decreases the quality of education and has negative consequences for public health and health status in the future. Physical education provides students knowledge, skils and understanding needed to perform various physical activities, maintain physical shape, evaluate physical acitivity as a segment of active life-style, as well as enjoy in physical activities (Hardman, 2007).
The level of motoric abilities, as well as the female adolescents is directly related to the effects of physical activity (sports branches and disciplines that are involved in the teaching of physical education). Insight in the level of students’ motoric abilities helps the teacher to develop the planning of physical education, choice of suitable methods and organizational methods of work and the most important, the selection of adequate physical drills based on which goals are set and tasks of physical education are realized. Assists in the selection of coaches for the sports branches, a place in the team and homogenization of groups in the training process.
Motoric abilities of adolescents in this age group are the result of the interrelationship between genetic factors, principles of growth and development, and their adaptation to the type and intensity of physical exercise. For each motoric ability there is specific sensitive period in which the highest development is achieved. Individual differences in dynamic of growth are an important source of variability in shape, functions and capabilities of the human body. Mišigoj-Duraković (2008) indicates a turbulent and complex phenomenon of growth and development as a regular process in which we can define a series of laws in which the level of individual development shows a special interest, having in mind the requirements that physical activity sets to a body. Today, in era of computers, cell-phones and cars, we are witnesses of adolescents’ deacresed interests in physical acitivity and sports involvement in everyday life (Ministry of Education, Science and Technological Development of Republic of Serbia,

280
2008; Kikinda’s Newspapers, 2012). According to Rowland (1999), period of adolescence is recognized as a risk factor for physical inacivity, especially among girls. As a result of above mentioned, there is a threat to the normal development of motor abilities and locomotor system.
In recent years there has been increased interest in the involvement of children and adolescents in sport activites, because the process of growing up, according to some researchers, is particularly sensitive to the possibility of expressing negative effects (Aoron et al., 1995; Drabik, 1996; Marcus et al., 2000).
In most sports, one of the most important factors of success is the high level of motoric, functional and range of non-listed abilities of an athlete, with appropriate training process and his good physical preparation. The physical preparation, includes working on improving basic motor abilities because they are necessary for achievement of a good sport performance.
Zaciorski (1995) explains that encouraging the development of particular antropomotoric characteristics shouldn’t be applied isolated from development of other characteristics, as the expression of one characteristic is caused to some extent by level of development of other characteristics, so-called versatility. ðurašković (2009) emphasizes that in the period of adolescence is very important to apply versatility in terms of several sports branches, as a supplement to the narrow specialization and monotony in the training process. Having in mind that in early adolescence, is possible to successfully solve elements of sports techniques and puberty renewal learned, adolescents are effectively learning the elements of sports technique, it is necessary to intensify work on it. First of all, you need to start with a systematic training in those disciplines that dominate the speed, flexibility and agility, and then with strength and endurance. In practice, it is necessary to adopt a rule that as earlier is started with a specialization in sport, the more time must be devoted to additional exercises and training with the goal of harmonious development. On the other hand, the less likely is that adolescents who are not engaged in sports will reach a high level of motoric abilities because of insufficient number of classes for the larger motor development and gaining shape as their physical activity is limited to classes of physical education. There are significant differences noticed in certain motoric abilities in period of adolescence in favor of those who participate in sports, compared to those who are not engaged in sports, which are indicated in researches of numerous authors (Batričević, 2008; Bolanča, Čavala, & Rogulj, 2010; Oxyzoglou, & Oxyzoglou, 2011; Bajrić, Bajrić, & Jovanović, 2011).
The problem of this research was to examine whether there are significant differences in motoric abilities of female adolescents who are engaged in sports and those that are not involved.
Method
The sample of this research was consisted of 45 female adolescents, students of first and second grade of high school in Lebane, aged from 14 to 16 years, divided in two sub-samples, namely: 15 athletes (average age 15,45 ±0,61 years, body weight 55,79 ±5,63 kg, body height 163,68 ±6,50 cm and the value of body mass index BMI 20,87 ±2,04) and 30 non-atheletes (average age 15.16 ±0.70 years, body weight 56,10 ±7.66 kg, body height 164.60 ±5.12 cm and BMI 20.72 ±2.78). The value of body mass index (BMI), as the measure of participants' nourishment according to World Health Organization (1997), is calculated by the formula: BMI=ABM (kg) /ABH² (m²), where ABM presents body weight and ABH presents body height.
Measurements were done during the regular classes of physical education in the high school gymnasium in Lebane. The members of the first group, in addition to regular classes of physical education, were engaged in sports, while the other group members were not engaged in any sport. Therefore, they were only involved in regular classes of physical education two times a week according to curriculum which is determined by the Ministry of Education, Science and Technological Development of the Republic of Serbia. The group of athletes play sports in average 14.5 months, and of those 15, 9 students practice volleyball, 3 girls handball, 2 girls athletics, while karate practice only one student. Condition that students be in the group of athletes was that a minimum three times a week to practice and compete in the age group selected sports.
Motor abilities were examined using „Eurofit“ battery of motor tests (Council of Europe, Committee for the Development of Sport, 1988; Kukolj et al. 1993).This battery of the tests which
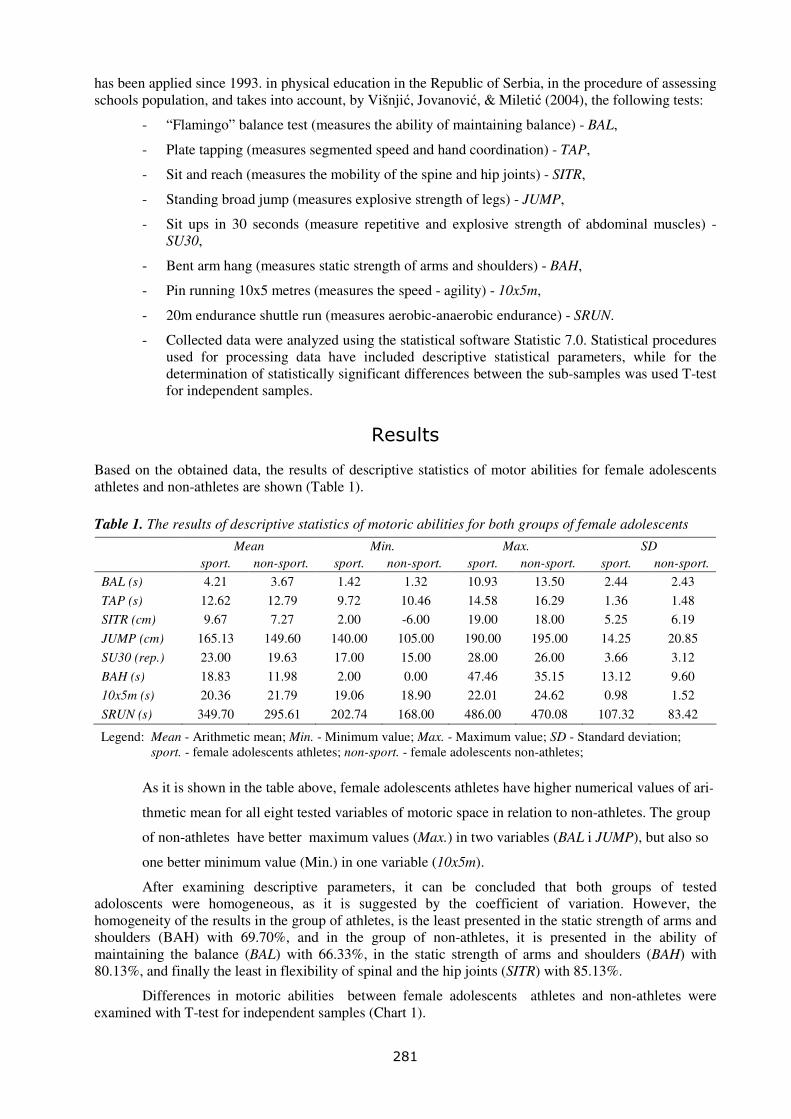
281
has been applied since 1993. in physical education in the Republic of Serbia, in the procedure of assessing schools population, and takes into account, by Višnjić, Jovanović, & Miletić (2004), the following tests:
- “Flamingo” balance test (measures the ability of maintaining balance) - BAL,
- Plate tapping (measures segmented speed and hand coordination) - TAP,
- Sit and reach (measures the mobility of the spine and hip joints) - SITR,
- Standing broad jump (measures explosive strength of legs) - JUMP,
- Sit ups in 30 seconds (measure repetitive and explosive strength of abdominal muscles) - SU30,
- Bent arm hang (measures static strength of arms and shoulders) - BAH,
- Pin running 10x5 metres (measures the speed - agility) - 10x5m,
- 20m endurance shuttle run (measures aerobic-anaerobic endurance) - SRUN.
- Collected data were analyzed using the statistical software Statistic 7.0. Statistical procedures used for processing data have included descriptive statistical parameters, while for the determination of statistically significant differences between the sub-samples was used T-test for independent samples.
Results
Based on the obtained data, the results of descriptive statistics of motor abilities for female adolescents athletes and non-athletes are shown (Table 1).
Table 1. The results of descriptive statistics of motoric abilities for both groups of female adolescents
Mean Min. Max. SD
sport. non-sport. sport. non-sport. sport. non-sport. sport. non-sport.
BAL (s) 4.21 3.67 1.42 1.32 10.93 13.50 2.44 2.43
TAP (s) 12.62 12.79 9.72 10.46 14.58 16.29 1.36 1.48
SITR (cm) 9.67 7.27 2.00 -6.00 19.00 18.00 5.25 6.19
JUMP (cm) 165.13 149.60 140.00 105.00 190.00 195.00 14.25 20.85
SU30 (rep.) 23.00 19.63 17.00 15.00 28.00 26.00 3.66 3.12
BAH (s) 18.83 11.98 2.00 0.00 47.46 35.15 13.12 9.60
10x5m (s) 20.36 21.79 19.06 18.90 22.01 24.62 0.98 1.52
SRUN (s) 349.70 295.61 202.74 168.00 486.00 470.08 107.32 83.42
Legend: Mean - Arithmetic mean; Min. - Minimum value; Max. - Maximum value; SD - Standard deviation; sport. - female adolescents athletes; non-sport. - female adolescents non-athletes;
As it is shown in the table above, female adolescents athletes have higher numerical values of ari-
thmetic mean for all eight tested variables of motoric space in relation to non-athletes. The group
of non-athletes have better maximum values (Max.) in two variables (BAL i JUMP), but also so
one better minimum value (Min.) in one variable (10x5m).
After examining descriptive parameters, it can be concluded that both groups of tested adoloscents were homogeneous, as it is suggested by the coefficient of variation. However, the homogeneity of the results in the group of athletes, is the least presented in the static strength of arms and shoulders (BAH) with 69.70%, and in the group of non-athletes, it is presented in the ability of maintaining the balance (BAL) with 66.33%, in the static strength of arms and shoulders (BAH) with 80.13%, and finally the least in flexibility of spinal and the hip joints (SITR) with 85.13%.
Differences in motoric abilities between female adolescents athletes and non-athletes were examined with T-test for independent samples (Chart 1).

282
4,21
3,67
12,62
12,79
9,67
7,27
165,1
3
149,6
23 19,63
18,83
11,98 20
,3621
,79
349,7
295,6
1
0
50
100
150
200
250
300
350
BALTAP
SITR
JUM
P*
SU30**
BAH
10x5
m**
SRUN
* p<0.05, ** p<0.01
Chart 1. The significance of differences in motoric abilities female adolescents athletes and non-athletes (T-test for independent samples)
Mean sport. Mean nesport.
Analyzing the results of T-test for independent samples (Chart 1) significant differences between
the sub-samples were found in the following tests: at the level of significance p<0.05, in test of the standing broad jump JUMP (p=0.013); and at the level of p<0.01, in tests of sit ups in 30 seconds SU30 (p=0.002) and pin running 10x5 meters 10x5m (p=0.002). On the other hand, significant differences between athletes and non-athletes weren’t found in the following tests: „Flamingo“ balance test (p=0.483), plate tapping TAP (p=0.715), sit and reach SITR (p=0.205), bent arm hang BAH (p=0.053) and 20m endurance shuttle run SRUN (p=0.070).
Discussion
After examining descriptive parameters (Table 1), it can be concluded that the athletes had higher numerical values of arithmetic mean for all eight tested variables of motoric space in relation to non-athletes. The assumption is that, this result wasn't only influenced by the regular classes of physical education, but active engagement in sport more than three times a week, too.
It can be concluded that both groups of tested adoloscents were homogeneous, as it is suggested by the values of coefficient of variation (Perić, 1996). Homogeneity of the results in the group of athletes, is the least presented in the static strength of arms and shoulders (BAH) with 69.70%, and in the group of non-athletes, it is presented in the ability of maintaining the balance (BAL) with 66.33%, in the static strength of arms and shoulders (BAH) with 80.13% , and finally the least in spinal mobility and in the hip joints (SITR) with 85.13%. Causes of inhomogeneity of the results, in the group of athletes, in the test of bent arm hang (BAH) can be result of: giving less attention to strength exercises for the shoulders during practice, diversity of the sport (volleyball, handball, athletics, karate), period of increased sensitivity of development - puberty, different physical predispositions, volume and intensity of the current physical activity, and the motivating factor that is, by Marković (2007-2008), the main factor in this test. Causes of inhomogeneity and extreme inhomogeneity of the results, in the group of non-athletes, in the tests of ability to maintain balance (BAL), bent arm hang (BAH) and sit and reach (SITR) can be result of following: different levels of exercise during classes of physical education in the previous period, different physical predispositions, period of increased sensitivity of development - puberty, when it comes to distortion of coordination, and which can have a negative impact on results (Suzović, & Porčić, 2012). Also, possible causes are volume and intensity of the current physical activity, willing moment - motivation, which differs for each adolescents non-athletes, and the result is a reduced range of motion due to insufficient physical activity of the group of non-athletes (Suzović, & Porčić, 2012; Popović, 2004). The obtained results indicate the similarity with the results of other authors’ researches of motoric space of female adolescents (Marković, 2007-2008), but as well with the results of research of motoric space of athletes and non-athletes (Popović, 2004; Petrović, 2009-2010). The analysis of the results of T-

283
test has shown there aren’t significant differences between the sub-samples in five out of eight variables of motoric abilities, while the results of two motoric tests (sit ups in 30 seconds and pin running 10x5 meters) have shown significant differences at level of significance p<0.01, and one test (Standing broad jump) has shown a significant difference between the results of sub-samples at level of significance p<0.05. The results indicate statistical importance of strength (explosive and repetitive) and speed (agility) on success in sports in which the group of athletes is engaged, while the following tests haven’t shown significant differences in motoric abilities: „Flamingo“ balance test BAL (balance), plate tapping TAP (segmentary speed and coordination of hands), sit and reach SITR (flexibility), bent arm hang BAH (static strength) and 20m endurance shuttle run SRUN (endurance). It can be also noted that some of the causes of significant differences in only three out of eight tests of motoric space, in favor of group of athletes, are before all, the training program, the intensity of the training, the optimum dosage of certain segments of the training and the length of their chosen sport, specificities in smaller communities in the inner parts of the Republic of Serbia, which affect the way of life of adolescents, but climate changes as well (Prskalo, Kraljević, & Kovačić, 2011; Gadžić, & Vučković, 2012).
Significant differences in motoric abilities between athletes and non-athletes that were determined by T-test, show similarities with the research of Simonović et al. (2011), where in comparison to the motoric abilities of athletes (karatists) and non-athletes were shown significant differences in the test of explosive strength standing broad jump (0.011) in relation to 0.013 obtained in our research; and repetitive strength sit and reach (0.000) in relation to 0.002 obtained in our research. Drid, Trivić, & Obadov (2009), in the research of development of speed that was performed on boys athletes and non-athletes, age 12 - 16 years, confirm the statistical significance in the test of development of speed (0.000), as in our research (0.002), at level of significance p<0.01 (0.000). In the research of motor abilities of sports active and inactive students, age 14 and 15 ± 6 months, done by Batričević (2008), T-test analysis, as in our research, has also shown significant differences in tests of strength and speed, while in the test of coordination significant differences weren’t determined. In a study in Estonia, which was realized by Loko, Aule, Sikkut, Ereline, & Viru (2003) with girls of age 10 - 17 years, divided into two sub-samples: 643 girls that were regularly practicing athletics, and 902 girls that were attending only regular physical education (2 times a week); girls who were engaged in sports, as in our research, had better values for all tested motor abilities (speed, explosive strength, static strength, endurance). Determined higher level of motor abilities for female adolescents athletes, is the result of their more intensive motor engagement and a larger volume of physical activities- playing sports 3 times a week, and regular classes of physical education - 2 times a week, compared to the group of non-athletes that attends only regular classes of physical education (2 classes a week). Overall, conclusions of the research were that statistically significant differences in motor abilities were determined in favor of the sub-sample of adolescents that are engaged in sport in comparison to the group of non-athletes. The results obtained in this research suggest that the development of students’ motor abilities has more quality under the influence of systematic sport training in comparison to students who only attend physical education (Kopas, Obadov, & Drid, 2008). These results gives the right you to persevere in their efforts to sports society of schools and sports sections to initiate and nurture a greater number of schools.
References
1. Aoron, D.J., Dearwater, S.R., Anderson, R., Olsen, T., Kriska, A.M., & Laporte, R.E. (1995). Physical activity and the initiation of high-risk health behaviors in adolescents. Medicine and science in sports and exercise. 27, 1639-1645.
2. Bajrić, O., Bajrić, S., i Jovanović, M. (2011). Kanonička povezanost morfoloških karakteristika i bazičnih motoričkih sposobnosti kod učenika srednje škole. U: V. Lolić, ð. Nićin (Ur.) 1. Meñunarodna konferencija „Sportske nauke i zdravlje“, 1(2), 129-134. Banja Luka: Fakultet sportskih nauka, Panevropski univerzitet „Apeiron“, BiH.
3. Batričević, D. (2008). Kanonička diskriminativna analiza motoričkih i funkcionalnih sposobnosti sportski aktivnih i neaktivnih učenika. Sport Science 1(1), 50-53.
4. Bolanča, M., Čavala, M., & Rogulj, N. (2010). Razlike motoričkih sposobnosti učenica rukometašica i onih koji se ne bave sportom. U: S. Simović (ur.) Zbornik radova sa 2. Meñunarodnog naučnog kongresa „Antropološki aspekti sporta, fizičkog vaspitanja i rekreacije“, 2 (str. 170-174). Banja Luka: Fakultet fizičkog vaspitanja i sporta.

284
5. Council of Europe, Committee for the Development of Sport. (1988). EUROFIT European tests of physical fitness. Rome, Italy: Council of Europe, Committee for the Development of Sport.
6. Drabik, J. (1996). Children and Sports Training. Vermont: Stadion Publishing Company. 7. Drid, P., Trivić, T., i Obadov, S. (2009). Dinamika razvoja brzine kod dečaka sportista i nesportista
uzrasta 12-16 godina. Glasnik Antropološkog društva Srbije, 44, 187-190. 8. ðurašković, R. (2009). Sportska medicina, 3-će dopunjeno izdanje. Niš: Centar za izdavačku
delatnost Fakulteta sporta i fizičkog vaspitanja, Univerzitet u Nišu. 9. Gadžić, A., i Vučković, I. (2012); Motoričke sposobnosti učenica osnovne škole urbane i ruralne
sredine. Glasnik Antropološkog društva Srbije, Niš, 47, 131-138. 10. Hardman, K. (2007). Current situation and prospects for physical education in the European Union -
study. Brussels: Directorate General Internal Policies of the Union, European parliament. 11. Kopas, J., Obadov, S., i Drid, P. (2008). Razlike u morfološkim karakteristikama i motoričkim
sposobnostima mladih džudista i učenika osnovne škole. Glasnik Antropološkog društva Srbije, Novi Sad, 43, 212-219,
12. Kukolj, M., Arunović, D., Stepić, Ž., i Zdravković, S. (1993). Poreñenje dve baterije testova (JZFKMS i EUROFIT) za procenu fizičkih sposobnosti učenika. Fizička kultura, 47,(4) 196-200.
13. Loko, J., Aule, R., Sikkut, T., Ereline, J., & Viru, A. (2003). Age differences in growth and physical abilities in trained and untrained girls 10-17 years of age. American Journal of Human Biology, 15, 72-77.
14. Marcus, B., Dubbert, P., Forsyth, L., McKenzie, T., Stone, E., Dunn, A., & Blair, S. (2000). Physical activity behavior change: issues in adoption and maintnenace. Health Psychology 19(1), 32-41.
15. Marković, Ž. (2007-2008). Uticaj dva modela realizacije programa nastave fizičkog vaspitanja u prvom razredu srednje škole na motoričke sposobnosti učenika. Godišnjak Fakulteta sporta i fizičkog vaspitanja, 15, 5-19.
16. Ministarstvo prosvete, nauke i tehnološkog razvoja Republike Srbije (2008). Strategija razvoja sporta u Republici Srbiji za period od 2009. do 2013. godine. Službeni glasnik RS, br. 110/08, 1-6.
17. Mišigoj-Duraković, M. (2008). Kinantropologija - biološki aspekti tjelesnog vježbanja. Zagreb: Kineziološki fakultet.
18. Oxyzoglou, S., & Oxyzoglou, N. (2011). Motor abilities performance after physical education program versus for handball training pre-adolescent children. U: V. Lolić, ð. Nićin, A. Vidović (Ur.) 1. Meñunarodna konferencija „Sportske nauke i zdravlje“, 1 (1) (47-51). Banja Luka: Fakultet sportskih nauka, Panevropski univerzitet „Apeiron“, BiH.
19. Perić, D. (1996). Operacionalizacija 2: Statističke aplikacije u istraživanjima fizičke kulture. Beograd: FINE Graf.
20. Petrović, A. (2009-2010). Uticaj posebno organizovanog programa fizičkog vaspitanja na neke morfološke, motoričke i psihološke karakteristike učenika. Godišnjak Fakulteta sporta i fizičkog vaspitanja, 16, 203-218.
21. Popović, S. (2003-2004). Efikasnost nastave fizičkog vaspitanja u zavisnosti od organizacione forme rada u nastavnom procesu. Fizička kultura, 57-58(1-4), 26-40.
22. Prskalo, I., Kraljević, Ž., i Kovačić, M. (2011). Mjesto stanovanja prediktor spolnog dimorfizma nekih motoričkih sposobnosti u primarnoj edukaciji. U: I. Prskalo, D. Novak (ur.) Zbornik radova. 6. Kongres FIEP-a Europe „Tjelesna i zdravstvena kultura u 21. stoljeću - kompetencije učenika“ (394-399). Poreč: Hrvatski kineziološki savez, Hrvatska.
23. Rowland, T.W. (1999). Adolescence: A 'Risk Factor' for Physical Inactivity, President's Council on Physical Fitness and Sports Research Digest.
24. Simonović, Z., Bubanj, S., Projović, A., Kozomara, G., & Bubanj, R. (2011). Differences in motor abilities between karate athletes and non-athletes. Sport SPA, 8(1), 15-19.
25. Suzović, D., i Porčić, B. (2012). Uticaj morfoloških karakteristika i motoričkih sposobnosti na selekciju u baletu. Fizička kultura, 66(1), 32-39.
26. Višnjić, D., Jovanović, A., & Miletić, K. (2004). Teorija i metodika fizičkog vaspitanja. Beograd: Fakultet sporta i fizičkog vaspitanja, Univerzitet u Beogradu.
27. Tomin, O. (26. novembar 2012). ŽENE I SPORT: Kreativne u izboru sportskih aktivnosti. Kikindske novine. Nañen 05.01.2013, sa http://www.kikindske.net/index.php?option=com_content&view= article&id=1554.
28. Zaciorski, V.M. (1995). Science and practice of strength training. Champaign: Human Kinetics.

285
RELATIONS BETWEEN SPORTS MOTIVATION IN PHYSICAL
EDUCATION CLASSES AND DROPPING OUT OF
ORGANIZED KINESIOLOGICAL ENGAGEMENT IN
ADOLESCENCE
Zoran Grgantov, Mirjana Milić and Boris Milavić Faculty of Kinesiology, University of Split, Croatia
Abstract
Vallerand (2007), suggests a hypothesis stating that the impact of the environment on individuals takes place through a causal chain of processes. Dropping out of organized kinesiological engagement (sports, dance or recreational activity) in adolescence is very common, and it is assumed that it is not necessarily induced by an “objective” reason. The aim of this research was to establish the relations between motivation in physical education classes and dropping out of organized kinesiological engagement occurring in adolescence.
The subject sample included 305 students of finishing grades from primary schools in Trogir, Kaštela and Solin. Variables of motivation in physical education classes as well as the frequency of organized kinesiological engagement of adolescents were measured by PEMS – Physical Education Motivation Scale (Milavić, Milić, Jurko, Grgantov, & Marić, 2013) and the adapted TEOSQ-PE questionnaire.
There were no differences between male and female students regarding the frequency of involvement in organized kinesiological engagement: 52 % of the male sample and the female sample are constantly active, while 39 % of female students and 34 % of male students have dropped out of organized kinesiological engagement. In female students, differences were found between the groups of constantly active and drop-outs in most of the measured motivation variables (mostly measures of intrinsic motivation and measures of amotivation), while in male students, differences were found in two measures of motivation (measure of amotivation and measure of intrinsic motivation to accomplish things).
By discriminant analysis, the difference was established in the sample of female students between the groups of constantly active and drop-outs regarding the motivation in physical education classes, but no differences were found in the sample of male students. The group of drop-outs from the organized kinesiological engagement in female students is characterized by higher values of amotivation in physical education classes, while the group of constantly active female students is characterized by a higher level of intrinsic motivation, but also partly by extrinsic motivation in physical education classes.
Results of this research call attention to the necessity of further research of relations of motivation in physical education classes and involvement in organized kinesiological engagement of adolescents, with the purpose of establishing the causal relations.
Keywords: motivation in physical education classes, dropping out of organized kinesiological engagement, intrinsic motivation, extrinsic motivation, students

286
Introduction
In his hierarchical model of intrinsic and extrinsic motivation, Vallerand (2007) introduces a hypothesis that the impact of the environment on individuals takes place through a causal chain of processes. Motivation is often defined as the key element of exerciser’s perseverance with the exercise regimen (Wilson, & Rodgers, 2007, according to Vallerand, 2007). Dropping out of organized kinesiological activity (organized sports, dance or recreational activity) in adolescence is very common, and it is assumed that it is not necessarily induced by an “objective” reason. Barić, & Horga (2006) present two types of goal modeling in sports: task orientation and ego orientation. Maršić, Paradžik, & Breslauer (2006) established statistically significant differences between male and female students in motivation for physical education classes (PE). Male students, in relation to female students, had a significantly higher ego-orientation, but there were no significant differences according to gender in students’ task orientation. Horga, & Štimac (1999) used a sample of elementary school students to determine the structure of intrinsic, social and extrinsic reasons for enjoying exercise, and found significant differences according to gender. Social and extrinsic reasons for enjoying exercise were isolated, whereas intrinsic reasons separated into two dimensions: game excitement and striving for mastery in female students, and challenge and striving for mastery in male students. Milić, Milavić, & Grgantov (2011) found that intrinsic sports motivation in primary school students of finishing grades is considerably higher than extrinsic sports motivation. They suggest that it is a good predisposition for participating in organized kinesiological activity because such adolescents find more sports satisfaction in skill acquisition and development and increasing personal sport competences, than in expecting, affirming or gaining appraisal from others. Cetinić, Polančec, & Cimerman (2008) established significant differences regarding intrinsic motivation in students of different profiles of goal orientation. Students with high task orientation, as opposed to students with low task orientation, make more of an effort and give greater importance to physical education classes, have greater interest for exercise and greater enjoyment in classes. Milavić, Milić, Jurko, Grgantov, & Marić (2013) constructed a scale for measuring motivation in PE classes, based on the Sport Motivation Scale designed by Pelletier, Fortier, Vallerand, Tuscon, Briere, & Blais (1995). They have established that there were no significant differences according to gender in the intrinsic dimension of motivation for PE classes, but there were differences found in the motivation dimension characterized by amotivation and extrinsic motivation – external motivation scales.
The aim of this research was to establish the relations between motivation in PE classes and dropping out of organized kinesiological activity (OKA) in adolescence.
Method
The subject sample consisted of 305 male and female 7th and 8th grade students of elementary schools in Trogir, Kaštela and Solin, without distinct structural deformity which would limit their involvement in sports. Out of 305 participants, 163 were female students, and 142 were male.
Variables of students’ motivation for attending and participating in physical education classes were measured by Physical Education Motivation Scale (PEMS), constructed by Milavić, Milić, Jurko, Grgantov, & Marić (2013), and by Task an Ego Orientation for Sport Questionnaire (TEOSQ), constructed by Chi, & Duda (1995), adapted for PE classes. Three measures of intrinsic motivation (Intrinsic Motivation to Know, Intrinsic Motivation to Accomplish Things and Intrinsic Motivation to Experience Stimulation), two measures of extrinsic motivation (Extrinsic motivation - External regulation and Extrinsic motivation - Identified) and Amotivation were measured by PEMS questionnaire. Amotivation represents the lack of intrinsic and extrinsic motivation, feeling incompetence and lack of control, making such persons with highly expressed amotivation candidates for aborting exercise (Deci, & Ryan, 1985). Two measures were measured by the adapted TEOSQ questionnaire: intrinsic (task orientation) and extrinsic (ego orientation) orientation of motivation in PE classes. The frequency of organized kinesiological engagement in adolescents (sports, dance or recreational activity) was determined by asking students to state, in the general information questionnaire, whether they have been involved in some organized kinesiological activity, and if so, at what age and how long the engagement lasted, and whether they were still active in participating in an organized kinesiological activity. Based on this data, 4 groups were created according to their involvement in OKA: constantly active (those who

287
have continuously participated in OKA for more than 3 years), sport dropouts (those who have in the meantime dropped out of OKA), recently activated (those who have been active for only two years), and constantly inactive (those who have never been involved in OKA).
The following statistical procedures were used: calculating the descriptive characteristics of variables, procedures for determining the differences between the groups of adolescents (t-test), and discriminant analysis in order to determine the differences of measured variables of motivation in PE classes between the two groups of students with different status of organized kinesiological engagement.
To be able to compare the results obtained in motivation scales with different number of items, scale results were obtained in such a way that the sum of results of every item in each scale was calculated, and then divided by a number of items of the same scale.
Results
Because of the established differences between male and female students in motivation for PE classes (Milavić et al., 2013), indicating that extrinsic motivation – external regulation and amotivation is expressed more in male students, all applied statistical procedures were conducted separately for the subsamples of male and female students.
About 52% female (Table 1), as well as male students are constantly active in their involvement in organized kinesiological activity. About a third of adolescents (40% of female students and 34% of male students) have dropped out of the OKA, and about 10% of all students are constantly inactive (8% of female students and 13% of male students). Having compared the percentages of groups with different kinesiological engagement, it has been established that there were no differences between male and female students regarding the frequency of participation in OKA. These findings differ from those of Bego, Samardžić and Turalija (2011), who found that there was a higher percentage of constantly active adolescents (59% of female students and 75% of male students) in a larger city (city of Split), but also a significantly lower percentage of dropouts (29% of female students and 20% of male students).
Table 1. The frequency of organized kinesiological engagement in male and female students FEMALE STUDENTS MALE STUDENTS TOTAL
GROUPS FREQUENCY % FREQUENCY % FREQUENCY
DIFFERENCES OF %
CONSTANTLY INACTIVE 13 7.98 18 12.68 31
SPORT DROPOUTS 65 39.87 48 33.80 113
RECENTLY ACTIVATED - 0.00 1 0.70 1
CONSTANTLY ACTIVE 85 52.15 75 52.82 160
OR
GA
NIZ
ED
K
INE
SIO
LO
GIC
AL
E
NG
AG
EM
EN
T
TOTAL 163 100.00 142 100.00 305
χ2= 3.70
DF=3,1
P= .30
LEGEND: χ2 – χ2-test coefficient; DF – degrees of freedom; P= – level of significance of χ2-test coefficient
Measures of intrinsic motivation are noticeably higher than the measures of extrinsic motivation, both in female and male students. The measure of amotivation is the least expressed one in both subsamples. By testing the significance of differences in motivation for PE classes in female students, it has been established that the groups of constantly active and dropouts differ in 8 out of 10 measured motivation variables. In constantly active students, all measures of intrinsic motivation and a measure of extrinsic motivation – identified were higher, and amotivation was lower than in dropouts.
In male students, statistically significant differences were established only in two variables: intrinsic motivation – to accomplish things and in the level of amotivation, but the differences between the groups were very close to the significance level (P=.05 and P=.06) for the remaining two variables of intrinsic motivation of the PEMS questionnaire – to experience stimulation and to know.
Considering it is reasonable to assume that different measures of intrinsic and extrinsic motivation are correlated to each other, and statistically significant differences have been established

288
between the groups of constantly active and dropouts in several measures of intrinsic motivation, discriminant analyses were applied in both subsamples in order to determine the common effect of the motivation variable set on the occurrence of dropping out of OKA (Table 2).
Table 2. Descriptive statistics and significance of differences in motivation according to the organized kinesiological engagement
FEMALE STUDENTS MALE STUDENTS CONSTANTLY
ACTIVE DROPOUTS
CONSTANTLY ACTIVE
DROPOUTS VARIABLE
M SD M SD
T-TEST
P= M SD M SD
T-TEST
P=
PEMS_AMOTIVATION 1.78 0.09 2.13 0.76 2.54** 0.01 1.93 0.92 2.45 1.03 2.91 0.00** PEMS_IM_TOEXPER.STIMUL. 3.67 0.89 3.04 0.97 4.13** 0.00 3.74 0.83 3.43 0.85 2.02 0.05 PEMS_IM_TO KNOW 3.80 1.03 3.21 0.99 3.52** 0.00 3.87 0.84 3.57 0.87 1.88 0.06 PEMS_IM_TO ACCOMPLISH 3.90 0.91 3.42 1.00 3.10** 0.00 3.94 0.87 3.62 0.82 2.05 0.04* PEMS_EM_EXTER. REGUL. 2.72 1.04 2.43 0.88 1.79 0.08 3.08 0.94 3.07 0.87 0.04 0.97 PEMS_EM_IDENTIFIED 3.56 0.93 3.17 0.99 2.45* 0.02 3.57 0.86 3.49 0.91 0.46 0.65 TEOSQ_TASK ORIENTATION 4.12 0.69 3.73 0.77 3.28** 0.00 4.00 0.73 3.87 0.86 0.89 0.37 TEOSQ_EGO ORIENTATION 3.32 0.98 3.21 0.92 0.69 0.49 3.51 0.84 3.31 0.95 1.21 0.23
LEGEND: M – mean; SD – standard deviation; T-TEST –t-test coefficient; P= - significance level of the t-test coefficient; * - statistical significance of the coefficient at the level of p<.05; ** - statistical significance of the coefficient at the level of p<.01.
Significance of differences (p=0.006) in the variable set of motivation for PE classes between the groups of constantly active female students and dropouts has been established by discriminant analysis. By testing the contribution of each variable within the observed motivational model, it has been established that measures of intrinsic motivation make the greatest contribution to the differentiation of the two groups of female students, and measures of Intrinsic motivation to experience stimulation and Intrinsic motivation to know make the highest contribution (Table 3).
There was no significance of differences (p=0.071) found by discriminant analysis in the variable set of motivation for PE classes between constantly active male students and dropouts, but the significance level was not far from the criterion of statistical significance. Therefore, it cannot be claimed with certainty that an expansion or a reduction of the motivational variable set and the increase of the subject sample would not have influenced the procedure of establishing significant differences between these two groups. Even though the level of statistical significance of the motivational variable set has not been achieved, the most prominent contribution of amotivation in the differentiation of the two groups is noticeable.
Table 3. Discriminant analyses on samples of male and female students of different kinesiological engagement (constantly active – dropouts)
SAMPLE λ Rc
Wilks’
lambda χ2 DF P=
FEMALE STUDENTS 0.16 0.37 0.86 21.69 8 0.006
MALE STUDENTS 0.13 0.34 0.88 14.45 8 0.071
Structure matrix VARIABLE
FEMALE STUDENTS
MALE STUDENTS
PEMS_AMOTIVATION 0.52 0.73 PEMS_INTINSIC MOTIVATION_TO EXPERIENCE STIMULATION -0.84 -0.51 PEMS_ INTINSIC MOTIVATION _TO KNOW -0.72 -0.47 PEMS_ INTINSIC MOTIVATION _ACCOMPLISH -0.63 -0.52 PEMS_EXTRINSIC MOTIVATION_EXTERNAL REGULATION -0.37 -0.01 PEMS_ EXTRINSIC MOTIVATION _IDENTIFIED -0.50 -0.12 TEOSQ_TASK ORIENTATION -0.67 -0.22 TEOSQ_EGO ORIENTATION -0.14 -0.30
Group centroids GROUPS OF ORGANIZED KINESIOLOGICAL ENGAGEMENT
FEMALE STUDENTS MALE STUDENTS DROPOUTS 0.46 0.45 CONSTANTLY ACTIVE -0.35 -0.29 LEGEND: λ – Eigenvalue; Rc – coefficient of canonical correlation; Wilks' lambda – Wilks' lambda coefficient (Wλ) of discriminant function; χ2 – significance test of discriminant function– χ2 test; * – significance level of DF at p<.05; DF – degrees of freedom; P= – statistical significance level of DF (of χ2 -test).

289
Discussion
The findings of this research indicate a somewhat lower level of adolescents’ participation in OKA and a higher percentage of dropouts in smaller towns, in relation to adolescents in a larger city (Bego et al., 2011). These differences in the frequency of dropping out of OKA are probably not to be attributed simply to the higher motivation and perseverance in exercise of adolescents in larger cities. Reasons should rather be “looked for” in a likely greater number of possibilities for participation in OKA in a larger city, as well as in possible problems with traffic connections in smaller towns (distance between the settlements, the lack of adequate bus lines). It is recommended to replicate the study using a larger subject sample from cities with different population sizes, but including some variables of availability of OKA (variety of available activities, manner of organization, traffic connections, expenses of participation in OKA, etc.) because participation of adolescents in organized kinesiological activities is a social goal with the purpose of healthy development of the adolescent population. The established noticeable differences in higher intrinsic motivation for PE classes in adolescents in relation to their extrinsic motivation confirm previous findings of Milić et al. (2011) about similar differences regarding sports motivation.
In female students, the established differences between the groups of constantly active and dropouts can be attributed mainly to intrinsic motivation for participation in physical education classes, because differences have not been established only in two measures of extrinsic motivation: external regulation and ego orientation. Both measures represent exactly that which is usually considered as extrinsic motivation. Although there are considerable differences in relation to female students, the result about the differentiation of groups of male students according to their involvement in OKA is similar to the one obtained on a sample of female students, because significant differences have been established in intrinsic motivation and amotivation. These findings indicate that motivation for PE classes on one hand, and on the other hand, motivation for participating in organized kinesiological activities, which actually makes students persist or drop out of such activities, have the same source. This source is intrinsic motivation of adolescents, a motivation which is not easy to influence.
As the differences in motivation between constantly active and dropouts were more prominent in female students as opposed to male students, such findings are replicated in discriminant analysis. A group of constantly active female students is characterized by high intrinsic motivation, and also by more pronounced measures of extrinsic motivation, although to a lesser extent. As opposed to that, the group of dropouts among female students is characterized by high amotivation in PE classes. Female adolescents who persist in their involvement in organized kinesiological activity are also motivated for participating in PE classes. It can be concluded that there is a positive motivational transfer between similar activities, those which are obligatory in classes and extracurricular ones, organized outside of regular classes.
Among male students, the differences between the groups of constantly active and dropouts are more subtle. Amotivation is expressed more in the group of dropouts. As earlier, it is recommended to replicate the study by increasing the number of subjects in the sample of male students in order to determine with greater precision whether the groups of constantly active and dropouts differ in all measures of intrinsic motivation.
Practical value of this paper is in its determination of the existence of positive motivational transfer between motivation in PE classes and “the consequences” of free choice in engaging in organized kinesiological activities. The direction of causal relations cannot be clearly determined, but it can be assumed that the influence is mutual. By acquisition of competences through their involvement in organized kinesiological activities (sports, dance or recreational activities), adolescents also become more motivated for mastering different tasks and activities in PE classes. Also, having successfully mastered the units and tasks of the PE curriculum, adolescents will probably choose kinesiological activities in which they can apply the competences acquired in class, usually being kinesiologically active among their peers, which indirectly affects their socialization. These findings partly confirm those of Cetinić et al. (2008), who have established that students with high intrinsic motivation differ from students with low intrinsic motivation by showing a greater interest in exercise, but also by making more of an effort and enjoying PE classes more, and by giving greater importance to physical education. Moreover, these results “increase” the importance of the complementary function of PE teachers, as well as program creators and experts implementing organized kinesiological youth activities in the area of intrinsic motivation development. Teachers and coaches, by implementing their programs, develop intrinsic motivation of adolescents for persistent mastering of more complex tasks, and significantly influence a

290
positive development of young people. As there is a mutual transfer between obligatory (classes) and organized kinesiological activity (adolescents’ free choice), it can be assumed that the acquired competences are also positively transferred into other domains of life, for example, academic (educational) or social domain. Students who are successful in one domain, like the domain of kinesiological activity, are generally motivated, confident about their abilities and competences, persistent in solving problems and tasks, and therefore exhibit a higher level of intrinsic motivation for mastering problems and tasks in other domains of life as well. It is recommended to coaches and others implementing OKA, naturally if the necessary conditions are met within their institutions and clubs, to maintain the engagement of a high number of adolescents, and not to perform selections too soon, in order to support a positive development of adolescents through kinesiological activity involvement over a longer period of time. It is recommended to physical education teachers to give more consideration to individualization and quality communication with students of finishing grades of primary school, and thereby to an enhanced influence of students’ motivation for participation in physical education classes.
References
1. Barić, R., & Horga, S. (2006). Psychometric properties of the croatian version of Task and Ego Orientation in Sport Questionnaire (CTEOSQ). Kinesiology 38(2), 135-142.
2. Bego, J.,Samardžić, M., & Turalija, P. (2011). Social-demographic differences of adolescents persistent in sport and adolescents drop-out from sport [In Croatian language]. In: N. Skender, N. Čikeš (Eds.) Proceedings of 2nd International Symposium "Sport, Tourism and Health",14-16 October 2011 (169-172). Bosnia and Herzegovina: Bihać.
3. Cetinić, J., Polančec, J., & Cimerman, M. (2008). Profiles of a goal orientation in physical education classes: differences in factors of intrinsic motivation [In Croatian language]. U: Neljak, B. (ur.) 17. ljetna škola kineziologa Hrvatske, Poreč (101-106). Zagreb: Hrvatski kineziološki savez.
4. Chi, L., & Duda, J.L. (1995). Multi-Sample Confirmatory Factor Analysis of the Task and Ego Orientation in Sport Questionnaire. Research Quarterly for Exercise and Sport 66(2), 91-98.
5. Deci, E.L., & Ryan, R.M. (1985). Intrinsic motivation and self-determination in human behavior. New York: Plenum Press.
6. Horga, S., & Štimac, D. (1999). Why children exercise? Evaluation of motivational scale. Kinesiology, 31(1), 57-63.
7. Maršić, T., Paradžik, P., & Breslauer, N. (2006). Gender differences in motivation of physical education classes. Napredak, 147(3), 328-334.
8. Milavić, B., Milić, M., Jurko, D., Grgantov, Z., & Marić, K. (In press). Adaptation and validation of the motivation scale in physical education classes. Croatian Journal of Education.
9. Milić, M., Milavić, B., & Grgantov, Z. (in press). Relations between sport involvement, self-esteem, sport motivation and types of computer usage in adolescents. In S. Simović (Ed.), Proceedings of 3rd International Scientific Congress "Anthropological Aspects of Sport, Physical Education and Recreation". November 2011. Banja Luka: University of Banja Luka, Faculty of Physical Education and Sport.
10. Pelletier, L.G., Fortier, M.S., Vallerand, R.J., Tuscon, K.M., Briere, N.M., & Blais, M.R. (1995). Toward a new measure of intrinsic motivation, extrinsic motivation, and amotivation in sports: The Sport Motivation Scale. Journal of Sport and Exercise Psychology, 17, 35-53.
11. Vallerand, R.J. (2007). Intrinsic and Extrinsic Motivation in Sport and Physical Activity. In G. Tenenbaum, & R. C. Eklund (Eds.), Handbook of Sport Psychology. (pp. 59-80). Hoboken, NJ: John Wiley & Sons, Inc.

291
DETERMINING DISTINCTION IN THE ATTITUDES OF
MALE AND FEMALE STUDENTS ON INDIVIDUAL
SEGMENTS IN THE TEACHING OF PHYSICAL EDUCATION
IN PRIMARY SCHOOLS IN THE REPUBLIC OF SRPSKA
Saša Jovanović, Snežana Bijelić and Vladimir Jakovljević
Faculty of Physical Education and Sport, University of Banja Luka, Republic of Srpska, Bosnia and Herzegovina
Abstract
Topic engaged in this work is related to several issues. The question is how much regulated contents of prescribed physical education and teacher themselves contribute to the promotion of physical education and how they make the awareness of the young man's proper form in the sense of the importance of physical activity for a healthy life. What is the interest of students for classes, how interesting lecture topics are, what you would change in the present teaching, where they see the benefits of physical education classes, and many others. Also we were interested to find out whether there are differences in responses by sex. It was found that there is a statistically significant difference in the responses to the question for what reason they like physical education, and there was difference in a sense of joy in physical education class and question regarding number of classes. Namely, boys have a stronger craving for bigger fund physical education classes than girls, and more intense emotion of joy. The girls have a clearer picture of the importance of physical education to health, while the boys think that play is more significant than the girls. Other issues are not treated differentiate, but they pointed out the evident problems (lack of good conditions in performing) as they used to recognize the benefits of physical education in the life of a young man.
Keywords: Physical Education, girls and boys
Introduction
Keeping in mind, the most evident lack of movement of the population in general and more and more aggressive promotion and use of information technologies, the "fight" to preserve the health of each child are a real masterpiece. However, we should not ignore the question how much regulated contents of prescribed physical education, as well as the teachers themselves contribute to the promotion of physical culture and how to make the awareness of the young man's proper form in the sense of the importance of physical activity for a healthy life. What is the interest in physical education, what kind of judgment about physical education is from female and male perspective, are the questions that inspired this work.
Method
The subject of this paper is a physical education in primary schools in the Republic of Srpska, who was conceived through work in three triads. In the first triad, physical education takes place in the fund 3 hours a week, and running her school teachers. In the first two years of the second triad of classes are three classes and also doing the class teacher, while in other Triad last year students have two classes and teaching takes physical education teacher. The third triad is conducted through two hours per week of physical and implements a physical education teacher. With regard to the subject of this paper, and the problem of relating the differences and similarities in the thinking of students male and female on the state of the individual segments in physical education. Sample consisted of 775 ninth grade students of both genders (F-412, M-363), from 37 primary schools across the Republic of Srpska. Commitment to

292
students ninth grade, it was the best opportunities for consideration of the whole educational process of physical education in elementary schools. The goal of the research is to determine the state of the individual segments in physical education of pupils and students of primary schools in the Republic of Srpska. Non-experimental research is survey research, and data were analyzed with nonparametric procedure - chi-square test.
Results and Discussion
Table 1 Relationship opinions about the found of classes and gender found of classes gender Total F M completely yes 23,8% 24,8% 24,3% yes 37,1% 27,8% 32,8% Im not sure 18,0% 17,4% 17,7% no 14,1% 14,9% 14,5% is very little 7,0% 15,2% 10,8% Pearson Chi-Square 17,030 4 ,002
Question relating to the results shown in Table 1 show was "Do you think the amount of hours of physical education for you enough? “ The number of classes as an essential element in the educational process is significantly differentiated both boys and girls. Specifically, a greater percentage of boys than girls feel that they fund physical education classes with insufficient and it would increase, while the girls (60.9%) believe that the fund represented quite optimal and are satisfied with it. A possible explanation might be that in the actual implementation of the teaching group we’ll find a large number of cases, it appears that the educational unit to replace some of the sports games that exercise only the boys. In this case, girls are inactive and the lack of innovative teachers to become interested in activities, such as dance, aerobics and more. Between 17 and 18% of respondents do not have a clearly expressed opinion on the number of classes, and they represent one part of a sample of whose affection and activation should be up, too. Persistence in planned amenities, creativity in the application of new contents and forms of work and constant efforts to improve the working conditions are prerequisites acquire better and better engagement as well as the additional benefits in physical education.
Table 2 Relationship opinions about the place of the teaching and gender place of the teaching gender Total
F M indoor 80,8% 78,2% 79,6% outdoor 16,8% 18,2% 17,4% in classroom 1,0% 2,2% 1,6% elsewhere ,0% ,6% ,3% we dont have PE 1,5% ,8% 1,2% Pearson Chi-Square 5,183 4 ,269
The question asked was "Do you perform a physical education class ...? “ In terms of maintenance hours of physical education classes, there were no statistically significant differences between the genders, but it is evident from the responses of subjects in most primary schools in the RS, there are basic prerequisites for classes in the school premises.
Table 3 Relationship opinions on teachers' engagement and motivation of students for work and gender participation of teachers gender Total motivation gender Total
F M F M entirely 38,8% 47,1% 42,7% never 8,5% 8,3% 8,4% I am mostly 35,0% 31,7% 33,4% rarely 16,0% 14,3% 15,2% Yes and no 16,3% 13,8% 15,1% sometimes 26,7% 28,9% 27,7% I am mostly not 4,6% 3,9% 4,3% often 25,2% 25,3% 25,3% Not at all 5,3% 3,6% 4,5% always 23,5% 23,1% 23,4% Pearson Chi-Square 6,081 4 ,193 Pearson Chi-Square ,735 4 ,947

293
By statistical analysis of answers to the question "Are you satisfied with the participation of teachers in physical education lesson? “ It was found that there was no statistically significant difference between the genders. It can be observed a positive opinion of both genders and concluded that between 73 and 78% of respondents were satisfied with engaging teachers in classes. These results should be taken with some reserve until just look through the fact that the respondents may not be so familiar with the diversity of matter and thus required the engagement of teachers, as well as a wide option to use additional funds to continue to facilitate the adoption of matter and increase pleasure of participating in the execution of the instruction. Like in the previous issue, so even in this the motivation of students by teachers, there is no statistically significant difference between boys and girls. Both of equal number believe that the positive motivation in the educational process of the physical education lesson.
Table 4 Relationship opinions on accomplished teaching units and of interesting topics and gender themes gender Total The interest of gender Total
F M F M never 5,1% 3,9% 4,5% never 3,4% 3,3% 3,4% rarely 10,7% 9,4% 10,1% rarely 10,2% 10,7% 10,5% sometimes 30,8% 24,5% 27,9% sometimes 30,9% 22,9% 27,1% often 34,0% 35,8% 34,8% often 32,6% 35,8% 34,1% always 19,4% 26,4% 22,7% always 22,9% 27,3% 24,9%
Pearson Chi-Square 8,127 4 ,087 Pearson Chi-Square 6,723 4 ,151
Obtained by statistical analysis of answers to the question "Is the content classes PE covers interesting topics?", "What we do in physical education lesson for my best interest? “ There was no statistically significant difference, but there is a difference in the tone of the answers. For girls there are several answers that sometimes teaching topics of interest, while a higher percentage of boys who are always happy with the topics. It can be observed a positive opinion of both genders and concluded that between 54 and 63% of respondents believe that the teaching unit implemented in full (often or always) in accordance with their interests. If one adds to this the percentage of those who consent graded as sometimes they match, then the percentage is much higher (84-87%). Yet answers to this question can and deceive us, because students often do not know what all of the content that can be realized in physical education classes, and that they do not know the extent to which curricula coincide with the projected plan and program outlining Educational Pedagogical Institute.
Table 5 Ratio of opinions about the feeling of joy in physical education class and gender Joy gender Total
F M yes, very 33,5% 51,4% 41,9% Yes 41,7% 35,1% 38,6% all the same 18,2% 11,6% 15,1% No 4,9% 1,1% 3,1% Not at all 1,7% ,8% 1,3% Pearson Chi-Square 32,363 4 ,000
In this attitude there was a statistically significant difference between the genders in favor of males, although the percentage of positive emotions is present to a large extent and females. Assume that a significant difference occurred due to high percentage of replies boy - that really makes me happy and a high percentage of responses “all the same” for girls.
Table 6 Relationship opinions on the importance and usefulness of the reasons why he likes physical education and gender
Reasons gender Total usage gender Total F M F M Because of the game
12,6% 29,8% 20,6% Very useful
61,6% 69,1% 65,1%
Because of the health
49,8% 38,3% 44,4% Mainly useful
30,9% 23,7% 27,5%
Because of the teacher
12,4% 9,1% 10,8% Im not sure
4,6% 5,5% 5,0%
Because of the matery
25,2% 22,9% 24,1% Mainly not useful
1,5% ,8% 1,2%
Not useful at all 1,5% ,8% 1,2% Pearson Chi-Square 35,522 3 ,000 Pearson Chi-Square 6,976 4 ,137

294
Offered reasons why students like physical education were due to play, because of his health, the professor and the subject matter. The fact is that the respondents largely understand the importance of physical education to health, but did not recognize the importance of the game in personality development. In this sense, the girls in a small percentage (12.6) stated that they prefer physical education classes because of the game but had a higher percentage of boys declared that it was due to the positive impact on health. This is very important because this attitude will direct them to throughout their lives engaged in any physical activity. It should be noted that in this regard, students in a statistically significant difference, while the next question no statistically significant difference between the genders. It is evident that both genders expressed a high percentage of answers to the question with a very useful and generally useful as a percentage seems 92.5% of girls and 92.8% of boys thought that they were the subject of a very useful and generally. Based on the analysis of the last two questions can be said that respondents generally understood and importance and positive impact of physical education.
Table 7 Relationship opinions on exemption from physical education classes and gender Exemption from classes gender Total F M gladly 11,2% 12,9% 12,0% I hesitate 21,8% 16,5% 19,4% would never have done 67,0% 70,5% 68,6% Pearson Chi-Square 3,679 2 ,159
Of crucial importance are the answers to the questions on the exemption from physical education classes, because we are witnessing a growing number of children exempted from teaching in primary schools in the RS. 68% of girls and 70.5% boys would never have released this teaching. A relatively large percentage of those children who cannot decide that They have no established position on the issue at hand, and have the opportunity to search for reasons why the freeing of physical education. It certainly should not be allowed and the primary task of the teacher should be activation and motivation of this part of the population to make the most of them, however, joined the teaching and socializes with their environment.
Table 8 Relationship opinions about changes in physical education and gender Condition for PE gender Total
Structure of lessons gender Total
F M F M
content 29,9% 29,8% 29,8% yes 50,0% 54,5% 52,1% Teacher 11,7% 11,8% 11,7% no 50,0% 45,5% 47,9% Conditions 58,5% 58,4% 58,5%
Pearson Chi-Square
,007 2 ,996 Pearson Chi-Square
1,598 1 ,206
In connection with this question no statistically significant difference, but there is a profound correlation by gender in the obvious problem in the physical education curriculum, and that the work conditions. What respondents identified as the main problem is insufficient material and technical conditions for teaching physical education. To the question "Would you like to / by the hour instead of the classic pick a sport that you love and doing it for the whole year? “ Observed by sex did not reveal a statistically significant difference. Yet there are reasons why they asked. There was a more pronounced desire among students for certain sports engagement rather than traditional physical education classes. It can be said that the respondents, even though they are 15 years old, very clearly recognize the problems, but also those aspects of teaching that can and should change. The results obtained (50 and 54.5%) indicate the need much elaboration in a future scientific work.

295
Conclusion
In terms of maintenance hours of physical education classes from the answers of the respondents, in most primary schools in the RS are the basic prerequisites for the maintenance of the school premises have been identified, although insufficient material and technical conditions (props, trainers, etc.) to perform better physical education classes. Respondents were largely understood the importance of physical education to health, but this was not sufficient importance that a game, as a segment of education in the development of personality. Despite that fact the boys to a higher percentage of girls find that their fund physical education classes with insufficient and would increase it, while girls (60.9%) believe that the present fund quite optimal and with him are happy. It can be observed a positive opinion of both genders on the commitment of teachers in physical education lesson and concluded that between 73 and 78% of respondents were satisfied with participation of teachers in the class room. Positive emotions that are released during physical education classes are present in both genders with the emotions that this something stronger for boys, so that the expected high percentage of 68% of girls and 70.5% of boys who never would free attendance physical education. Space and direction for further action can be seen from the data obtained that between 17 and 18% of respondents do not have a clearly expressed opinion on the number of classes, and to the relatively large percentage of those children who cannot decide that “They have no established position” on the issue at hand, and have the opportunity to search for reasons why the freeing of physical education. On the other hand revealed a more pronounced desire among students for certain sports engagement rather than traditional physical education classes. So you would have two primary tasks of physical education teachers at the elementary schools of the Republic of Srpska, there should be activation and involvement of motivation in the work of that part of the population and constant attention to additional attention in terms of better organization, and more to that part of the population that has already reached a certain "positive saturation“.
References
1. Babiak, J. (2010). Motivacioni status učenika i veza izmeñu nekih motivacionih varijabli/faktora sa uspehom učenika u fizičkom vaspitanju. Norma, 15(1), 17-30.
2. Čokorilo, R., Jovanović, M., & Čokorilo, N. (2003). Socijalno-statusna obilježja učenika i stavovi prema fizičkom vaspitanju. Glasnik Antropološkog društva Jugoslavije, (38), 225-230.
3. Dedaj, M. (2011). Značaj fizičkog vaspitanja za zdravlje dece i mladih - istorijski pregled. Pedagogija, 66(2), 346-356.
4. ðorñić, V., & Tubić, T. (2009). Rodni aspekt nastave fizičkog vaspitanja. Zbornik radova Učiteljskog fakulteta, Užice, (11), 269-276.
5. ðorñić, V., & Tumin, D. (2008). Da li su devojčice 'problem' u nastavi fizičkog vaspitanja? Pedagogija, 63(4), 652-665.
6. Jorgić, B., & Veselinović, N. (2008). Izostajanje učenika sa časova fizičkog i zdravstvenog vaspitanja u niškim gimnazijama. Nastava i vaspitanje, 57(2), 175-183.
7. Rodić, N. (2010). Savremeno fizičko vaspitanje u razrednoj nastavi. Norma, 15(1), 47-60.
8. Sretenović, Z. (2012). Planiranje nastave fizičkog vaspitanja - izabrani sport. Fizička kultura, 66(1), 57-65.
9. Stamatović, M., & Šekeljić, G. (2011). Efikasnost nastave fizičkog vaspitanja u IV razredu osnovne škole i stručna osposobljenost nastavnika. Nastava i vaspitanje, 60(4), 703-717.

296

297
DIFFERENCES IN CHARACTERISTICS OF
KINANTHROPOLOGICAL STATUS IN STUDENTS AGED 10
TO 12 YEARS
Željka Boban1, Mirjana Milić1, Josefina Jukić1, Petra ðapić-Caput1 and Sandra Baturina2
1 Faculty of Kinesiology, University of Split, Croatia 2 Secondary vocational school “Blaž Jurjev Trogiranin“, Trogir, Croatia
Abstract
Quantitatively defining the kinanthropological status of each student provides an adequate set of information which a kinesiologist can use to properly plan and program the teaching contents, respecting each student as a separate entity in his/her specific moment in growth and development, with the ultimate goal of improving the quality of teaching in physical education classes (Milić et al., 2012).
The aim of this research was to analyze the differences of characteristics in kinanthropological status of male and female students from Zagreb, aged 10 to 12 years.
A sample of 382 subjects was used (203 male and 179 female 5th and 6th grade students of elementary schools in Zagreb) to assess the kinanthropological status by applying 8 variables of initial and final measurement. Significant difference was found by using ANOVA. Levels of statistical significance of differences between male and female students were found by further analysis applying dependent samples t-test on a variable of differences which resulted after arithmetic means of the final measurement had been subtracted from the arithmetic means of the initial measurement.
Coefficient of canonical discrimination of 0.28 and the significance level of 0.00 point to the sexual differentiation of male and female students aged 10 to 12 years.
Discriminant function and group centroids clearly define that female students are dominantly separated from male students in the kinanthropological space.
The results obtained in this research correspond to previous studies investigating the period of changes in growth and development of boys and girls.
Keywords: biomotor status, pre-puberty, sexual differentiation, students
Introduction
The age of 10 to12 represents a period of changes in growth and development of boys and girls. Therefore, motor abilities can still be significantly influenced by different forms and guidelines of educational work in the area of physical education. Systematic measurement of certain motor abilities during the process of motor skill learning represents positive changes in the overall system of the organism, reducing the consequences produced by lack of movement in the contemporary life style.
Quantitatively defining the kinanthropological status of each student provides an adequate set of information which a kinesiologist can use to properly plan and program the teaching contents, respecting each student as a separate entity in his/her specific moment in growth and development, with the ultimate goal of improving the quality of teaching in physical education classes (Milić, Sivrić, ðapić-Caput, & Jukić, 2012).
Due to the fact that the measurement of motor achievement is performed several times during the school year, the results of certain motor abilities can be measured across the time period of the motor skills learning process, initial improvement, advanced improvement, stabilization and automatization of motor skills (Neljak, Milić, Božinović-Mañor, & Delaš-Kalinski,2006).

298
Kinesiologically determined initial status and estimated desired final status of students allow teachers to exactly and quantitatively determine the transitional statuses of students during the year, from the initial to the final status, and at the end, to give a final analysis and evaluation of efficiency of the applied physical exercise program (Marković, 1992).
During a certain life period (age of 7 to 17), organized kinesiological activity with aimed development of motor abilities produces the best effects, and the developmental status, i.e. biological maturity, significantly affects motor performance (Malina, Koziel, & Bielicki, 1999). Girls who mature faster have better results in motor performance than those who enter the phase of maturation slower (age of 11 to13), and differences between the individuals in a population, in terms of motor performance, depend on growth and development, particularly in boys (Beunen, & Malina, 1988).
According to Mišigoj-Duraković (2008), the growth intensity of certain morphological body segments and organs is not the same. During their growth, organs increase not only their mass, but also the structure. The greatest growth increase in girls occurs between the ages of 10 and 14, usually at the age of 12, when girls grow between 6 and 11 cm. As opposed to the growth, which implies an increase of body size, maturation implies the dynamics of changes and progression to biological maturity which significantly affects motor performance (Malina et al., 1999).
Since puberty individually extremely varies in terms of its onset and duration (Mišigoj-Duraković, 1999), there are sometimes greater differences among girls then in actual gender related separation of anthropometric characteristics and functional-motor abilities as well as in psychological and social aspect.
Individuals of the same chronological age can differ significantly in their biomotor status and functional abilities, and therefore physical activity at this age should be expertly programmed and systematically implemented, taking into consideration the proper dosage of physical exercise in order to achieve maximum results, keeping in mind the fact that motor abilities develop at certain age.
Numerous studies have analyzed the kinanthropological status of students and determined the sex differentiation occurring in pre-puberty and puberty, but because of the aforementioned facts, this is still an unexplored area of kinesiological interest in the immediate classroom teaching. The starting point which determines the planning and programming of physical education is precisely the measuring of initial and final status of anthropological characteristics and motor abilities due to the requirement for constant adaptation, over and again, to new and different changes of students’ kinanthropological status in order to satisfy individual biotic needs, improve motor abilities and learn new motor skills.
The aim of the present research was to analyze the differences in characteristics of the kinanthropological status of male and female students from Zagreb aged 10 to 12.
Method
The subject sample consisted of 382 entities, male and female 5th and 6th grade students of elementary school from Zagreb. Two subsamples were defined by 179 female students and 203 male students aged 10 to 12. The total of 8 variables in the initial and final measurement was used to assess the kinanthropological status. The initial measurement was conducted in September, while the final measurement was conducted nine months after that, in June. The measures of anthropometric characteristics were represented by the following variables: body height and body mass. The space of basic motor abilities was defined by a set of 6 tests made of the following variables: standing broad jump for assessing explosive power of horizontal jumping, obstacle course backwards for assessing coordination, crossed-arms sit-ups for assessing repetitive strength, seated straddle stretch for assessing flexibility, bent arm hang for assessing static strength, and 6-min run test for assessing aerobic endurance. All measuring instruments used to register the kinanthropological status of subjects are a constituent part of monitoring and evaluation methodology in the area of physical education.
Methods of data analysis involved calculation of descriptive statistical parameters of the initial and final measurement for male and female students: mean (M), standard deviation (SD), minimum result (Min), maximum result (Max), measure of asymmetry (Skew), measure of distribution peakedness (Kurt) and calculating the MaxD value for determining the normal distribution of variables by KS-test. Analysis of differences between the initial and final measurement in both subsamples and the statistical

299
significance level of differences were analyzed by dependent samples t-test. The obtained variables of differences calculated by subtracting the means of the final measurement from the means of the initial measurement were used for further analysis of differences by ANOVA and for determining the level of statistical significance. By applying canonical discriminant analysis, the coefficient of canonical discrimination was calculated, and group centroids and the significance level were determined, as well as the existence of sex differentiation in the kinanthropological status of male and female students aged 10 to 12.
Results
Table 1 shows results of descriptive statistics of the variable space of kinanthropological status of 179 female students aged 10 to12 in the initial and final measurement. The analysis of distribution parameters indicates that there were no significant deviations from normal distribution in any variable, which means that all variables are suitable for further multivariate statistical analysis. The distribution normality testing was performed by Kolmogorov-Smirnov test with a critical value of 0.13. Somewhat lower distributional features, although within the boundaries of statistical tolerance, were expressed only in the bent arm hang variable, used for assessing static strength of arms and shoulders, in the initial and final measurement, but measures of distribution asymmetry and peakedness indicate there was no significant data scattering. Basic parameters of kinanthropological variables indicate that female students from Zagreb scored higher values in all variables in the final measurement, and it can therefore be assumed that, apart from growth and development, it is also possible to define the effect, i.e., consequences of transformational effects of teaching contents and methods in the immediate work with children, as well as of different undefined kinesiological activities (Table 1).
Table 1 Descriptive parameters of the initial and final measurement of kinanthropological status of female students aged 10 to 12 (N= 179)
Measurement Variable Mean SD Min Max MaxD Skew Kurt Body height (cm) 152.039 7.56 134.00 17.00 0.04 0.07 -0.18
I Body weight (kg) 45.606 10.83 29.00 8.00 0.12 0.97 0.80 N Standing broad jump (cm) 154.274 22.70 100.00 200.00 0.07 -0.06 -0.64 I Obstacle course backwards# 19.387 5.28 9.87 38.01 0.09 0.99 1.06 T Crossed-arm sit-ups (freq.) 33.575 7.72 13.00 50.00 0.06 -0.18 -0.31 I Seated straddle stretch (cm) 69.475 16.47 33.00 110.00 0.05 -0.01 -0.47 A Bent-arm hang (s) 17.827 14.53 0.00 65.00 0.13 1.22 1.06 L 6-min run test 952.158 123.07 760.00 1368.00 0.12 0.87 0.57
Body height (cm) 155.735 7.22 136.00 175.00 0.06 0.05 -0.27 Body weight (kg) 48.628 10.74 30.00 87.50 0.10 0.93 0.83
F Standing broad jump (cm) 160.598 22.05 105.00 220.00 0.08 -0.08 -0.49 I Obstacle course backwards# 17.543 4.73 8.04 37.80 0.09 1.20 2.69 N Crossed-arm sit-ups (freq.) 37.168 7.23 18.00 55.00 0.06 -0.16 -0.25 A Seated straddle stretch (cm) 72.788 17.09 35.00 112.00 0.07 -0.09 -0.62 L Bent-arm hang (s) 21.466 15.07 0.72 67.00 0.13 0.92 0.12 6-min run test 1009.703 125.69 780.00 1371.00 0.07 0.53 -0.09
TEST = 0.13 Legend: N – sample size; Mean – mean; SD – standard deviation; Min – minimum result, Max – maximum result, SKEW – measure of distribution symmetry; KURT – measure of distribution shape; MaxD – coefficient of K-S test, #variable with opposite metric orientation
Female students were averagely 153.70 cm tall, and their mean body mass was 47.11 kg. Croatian standards, according to Milić et al. (2012), indicate that female students in this research did not significantly differ from average values of students in Republic of Croatia in terms of body height (2.00 cm), but they were 4.89 kg heavier. Similar results were obtained in a research conducted by Milić et al. (2012), on a sample of female students from Zagreb. However, female students from Northern Croatia have averagely lower body height and higher body mass than their chronological peers from Dalmatia (Milić, Grgantov, & Katić 2012; Katić, Jukić, & Milić, 2012), and therefore a higher BMI (Body Mass Index).
Descriptive statistics analysis of 203 male students aged 10 to12, presented in Table 2, shows that all variables of kinanthropological space in the final measurement had higher values. Critical value of distribution normality testing by Kolmogorov-Smirnov test, which was 0.11, indicates there were no

300
significant deviations from normal distribution in any variable, and they were all suitable for further parametric statistical analysis.
Croatian standards, according to Milić et al. (2012), indicate that mean body height and mass of male students for this age is 151.2 cm, i.e., 42.5 kg. Male students in this research were 2.12 cm taller and their mean height was 153.32, while their body mass was 45.30 kg, which means they were 2.80 kg heavier. Anthropometric characteristics of these male students match the mean values of their peers from other schools in Zagreb, whose body height was 152.97 cm and body mass 46.39 kg (Milić et al., 2012), and who also had a body mass greater (3.89 kg) than the average of their Croatian male peers.
Male students scored better results and had higher values of variables representing the space of motor abilities, except in the seated straddle stretch which indicated better flexibility of female students.P
Table 2 Descriptive parameters of the initial and final measurement of kinanthropological status of male students aged 10 to 12 (N= 203)
Measurement Variable Mean SD Min Max MaxD Skew Kurt Body height (cm) 151.03 7.86 130.00 170.00 0.05 -0.00 -0.37
I Body weight (kg) 43.53 8.96 22.00 72.00 0.10 0.52 -0.13 N Standing broad jump (cm) 164.15 22.11 100.00 220.00 0.07 -0.15 -0.24 I Obstacle course backwards# 17.82 5.69 9.28 39.95 0.09 1.14 1.47 T Crossed-arm sit-ups (freq.) 36.79 9.89 15.00 63.00 0.09 0.29 -0.48 I Seated straddle stretch (cm) 62.32 15.78 27.00 95.00 0.08 -0.18 -0.88 A Bent-arm hang (s) 25.97 21.03 0.00 106.00 0.13 0.82 -0.06 L 6-min run test 1047.24 153.38 680.00 1378.00 0.06 0.17 -0.47
Body height (cm) 155.61 8.23 133.00 176.00 0.05 -0.03 -0.27 Body weight (kg) 47.08 9.21 25.00 73.00 0.09 0.36 -0.36
F Standing broad jump (cm) 170.70 21.07 110.00 230.00 0.08 -0.21 -0.03 I Obstacle course backwards# 16.17 5.10 9.55 39.90 0.10 1.43 3.02 N Crossed-arm sit-ups (freq.) 41.40 8.94 19.00 64.00 0.04 -0.00 -0.31 A Seated straddle stretch (cm) 65.54 16.23 28.00 100.00 0.08 -0.20 -0.92 L Bent-arm hang (s) 31.56 21.10 0.54 79.00 0.11 0.40 -1.10 6-min run test 1121.10 165.52 740.00 1490.00 0.06 0.02 -0.48
TEST = 0.11 Legend: N – sample size; Mean – mean; SD – standard deviation; Min – minimum result, Max – maximum result, SKEW – measure of distribution symmetry; KURT – measure of distribution shape; MaxD – coefficient of K-S test, #variable with opposite metric orientation
Table 3 shows values of differences in the initial and final measurement of kinanthropological space in male and female students by using dependent samples t-test. There were significant differences in all variables, for the degrees of freedom of df=178 in female students and df=202 in male students, at the statistical significance level of p=0.00.
Male students scored better results and had higher values of variables representing the space of motor abilities, except in the seated straddle stretch which indicated better flexibility of female students. It can be assumed that the obtained results indicating significant progress both in male and female students, were not caused only by growth and development, but they might have also been influenced and caused by properly selected teaching contents and different methodical-organizational work forms of kinesiological education in physical education teaching, as well as by other kinesiological activities which have not been defined in this research.
Table 3 Analysis of differences between male and female students from Zagreb in the initial and final measurement by using dependent samples t-test
Initial measurement Final measurement Students Variable Mean SD Mean SD T-test p Body height (cm) 152.039 7.56 155.735 7.22 -28.10 0.00
F Body weight (kg) 45.606 10.83 48.628 10.74 -22.98 0.00 R Standing broad jump (cm) 154.274 22.70 160.598 22.05 -8-20 0.00 I Obstacle course backwards# 19.387 5.28 17.543 4.73 10.16 0.00
M Crossed-arm sit-ups (freq.) 33.575 7.72 37.168 7.23 -10.25 0.00 A Seated straddle stretch (cm) 69.475 16.47 72.788 17.09 -12.31 0.00 L Bent-arm hang (s) 17.827 14.53 21.466 15.07 -5.73 0.00 E 6-min run test 952.158 123.07 1009.703 125.69 -9.76 0.00
Body height (cm) 151.03 7.86 155.61 8.23 -31.73 0.00 Body weight (kg) 43.53 8.96 47.08 9.21 -27.52 0.00

301
Table 3 Analysis of differences between male and female students (Cont) Initial measurement Final measurement Students Variable Mean SD Mean SD T-test p
M Standing broad jump (cm) 164.15 22.11 170.70 21.07 -9.30 0.00 A Obstacle course backwards# 17.82 5.69 16.17 5.10 11.38 0.00 L Crossed-arm sit-ups (freq.) 36.79 9.89 41.40 8.94 -12.01 0.00 E Seated straddle stretch (cm) 62.32 15.78 65.54 16.23 -13.00 0.00 Bent-arm hang (s) 25.97 21.03 31.56 21.10 -7.97 0.00 6-min run test 1047.24 153.38 1121.10 165.52 -10.50 0.00
Legend: N-sample size; Mean- mean; SD-standard deviation; T-test-coefficient of T-test test; p-level of statistical significance; ; #variable with opposite metric orientation
Variables of differences (VoD) were defined by subtracting the values of final measurement from the values of initial measurement (Table 4).
Table 4 Canonical discrimination analysis and analysis of differences on variables of differences between male and female students aged 10 to 12
ANOVA Variables of differences
F-test p DF
Body height (cm) 15.86 0.00** -0.78 Body weight (kg) 7.64 0.01* -0.50 Standing broad jump (cm) 1.00 0.32 -0.04 Obstacle course backwards# 0.15 0.70 -0.15 Crossed-arm sit-ups (freq.) 5.48 0.02* -0.34 Seated straddle stretch (cm) 0.14 0.70 0.04 Bent-arm hang (s) 4.83 0.03* -0.36 6-min run test 3.42 0.07 -0.78 Wilks' - Lambda 0.92 CanR 0.28 Chi-Sqr 0.31 df 7 p 0.00 Centroids (female students) 0.31 Centroids (male students) -0.27
Legenda: F-test- coefficient of F-test; p-level of statistical significance; DF – discriminant function; CanR – canonical discrimination coefficient; Wilks'-Lambda- coefficient of Wilks-Lambda; Chi-Sqr- coefficient of χ2; df- degrees of freedom; *p<0.01; #variable with opposite metric orientation,
Differences obtained by ANOVA on variables of differences indicate significant differentiation between male and female students in differences of initial and final measurement of anthropometric characteristics. A noticeable difference exists in the space of motor abilities in variables defining repetitive core strength and aerobic endurance. However, in variables of differences of motor abilities, male and female students have equally progressed in measured tests, which can be explained to a certain extent by the same curriculum, i.e., the same enforcer – kinesiologist who had participated in the realization of curriculum contents.
Analysis of differences between the two defined subsamples in variables of differences was performed by canonical discriminant analysis.
Coefficient of canonical discrimination of 0.28 and the significance level of 0.00 indicate the existence of sexual differentiation of male and female students aged 10 to 12.
Discriminant function and group centroids clearly define that male students are dominantly separated from female students within the kinanthropological space (Table 4).
Discussion
All tests applied in this research represent the components of the regulations of assessment and evaluation in teaching. At the beginning of every school year, after determining the initial status, physical education teachers plan and program the curriculum contents for each grade. Transverse measurement must be done during the school year, and final measurement with the purpose of defining the kinanthropological status of each individual student must be done at the end of the school year. Basic parameters of

302
kinanthropological variables indicate that male and female students from Zagreb scored higher values in all variables in the final measurement, and it can therefore be assumed that, apart from growth and development, it is also possible to define the effect, i.e., consequences of transformational effects of teaching contents and methods in the immediate work with children, as well as of different undefined kinesiological activities.
In the morphological space, male and female students aged 10 to 12 do not differ significantly from their Croatian peers in terms of body height and body mass, but their lower body height and higher body mass is noticed in comparison to male and female students from Dalmatia (Milić et al., 2012; Katić et al., 2012; Milić, Grgantov, & Katić, 2012).
According to Neljak (2011), kinanthropological guideline implies a systematic and permanent transformation primarily of morphological, motor and functional characteristics of students. The results of this work are the consequence of growth and development, but there is also a possibility of impact made by planned and systematically selected guidelines, defined by main goals and objectives of primary kinesiological education and kinesiological activity.
The analysis of differences established significant differences in all kinanthropological variables in both male and female students, and by discriminant analysis on variables of differences, a statistically significant function has structurally separated male from female students, who had higher values only in the flexibility test.
The age of 10 to 12 represents a period of changes in growth and development of boys and girls, and this research has confirmed that it is also a period in which it is still possible to affect motor abilities by different forms and guidelines of educational work in the area of physical education.
References
1. Beunen, G.P., & Malina, R.M. (1988). Growth and physical performance relative to the timing oft he adolescent spurt. Exercise and Sport Sciences Reviews, 16, 503-540.
2. Katić. R., Jukić, J., & Milić, M.(2012). Biomotor status and kinesiological education of girls aged 10 to 12 years-example: karate. Collegium Antropologicum, 36(2), 555-562.
3. Malina, R.M, Koziel, S. & Bielicki, T. (1999). Variation in subcutaneous adipose tissue distribution associated with age, seks and maturation. American Journal of Human Biology, 11, 89-100.
4. Marković, G. (1992). Uvod u sistematsku kineziologiju. Zagreb: Kineziološki fakultet.
5. Milić, M., Grgantov, Z., & Katić, R. (2012). Biomotor status and kinesiological education of girls aged 10 to 12 years-example: volleyball. Collegium Antropologicum, 36(3), 959-966.
6. Milić, M., Sivrić, H., ðapić-Caput, P., & Jukić, J. (2012). Analiza spolnih diferencijacija kinantropološkog statusa učenika u dobi od 10 do 12 godina. Zbornik radova 4. Meñunarodni znanstveni kongres „Suvremena kineziologija“, Split (552-559). Split: Kineziološki fakultet.
7. Mišigoj-Duraković, M. (1999). Tjelesno vježbanje i zdravlje. Zagreb: Kineziološki fakultet.
8. Neljak, B. (2011). Osnove kineziološke metodike u osnovnoj i srednjoj školi. Zagreb: Kineziološki fakultet.
9. Neljak, B., Milić, M., Božinović-Mañor, S., & Delaš-Kalinski, S. (2006). Vježbajmo zajedno. Zagreb: Profil.

303
THE INFLUENCE OF DIFFERENT TEACHING CONTENTS
ON THE INTENSITY OF THE INTRODUCTORY PART OF
THE LESSON
Saša Marković1, Srñan Bugarski2, Saša ðurić2 and Marijana Simić3 1 Faculty of Physical Education and Sport, University of Banja Luka, Bosnia and Herzegovina
2 Faculty of Sport and Physical Education, University of Belgrade, Serbia 3 Faculty of Sport and Physical Education, University of Novi Sad, Serbia
Introduction
This research deals with physical education and care in school. Man as a conscious being, while performing any activity, has a certain goal which he realizes by fulfilling various tasks. It is well known that the goals of care and education are closely related to the needs and order of society; society educates individuals in a way they need. By modernization of the means of production, a man with much less physical strength achieves the same or even better results than before. Accordingly, the goal of physical education stops being just a process of creating a physically strong individual who will be able to meet the demands of production. Of course, the importance of the physical activity in the life of a man is not less important. Both industrialization and automatization have led to a situation where a substantial majority of jobs is performed in a constant sitting position. People mainly control the work of machines, so the workload of the central nerve system is enormous. This way of life and work often results in diseases of modern mankind, hypokinesis, and the stress that is usually accompanied by the excessive and inadequate nutrition. If the physical exercise was necessary to our ancestors so they could be able to survive the conditions of that time, today the need to exercise is reflected in the countervailing function in order to compensate the deficit of movement. The fact that the movement of the elderly population is 70 - 80% less than required, has a devastating effect and even the youngest have problems caused by the lack of movement.
Method
The sample of examinees
The research was conducted in the form of a research with a group of students.The sample in this research represent 23 students in the ninth grade of the primary school ''Stanko Rakita" from Banja Luka - 11 girls and 12 boys.
The sample of variables
The sample of variables are the following parameters:
1. The heart rate, which was measured before and after the experimental program
2. The initial state (heart rate of each student in the state position).
3. The heart rate after the finished work (save the ball, chain, in pairs, on one leg, saving the ring, running across the width of the gym with some tasks, running in a circle with the tasks, running through the corridor with some tasks, running through the polygon with some tasks, free warming-up) .
In this study, the following activities (exercises) were used: Catching objects: save the ball, chain, in pairs, on one leg, the salvation ring. Other exercises (running with some tasks): running across the width with some task, running in a circle with some tasks, running through the corridor with some tasks, running through the polygon with some tasks, free warming-up.

304
Data processing
Data collected during the research were analyzed by using both descriptive and comparative statistics.
1. The importance of descriptive statistics is, in addition to learning about the central parameters, to remove the possible errors made during the measuring or recording the results.
2. Comparative statistics is used to determine any difference in the heart rate that occurred as a consequence of different contents of the introductory part of the lesson.
From the space of descriptive statistics, at the level of the entire sample firstly were set:
* The arithmetic mean (M)
* Variational width (Max-Min)
* Standard deviation (S)
* The coefficient of variation (V)
From the space of a comparative statistics the following procedures were used:
* Anova
* T-test for the independent samples
For the selection of procedures, control of the distribution of results was made by using the K-S test.
All statistical calculations will be carried out by using the statistical software application for PCs SPSS. Microsoft Excel will be used for creating the graphic illustrations.
Results
Taking into account that the aim of this study was to determine the difference in the workload between different educational contents, as well as the differences between girls and boys, the statistical procedures that are appropriate to this issue were done.
Table 1. Representative statistical parameters calculated from the results of measurement of the heart rate of students with different teaching contents of the introductory part of the lesson
Contents N Min Max AS SD KV
IS 23 60 88 73,22 10,45 0,14
SAVE THE BALL 23 100 180 143,26 22,38 0,15 CHAIN 23 100 180 150,17 22,09 0,14
IN PAIRS 23 116 168 140,26 15,00 0,10
ON1LEG 23 136 200 167,04 17,70 0,10
RINGS 23 136 190 159,39 15,69 0,09
THE WIDTH 23 112 200 160,39 22,01 0,13
IN A CIRCLE 23 132 184 159,48 15,25 0,09
CORRIDOR 23 132 172 153,91 9,73 0,06
POLYGON 23 156 196 176,13 11,86 0,06
FREE WARMING 23 120 168 137,17 12,45 0,09
Looking at the table or the coefficient of variation, we can say that the sample is homogeneous. High values of the heart rate after the activities is probably due to poor physical fitness of students which is a product of today's lifestyle. This should be taken into account while planning and programming the physical education lessons.
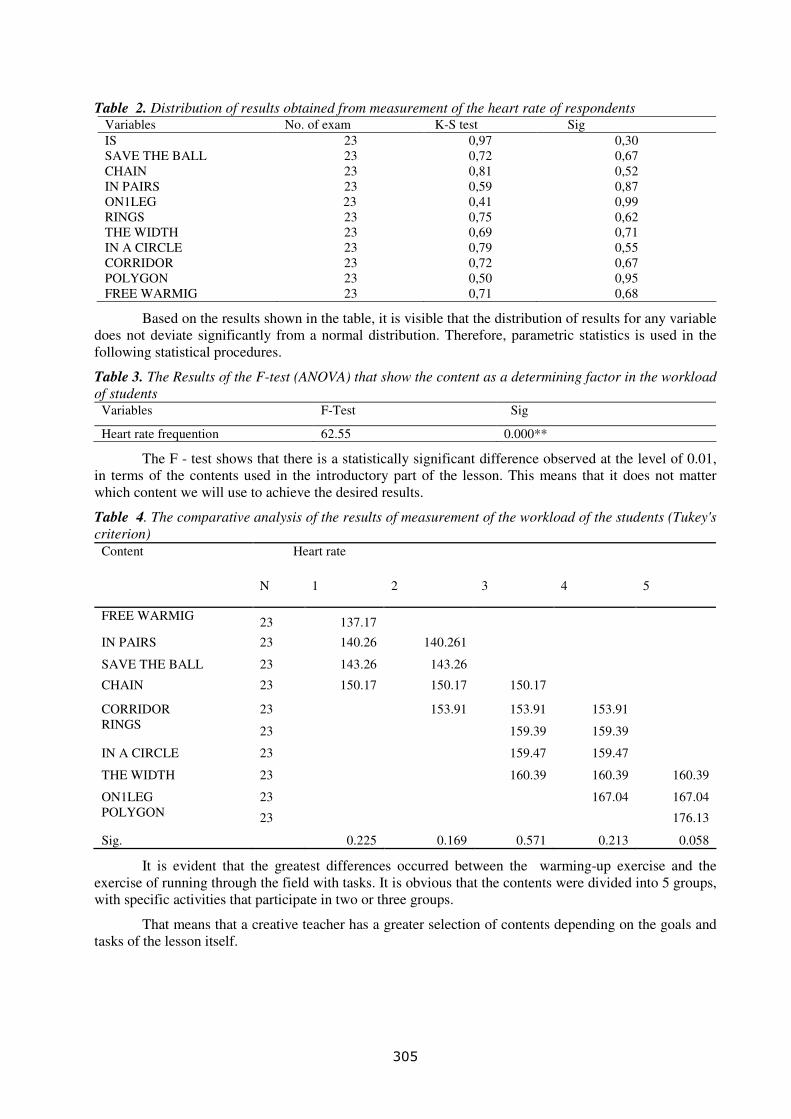
305
Table 2. Distribution of results obtained from measurement of the heart rate of respondents Variables No. of exam K-S test Sig IS 23 0,97 0,30 SAVE THE BALL 23 0,72 0,67 CHAIN 23 0,81 0,52 IN PAIRS 23 0,59 0,87
ON1LEG 23 0,41 0,99 RINGS 23 0,75 0,62 THE WIDTH 23 0,69 0,71 IN A CIRCLE 23 0,79 0,55 CORRIDOR 23 0,72 0,67 POLYGON 23 0,50 0,95 FREE WARMIG 23 0,71 0,68
Based on the results shown in the table, it is visible that the distribution of results for any variable does not deviate significantly from a normal distribution. Therefore, parametric statistics is used in the following statistical procedures.
Table 3. The Results of the F-test (ANOVA) that show the content as a determining factor in the workload of students
Variables F-Test Sig
Heart rate frequention 62.55 0.000**
The F - test shows that there is a statistically significant difference observed at the level of 0.01, in terms of the contents used in the introductory part of the lesson. This means that it does not matter which content we will use to achieve the desired results.
Table 4. The comparative analysis of the results of measurement of the workload of the students (Tukey's criterion)
Content Heart rate
N 1 2 3 4 5
FREE WARMIG 23 137.17
IN PAIRS 23 140.26 140.261
SAVE THE BALL 23 143.26 143.26
CHAIN 23 150.17 150.17 150.17
CORRIDOR 23
153.91 153.91 153.91
RINGS 23 159.39 159.39
IN A CIRCLE 23 159.47 159.47
THE WIDTH 23 160.39 160.39 160.39
ON1LEG 23 167.04 167.04 POLYGON 23 176.13
Sig. 0.225 0.169 0.571 0.213 0.058
It is evident that the greatest differences occurred between the warming-up exercise and the exercise of running through the field with tasks. It is obvious that the contents were divided into 5 groups, with specific activities that participate in two or three groups.
That means that a creative teacher has a greater selection of contents depending on the goals and tasks of the lesson itself.

306
Figure 1. Preview of the relationships of the arithmetic mean of the heart rate of students in different parts of the introductory part of the lesson
Table 5. Representative statistical parameters calculated from the results of measurements of the heart rate of boys and girls at different contents of the introductory part of the lesson
BOYS GIRLS
M SD KV M SD KV
IS 68.16 8.02 0.11
78.72 8.02
0.10
SAVE THE BALL 137.16 22.44 0.16 149.9 21.32 0.14 CHAIN 140 24.73 0.17 161.27 11.87 0.07 IN PAIRS 132.33 10.26 0.07 148.9 14.89 0.1 ON1LEG 160.5 18.78 0.11 174.18 13.92 0.07 RINGS 154.16 12.83 0.08 165.09 17.09 0.10 THE WIDTH 157.41 19.28 0.12 163.63 25.2 0.15 IN A CIRCLE 157.16 15.96 0.10 162 14.77 0.09 CORRIDOR 153 9.96 0.06 154.9 9.85 0.06 POLYGON
171.33 11.09 0.06
181.36 10.79
0.05 FREE WARMING 132.08 9.57 0.07 142.72 13.24 0.09
Since the tested classes were mixed, it was interesting to determine whether there is a difference in the workload caused by the sex of subjectsAll of this in the analysis of the sample as a whole can be said in this case, too.Descriptive statistics showed us the value of the basic measures of dispersion, but it did not provide an answer to the question whether there is a difference in the workload between boys and girls. Therefore, it was used the T - test procedure for the independent samples.
Table 6. Comparative study of the difference on the workload between boys and girls Variables T- test Sig
IS -0,272 0,013
SAVE THE BALL -1,139 0,177
CHAIN -2,663 0,017
IN PAIRS -3,081 0,007
ON1LEG -1,995 0,060
RING -1,721 0,102
THE WIDTH -0,660 0,517
IN A CIRCLE -1,507 0,148
CORRIDOR -0,462 0,649
POLYGON -2,197 0,004
FREE WARMING -2,191 0,042

307
From the table we can see that there is a statistically significant difference between the boys and girls, as follows:
1.At the 0.05 level for the following activities:
Initial state,catching the chain, free warming-up
2.At the 0.01 level for the following activities:
in pairs and polygon method
3. The difference did not appear on the following activities:
Save the ball, On 1 leg, Width In a circle, Through the corridor, ring rescue
Discussion
The main goal of this research was to determine whether there is statistically significant difference in the workload of students in different contents of the introductory part of the lesson. After completing the research it is noted that between the observed contents there is a statistically significant difference when it is a matter of the workload of students.
There are also some contents whose influences on the students' workload are very similar. Based on these results, it is possible to form several groups of activities, which can be used depending on the goals of the main part of the lesson, which is certainly a practical significance and contribution to this research. The theoretical importance of the research are knowledge and experience, which can be of a great help to the author of this work and to the other authors in the similar projects as well.
One of the reasons for the increased heart rate at some students can certainly be emotional and psychological burden of students, which again can be attributed to the offered contents. In any case, whether the results are due to physical, emotional or psychological burden, it is noticed a statistically significant difference in the workload of the students caused by a variety of contents. This certainly supports the claim that the workload is in a strong conjunction with the teaching contents. As for the difference in load between boys and girls, it can be seen that the activities that by the rules require greater involvement of students, there is a statistically significant difference. We can conclude that girls had a higher frequency of the heartbeat. Taking into account that the similar case was also present in the initial state, this result is logical. Little illogical at first glance appears at the contents where there is no a statistically significant difference between boys and girls, but it was told that it was evident in the initial state. Taking into account that the activities where the mentioned case appears are such that students are not "forced" by the rules to greater activity, but also they have the opportunity to dose their commitment by themselves. It is reasonable to expect that the girls had calculated when performing given tasks and did not engaged themselves completely.
References
1. Berković, L. ( 1978 ). Metodika fizičkog vaspitanja. Beograd
2. Dragosavljević, P. ( 2005 ). Savremena nastava fizičkog vaspitanja i sporta. Banja Luka.
3. Marinković, A. i Stanojević, I. ( 1969 ). Priručnik iz fizičkog i zdravstvenog vaspitanja. Beograd
4. Marinković, A. i Petrović, D. ( 1971 ). Fizičko vaspitanje za III i IV razred. Beograd.
5. Pallant, J. ( 2007 ). SPSS – priručnik za preživljavanje.
6. Perić, D.(2001). Statistika primjenjena u sportu i fizičkom vaspitanju. Beograd.
7. Perić, D.(2006). Metodologija naučnih istraživanja, Beograd.
8. Tomić, D. ( 1969 ). Hvatalice. Beograd.
9. Višnjić, D. ( 1996 ). Nastava fizičkog vaspitanja. Beograd

308

309
APPLICATION OF “FUNCTIONAL” METHOD IN TRUNK
MUSCLE STRENGTH DEVELOPMENT IN PRIMARY SCHOOL
SEVENTH FORM STUDENTS
Miroslav Marković1, Dragoljub Višnjić2 and Živorad Marković3
1 Institute of Improvement Education of the Republic of Serbia, Belgrade, Serbia 2 Facylty of sports and physical education u Belgrade, Serbia
3 Teachers college, Jagodina University of Kragujevac, Serbia
Introduction
Strength is the ability of a person to overcome outer resistance with muscle contractions or to oppose to such a resistance.
In physical education, the strength development belongs to the first thematic area of the physical education curriculum (“the development of physical abilities”). It is believed that strength is a dominant motor ability because it enables all movements of a person. “Strength is an ability of an individual to develop the muscle strength,” (Barrow, H., McGee, R., 1975).
There are many methods for strength development:
- Maximum exertion method
- Repetitive exertion method (load 70-80% of maximum)
- Dynamic exertion method (develops speed and explosive strength)
- Plyometric method (uses eccentric contractions for strength development)
- Method of isometric exertion (“static mode” – plank position)
At the primary school age, the exercises most often used for strength development are repetitive exercises (the dynamic mode), dynamic rapid movements aimed at the explosive strength development, and, to a lesser extent, a static mode – planks. In developing strength at this age, not only modes for strength development, but also (outer) loads when performing strength exercises are taken into account. The choice of exercises must bedictatedby the students’ age.
This paper of experimental character checks the possibility and purposefulness of “functional method” application in strength development of the seventh form primary school students. “Functional strength development method” has widely been applied in the physical medicine at rehabilitation of convalescents and athlete training after injury. The verification of application of this method and its effects in physical education of the seventh form primary school students was done in this paper.
This method has been taken from the field of physical therapy and rehabilitation medicine – it enables the patient to regain all functions faster thanusing current methods and is characterized by substantial involvement of proprioreceptors (Gary Gray, C. M. Norris).
Functional method activates proprioreceptors, which further activate deep layers of muscles and joint binding tissue. The method has proved to be effective in preventing injury and in the post-injury rehabilitation. In some cases, the recovery is shortened by 30%
George Cook confirmed the justification of the functional method of strength development application in tests in his study “Functional training for the torso”, published by the NSCA (National Sports Academy California) in its journal in 1997. These studies were confirmed by Mc. Gill, Champaign. Il. 2002, Low back disorders, Human Kinetics.

310
Michael Boyle has applied this method in work with elite athletes. Papers show that the time for developing strength was reduced in comparison to other methods.
In physical education and sport, this is training for developing strength of deep stabilizer muscles (core muscles).
In physical education the most often used method for the development of muscle strength of the trunk (abdominal, back, chest and shoulder) is the method of dynamic stress (repetition method).
The study investigated the possibility of strength development of the said muscle groups with a new - “functional” method in physical education.
In foreign literature, this method is called Core performance, while here some also call it PNF method of proprioceptive neuromuscular facilitation.
Many authors believe that this method of strength development is more economical and faster for developing strength, both in schoolchildren and in athletes and fitness enthusiasts.
Method
The research was a type of pedagogical experiment that lasted one term. The sample of respondents, defined as appropriate, comprised of the seventh grade primary school students and divided into the experimental and control groups. The experimental group comprised 100, while a control group comprised 80 students. Both experimental and control groups were divided by gender. “Functional method” of strength development was systematically applied in the experimental group. The dynamic method – repetitive stress (repetitive strength development) was applied in the control group.
At the initial and final measurement, the students were tested with elements of Eurofit battery and IPFT test: trunk bent forward for 30 seconds (repetitive abdominal muscle strength), PCR - DTE – test (repetitive back muscle strength), push-ups on a chair for 30 seconds (repetitive thorax-shoulder and arm extensor strength test).
The experimental group was doingstrengthexercises 4 months 3 times a week during the last part of the main phase of the lesson: plank position on forearms (Figure 1), plank position on the ball or medicine ball or side plank (Figure 2);
Figure 1 Figure 2
Shoulder stand with bent knees up to 90 degrees; sit ups from the lying position with shoulder blades raised and kept in the raised position, legs bent in hips and knees; dead lift with a ball; dead lift with a ball while standing on one leg; raising to the bridge on shoulder blades; bent kneebridge on shoulder blades; diagonal lift of a ball or a medicine ball.
All exercises were done in two series of 30-45 seconds. Two demonstration exercises were performed for students to understand how they should be done.
In the same period of time, the control group was doing the following exercises 3 times a week: forward trunk bending to 45 degrees; flat lying leg raise up to 45 degrees; sitting leg stretch; swimming – raising the opposite arm and leg while lying on the floor; back hyperextension with the hands on the floor and performing breast stroke movements, chest lifted off the floor;raising the ball in standing position up to the forehead, arms stretched forward; push-ups on a bench or on the Swedish ladder; side-arm raises.

311
Three series of 15-20 repetitions were done in the same phase of the lesson, the same as at the experimental group.
The obtained results were processed by the elements of descriptive statistics; t-test for dependent samples and t-test for independent samples were also used.
Results
The results of the research are given in tables.
Table 1. Descriptive statistics at the final measuring for both groups of 7th form male students GROUP CONTROL (N = 86) EXPERIMENTAL (N = 100)
VARIABLES M SD MIN MAX M SD MIN MAX
R.S.T.M.* 23.71 3.65 15.00 33.00 26.43 5.60 13.00 39.00
R.S.L.M.* 40.56 6.93 23.00 55.00 39.33 6.90 27.00 55.00
R.S.R. and R.P.* 15.85 2.97 7.00 23.00 16.63 3.48 9.00 26.00
Т.V.* 168.31 6.70 155.00 190.00 166.14 7.90 150.00 191.00
Т.М.* 56.83 8.73 40.00 72.00 54.49 10.95 33.50 92.00
BMI* 20.00 2.14 15.06 25.21 19.58 2.45 13.59 25.35
*R.S.T.M. (repetitive abdominal muscle strength), *R.S.L.M. (repetitive back muscle strength), *R.S.R. and R.P. (repetitive thorax-shoulder and arm muscle strength), *Т.V. (body height), *Т.М. (body mass),*BMI (body mass index).
Table 2. Results of t-test for independent samples for comparison of the final measuring for both groups of 7th form male students
Levene's Test for Equality of Variances
t-test for Equality of Means
F Sig. t df Sig. (2-
tailed) MeanDifference
Std. Error Difference
95% Confidence Interval of the
Difference
Lower Upper
R.S.T.M. 8.736 0.004 -
3.974 172.109 0.000 -2.720 0.680 -4.070 -1.370
R.S.L.M. 0.005 0.944 1.207 179.594 0.229 1.230 1.020 -0.780 3.240
R.S.R. and R.P. 0.904 0.343 -
1.651 183.987 0.100 -0.780 0.470 -1.710 0.150
Т.V. 3.087 0.081 2.032 183.970 0.044 2.174 1.070 6.301Е-
02 4.285
Т.М. 4.753 0.031 1.621 182.981 0.107 2.341 1.444 -0.508 5.189 BMI 1.838 0.177 1.237 183.943 0.218 0.416 0.336 -0.247 1.079

312
Table 3. Descriptive statistics at the final measuring for both groups of 7th form female students GROUP CONTROL (N = 79) EXPERIMENTAL (N = 101)
VARIABLES М SD МIN МАX М SD МIN МАX
R.S.T.M. 18.80 3.75 10.00 28.00 22.78 3.73 14.00 34.00
R.S.L.M. 33.84 6.13 20.00 49.00 36.50 9.09 13.00 58.00
R.S.R. and R.P. 13.25 3.61 6.00 21.00 14.19 3.58 6.00 25.00
Т.V. 162.44 6.98 145.00 172.00 161.00 6.22 145.00 177.00
Т.М. 53.04 8.99 34.00 68.00 51.85 9.54 16.50 72.00
BMI 20.08 9.00 13.28 27.85 19.96 3.09 6.10 28.92
Table 4. Results of t-test for independent samples for comparison of the final measuring for both groups of 7th form female students
Levene's Test for Equality of
Variances t-test for Equality of Means
F Sig. t df Sig. (2-
tailed) MeanDifference
Std. Error Difference
95% Confidence
Interval of the Difference
Lower Upper R.S.T.M. 0.600 0.439 -7.097 167.307 0.000 -3.980 0.560 -5.090 -2.880
R.S.L.M. 18.711 0.000 -2.348 174.445 0.020 -2.670 1.140 -4.910 -0.430
R.S.R. and R.P. 1.152 0.285 -1.731 167.107 0.085 -0.930 0.540 -2.000 0.130 Т.V. 1.179 0.279 1.443 157.519 0.151 1.443 1.000 -0.532 3.418 Т.М 0.049 0.825 0.863 171.923 0.389 1.198 1.387 -1.540 3.936 BMI 0.000 0.988 0.275 169.858 0.783 0.126 0.456 -0.775 1.026
Discussion
T-test for independent samples (tables 1 and 2),the comparison of the final measurement of the groups of boys,(control N=86 and experimental N=100), shows that there are statistically significant differences in variables: Repetitive abdominal muscle strength – male students of the control group had a lower score (М = 23.71; SD = 3.65) in comparison with the students of the experimental group (М = 26.43; SD = 5.6) – t = -3.974; p < .000 at the final measuring.
Isometric back muscle strength – male students of the control group had a lower score (М = 19.76 ; SD = 5.22) in comparison with the students of the experimental group (М = 23.63; SD = 5.85) – t = -4.762; p < .000 at the final measuring.
Body height – male students of the control group were in average taller (М = 168.31; SD = 6.7) than the students of the experimental group (М = 166.14; SD = 7.9) – t = 2.032; p < .044 at the final measuring.
T-test for independent samples (table 83) – the comparison of the final measuring of the group of girls, shows that there are statistically significant differences in variables:
Repetitive abdominal muscle strength – female students of the control group had a lower score (М = 18.8; SD = 3.75) in comparison with the students of the experimental group (М = 22.78; SD = 3.73) – t = -7.097; p < .000 at the final measuring.
Repetitive back muscle strength – female students of the control group had a lower score (М = 33.84; SD = 6.13) in comparison with the students of the experimental group (М = 36.5; SD = 9.09) – t = -2.348; p < .020 at the final measuring.

313
Conclusion
The application of the functional method had better effects in variables repetitive abdominal muscle strength and isometric back muscle strength at the sub-sample of students.
Better effects in functional method application are proved at female students when repetitive
strength of abdominal and back muscles is in question.
Functional method of strength development is applicable in work with the surveyed age group.
Functional method of strength development is primarily based on the strength of deep muscles of abdominal and back musculature.
This method is easy to make an exercise more or less difficult depending on the students' abilities. More muscle groups can be treated.
At the same time more muscle groups are treated, which is conditioned by the body position that provokes their activation.
A student is completely focused to the performance of exercises – smaller possibility of incorrect performance.
Exercises are interesting to students.
Functional method of strength development has already been applied in schools in the USA and some Western European countries.
The results of strength development are visible very soon, which is motivating for students.
Functional method in some of its exercises comprises all three types of muscle contractions (static, eccentric, concentric) that contribute to faster muscle strength development.
The strength of trunk muscles is important in the process of growth because it enables the proper body posture and decreases the possibility of formation of spinal deformities. Exercises that are used belong to the group of complex exercises (more muscle groups are engaged simultaneously) which is important for muscle groups that encircle the spine.
The obtained results are in favour of functional method application in students' strength development.
This paper is the result of the project „Improving the quality and accessibility of education in modernization processes in Serbia” No 47008 (2011-2014), financially supported by the Ministry of Education and Science of the Republic of Serbia.
This paper is part of the project„The effects of physical activity application to locomotor, metabolic, psychosocial and educational status with population of the Republic of Serbia“No III47015 (2011-2014) financially supported by the Ministry of Education and Science of the Republic of Serbia.
References
1. Barov, H. i Mek Dži, R.(1975). Меrenje u fizičkomvaspitanju. Beograd: VukKaradžić.
2. Boyle, M. (2003). Functional Training for Sports. Champaign IL: Human Kinetics.
3. Boyle M. (2004). Functional training. Human Kinetics.
4. Norris, C.M. (2003). Functoinal load abdominal training. Journal of Bodywork and Movement Therapies, 29-30.
5. Cook G. (1997). Functional training for the torso. NSCA (National Sports California Academy).
6. Мc. Gill. ( 2002.) Low back disorders.Human Kinetics. Champaign. Il.
7. Vestegen, M. (2005). Core preformance.NSAM
8. Višnjić D. i sar. (2004). Teorija i metodika fizičkog vaspitanja. Beograd: FSFV.
9. Stoiljković, S. i sar. (2005). Fitnes. Beograd: FSFV.

314

315
HIGH SCHOOL STUDENTS' ATTITUDES AND INTERESTS
TOWARD SPORTING ACTIVITIES AND PHYSICAL
EDUCATION SYLLABUS CONTENT
Daria Farkaš1, Branko Jovanovac2 and Zvonimir Tomac3
1 August Šenoa Elementary School, Osijek, Croatia 2 Osijek School of Applied Arts and Design, Osijek, Croatia
3 Teacher Education, University of Osijek, Croatia
Abstract
Objective: To examine attitudes towards sport and physical activity in relation to gender and type of school and determine the preferences of students of different gender and type of school towards P.E. syllabus content. Participants: Sample of 275 students (116 female and 159 male), age of 14-18 years from 3 different schools. Instruments: Adapted anonymous questionnaire. Procedure: Basic statistical parameters, t-test, and ANOVA, Scheffe. Results: Male students have a more positive attitude towards sport and physical training of the female students, and significant differences in attitudes towards sports and physical exercise with regard to the type of school, with the most positive attitude stated by students of Grammar School of Science and Mathematics. Furthermore, differences by gender and type of school in preferences towards syllabus P.E.'s are also present. The study suggests the need for individualized P. E. curriculum based on gender and diversity of the profession.
Keywords: preferences, physical activity, students.
Introduction
It is widely known that health is a state of complete physical, mental and social well-being and not merely the absence of disease (WHO). In modern life, stress, hypokinesia, improper diet and other unhealthy factors are abundant, which inevitably entail many negative effects on the human organism, such as various deformations of locomotor, respiratory and cardiovascular systems, excessive proportion of adipose tissue and many others. Scientific studies conclusively show that physical inactivity is now one of the strongest factors of health damage (Markuš et al. 2008). The modern way of life, with the aforementioned shortcomings, affects not only adults, but children as well. School-age children are burdened with homework, so they mostly spend their after school hours practicing a sedentary lifestyle. The development of technology has led children to spend their free time socializing and sitting in front of computers. The question of a child’s free time is no longer just a matter of leisure, occupation, fun and entertainment, but is a question of survival of the man in the radically changed conditions of life. Therefore, the proper concern about a child’s free time becomes the foundation of a habit that will become part of the individual to the extent that it can determine his life (Prskalo 2007). By doing systematic, scientifically founded exercises, we can significantly influence not only the regulation of morphological, motor and functional characteristics, but to a large extent, regulation of cognitive functions and the conative dimensions responsible for the modalities of behavior and effective socialization of young people in terms of life and work. With professionally designed activities that are kinesiological we can have a simultaneous impact on large number of human characteristics, which is very rare in any other type of human activities. Therefore, the creation of habit to properly use leisure time, dedicated to exercising and physical activity, becomes a primary educational task of kinesiology (Prskalo 2007).
Many studies so far have shown that disturbing number of children do not have a habit of exercising during their free time and that the interest in physical activity decreases with age (Škrinjarić et

316
al. 2008, Markuš et al. 2008, Fučkar et al. 2001, Prot et al. 2001). There is also a statistical significance in the interests of boys and girls, as well as the difference in the interests of physical activity contents (Petračić et al. 2010, Biletić et al. 2008, Markuš et al. 2008, Škrinjarić et al. 2010, Troš-Bobić et al. 2008). Some studies even show that quite a large number of students are not interested in P.E. course altogether (Markuš et al. 2008, Fučkar et al. 2001, Prot et al. 2001).
Research conducted at Medical High School in Osijek showed that there is an awareness of the importance and need for physical activity and exercise among students, but regardless of that fact, some of them do not exercise regularly - only 42,6% of girls and 68,25% of students practice some form of regular physical activity during their free time (Škrinjarić et al. 2008). A study conducted in three secondary schools in the city of Čakovec has shown that as much as 21% of students don’t want to engage in any kind of physical activity (Markuš et al. 2008).
A study conducted among students of the Faculty of Science in Zagreb showed that 48.9% of the students are not interested in having physical education during the study (Fučkar et al. 2001). Even more alarming are data obtained at the Faculty of Pharmacy and Biochemistry in Zagreb, where as many as 75.7% of students said that they were not interested having physical education as an elective course in their senior years (Prot et al. 2001).
Research on primary school-age children demonstrates that girls incline more toward individual and non-competitive activities, while boys for team sports (Troš- Bobić et al. 2008). A study conducted on students in elementary schools of Pula and Poreč demonstrates that male students preferred categories like jumps (64%), team sports (59,9%), suspension, gymnastic elements, climbing (52,5%), while most female students prefer dance in the physical education curriculum (66,3%), followed by balancing positions (50,7%), and then team sports (47,6%) (Biletić et al. 2008). Senior year students in Čakovec displayed difference of interests in P.E. content. The male students have shown the greatest interest for sport games, cycling, swimming, and skiing. On the other hand, the female students showed the most interest for fitness, dancing and cycling (Markus et al. 2008). A research conducted on high school students of Medical School in Osijek confirmed the previously mentioned preferences, i.e. that female students prefer dancing and balance exercises, followed by sport games, while male students prefer sport games, jumps, suspensions and gymnastic elements i.e. exercises that require strength (Škrinjarić et al. 2010). Students of the Faculty of Teacher Education in Zagreb also show increased interest of female students for dancing and different types of aerobic exercises (Petračić et al. 2010). Research conducted at five high schools in Zagreb shows that on the question: What do you think about physical education, nearly 19,7% of girls responded with: I would like if I did not have to take that class (Neljak et al . 2007).
Research objectives
This paper wants to record and present the attitudes of male and female students towards sports and physical activities, students' preferences towards the physical education (P.E.) syllabus, and to identify differences, if any, between them according to gender and type of school. In accordance with the subject of this research, we can also derive some specific interdependent objectives. Objective 1: to examine attitudes towards sport and physical activity in relation to gender and type of school. Goal 2: to determine the preferences of students of different gender and type of school towards P.E. syllabus content.
Given the previous research, and based on the defined objectives, the following hypotheses were set: H1: there will be differences, according to gender and type of school, in the attitudes toward sport and physical activities, and H2: there will be differences, according to gender and type of school, in students' preferences for different P.E. course content.
Method
Subjects:
The research was conducted on a sample of 275 students (116 female and 159 male), between the ages of 14-18 years. The subjects were attending one of the 3 different schools: Grammar School of Science and Mathematics (N=82), School of Electrical Engineering (N = 97), School of applied arts and design (N = 96).

317
Instruments:
For the purpose of this research, the data was gathered via adapted anonymous questionnaire. The questionnaire contained a list of 12 questions that test students' attitudes toward sport and physical activities, and a list of 18 P.E. syllabus contents which represent the preference of students to different P.E. syllabus. Students answered the questions by using Likert scale.
Procedure:
Basic statistical parameters (mean, mode, frequencies, percentages), t-test, and ANOVA, Scheffe were used to analyze the data.
Results and Discussion
The question Do you think that practicing any kind of sport is beneficial? generated no statistical significance among male and female students, i.e. both sexes consider that practicing any kind of physical activity is beneficial (male students M = 4,46, female students M = 4,37, t =, 756 , p = 4). However, there is a statistical significance in examining students' attitudes towards sports and physical activity. Male students have more positive attitude than female students (Table 1.). These results are not unexpected given the past research, which has shown that boys are more physically active than girls (Škrinjarić et al. 2008.).
Table 1. Differences in students' attitudes towards sport and exercise M SD df t-test p MALE 50,14 10,361 272 4,656 0,00 FEMALE 43,54 13,074
p<,05
Except gender, differences in attitude towards sports and physical activities in different schools were tested (Grammar School of Science and Mathematics, School of Electrical Engineering, School of applied arts and design). The results showed a statistical significance in attitudes of students attending the three schools, where the most positive attitude towards sport and physical activity was found in School of Electrical Engineering (EE), followed by Grammar School of Science and Mathematics (MAT) and finally in School of applied arts and design (ARTS). (Table 2.).
Table 2. Analysis of variance F-ratio df p M
STUDENTS ATTITUDE
19,883 2 0,00** ARTS 42,09
Scheffe Mean difference p MAT 47,63
MAT -5,536 0,05* ARTS EE -10,216 0,00**
MAT EE 4,680 0,02* EE 52,31
**p<.01 *p<,05
Upon question Do you consider testing motor abilities useful and Do you understand the purpose of testing motor abilities, the most common answer male students gave was 4 (mostly yes), unlike of female students who answered with 3(medium). Given answers were expected considering the more positive attitude towards sports and physical activities in general. On the same question, differences were determined in responses of male and female students from different schools, whereby students of School of applied arts and design considered less useful testing motor skills unlike of students in Grammar School of Science and Mathematics and School of Electrical Engineering. From the results obtained in preferences for different content in P.E., it is evident that there are differences in gender preferences for male and female students towards syllabus content (Table 3.). Male students show greater preference to following syllabus contents: playing handball, structural elements of football game, playing football, table tennis, motor ability development exercises such as strength, quickness and flexibility and the least for dance like structures. While there is medium preference for all other activities. On the other hand, female students have more preference for playing volleyball and its structural elements, playing handball,

318
badminton, table tennis, dance, motor ability development exercises such as strength, quickness and flexibility, and the least for structural elements of football game. While there is medium preference for all other activities. The results given in the experiment can be explained by popularity of each sports such as football and handball and its availability to pursue the leisure. A plausible explanation for why the students are more likely to prefer exercises for motor ability improvement is its identification with nowadays popular ‘’healthy life’’ fitness programs. There's no significant differences in table tennis and motor ability development exercises such as strength, quickness and flexibility between gender.
Table 3. Students’ tendencies towards P.E. teaching contents Spol MOD M t-test df p
M 3 2,80 Elements of volleyball
F 5 3,47 -3,947 273 0,00**
M 3/4 2,94 Game of volleyball
F 5 3,65 -4,007 273 0,00**
M 3 3,45 Elements of basketball
F 3 2,95 3,222 273 0,01**
M 4 3,58 Game of basketball
F 3 2,97 3,816 273 0,00*
M 4 3,49 Elements of handball
F 3 3,00 2,946 273 0,03*
M 5 3,60 Game of handball
F 5 3,10 3,037 273 0,03*
M 5 3,83 Elements of football
F 1 2,44 8,340 273 0,00**
M 5 4,00 Game of football
F 1 2,56 8,441 273 0,00**
M 3 3,17 Elements of athletics – running
F 3 2,81 2,210 273 0,02*
M 3 3,25 Elements of athletics – jumps
F 3 2,92 2,090 273 0,03*
M 4 3,17 Elements of athletics – throws
F 3 2,81 2,329 273 0,02*
M 3 2,99 Badminton
F 5 3,87 -5,154 273 0,00**
M 5 2,04 Table tennis
F 5 3,38 0,131 273 0,89
M 1 1,93 Dance structures F 5 3,59
-9,521 273 0,00**
M 5 3,93 Exercises for motor ability development - strength F 4 3,12
3,853 273 0,00**
M 5 3,92 Exercises for motor ability development - quickness F 4 3,34
4,529 273 0,00**
M 5 3,83 Exercises for motor ability development - flexibility
F 5 3,22 0,399 273 0,69
Data analysis and processing were differences in the preference of different P.E. teaching contents given by the students of the attended school (Table 4.). Activities for which subjects of all three schools showing the most interest are the exercises to develop motor abilities - quickness, strength and flexibility, while showing the slightest interest in dance structure. In addition, students of Grammar School of Science and Mathematics most prefer table tennis, badminton, football game and its elements, handball game and its elements and the game of volleyball. Furthermore, students of Electrical Engineering school prefer playing football and its elements while badminton and volleyball game state that would not have practiced. Students of School of applied arts and design say that they would be happy to deal with the game of volleyball, play basketball, badminton and table tennis, while not generally practiced elements and playing handball, elements and playing football, athletics elements of throwing. Results given strongly indicate the need for making more individualized programs for each type of school.

319
Table 4. Difference in P.E. syllabus content preference in students of different schools School MOD
Grammar School of Science and Mathematics 4 Electrical Engineering school 3 Elements of volleyball School of applied arts and design 3 Grammar School of Science and Mathematics 5 Electrical Engineering school 1 Game of volleyball School of applied arts and design 5 Grammar School of Science and Mathematics 4 Electrical Engineering school 3 Elements of basketball School of applied arts and design 3 Grammar School of Science and Mathematics 3/4 Electrical Engineering school 3
Game of basketball
School of applied arts and design 5 Grammar School of Science and Mathematics 5
Electrical Engineering school 4 Elements of handball
School of applied arts and design 1 Grammar School of Science and Mathematics 5 Electrical Engineering school 4
Game of handball
School of applied arts and design 1 Grammar School of Science and Mathematics 5 Electrical Engineering school 5
Elements og football
School of applied arts and design 1 Grammar School of Science and Mathematics 5 Electrical Engineering school 5 Game of football School of applied arts and design 1 Grammar School of Science and Mathematics 3/4
Electrical Engineering school 3 Elements of athletics – running
School of applied arts and design 2 Grammar School of Science and Mathematics 3 Electrical Engineering school 3
Elements of athletics – jumps
School of applied arts and design 2 Grammar School of Science and Mathematics 3/4 Electrical Engineering school 3
Elements of athletics – throws
School of applied arts and design 1 Grammar School of Science and Mathematics 5 Electrical Engineering school 1
Badminton
School of applied arts and design 5 Grammar School of Science and Mathematics 5 Electrical Engineering school 3
Table tennis
School of applied arts and design 5 Grammar School of Science and Mathematics 1 Electrical Engineering school 1
Dance structures
School of applied arts and design 1 Grammar School of Science and Mathematics 4 Electrical Engineering school 5
Exercises for motor ability development - strength
School of applied arts and design 5 Grammar School of Science and Mathematics 4 Electrical Engineering school 5
Exercises for motor ability development - quickness School of applied arts and design 5
Grammar School of Science and Mathematics 5 Electrical Engineering school 5
Exercises for motor ability development - flexibility
School of applied arts and design 5

320
Conclusion
The conduction of the study had a purpose to investigate the attitudes towards sport and physical activities, and students' preferences towards the syllabus of physical education and to examine differences by gender and type of school. The results show that male students have a more positive attitude towards sport and physical training of the female students, and significant differences in attitudes towards sports and physical exercise with regard to the type of school, with the most positive attitude stated by students of Grammar School of Science and Mathematics. Furthermore, differences by gender and type of school in preferences towards syllabus P.E's are also present. These results suggest the need for gender differences and students’ interests acknowledgement with regard to attendance at a particular type of school, the selection and distribution of educational content, all with the goal of better and more efficient implementation of the teaching process and to meet the goals and objectives of Physical education.
References
1. Biletić, I., Benassi, L., Baić, M., Cvetković, Č., & Lukšić, E. (2008). Stavovi učenica i učenika osnovnih škola Šijana u Puli i Poreču prema nastavi i nastavnim cjelinama tjelesne i zdravstvene kulture. U: V. Findak, (ur.), Zbornik radova 17. Ljetne škole kineziologa (82–87). Poreč: Hrvatski kineziološki savez.
2. Bobić, G., Trošt, T., & Jurakić, D. (2008). Interes osnovnoškolaca za bavljenjem sportsko rekreacijskim aktivnostima. U: M. Andrijašević, (ur.), Zbornik radova Kineziološka rekreacija i kvaliteta života (77-85). Zagreb: Kineziološki fakultet.
3. Fučkar, K., & Dijaković, T. (2001). Analiza stavova i interesa prema sportu studenata Prirodoslovno-matematičkog fakulteta u Zagrebu. U: V. Findak (ur.), Zbornik radova 10. ljetne škole pedagoga fizičke kulture Republike Hrvatske, Poreč, 2001, Programiranje opterećenja u području edukacije, sporta i sportske rekreacije (114-116). Poreč: Savez pedagoga fizičke kulture Republike Hrvatske.
4. Markuš, D., Andrijašević, M. & Prskalo, I. (2008). Tjelesna aktivnost maturanata. Odgojne znanosti, 10(2), 349-367.
5. Neljak, B., Novak, D. & Bajan, D. (2007). Zadovoljstvo učenika srednjih škola nastavom Tjelesne i zdravstvene kulture. U: V. Findak, (ur.). Zbornik radova 16. Ljetne škole kineziologa (327 – 333). Poreč: Hrvatski kineziološki savez.
6. Petračić, T., Nemet, M. & Tomac, Z. (2010). Preferencije studenata Učiteljskog fakulteta prema kineziološkim aktivnostima. U: M. Andrijašević, i Jurakić, D. (ured.), Meñunarodna znanstveno-stručna konferencija (120-124). Zagreb: Kineziološki fakultet.
7. Prot, F., Caput-Jogunica, R., & Komel-Klarić, S. (2001). Analiza postignuća i interesa prema sportu studenata Farmaceutsko-biokemijskog fakulteta u Zagrebu. U: V. Findak (ured.), Zbornik radova 10. ljetne škole pedagoga fizičke kulture Republike Hrvatske, Poreč, 2001, Programiranje opterećenja u području edukacije, sporta i sportske rekreacije (140-142). Poreč: Savez pedagoga fizičke kulture Republike Hrvatske.
8. Prskalo, I. (2007). Kineziološki sadržaji i slobodno vrijeme učenica i učenika mlañe školske dobi. Odgojne znanosti, 9(2), 161-173.
9. Škrinjarić, Z., Blažević, S. & Prelčec, S. (2008). Analiza interesa srednjoškolaca za tjelesnu aktivnost i nastavu tjelesne i zravstvene kulture. U: V. Findak, (ured.) Zbornik radova 17. Ljetne škole kineziologa, (401 – 406). Poreč: Hrvatski kineziološki savez.
10. Škrinjarić, Z., Tomac, Z. & Beissman, Ž. (2012). Interesi i sklonosti učenika srednje škole prema nastavnim sadržajima tjelesne i zdravstvene kulture (2012). U: V. Findak, (ur.), Intenzifikacija procesa vježbanja u područjima edukacije, sporta, sportske rekreacije (543-549). Poreč: Hrvatski kineziološki savez.

321
EFFECTS OF THEMATIC UNIT FITNESS TRAINING AT
HIGH SCHOOL
Pavel Šmela, Janka Peráčková and Tomáš Štefan
Comenius University, Faculty of Physical Education and Sports, Bratislava, Slovakia
Abstract
The aim of this thesis was to receive the feedback of the experimental group and to evaluate the designated thematic unit of fitness exercises at secondary schools. The group of respondents consisted of boys and girls of age between 16 and 17 of the Ladislav Sara Grammar School in Bratislava, who absolved proposed thematic unit of fitness exercises of twelve lessons. The results demonstrate educational, motivational and formative effects of the selected thematic unit on the personality of the student. 82% of the boys and even 93% of the girls were motivated by the applied thematic unit to practise physical activities in their leisure time. More than a half of the boys and girls experienced a subjective improvement in their physical condition. Exercise with their own body became the most popular exercise among the boys and girls. The dumbbells remain the domain of the boys, the girls incline to fitball.
Keywords: physical and sport education, fitness exercise, motivation of secondary school students, popularity of thematic unit
Introduction
New approaches are observed in the field of education. Physical education at school, its goals, tasks, function and content are understood as a part of the preparation for life and the future career. That means, in terms of lifestyle trends, to aim the focus at developing a positive attitude to the exercising as one of the conditions for a lifelong activity (Frömel, Novosad, Svozil, 1999). While choosing the structure of the curriculum, Slezák, Melicher (2007) appeal to the necessity to respond flexibly to the trends, according to the developed countries, to current, popular (fashionable) physical activities resulting from requirements and interests of students. Also Kyselovičová (2007) states that there is currently a need to search for such forms of education, which stimulate interests of the students and contribute to the formation of a permanent attitude to physical education and for sports in general.
Fitness exercises, if they are correctly interpreted and realised by an erudite and enthusiastic educator, can cause, apart from the development of physical abilities, also the interest in pursue of these healthy activities not only during the school physical and sport education, but also in afterschool activities.
Permanently increasing variability of educational activities requires an implementation and improvement of abilities of the teacher in the realization of the process of physical education in order to reach its goals (Peráčková, 2006). Peráčková (2008/a) states that it is necessary to emphasise the fulfilment of traditional objectives and tasks of the school physical education (physical fitness, exercise performance, development of physical abilities and dexterities) so they encourage at the same time the creation of conditions for lifelong physical activity and a healthy lifestyle.
Method
After the application of the twelve-hour thematic unit of fitness exercises, the effectiveness of this programme on the student’s motivational sphere was examined. Moreover, we wanted to acquire the feedback from the students on their subjective feelings, popularity of the programme and gather valuable

322
information and comments, which can serve to a potential future improvement of the thematic unit. A sample questionnaire can be found in annexes.
Results and Discussion
Subjective perception of thematic unit of fitness exercises
The students participating in the research rated the difficulty of the thematic unit most frequently as harder than the other physical and sport education classes. During the realisation of the thematic unit, the students were comparing their unusually sweaty T-shirts and they had a feeling of thirst. The students brought the drinking bottles for the next classes and some of them even used the school shower for the first time in their lives.
27%
73%
The difficutly of the thematic
unit - boys
Easy
Easier than normal PE
Moderate
Harder than normal PE
Hard
8%
92%
The difficulty of the thematic
unit - girls
Easy
Easier than normal PE
Moderate
Harder than normal PE
Hard
Figure 1. The difficulty of the thematic unit – boys, girls
Education, motivation and effectiveness of the thematic unit
Another section of questions was aimed at obtaining information on the usefulness of the thematic unit for the educational and motivational side of the student. Moreover, the student revealed his or her subjective view of his condition after the participation in this programme. We especially appreciate the educational benefit of the unit. According to the respondents among the girls and boys, its effectiveness in this area was 100%. Provided that the thematic unit brought new information and possibilities of exercises to students, there are good conditions for the motivation for an activity, even in leisure time. This hypothesis was confirmed by the evaluation of the following question about the influence of the thematic unit on the physical activity after school.
Were you inspired by this thematic unit to exercise after school?
Boys
37%
27%
18%
18%
Yes, on the
school
premises
Yes, in a sports
club
Yes, at home
No
Girls
23%
23%
47%
7%
Yes, on the
school premises
Yes, in a sports
club
Yes, at home
No
Figure 2. Motivational side of the thematic unit of fitness exercises

323
What is your subjective feeling of your fitness level after the participating in the thematic unit?
45%55%
Boys I am in a
better shape
I am in a worse
shape
I am in the
same shape
46%54%
Girls I am in a
better shape
I am in a worse
shape
I am in the
same shape
Figure 3. Subjective feeling of the physical condition after participating in the thematic unit of
conditional exercises
Preferred tools and the popularity of fitness exercises
The students had the possibility of trying exercising with a number of tools during the realization of the thematic unit of fitness exercises. The students were familiar with some of them and they have already worked with them. A number of tools, which are currently used not only in the sports training, were, however, unknown to the students. After a short characterisation and presentation, the innovative tools were introduced into the educational unit, so that each of the students could try them. The respondent was allowed to choose up to three preferred tools in the questionnaire. A surprising finding can be highlighted form the results; boys do not prefer the dumbbells, but exercising with their own body, and girls incline to instable tools more than boys.
We did not assume great popularity of the fitness exercises among students, and thus we were surprised by the results. The majority of the girls stated that they enjoyed the applied fitness exercises and they brought them emotional satisfaction. It was the same for almost a half of the questioned boys. Another satisfying fact is that, although not enjoying this type of fitness exercises, the students are aware of the usefulness of these exercises to maintain and protect their health.
Figure 5. Preferred tools
0
2
4
6
8
10
[Nu
mb
er
of
cho
sen
too
ls]
Boys Girls
Unit
Preferred tools
Fitball
Bosu
Flexi-Bar
TRX Suspension Trainer
Dumbbells
Elastiband
Skipping rope
Balance Disc
Exercises with own
body

324
Completed fitness classes:
45%55%
Boys
I enjoyed them and they brought me an
emotinal satisfaction.
I did not enjoy them, but I am aware of
their usefulness for my health.
I did not enjoy them and I did not
understand their purpose.
46%54%
Girls
I enjoyed them and they brought me an
emotinal satisfaction.
I did not enjoy them, but I am aware of
their usefulness for my health.
I did not enjoy them and I did not
understand their purpose.
Figure 6. The popularity of the completed thematic unit of fitness exercises
References
1. Frömel, K., Novosad, J., & Svozil, Z. (1999). Pohybová aktivita a sportovní zájmy mládeže. Olomouc : FTK UP.
2. Kyselovičová, O. (2007). Možnosti uplatnenia fitlopty v školskej telesnej výchove. In Metodická priručka zo IV. Europského kongresu FIEP. Bratislava : FTVŠ UK.
3. Peráčková, J. (2006). Time characteristics of teacher and pupil activities at individual kinds of physical education lessons. In Acta Facultatis Educationis Physicae Universitatis Comenianae. Bratislava: Universita Komenského.
4. Peráčková, J. (2008). Režim dňa, voľný čas a telovýchovná aktivita žiačok vybraného gymnázia. In J. Peráčková, B. Paugschová, Ľ. Jančoková, D. Nemček (Eds.), Telovýchovné a športové záujmy v rámci voľnočasových aktivít žiakov (pp. 5-74). Bratislava: UK FTVŠ MŠ SR.
5. Slezák, J., & Melicher, A. (2007). Školská telesná a športová výchova je jedinečným prostriedkom pre výchovu žiakov. In Labudová et al. (Eds.), Tvorba kurikula telesnej výchovy v rámci transformácie vzdelávania v Slovenskej republike (69-72). Bratislava: UK FTVŠ.

325
REALIZATION OF PHYSICAL EDUCATION CURRICULUM IN
HIGH SCHOOL
Branko Krsmanović, Maja Batez and Marijana Simić Faculty of Sport and Physical Education, University of Novi Sad, Serbia
Abstract
The study, which has the aim of comparing the current curriculum for the subject physical education and the assessment of its usage done by the physical education teachers, was conducted in the municipality of Loznica. This survey corresponds to descriptive method. Data were collected from the questionnaire. Upon the completion of the survey, data were entered into the data matrix and subjected to adequate statistical analysis. The analysis of results of the research includes the occurrence frequency of the level of compliance with the information above, as well as their percentage representation. This study enables the researchers to deal with errors and to contribute the efficiency of physical education from the standpoint which has certain goals and tasks required. Regarding the final results and data analyses, we can set a great gap in relation to those tasks in Syllabus for Physical Education announced by the Ministry of Education of the Republic of Serbia.
Keywords: syllabus, physical education, realisation, content.
Introduction
Problems in the realization of Physical Education syllabus which became more common for wider social public and in that way were declared founded, are the most discussed problems. These critics are based on the efficacy of Physical Education syllabus which has less success than expected and also has the lack of development proven in insufficient, less quality results.
Specificity of the syllabus reflects in its simplicity with methods, devices and work organisation when the syllabus realisation is organised in other way than the rest of the subjects. This makes us question whether it is possible to find the balance between Physical Education syllabus realization and requests, aims and tasks.
Ministry of Education sets the frames for syllabus for elementary and intermediate level of education. With the syllabus, one can decide which area to test, that is, which subjects to test, order of lessons and knowledge that students are expected to aquire until the end of a school year and to accomplish the general aim of Physical Education.
Syllabus contains oragnisational tasks used to accomplish the tasks required, the handbook for the program, minimal educational requirements as well as the handbook for the assessment of the results achieved.
Planning has to be the product of the creative work of a teacher who uses his expert knowledge to accomplish what is possible with his particular students in particular conditions on many occasions. The teacher has to analyze working conditions which will lead to program realization. However, the realization does not include conditions themselves; there are also students’ capabilities and knowledge, necessities, possibilities and interests.
Main topic of this survey is the current Physical Education syllabus.
The main aim of this survey is the comparison of the scheduled syllable and the assessment of its usage by Physical Education teacher in Secondary Schools in municipality of Loznica.
Furthermore, this paper has included the assessment of the implemented content as part of the current syllabus which has to contribute the improvement of different syllables.

326
The survey contributes to current state in lecturing and also the efficacy of the syllabus when setting the aims and tasks of Physical Education.
Method
This survey is used as the instrument for measuring data when setting the required content of Physical Education in Secondary Schools in Loznica. All Secondary Schools in municipality of Loznica, accompanied by their Physical Education teachers, were participants in this survey (High School of Economics, High School Vuk Karadžić, High School of Techinical Science and High School of Chemistry and Textile). When the survey was finished, all data were inserted in data based system and they were tested according to certain statistics.
Data processing
This survey used descriptive working method. Data was collected through the survey. When analyzing the results of the survey, we included the frequencies of the acceptance with the assumptions written and their usage in percentages.
Results and discussion
Chart 1. Syllabus realization Frequencies Percentage
yes 8 61,5 first
no 5 38,5 yes 9 69,2
second no 4 30,8 yes 7 53,8
third no 6 46,2 yes 8 61,5
Grades taught
forth no 5 38,5
up to 5 2 15,4 up to 10 10 76,9 How many classes of four-year
education do you teach in over 10 1 7,7
yes 6 46,2 Are you a headteacher
no 7 53,8 5-10 1 7,7
10-15 0 0,0 15-20 0 0,0
What is the criterion of lessons that you have in school
20 12 92,3 yes 4 30,8 Do you share a hall in which you
teach no 9 69,2 double 4 30,8 Do you have double or separate
lessons separate 9 69,2 at the beginning 9 69,2 Do you check students' presence and
absence at the beginning or at the end of the lesson at the end 4 30,8
instructed 2 15,4
orchestrated 7 53,8 Which for do you use to gather students at the beginning of the
lesson free 4 30,8 20-25 6 46,2 30-35 3 23,1 How many lessons do you need for
training 35-40 4 30,8 25-30 3 23,1 30-35 7 53,8 How many lessons do you need for
practicing 35-40 3 23,1

327
Frequencies Percentage
0-10 10 76,9 How many cars do you need for the assessment 10-15 3 23,1
III 5 38,5 Is your lesson composed of three or four parts IV 8 61,5
yes 13 100,0 running and wakling with
practicing no 0 0,0
yes 3 23,1 crossing
no 10 76,9 yes 3 23,1 ‘cathching’
exercises no 10 76,9 yes 3 23,1
Which topics do you most often use at the beginning of the lesson
polygons no 10 76,9
working in columns 9 69,2 separately boys and girls 1 7,7
Which organisational structure do you use in the introductory part of
the lesson together 3 23,1
simultaneous 10 76,9 Which method do you use with body- shaping exercises comparative 3 23,1
6-10 6 46,2 Which exercises do you use in one group of exercises for body- shaping 10-14 7 53,8
counting 10 76,9 tactics 0 0,0 Do you use counting or tactics
nothing simmilar 3 23,1 every lesson 1 7,7
weekly 4 30,8 monthly 5 38,5
How often do you change groups of exercises for body- shaping
the rest 3 23,1 yes 9 69,2 exercises
onthe floor or on
instruments no 4 30,8
yes 13 100,0 sport games
no 0 0,0 yes 0 0,0
What exercises do you use in the main part of the lesson
dancing activities no 13 100,0
yes 13 100,0 Which method do you use in the introductory part of the lesson
both methods
(frontal and group) no 0 0,0
yes 0 0,0 partly 9 69,2 Do you completely use all the
exercises from the syllabus no 4 30,8
analitic 0 0,0 syntetic 0 0,0 Which method do you use with
practining mixed 13 100,0
concentration and fast-reaction games 2 15,4
games for developing accuracy 5 38,5
games for developing orientation 2 15,4
Which basic games do you use at the end of the lesson
three-part lesson realization 4 30,8

328
Frequencies Percentage
organized 8 61,5 How do the children leave the hall
voluntarily 5 38,5 yes 0 0,0 Do children have physical
examination no 13 100,0 yes 13 100,0
Do you weigh children no 0 0,0
at the beginning of a school year 3 23,1
at the beginning, during and in the end of a school year 4 30,8 When do you weigh children
at the beginning and in the end of a school year 6 46,2
yes, completely 10 76,9 Do you use unique tests for assessing students partially 3 23,1
0-5 6 46,2 5-10 7 53,8 How many students are there who do
not attent the lessons over 10 0 0,0
yes 0 0,0 partially 9 69,2 Do you assess your students
according to the syllabus do not accomplish 4 30,8
yes 12 92,3 sections no 12 92,3
yes 3 23,1 additional lessons no 10 76,9
yes 0 0,0 additional pedagogical
work no 13 100,0
yes 13 100,0 competitions
no 0 0,0 yes 4 30,8 activites in
nature no 9 69,2 yes 0 0,0
camping no 13 100,0 yes 0 0,0
What do you use of other organisational usages
winter holidays no 13 100,0
Conclusion
Analyzing the results, we have proven next:
There are seven teachers, who teach three-year and four-year education groups, and the six left teach only four-year education groups. There is only one professor who has not got full criterion of lessons.
Surprising fact is that seven teachers share the hall with the other seven colleagues, and four teachers have double classes. Nine teachers assess their students at the beginning of the class and the other four at the end of it. Seven teachers gather their students using guiding method (the method when the teacher takes children from changing rooms to the hall and gathers them with the command ‘’Gather in two rows’’), two teachers ask children to do that and the other four gather children using free method. Majority of teachers composes their lesson in four parts, and there are five teachers who do not fulfill all four parts of the lesson.
Lesson criterion necessary for training, practicing and assessing differs from school to school. In one school, teachers need 40 lessons for training, 30 lessons for practicing and 4 lessons for assessing the acquired material. In the other school, teachers need more lessons for assessing, 14, 37 for training and 23 for practicing. In third school, there are more assessing lessons, 35, training lessons 25 and practicing 10. The situation is similar in the fourth school where teachers put emphasis on practicing lessons and there are 46 lessons for practicing. There are 24 lessons for training and 4 for assessing.

329
For the introduction of the lesson, students have exercises with walking and running, and the rest of techniques are used by only three teachers. Majority of teachers asks students to form columns and only one of them separates boys from girls.
One half of teachers use 6 to 10 different body- shaping exercises. Second half does 10 to 14 exercises. When these exercises are used, ten teachers use counting, no one uses and three of them do not use any of these.
Sports games are used the most in the main part of the lesson and they include basic technical elements like (conduct, capture, addition, feint, shots) as well as planning the defense and the attack. When athletics is concerned, there are running and walking techniques. Throwing and jumping techniques are used just through theory. Gymnastics only has the elements used on the floor (roll forward and back, spring balance), vault and pommel horse, balance beam elements. Unfortunately, there are no dancing activities in the lessons.
When organizing lessons, all teachers use group or frontal method. Teachers use combined methodic procedures (both analytic and synthetic) when training students.
Question ‘Do you completely use all the exercises from the syllabuses’, none of the teachers gave positive answer, nine teachers responded with ‘partially’ if they have the equipment and conditions for those. Four teachers said they do not use any of those exercises because there are no conditions for that.
Some of the teachers have three-part lessons and some four-part lessons with the aim to keep students in the same, successful direction. In that part of the lesson, they use accuracy games. There are eight teachers who think that children should leave the lesson in an organized column and the other five think children should leave the lesson voluntarily.
The devastating fact is that children do not have physical examination in any of the four schools.
Assessing is used in different ways: some of teachers assess at the beginning of a school year, some at the beginning, during and in the end of a school year, some at the beginning and in the end of a school year. Most teachers use one type of tests, and the others omit certain elements.
Minimal educational requirements are parallel with the realization of the content and they do not accomplish all the elements asked through the syllabus.
Among the other organizational structures, only one teacher does not have any section, three teachers provide additional lessons, four teachers provide activities in nature, camping, sinter holidays and additional lessons for weak students are not provided by any teacher.
Regarding results and analysis, we can state the degree of declination of the main syllabus declared by the Ministry of Education for the subject Physical Education is devastating. The consequences for the students who do not have certain elements included in their Physical Education lessons are unacceptable. On the other hand, teachers are those who lack conditions and materials to fulfill the syllabus, but we cannot take that explanation as an excuse.
A good teacher will always manage to find an adequate solution for accomplishing the tasks without considering it impossible and that is why planned syllabus and well- organized lesson plan are necessary for every educational process (Krsmanović, 1999).

330
References
1. Вишњић, Д. (2006). Настава физичког васпитања од 5. до 8. разреда основне школе. Београд: Завод за уџбенике и наставна средства.
2. Драгосављевић, П. и Драгосављевић, П. (2005). Савремена настава физичког васпитања и спорта. Бања Лука.
3. Крагујевић, Г. (2005). Теорија и методика физичког васпитања. Београд: Завод за уџбенике и наставна средства.
4. Крсмановић, Б., (1999). Час физичког вежбања. Нови Сад: Факултет физичке културе у Новом Саду.
5. Крсмановић, Б., Берковић, Л. (1999). Теорија и методика физичког васпитања. Нови Сад: Факултет физичке културе у Новом Саду.
6. Милановић, Љ., (1997). Настава физичког васпитања од 1. до 4. раздера основне школе. Београд: Завод за издавање уџбеника и наставна средства.
7. Просветни савет Републике Србије. (1990). Службени гласник РС", број 5/90, члан 20. став 2 . Правилник о плану образовања и васпитања за гимназију.
8. Просветни савет Републике Србије. (1990). Службени гласник РС", број 5/90, члан 20. став 2. Правилник о плану образовања и васпитања за заједничке предмете у стручним школама.
9. Радојевић, Ј., Радисављевић, Л., Аруновић, Д. и Бокан, Б. (1997). Усклађеност програма физичког васпитања са условима реализације. Физичка култура, 51(1), 22-28.

331
PSYCHO-PHYSICAL FACTORS WHICH CAUSE CHILDREN’S
EXEMPTION FROM THE LESSONS OF PHYSICAL
EDUCATION
Goran Vasić 1, Dejana Vasić 2 and Dragoslav Jakonić 1
1 The Faculty of Sport and Physical Education, University of Novi Sad, Serbia 2 Secondary School of Mechanical Engineering, Novi Sad, Serbia
Abstract
Since it has been noticed that year after year the number of children who do not attend the lessons of physical education has increased, we have tried to explain what the most frequent reasons for the occurring trend are. The data obtained by the methods of observation and interview in one secondary school in Novi Sad show that the percent of children exempt from the lessons of physical education is not to be underestimated and it is 15% from the total number of the examinees (813). A rough division in so called psychological and physiological factors cannot be avoided. It is a well-known fact that there are some diseases which prevent any type of sports activities since they can endanger the person’s live or medical condition, but there is a large number of diseases for which moderate physical activities are recommendable. The most frequent psychological factors are personality disorders (refusing to accept the body, shyness, the lack of confidence, fear) and diet disorders. An insignificant number of examinees said that boring and uninteresting lessons are the main factor.
Introduction
Students’ exemption from the lessons of physical education at school is an issue which has to be dealt with carefully. Very frequently students who have no serious reasons are exempt from the lessons of physical education. This is especially present in the case of the students who should necessarily go to the lessons of physical education with the purpose of improving their growth and development. Special attention should be paid to the cases in which students have to be exempt from the lessons of physical education due to the presence of certain diseases since their physical activities could bring about the deterioration of their medical condition, which is already on a lower level.
The common organizational way of students’ exemption from exercising in the lessons of physical education has two aspects:
- a student’s request to be exempt
- after doctor’s examinations
In the basic and most frequently used way a student files a request to be exempt from doing exercises in the lessons of physical education to the school management. A school doctor, pediatrician or a general practitioner examines the student (takes insight into medical findings) and, together with a specialist of sports medicine, gives a suggestion about the evaluation of the student’s ability to attend the lessons of physical education. The decision about the exemption should be made by the school committee consisting of a doctor, a teacher of physical education and the head teacher or pedagogue and psychologist. It’s a fact that, with a full responsibility, only a doctor can make a decision about the medical condition and abilities. Other member of the committee can only be informed about the medical state of the student (to a certain extent that is necessary). A doctor has to present the medical findings and opinion to the teacher of physical education, especially in the cases when certain students need to have limited amount of exercises, owing to their medical issues.

332
Apart from this way of exemption from exercising, it can also be done by undergoing regular systematic examinations of students, after which the doctor issues a suggestion for some students to be exempt from the lessons of physical education. Besides, this indicates the significance of undergoing systematic examinations since students sometimes do not feel and are not aware of the fact that they have medical issues. Such cases can be discovered only by systematic examinations (Lazarević Lj. 2001)
No matter if the evaluation of the medical condition or the exemption from the lessons of physical education is done by systematic examinations or committee decisions, it is necessary to write the estimation of the ability to do sports activities in the lessons in the document. If it is necessary the estimation can be followed by a short written explanation, so it can be clearly seen in the document whether a student can attend the lessons of physical education or not and what the limitations are, if there are any.
Problems and shortcomings
First of all, the fact that a large number of students still do not undergo regular systematic examinations must be emphasized. It happens most frequently that in the places where these examinations do not take place there is a simultaneous occurrence that the mechanism of the procedures of exemption from the lessons of physical education either does not function or it functions badly. The number of students who finish their primary and secondary education without having any systematic examination is not insignificant.
In certain surroundings and schools the number of students who request to be exempt from exercising is significantly higher than what is be expected. Apart from the justified cases, the requests are also filed by those students who have no will or desire to exercise because of other preoccupations, as well as the students with various defects, often with nothing but slightly decreased vision or hearing, clumsy, too tall and obese students whose physical abilities and the possibility of advancement are smaller in comparison to their peers. Generally, the majority of students whose requests to be exempt from exercising are unjustified, which is obligatorily established by medical examinations, actually need exercising and it is one of the ways of improving their general condition (Stojanović, M.1977).1
The aim of the paper
The aim is to show the percent of the students who are exempt from the lessons of physical education in the Secondary School of Mechanical Engineering in Novi Sad during the school year 2011/12, as well as the psychological and physical factors used.
Method
The sample of examinees consisted of all 813 students from the Secondary School of Mechanical Engineering in Novi Sad from the first to the fourth grade during the school year 2011/12.
The data are obtained by the method of observing and interviewing. The values will be given as numbers and percentage from the first to the fourth grade, as well as in the total sample.
Results
Out of 813 students of the Secondary School of Mechanical Engineering in Novi Sad during the school year 2011/12, 15% (122) students were exempt from the lessons of physical education.
Table 1. Students who are exempt from the lessons of physical education Number of students Number of exempt
students % of the exempt students
1st grade 215 12 5.6% 2nd grade 220 27 12.3% 3rd grade 219 45 20.5% 4th grade 159 38 23.9% TOTAL 813 122 15%

333
Observing the percentage of the exempt students it can be concluded that the percent increases from the first to the fourth grade, where in the first it is 6% and in the fourth about 24%, which is four times higher.
Evaluation of the medical ability to exercise
In order to make a successful evaluation of a student’s health condition and ability to exercise in the lessons of physical education, as well as to organize and apply the educational programme systematically, it is necessary to take care of the factors important for the evaluation, especially about the possible classifying evaluations of the ability to exercise. We have a common classification of the evaluations of health ability to exercise in the following categories:
- Capable (students exercise according to the regular curriculum)
- Partially capable ( students are exempt from certain exercises, while they can take part in others)
- Temporarily incapable (students are exempt from exercising for a limited period of time, usually 1-3 months)
- Incapable (students are completely exempt from exercising throughout the school year)
According to the classification which takes health condition, physical development and fitness into account as the criteria, a student can be marked as:
- Capable: - for exercising in the basic group
- for exercising in the preparatory group
- for exercising in a special group
- Temporarily incapable
- Incapable.
Apart from the basic group, which includes a large majority of students and which functions according to the regular curriculum, other groups have certain limitations, depending on the level of health disturbances and general fitness. During their work, followed by the doctor’s consent, students can be moved from a special to a preparatory group or from the preparatory to the basic one on condition that their health condition improves, as well as their physical development and fitness.
A special group, if it is possible, should function as a part of school’s clinic since that allows regular medical examinations. If that is the case, the doctor should control the group once or twice a month. The group usually has about 10 students. The teacher, together with the doctor who controls the students, plans the adequate working schedule. One of the characteristics of such programme is a bigger implementation of individualized work.
From the organizational point of view, aiming at implementing this type of work will come across significant difficulties, first of all due to the lack of the material basis and insufficient number of teachers. However, these obstacles can be dealt with, especially in certain well-equipped schools, since there are legal possibilities which take into account the additional lessons of physical education included in the school timetable and that way become students’ obligation, as well as the working duty of their teachers.
If the organizational difficulties were solved in the groups classified in this way, physical education at school would meet the demands set upon it to a much higher level. An example of it is the fact that the lessons of physical education, together with a certain organizational effort, are successfully implemented in the school for blind children.
Each student exempt from the lessons of physical education is obliged to be present in the lessons. The teacher can involve them during the lessons in keeping the records of results, being a referee in volleyball matches, measuring the running time and active participation in the theoretical topics.

334
Psychological reasons used as excuses for the exemption from the lessons of physical education
The most frequent reasons are: necessary equipment for every lesson, monotonous lessons, indifferent teachers, as well as the fact that the teachers do not keep the record of absent students. Some students use their lessons of physical education to do their homework and study for oral examinations in other subjects.
Practice shows that those students who train any sport outside school are absent less frequently and that the excellent students avoid attending the lessons of physical education afraid to endanger their average grade.
Inadequate space, for example just one locker room big enough for ten students, which requires changing clothes in groups, takes away half the lesson. That is one type of the problems. Secondly, girls follow fashion, so if the first lesson is physical education they come dressed up wearing make-up, so when they sweat they have nowhere to take a shower and they do not want to sit like that in the following five lessons.
There are some other reasons:
- Non-acceptance of the growth changes on the body (being too skinny or overweight, acne, hairiness, visible characteristics of female sex (breasts), some deformities, disproportion of the body, mark, mole)
- Inadequate equipment
- Clumsiness
- Being teased, mocked at, laughed at and humiliated by other children a child becomes isolated, reserved and starts to avoid the lessons of physical education because they feel uncomfortable
- Being exempt from the society, which is very important in the adolescent period
- Hormonal changes cause over exaggerated reactions which vary from the complete isolation to aggressive reactions, which can change very quickly. They can bring about psychological disturbances, anorexia, bulimia or obesity, depression and other types of adolescent crisis.
The lessons have to be oriented towards individuals so the ones who are not skillful can achieve better results in the activities which suit them. Children who are excellent students in most cases have a problem with the lessons of physical education because they get lower grades. They do not accept it easily, since they have to face the fact that their knowledge is less important than their skills. As simple as that, some children are not as skillful as some other and that is the reason why the lessons should be adjusted to them.
Diseases which require total exemption from the lessons of physical education
In order to be used in practice we give the list of the diseases which require a complete exemption from the lessons of physical education.
Respiratory system diseases (bronchial asthma- only in the cases of sensitivity to the allergens related to the gym and the equipment used in the lessons of physical education, bronchiectasis, chronic bronchitis, tuberculosis, lung empisema, lung echinococcus, lung cancer and after a surgery)
Cardiovascular system diseases (decompensate and compensate heart failure, innate heart failure, artery blood pressure which is fixed to an increased level, hemophilia and cancerous diseases.
Digestive tract diseases acute cancer on a stomach and duodenum, cholelithiasis and chronic cholecystitis, hernia, a heavy form of adhesion in the digestive tract after laparotomy, tumors- completely malignant, benign until they are cured, chronic fistulas, acute tuberculosis of the digestive organs and peritoneum, hepatitis lasting from 1 year to six months after the normalization of laboratory findings, splenectomy- surgical removal of spleen- after a certain time period, with the doctor’s consent, the people without spleen can attend the lessons of physical education and take an active part in sport.

335
Urogenital tract diseases (more complicated anomalies with functional difficulties- for example the inability to hold urine), urogenital tuberculosis, nephrosis, adnexitis and perimetritis of more complicated chronic forms, health condition after the extraction of one kidney, kidney stone).
Skeleton, joint and muscle diseases (active tuberculosis of joints, bones and tendons, spine deformities- scoliosis, kyphosis and kyphoscoliosis, in these cases special exercises are used, muscle diseases: muscle dystrophy, Miasthenia, Myotony)
Organ and psychological diseases of the nervous systemske (epilepsy, peresis and paralysis of torso and limbs- completely or in some cases partially).
Eye diseases (chronic eye diseases with sight damages- inflammation of purlin, retina and eye nerve, refractive errors- myaopia above -5, hypermetropia above +6, astigmatism)
Ear disease (mostly in the acute phase (chronic suppurative otitis – cronic pus inflammation of the middle ear), rupture of an eardrum- cracks in an eardrum
Endocrine diseases (diabetis, thyrotoxicosis, goiter III level)
Skin diseases (active tuberculosis of skin and hypodermic tissue, pemphigus, urticaria, psoriasis)
Infective diseases (infective mononucleosis, hepatitis)
Discussion
Statistical data about the exemption from the lessons of physical education indicate that this problem exists and they are very illustrative. During the school year 1957/58 in Zagreb out of 2023 students who filed a request to be exempt from the lessons of physical education 1119 students or 55% were marked as incapable, while 293 or 15% were marked as partially capable. 611 students, or 30%, were marked as healthy or capable of doing exercises in the lessons of physical education and their requests to be exempt from the lessons of physical education were rejected.
The data from the State Office for the Primary Education of Teachers in the Republic of Serbia from 1966 are interesting and they indicate that the percent of the students exempt from the lessons of physical education is higher in older grades (in grammar school). In some grammar school that percent was in the range 8-15%.
The level of physical activity decreases with the age, which is especially noticeable in the adolescent period and especially for girls (Kimm et al. 2001; Nader et al. 2008). In a certain aspect that matches our research which shows that the number of students exempt from the lessons of physical education increases gradually.
In certain surroundings the number of students who file a request to be exempt from the lessons of physical education is large, even though the majority of them do not deserve that owing to their medical condition. Those requests are mostly filed by the students who have certain defects or deformities (weaker sight, pigeon chest, etc.) as well as the students who are obese, who have underdeveloped motor system, as well as girls with big or small breasts.
Curricula for the physical education are not adjusted to the capabilities of individuals, so the grade from this subject decreases their average grade. In cases like these it is important for a teacher to show more pedagogical understanding and help them increase their engagement and faith in their capabilities and get the best grade with the aid of nothing but their own effort.
A specific category includes students who are also athletes and who, owing to their physical abilities, are above the average abilities of their peers and because of that exempt from the lessons of physical education since they find the lessons too easy and uninteresting. Apart from having excellent medical condition, they try, simulating certain diseases, to get a confirmation of incapability for the lessons of physical education. These requests are often heard by the “caring” parents (fear of injury) even though the child wants to attend the lessons of physical education.

336
Conclusion
Systematic examinations should take lace regularly since only they can give a clear insight into who is capable of doing exercises in lessons and who needs to be exempt from the same lessons. From everything above mentioned it can be concluded that the majority of students who file unjustified requests for the exemption from the lessons of physical education, actually need exercises and they are one of the ways of improving their general constitutional and functional condition of organism. It should also be taken into account that in such cases the exemption from the lessons of physical education can have an adverse effect on the psycho-physical development of a child.
References
1. Bjelica, S, Dundjerovic, R, Cokorilo, R. (1995). Socioloski, pedagoski i psiholoski aspekti oslobadjanja ucenika od nastave fizickog vaspitanja. Fizicka kultura, 124-127.
2. Jakonić, D. (1996). Sportska medicina. Novi Sad: Fakultet fizičke kulture.
3. Kimm, S, Glynn, N, Kriska, A, Barton, B, Kronsberg, S, Daniels, S. et al. (2001). Decline in physical activity in black girls and white girls during adolescence. Journal of Medicine, 34(10), 709–715.
4. Lazarević, Lj. (2001). Osnove fizičke kulture. Beograd: Viša škola za sportske trenere.
5. Medved, R. (1987). Sportska Medicina. Zagreb.
6. Nader, P.R, Bradley, R.H, Houts, R.M, McRitchie, S.L, & O`Brien, M. (2008). Moderateto-vigorous physical activity from ages 9 to 15. Journal of American Medical Association, 30(3), 295–395.
7. Pavlišić, V. (1985). Osnove biološke antropologije. Zagreb: Fakultet za fizičku kulturu.
8. Stojanović, M. (1977). Biologija razvoja čoveka sa osnovama sportske medicine. Beograd: Fakultet za fizicko vaspitanje.
9. Vukicevic, M. (1995). Za i protiv oslobadjanja ucenika od nastave fizickog vaspitanja. Fizicka kultura, 135-140.

337
RELATIONSHIP BETWEEN MOTOR ABILITIES AND
MORPHOLOGICAL CHARACTERISTIC AND EFFICIENCY IN
TEACHING SAILING TECHNIQUE
Goran Oreb, Vanja Novaković and Bor Oreb
Faculty of Kinesiology, University of Zagreb, Croatia
Abstract
The aim of this study has been to establish whether there is any relation between motor abilities and morphological characteristics on the one hand and grade of success in sailing on the other, that is, to establish if it is possible to foresee the success in the practical part of the course of lectures Water sports- sailing on the basis of the value gained from some motor skills evaluation tests and morphological characteristics evaluation tests, and if so to what extent.
In this research has been tested 105 fourth year female students of the Faculty of Kinesiology, University of Zagreb, who passed the course Sailing. The criterion variable consisted of the marks of 4 basic elements of sailing. The predictor variables consisted of 15 motor tests and 4 antropometric standards.
Regression analysis brought out the conclusion that there is statistically significant influence of coordination, ritham and moving frequency to the sailing class performance.
Keywords: motor skills, morphological characteristics, sailing, regression analysis.
Introduction
Efficiency in kinesiology activities, including sailing, depends on different dimensions of anthropological space, such as motor, functional, cognitive, and conative, in other words, on the whole status of sailor. Determining relations between those dimensions it is possible to choose related kinesiology operators, to create transformational processes in a quality way and ensure tracking of the transformational effects. Of course, such cognitions are of great value in teaching of sailing skills. Unfortunately, in today's pedagogical praxis, researches connected to the success in teaching based on motor and morphologic characteristics, especially in female population, are very rare.
Niinima,V., Wright,G., Shephard,J. and Clark,J. (1973) have pointed out the importance of conditional training in increasing endurance, static strength and aerobic capacity by creating experimental dinghy sailors conditional training programme. The same authors (1977) are indicating the relevance of aerobic and anaerobic capacities, muscular strength and balance in sailing efficacy.
Medved, R. and Oreb,G. (1982) are indicating the level of lactates of 2,8 mmol in regatta conditions of windsurfers.
With the goal of determining effectiveness of windsurf teaching, Oreb,G.(1984) supports synthetic teaching technique, based on the results of experimental procedure on the sample of students of physical culture.
Comparing physical abilities of top New Zeland sailors and sailors of ten other nations, Legg,S.J., Miller,A.B., Slyfield,D:, Smith,P., Gilberd, C., Wilcox, H. and Tate,C. (1997) have determined that New Zeland sailors have more endurance in shoulder area and higher aerobic capacity compared to the other nations sailors, who were, on the other hand, more enduring and stronger in lower extremities.
338
Marinović,M. (2000) has determined that Croatian sailors in „Laser“ and „Laser radial“ class don't deviate significantly in physical height and weight compared to the other nations sailors, but they have significantly larger amount of subcutaneous adipose tissue.
Prlenda, N. (2003) and Majce, D. (2004), in their researches conducted on the sample of Kinesiology faculty students, have determined statistically significant correlation between coordination, agility and movement frequency, and effectiveness in teaching of sailing skills.
Statistically significant correlation between motor abilities and regatta success in Optimist class are shown by Oreb,G., Prižmić, D. and Mrelić, N. (2008).
Method
With the aim of determining correlations between motor abilities and morphological characteristics of female students of Kinesiology faculty in Zagreb and success in teaching of sailing, the authors have set following hypotheses:
Ho1- There is no statistically significant correlation between motor abilities and morphological characteristics, and efficiency in teaching of sailing;
Ho2- There is no statistically significant influence of individual motor abilities and morphological characteristics to efficiency in teaching of sailing.
The research was conducted on the sample of 105 female students of Kinesiology faculty, fourth-year full-time students in the academic year 2004/5, aged 21-25. Clinically healthy students, by their characteristics and abilities different from average female population, have successfully passed the exam in Water sports – Sailing, and it was their first contact with sailing.
Predictor variables of motor abilities were results of: 4 coordination assessment tests – figure of eight with a bend (MAGOSS), obstacle course backwards (MREPOL), side steps (MAGKUS) and side steps with a 360° turn (MAGKUS360); 3 tests for evaluation of realization of rhythmical structures – drumming without the rhythm (MKRBUB), drumming with feet and hands (MKRBNR) and Oreb's rhythm test (OREBMR); 2 tests for balance evaluation-standing on a foot on the balance bench with eyes open (MBAU1O) and standing on the both feet on the balance bench with eyes closed (MBAU2Z); 2 tests for motion frequency evaluation- hand tapping (MBFTAP) and foot tapping (MBFTAN); 2 tests for flexibility evaluation- sit- and -reach (MFLPRK) and touch-toe with feet spread (MFLPRR); 2 tests for explosive strength evaluation – standing long jump (MFESDM), Sargent test (MFESVM):
Predictor variables for morphological characteristics assessment consisted of values for three anthropometric measures according to the recommendation by IBP (International Biological Program) by which longitudinal skeleton dimension, body mass and subcutaneous adipose tissue were assessed. The fourth measure, total body fat, was calculated by the body fat multiplied with the body fat percentage and then divided by a 100.
As criteria variables evaluation marks were used, by which three judges assessed demonstration of 4 basic sailing technique elements (heading up, tacking, bearing away, and jibing) performed by female students on „Elan 19“ sailboats, four person monotype, on the helmsman position.
On the basis of achieved results it was determined, before further data processing, that motor tests are reliable, representative and homogenous, except for balance test with eyes closed (MBAU2Z) where the values of reliability and particle homogeneity coefficients were very low (Alpha=0,53; lambda 6=0,44; Hom1=0,79), which suggested caution in using them.
Results were subject to descriptive analysis, and then interrelations of motor tests and interrelations of anthropometric measures were made, while relations between motor abilities and morphological characteristics and each criterion variable were determined through regression analysis.

339
Results and discussion
Since the authors didn't notice any specificities in descriptive analysis or in interrelations of motor tests or in interrelations of anthropometric measures, and having in mind the goal of the research and limited space for results representation, in this segment results of regression analysis will be presented and analysed.
Table 1. Regression analysis of predictor variables and criterion variable HEADING UP
HELMSMAN (PRIK)
R=0,54 R²=0,29 Adj. R²=0,13 Std.pog.:1,04, nivo značajnosti= 0,01og. 0.04 sign. level = 0.010,01
BETA B St.pog.B t p-level
Intercpt -1,28 6,44 -0,19 0,84
MAGOSS -0,28 -0,27 0,1 -2,727 0
Through the insight into results of regression analysis (Table 1.), a connection (R=0,54) between predictor variable set and the first criterion variable Heading up-Helmsman (PRIK) can be seen. Predictor group explains 29% of variance (R²), with the significance level of 0, 01. Important contribution to explaining of connection between the predictor set and Heading up-helmsman criterion is noticeable in Figure of eight with a bend (MAGOSS) variable. It is possible to explain this connection by high similarity of coordination tests and tests of movement speed with element specifics of PRIK criterion variable. Unlike other coordination tests, Figure of eight with a bend test (MAGOSS) evaluates ability of quick assessment of modus and direction of movement, and for the mentioned technique element emphasized short and controlled movements and frequent direction correction are specific.
Table 2. Regression analysis of predictor variables and criterion variable TACKING
HELMSMAN (LETK)
R=0,53 R²=0,28 Adj. R²=0,13 Std.pog.:1,02, nivo značajnosti= 0,01og. 1,02 sign. level = 0,01
BETA B St.pog.B t p-level
Intercpt -1,55 6,34 -0,25 0,8
MAGOSS -0,23 -0,22 0,1 -2,17 0,03
MKRBNR -0,21 -0,04 0,02 -2,2 0,03MFESVM 0,28 0,05 0,02 2,31 0,02
According to the results presented in the Table 2., the correlation (R=0,53) of predictor criteria set and criterion variable Tacking-helmsman (LETK) is noticeable. Predictor set explains 28% of variance (R²), with the significance level of 0,01. Contribution to that correlation is evident in variables Drumming with hands and feet (MKRBNR), Figure of eight with a bend (MAGOSS) and Sargent test (MFESVM). Since the helmsman is simultaneously changing the direction of sailing and crossing to the other side of the sailboat during the tacking, that motoric is very similar to the rhythm test (MKRBNR) characterized by simultaneous rhythmic foot and hand work in cycles. In a similar way, it is possible to explain contribution of the predictor Sargent test (MFESVM) and Figure of eight with a band (MAGOSS), realization of which demands explosiveness and coordination highly necessary to the helmsman during the tacking.
Table 3. Regression analysis of predictor variables and criterion variable BEARING AWAY
HELMSMAN (OTPK)
R=0,39 R²=0,15 Adj. R²=0,13 Std.pog.:0,54, sign. level= 0,01BETA B St.pog.B t p-level
Intercpt 2,06 0,97 2,12 0,03
MAGK360 0,21 0,12 0,05 2,23 0,02
MKRBUB -0,24 -0,06 0,03 -2,42 0,01
MBFTAP 0,28 0,06 0,20 2,99 0,00

340
Correlation of predictor set and criteria variable Bearing away-helmsman (OTPK), presented in the Table 3, is statistically significant and amounts 0,39, which means it explains 15% of total variance with the level of significance of 0,01. Contribution of Side steps with a 360° turn test (MAGK360) is logical due to the similarity in realization of test task to the actions a helmsman must perform during bearing away and preparing to jibe, where everything is happening in a very restricted space and where orientation in space is of great importance. In a similar way, it is possible to explain the contribution of Drumming without a rhythm test (MKRBUB) and Hand tapping test (MBFTAP), since the manoeuvre is demanding rhythmical movements of the helmsman together with the quality and precise manipulation during steering or keeping the sail direction.
Table 4. Regression analysis of predictor variables and criterion variable JIBING HELMSMAN (KRUK)
R=0,42 R²=0,17 Adj. R²=0,15 Std.pog.:0,61,sign. level= 0,00BETA B St.pog.B t p-level
Intercpt 0,23 1,30 0,18 0,85
MKRBNR -0,26 0,05 0,02 2,81 0,00
MBFTAP 0,33 0,07 0,02 3,53 0,00
MAGKUS 0,23 0,23 0,09 2,49 0,01
In the fourth manoeuvre-element of sailing technique, based on the results shown in the Table 4., statistically significant correlation between predictor set and criterion variable Jibing-helmsman (R=0,42) is also evident, so multiple correlation explains 17% of total variance. Significant contribution to the connection between individual variables is evident in Drumming with feet and hands (MKRBNR), Hand tapping (MBFTAP) and Side steps (MAGKUS). As in Jibing helmsman has to perform coordinate actions of hands and feet simultaneously, i.e. to change the direction of sailboat and at the same time cross from one side of the sailboat to the other in a restricted space, this contribution of mentioned variables is completely logical, having in mind that they assess efficiency in realization of rhythmical structures, coordination and rhythm.
Conclusion
The basic aim of the research was to determine if there is a connection between motor abilities and morphological characteristics, and efficiency in teaching basic elements of sailing technique. Examinee sample consisted of 105 female examinees, all of them fourth-year full-time students of the Kinesiology faculty in Zagreb in academic year 2004/5, aged 21-25.
After practical classes consisting of 18 hours during seven days on „Elan 19“ sailboats for four persons, they were subject to examination evaluated by three judges in evaluation mark scale 1-5. Judges were assessing only the actions of helmsman as a person responsible for managing a sailboat.
Evaluation marks of the three judges in four basic elements of sailing technique represented criteria set, while nineteen variables (15 for motor abilities assessment and 4 for morphological characteristics assessment) represented set of predictor variables.
Through regression analysis a correlation between predictor variables and each individual criterion was determined. It is interesting to notice that among coordination tests, Figure of eight with a bend (MAGOSS), Side steps (MAGKUS) and Side steps with a 360º turn (MAGKUS360) were the tests the most frequently represented in the correlation. Among tests for movement frequency evaluation, Hand tapping (MBFTAP) was the most frequent, while realization of rhythmic structures was represented by tests Drumming without a rhythm (MKRBUB) and Drumming with feet and hands (MKRBNR).
It is interesting that none of the variables for assessment of morphological characteristics proved significant for helmsman position.
Hence, according to the results analyzed, it is possible to conclude that efficiency in teaching female students sailing-helmsman position is based on coordination and frequency of movements. It means that previously set hypotheses concerning connection of motor abilities and efficiency of teaching sailing technique for female students can be discarded, because connection exists. As for correlation between morphological characteristics and efficiency in teaching sailing technique, hypotheses can be accepted, since in none of the cases significant correlation existed.

341
References
1. Bala, G. (1986). Logičke osnove metoda za analizu podataka iz istraživanja u fizičkoj kulturi. Novi Sad: Vlastito izdanje.
2. Conner, D. (1997). Naučite jedriti. Zagreb: Biblioteka sport.
3. Findak, V. (1999). Metodika tjelesne i zdravstvene kulture. Zagreb: Školska knjiga.
4. Gabrijelić, M. (1969). Metode za selekciju i orijentaciju kandidata za dječje omladinske sportske škole. Zagreb: Institut za kineziologiju.
5. Horvatin-Fučkar, M. (2002). Povezanost ritma i uspjeha u sportskoj i ritmičkoj gimnastici (Magistarski rad). Zagreb: Kineziološki fakultet.
6. Lanc, V. (1986). Utjecaj primarnih motoričkih faktora na uspjeh u učenju tehnika veslanja. Kineziologija, 18(2), 113-118
7. Legg, S.J., Miller, A.B., Slyfield, D., Smith, P., Gilberd, C., Wilcox, H., & Tate, C. (1997). Physical performance of elite New Zealand Olympic class silors. The journal of sports medicine and phisical fitness, 37, 41-49.
8. Majce, D. (2004). Utjecaj motoričkih sposobnosti na uspješnost u poduci jedrenja (Diplomski rad). Zagreb: Kineziološki fakultet.
9. Metikoš, D., Hofman, E., Prof, F., Pintar, Ž., & Oreb, G. (1989). Mjerenje bazičnih motoričkih dimenzija sportaša. Zagreb: Fakultet za fizičku kulturu Sveučilišta u Zagrebu.
10. Momirović, K., Štalec, J., & Wolf, B., (1975) Pouzdanost nekih kompozitnih testova primarnih motoričkih sposobnosti. Kineziologija, 5(1-2), 168-192.
11. Oreb, G. (1984). Efekti primjene analitičkog i sintetičkog pristupa u obučavanju jedrenja na dasci. Kineziologija, 16(2), 185-192.
12. Oreb, G. (1986). Naučimo jedriti na dasci. Zagreb: Fakultet za fizičku kulturu.
13. Petz, B. (2004). Osnove statističke metode za nematematičare. Jastrebarsko: Naklada slap.
14. Prižmić, D. (1995). Utjecaj nekih primarnih motoričkih sposobnosti na uspješnost u jedrenju (Diplomski rad). Zagreb: Fakultet za fizičku kulturu.
15. Prlenda, N. (2003). Povezanost motoričkih sposobnosti s uspješnosti u jedrenju (Diplomski rad). Zagreb: Kineziološki fakultet.
16. Sekulić, D. (2001). Prijedlog definiranja volumena opterećenja u vrhunskom sportu. Zbornik radova 10. Ljetne škole pedagoga fizičke kulture Hrvatske. Poreč.
17. Vlašić, J. (2006). Povezanost motoričkih i morfoloških obilježja studentica s plesnom uspješnosti (Magistarski rad). Zagreb: Kineziološki fakultet.
18. Vogiatzis, I., Spurway, N.C., Wilson, J., & Boreham, C. (1995). Assessment of aerobic and anaerobic demands of dinghy sailing at different wind velocities. The journal of sport medicine and physical fitness, 35(2), 103-107.

342

343
THE ATTITUDES OF FUTURE AND CURRENTLY WORKING
PE TEACHERS TOWARDS INCLUSIVE PHYSICAL
EDUCATION
Višnja ðorñić and Tatjana Tubić
Faculty of Sport and Physical Education, University of Novi Sad, Serbia
Abstract
Through adoption of The Law on the Fundamentals of the Education System (2009), the inclusive model of education has become a reality in the Republic of Serbia. Given that teachers are the main factor of successfulness of inclusive physical education, a study has been conducted aiming to determine the differences between future and currently working PE teachers in their attitudes towards inclusive physical education. The sample consisted of 137 participants, with 85 future PE teachers and 52 currently working PE teachers. Their attitudes towards inclusive physical education were examined by the ATIPE scale (Hutzler, Zach, & Gafni, 2005). The results have indicated that the subsamples of both future and currently working PE teachers inclined toward moderately positive attitude to inclusive physical education (M=2.63 and M=2.76 respectively). The t-test showed no statistically significant difference in the attitudes between the two subsamples (t=-1.72, p= .09). The findings can be explained by the small difference in practical experience with inclusive teaching between the two groups of participants, due to the short period of implementation of inclusive education.
Keywords: inclusive education, inclusive physical education, PE teachers, future teachers
Introduction
Inclusion is nowadays in the focus of educational and social policies. In education, inclusion concerns the processes of reforming and restructuring the school on the whole, all aimed to ensure access for all students to whatever educational and social opportunities school can offer (Mittler, 2000). In the Republic of Serbia, the inclusive model of education is regulated by related legislation, beginning with the basic enactment – The Law on the Fundamentals of the Education System (2009). However, the policies made official through legislation only create a context for inclusion; even though the national policy of inclusion does exist, teachers may not share the views and values it assumes (Lindsey, 2011).
At the same time, teachers' attitudes to inclusion of students with disabilities in the regular PE classes are an important factor for successful inclusive physical education. The most frequent obstacles to inclusion of students with disabilities concern teacher preparation and teachers' attitudes, as well as other perceived and real obstructions such as equipment available, programming and time (Sherill, 1998).
The research carried out so far has confirmed that more positive teachers' attitudes toward inclusive PE is influenced by larger amounts of related training as part of their education, more experience in teaching students with disabilities and more favourable self-perception regarding one's competence for work with these students (Avramidis, Baylis, & Burden, 2000; Block & Rizzo, 1995; Folsom-Meek & Rizzo, 2002; Kowalski & Rizzo, 1996; Rizzo & Kirkendall, 1995). At the level of immediate school milieu, what is of greatest importance for the teachers' attitude to inclusive education are the material and human resources, as well as direct support coming from headmaster (Lindsay, 2007).
In Serbia, after the three-years' period of implementation of the inclusive model of education, there is a need for the effects to be analyzed with regard to inclusive culture and practices. Bearing in mind that teachers are the key factor for the efficiency of inclusive PE, a research has been undertaken in order to examine differences in the attitudes of future and currently working PE teachers to inclusive physical education.

344
Method
Participants. The sample included 137 respondents of both genders, 85 of whom were university students, i.e. future PE teachers, while 52 were PE teachers employed by schools on the territory of the Autonomous Province of Vojvodina.
Measures. The respondents' attitudes to inclusive physical education were examined by use of the ATIPE scale (Hutzler, Zach, & Gafni, 2005). This 4-point scale of Likert-type (no neutral attitude allowed) consists of 15 items, 11 of the statements being formulated negatively (e.g.: "Children with disability often cause discipline problems during PE classes."), and four were positive (e.g.: "Children with disability can profit a lot from PE classes.") The rating scale shows high reliability (α = .844). The respondent's score on the scale is an average score (sum of scores in individual items/15), so that the respondent's result ranges from 1 to 4.
Statistical analysis. The differences in the attitudes to inclusive PE between future/pre-service and currently working PE teachers were examined by use of descriptive statistics (arithmetical mean, standard deviation, t-test for independent samples).
Results
The difference between the future and the currently working PE teacher in the average score on the assessment scale for the attitudes to inclusive physical education was tested by the T-test for independent samples (Table 1). Although the future PE teachers (university students) made a higher average score numerically than the school-employed PE teachers, the differences are not significant statistically (p > 0.05).
Table 1. Differences in average scores on the ATIPE scale between future and currently working PE teachers
Respondents M SD t p
Future PE teachers 2.63 0.39 Attitudes to
inclusive PE Currently working PE teachers 2.76 0.41 -1.72 0.09
Considering individual items, five significant differences have been ascertained (Table 2). In items nos. 4, 6, 7, 10 and 15, the teachers working in schools articulated a considerably more positive attitude as compared to students (i.e. future PE teachers). These items concern the benefits that the children with disabilities can gain from participation in physical education together with other children (item 4), possible negative effects on other pupils (6 and 7) and professional challenge posed before the teacher working in an inclusive class (10 and 15).
Table 2. The differences between future and curently working teachers by individual items of the ATIPE scale
Future PE teachers
Currently working PE
teachers Items
M SD M SD
t p
1. The PE teacher doesn’t have knowledge and skill to teach a child with sensorimotor disability.
2.40 0.84 2.40 0.87 -0.01 0.99
2. One shouldn’t include a child with disability in the class because his/her image is disgusting.
3.18 0.73 3.27 0.84 -0.68 0.50
3. Since excellence is a major requirement, it is important to avoid any disturbance to the PE class, such as inclusion of children with disability.
2.88 0.83 2.98 0.76 -0.70 0.49
4. Children with disability can profit a lot from PE classes. 2.86 0.71 3.21 0.78 -2.72 0.01 5. Children with disability often cause discipline problems during PE classes.
3.07 0.79 2.98 0.71 0.68 0.50
6. Ateacher who includes a child with disability in the class will reduce the amount of time devoted to all the other children.
2.07 0.75 2.48 0.83 -2.98 0.00

345
Table 2. The differences between future and curently working teachers by individual items of the ATIPE scale (CONT)
Future PE teachers
Currently working PE
teachers Items
M SD M SD
t p
7. A child with disability could slow the learning of his/her peers.
2.26 0.68 2.58 0.82 -2.38 0.02
8. A child with a disability is a threat to the PE teacher. 2.98 0.69 2.76 0.79 1.63 0.11 9. Children with disabilities should be taught in special classes.
2.17 0.75 2.27 0.79 -0.74 0.46
10. Including a child with a disability is a personal challenge for the PE teacher.
2.72 0.74 3.02 0.73 -2.28 0.02
11. A teacher who includes a child with disability is at risk of more stress.
2.06 0.74 2.31 0.76 -1.89 0.06
12. Including a child with disability could enhance democratic and pluralistic values.
3.08 0.64 3.08 0.77 0.04 0.97
13. Including a child with disability in the class creates frustration and embarrassment.
2.95 0.58 2.71 0.82 1.84 0.07
14. The regular class can profit from the inclusion of a child with disability.
2.55 0.70 2.71 0.78 -1.22 0.23
15. It is not appropriate to ask a teacher who is supposed to take a whole class to pay attention to the special needs of a disabled child and his/her family.
2.34 0.77 2.63 0.86 -2.04 0.04
Discussion
Teachers' attitudes to inclusive physical education are among the major factors of the effectiveness of inclusion. Facing the possibility of teaching students with disabilities, many teachers become less positive and experience anxiety and stress. According to Lindsay (2007), the problem can be alleviated through training, resources and supplemental support.
A certain number of children with developmental difficulties had been included in Serbia's regular school system before, but full implementation of the inclusive educational model in the country began in 2009, when The Law on the Fundamentals of the Education System was adopted. Children with developmental difficulties were enabled to enroll in elementary schools like their mainstream peers, without previous certification of the kind and/or degree of disability. A great many actions ensued within extremely short time, and these included training courses for teachers and related supporting school staff, a programme for strengthening schools' capacities for implementation of inclusive education, support networking in the field of inclusive education etc.
In order to examine the possible effects of those measures, we have analyzed the differences in the attitudes towards inclusive physical education between future PE teachers (university students) and PE teachers currently working in schools.
The results obtained through the research show that the two groups of respondents do not differ significantly in the average score on the ATIPE scale for assessment of attitudes to inclusive physical education. On the basis of average scale-proposed values, it can be deduced that the articulated views incline toward moderately positive attitudes to inclusive physical education. The results can be accounted for by small differences in the practical experience in inclusive education, for the period of implementation of the inclusive educational model has been very short. Insufficient in-service training of the currently working PE teachers must also be taken into account, as well as the small difference in pre-service student training of both future students and currently working teachers. Namely, an analysis of the current programmes of studies at the leading faculties in the country has shown that the content of study related to inclusive PE mostly has the form of optional subjects or modules, or is incorporated in other subjects – to a reduced scope (ðorñić, 2012); hence, the progress has not been great as compared to the earlier situation. Training to be undergone by PE teachers should comprise practically oriented modules of inclusive education, those which promote positive views of inclusion and at the same time offer a solid basis of knowledge, skills and understanding (Morley, Bailey, Tan, & Cooke, 2005).

346
On the other hand, the data obtained through the analysis of differences within individual items on the ATIPE scale show that currently working teachers consistently manifest a more positive attitude than the future PE teachers – in all items where statistically significant differences occurred. Thus, the teachers working in schools show greater agreement with the claim that children with disabilites can greatly benefit from participation in physical education together with other children, while agreeing less with the claims referring to compromised learning of mainstream students in inclusive context. At the same time, compared with the in-service teachers, future PE teachers show greater approval of the statement that it is unfair to demand from a teacher to devote special attention to children with disabilities and their parents, that is, that inclusion of children with disabilities poses a personal callenge before a PE teacher. It is possible though that the currently working PE teachers have had an opportunity to work with children with disabilities, and that they have attended some of the supplementary training courses organized by the Ministry of Education and intensified on the eve and subsequently to the introduction of inclusive model of education in Serbia's schools. Immediate experience with inclusion and advanced training can make impact on the teachers' attitude towards inclusion.
In order to further develop inclusive physical education, investments are necessary in the area of initial and continual training of PE teachers, so that teachers could build essential competence and positive attitudes to inclusion. For the success of inclusion in education, supplemental professional support and adequate material and organizational resources are a must.
References
1. Avramidis, E., Baylis, P. & Burden, R. (2000). A survey into mainstream teachers’ attitudes towards the inclusion of children with special educational needs in the ordinary school in one local education authority. Educational Psychology, 20(2), 191–211.
2. Block, M. E., & Rizzo, T. L. (1995). Attitudes and attributes of physical educators associated with teaching individuals with severe and profound disabilities. Jash, 20(1), 80-87.
3. ðorñić, V. (2012a). Initial training of PE teachers for inclusive teaching: Situation in the region. In B. Krsmanovic, T. Halasi & M. Dolga (Eds.), Summary: XX International Interdisciplinary Symposium: Ecology, Sport, Physical Activities and Health of Youth (pp. 6-7). Novi Sad: Novosadski Maraton.
4. Folsom-Meek, S. L., & Rizzo, T. L. (2002). Validating the physical educators’ attitude toward teaching individuals with disabilities III (PEATID III) survey for future professionals. Αdapted Physical Activity Quarterly, 19(2), 141-154.
5. Hutzler, Y., Zach, S., & Gafni, O. (2005). Physical education students’ attitudes and self-efficiacy towards the participation of children with special needs in regular classes. European Journal of Special Needs Education, 20(3), 309-327.
6. Kowalski, E. M., & Rizzo, T. L. (1996). Factors influencing preservice student attitudes toward individuals with disabilities. Adapted Physical Activity Quarterly, 13, 180-196.
7. Lindsay, G. (2007). Educational psychology and the effectiveness of inclusive education/mainstreaming. British Journal of Educational Psychology, 77, 1-24.
8. Mittler, P. (2000). Working towards Inclusive Education: Social Contexts. Abingdon: David Fulton Publishers.
9. Morley, D., Bailey, R., Tan, J., & Cooke, B. (2005). Inclusive Physical Education: Teachers’ Views of Including Pupils with Special Educational Needs and/or Disabilities in Physical Education. European Physical Education Review, 11(1), 84-107.
10. Sherrill, C. (1998). Adapted Physical Activity, Recreation, and Sport. Crossdisciplinary and Lifespan. Dubuque, IA: WCB/McGraw Hill.
11. Rizzo, T. R., & Kirkendall, D. R. (1995). Teaching students with mild disabilities: What affects attitudes of future physical educators? Adapted Physical Activity Quarterly, 12, 205-216.
12. The Low on the Fundamentals of the Education System (2009). Belgrade: Ministry of education.


![Informed [Heuristic] Search - University of Delawaredecker/courses/681s07/pdfs/04-Heuristic...Informed [Heuristic] Search Heuristic: “A rule of thumb, simplification, or educated](https://img.dokumen.tips/doc/110x75/5aa1e13c7f8b9a84398c48b6/informed-heuristic-search-university-of-delaware-deckercourses681s07pdfs04-heuristicinformed.jpg)