Embed Size (px)
Citation preview

PHYSICAL ASPECTS Q? A
RADIOBIOLOGICAL PION BEAM
David Reginald Perry, M.Sc.
Submitted to the University of Surrey as a thesis for the Degree of Doctor of Philosophy.
(University of Surrey and Rutherford Laboratory collaborative course of study).
September 1975*

ProQuest Number: 10804357
All rights reserved
INFORMATION TO ALL USERS The quality of this reproduction is dependent upon the quality of the copy submitted.
In the unlikely event that the author did not send a com p le te manuscript and there are missing pages, these will be noted. Also, if material had to be removed,
a note will indicate the deletion.
uestProQuest 10804357
Published by ProQuest LLC(2018). Copyright of the Dissertation is held by the Author.
All rights reserved.This work is protected against unauthorized copying under Title 17, United States C ode
Microform Edition © ProQuest LLC.
ProQuest LLC.789 East Eisenhower Parkway
P.O. Box 1346 Ann Arbor, Ml 48106- 1346

SUMMARY
The potential usefulness of stopping negative pion beams in radiotherapy is discussed, with particular reference to their physical properties. A brief history of work in this field is given'.
A low momentum secondary beam line was constructed to transport pions, produced in a target bombarded with 8 GeV/c protons, to an irradiation area. This facility was primarily intended for radiobiological experiments and physical measurements relevant to pion radiotherapy. The stages of the design of the beam line are outlined and details of performance are given.
Radiobiological experiments carried out in the peak, plateau and surface regions are summarised. The biological and physical consequences of the beam’s wide momentum bite (13 fwhm) are examined.
A detailed description is given of an experiment #iich measured the relative spectra of secondary particles leaving a carbon surface at the pion stopping peak. Si/Csl counter telescopes measured the relative spectra of protons, deuterons, tritons, He ions and Li ions. An unfolding technique was used to derive the pion capture emission spectra, -which are compared with published calculations and experimental data. Suggestions are made for an extended programme of secondary particle measurements.

CONTENTSPage No.
1. INTRODUCTION.......... .. .. .. .. 12. PION RADIOTHERAPY .. .. .. .. 1
2.1 Characteristics of Negative Pions .. .. .. .. 12.1.1 Direct Ionisation ..................... 12.1.2 Negative Pion Capture .. .......... .. 22.1.3 Linear Energy Transfer (LET) .......... 42.1.4 Relative Biological Efficiency (HBE) .. ., 42.1.5 Oxygen Enhancement Ratio (OER) .. .. .. 5
2.2 General Assessment of Pion Radiotherapy .. .. 6
2.2.1 Expected Properties of Pion Treatment Fields 72.2.2 Comparisons with Other Radiations .. .. 9
2.3 History, Present State and Future Plans •• .. 112.3*1 Origins ............................. 112.3*2 First Steps towards Pion Therapy .. .. 112.3*3 The Nimrod Facility .. .. .. . . .. 122.3*4 Low Dose-Rate Radiobiology •• .. .. .. 122*3*5 Physical Measurements .. .. ........... 132.3*6 The Future: High Intensity Beams .. .. 13
3. QHE NIMROD STOPPING PION IRRADIATION FACILITY .. .. 153.1 Feasibility Study .. .. .. .. 153.2 Beam Line Design: Basic Requirements .. .. .. 183.3 Detailed Studies of Design and Predictions of
Performance......... . . • .. .. •. .. 203.3*1 First Approximation: Quadrupole Pair •• 203*3*2 Computations for Complete System .. .. 203.3*3 Scattering and Straggling .............. 233*3*4 Conclusions........ . .. .. .. •• 24
3*4 Beam Line Construction and Operation .. .. .. 253*5 Performance Measurements and Dosimetry .. .. .. 2 6
3*5*1 Materials .. .. .. .. ........... 2 63.5*2 Dose Measurements .. .. . . . . .. 273*5*3 Star Distribution Measurements •• .. . , 2 8
(iii)

Page No.3*6 Use of the Beam for Radiobiology ... ...... ., 30
3.6.1 Reduction in Growth of Broad Bean Roots .. 313*6.2 Low Temperature Irradiation of HeLa Cells • • 313*6.3 Irradiation of HeLa Cells at Room Temperature 323*6.4 Chromosome Aberrations .. .. .. .. 323.6.5 In Vivo Experiments with Mice ,.. .. .. 33
4. PION CAPTURE PRODUCT SPECTROMETRY- .......... .. .. .. 334*1 Relevance to Dosimetry and Biological Effects .. 334*2 Previous Calculations and Measurements .. . • .. 354.3 Discussion of the Thick Target Counter-Telescope
Method............... ............ .. .. 384*3*1 Spectrum Unfolding .. .......... .. 42
4*4 Description of Apparatus and Experimental Techniques 454*4*1 Target Chember and Detectors .. . . . . 454*4*2 Electronics.......... .. .. .. .. 464*4*3 Normalisation . . . . . . . . . . .. 474.4*4 Calibration .. .. .. 48
4.5 Analysis of Results .. 494*5*1 Particle Identification .. 494*5*2 Background Subtraction .. .. ,. .. 504*5*3 Analysis of He Spectrum . . . . .. .. 504*5*4 Particles of Charge Greater than 2 .. .. 514.5.5 Separation of Singly-charged Particles .. 514*5*6 Normalisation between Detector Systems .. 524*5*7 Computation........................ 534*5*8 Unfolding of Emission Spectra .. .. .. 534*5*9 Errors..... .. .. .. .. .. 54
4.6 Discussion of Results and Comparison with Other Work 554*6.1 Thick Target Spectra .. .. . • . . . . 554.6.2 Unfolded Emission Spectra .. .. .. ... 56
5. CONCLUSIONS AND SUGGESTIONS FOR FURTHER EXPERIMENTS .. 595*1 The Pion Beam .................. .. .. .. 595.2 Pion Capture Product Spectrometry *.............. 595*3 Ihe Future of the Beam L i n e ..... .. .. 61
(iv)

6. ACKNOWLEDGMENTS7. REFERENCES Tables 1 - 6
Figures 1 - 1 8

1. INTRODUCTIONThe work described in this thesis is part of a programme -whose
purpose is to increase our knowledge of the physical and biological properties of negative pion beams. This programme is being carried out primarily in order to evaluate the potential usefulness of pion radiotherapy, although some of its results may be of wider interest, especially in the field of high-LET radiobiology, which is also relevant to health physics. At a later stage it could provide basic data for the development of treatment procedures.
Unlike most projects carried out on high energy accelerators, this work is in the realm of applied rather than pure science, as it has a potential practical application in view from the start.
This thesis is principally concerned with physical aspects of this programme. In particular it describes the design and performance of a pion irradiation facility and an experiment carried out on it -which determined charged particle spectra in the pion stopping region. The radiological part of the programme is however summarised, and special attention is given to those aspects which are believed to be particularly dependent on specific physical parameters.
2. PION RADIOTHERAPYIn the following sections the basis of pion radiotherapy is
discussed. A review of both physical and radiobiological aspects has been written by Raju and Richman (1972).
2.1 Characteristics of Negative Pions
2.1.1 Direct IonisationThe ionisation distribution produced as charged pions are
slowed down and brought to rest in matter resembles that of protons rather than that of electrons. In particular, the effects of multiple scattering and statistical fluctuations of ionisation are relatively small, so that, in the absence of other effects, pions deviate little from their initial paths and have quite well-defined range-energy relationships. As with heavier particles, there is a rapid increase in specific ionisation, and therefore in energy deposition, just
- 1 -

before they come to rest: this effect is known as the Bragg peak.For a beam of particles stopping within an absorber these peaks are distributed over a volume whose size depends on the particle type, the beam energy, energy spread and geometry, and on the nature of the absorber.
The Bragg peak effect clearly provides a mechanism :by which a radiation dose can be delivered deep inside a body in such a way that a smaller dose is given to overlying tissue in which damage must be limited. However, a very high but narrow dose peak is not of practical radio therapeutic value; it must be broadened, so as to cover the complete thickness of a tumour, with an adequate margin for positional uncertainties. Such broadening can be achieved by varying the beam energy during treatment, by widening the beam energy spectrum or by using variable thickness absorbers. The end-of-range dose enhancement will then be much smaller, and possibly insufficient by itself to justify the use of the technique.
All charged particles (except electrons) can also provide a sharp cut-off beyond the treatment volume and well-defined beam . edges. Both of these properties can be of value in minimising the damage to nearby sensitive organs and the overall dose to healthytissue.
Charged pions might appear to be somewhat less attractive in these respects than protons and other light nuclei. They are only available as short-lived secondary products of very high energy (over 300 MeV) primaiy beams. Furthermore, the pion beam intensities which can be provided are several orders of magnitude smaller than those of the primary beams. Therapeutic facilities could therefore only be based at a few powerful and expensive accelerators.
2.1.2 Negative Pion CaptureThe feature which has stimulated and maintained interest in pion
therapy, in spite of the disadvantages mentioned above, is the phenomenon of stopped negative pion capture and the nuclear disintegration which it causes. *
When positive pions reach the end of their ranges and have only .thermal energies, coulomb repulsion makes nuclear interactions—8unlikely to occur before muon decay (half-life 2.6 x 10 seconds).
- 2 -

The muons impart their small kinetic energy (4 MeV) locally, but the positrons, into which they, in turn, decay, have a mean kinetic energy of about 30 MeV, of -which only a small part is dissipated within a usefully short distance. In both decay stages a large part of the available energy is carried off by neutrinos. 2hus only a few percent of the 140 MeV positive pion rest mass is converted into •useful dose, viiich only slightly augments the end-of-range peak.
By contrast, negative pions have a large proportion of their mass converted into locally dissipated energy. They are attracted towards nuclei and enter orbits like those of electrons but of much smaller radius. The pions cascade inwards from one empty state to the next, emitting photons (pi-mesic X-rays) at each transition. In the innermost orbits they spend much of their time inside the nuclei and soon interact with them. The rest masses of the pions are absorbed by the nuclei, viiich cannot long retain such large amounts of additional energy. In about %?<> of captures all or a large proportion of this energy will be emitted as high energy gammas and effectively lost from the useful field (Davies et al., 1966). About ifo of negative pions stopped in tissue will produce neutral pions by charge exchange after capture by hydrogen nuclei. The subsequent decays into pairs of gammas again prevent any significant local energy deposition. Most captures on hydrogen, however, are followed by diffusion of the mesic atoms until they encounter heavier nuclei, to which the pions are transferred because of the greater orbital binding energies. The loss of useful dose due to muon decay is small, as only about 2fo of stepped negative pions decay (compared 'with 98/1 for positive pions): this is because the time elapsing between stopping and nuclear capture is much shorter than the pion half-life.
On average, about 30 MeV of the rest mass of a captured pion is dissipated locally by heavy charged particles; these are protons and heavier fragments resulting from nuclear disintegration. Ibis is often referred to as the "star dose". An average energy of 70 MeV is carried off by neutrons and is largely lost from the region of interest (but becomes rather more important in large fields, for which the probability of neutron interaction within the field is greater). About 40 MeV is completely "lost" in overcoming nuclear binding energy. The high energy gamma rays previously mentioned, and lower energy gammas from nuclear de-excitation, carry a few
- 3 -

percent of the initial 140 MeV energy per pion, but even in large fields would make only a slight dose contribution. Energy lost from the useful field may nevertheless be deposited within the body: thismust be taken into account in the overall assessment, in terms of both the integral body dose and the dose to specific critical organs.
2.1.3 Linear Energy Transfer (LET)Energy deposition, or absorbed dose, is not the only parameter
determining biological effect; temporal and spatial distributions are also most important. At the microscopic level, the density of ionisation and excitation along a charged particle track can greatly influence the efficiency with ■which the energy dissipated causes biological changes. It is customary to correlate biological changes with LET, the energy lost per unit distance as a particle travels through a material. Sometimes a restricted energy loss is used: thisincludes only events depositing less than a given energy, secondary tracks (delta rays) carrying more than this energy (e.g. 100 eV) being treated separately in order to give a better representation of the energy dissipated within small biologically relevant volumes or distances.
2*1.4 Relative Biological Efficiency (REE)The biological damage for a given energy deposition generally
increases with LET up to about 2000 MeV cm^ g ^ (200 keV/jun): thatis to say, the relative biological efficiency (RBE) increases. This increases the effectiveness of the energy lost by a particle as it slows down until either maximum energy loss or biological saturation (over-kill) is reached.
Pions, being light and singly charged, would only have significantly h.igh LET's for very small distances at the ends of their ranges. Even in a monoenergetic beam the effects of this would be masked by straggling.
The secondary particles produced by pion capture are heavy and often multiply charged. They include protons, deuterons, tritons, alpha particles and heavier nuclei of charge 3 or more, many of them having high LET*s for all of their paths. For radiotherapy, the importance of the high LET particles lies not in the absolute value
- 4 -

of the RBE of the treatment field, but in the value relative to radiation fields to vhich healthy tissue is exposed* especially in the beam entrance region. An overall high but constant RBE would, by itself, merely save treatment time.
Pions in flight can also interact with nuclei and produce heavy secondary particles. About 2$ of pions do this for each cm of path, causing an enhancement of both dose and RBE in the so-called plateau region between, the entrance surface and the end-of-range peak (Boyd,197l) • The results of RBE calculations or measurements may therefore be expressed relative to a point in the plateau region, rather than to standard X or gamrna radiations. The definition chosen in any particular work should be clear from its context.
Ultimately, radiotherapy RBE values will be finalised in clinical trials; until then, experimental values will provide guidance for planning, but can only truly apply to the actual conditions, biological systems and end-points from which they are obtained. Calculated values based on the properties of particles (e.g. LET v. RBE relationships) should be treated with even greater caution.
2.1.5 Oxygen Enhancement Ratio (QER)For low LET particles such as electrons (and therefore for
photons, which deposit energy via secondary electrons), about 3 times more dose is generally required to achieve the same biological effect in the absence of oxygen than when it is present. Ihis dose ratio is known as the OER. Many tumour cells are deficient in oxygen through having a poor blood supply, and it is believed that these cells reduce the probability of tumour eradication. Increases of dose by a factor sufficient to kill these resistant hypoxic cells can cause unacceptable damage to nearby healthy tissue.
Many techniques for overcoming this problem have been tried or proposed; they are discussed by Duncan (1973) who considered that none had yet ”been demonstrated convincingly to be of real therapeutic advantage”. It is possible that in clinical trials the advantages of those methods for which data was available had been obscured by the re-oxygenating effect of dose fractionation, which is used in most radiotherapy schedules. The primary aim of fractionation is to assist the better organised and more slowly proliferating healthy tissue to
- 5 -

repair itself between the doses, which it does more efficiently than the tumour tissue. However, fractionation also results in an increased oxygen supply to tumour cells, probably because of improved blood flow and a reduced oxygen demand due to the death of well-oxygenated cells.
Unfortunately dose fractionation does not appear completely to prevent the survival of hypoxic tumour cells; therefore radiations with a low QER (or whose secondaiy particles have a low OER) are being studied. These are principally neutrons, heavy ions and negative pions. The charged particles produced by nuclear disintegration after pion capture have high LET's, particularly towards the ends of their paths, and can therefore be expected to reduce the QER of the radiation field in accordance with the LET v. QER relationship, as discussed by Barendsen (1968) and by Raju and Richman (1972).
The.QER for a specific effect in the mixed radiation field produced by pion beams can be expected to be intermediate between those for gamma rays and slow heavy ions (typically 2.7 and 1.0 respectively) and should be lower in the end-of-range region than at lesser depths.
Calculations and the limited range of experiments carried out (see Sections 2.2, 2.3*4 and 3*6) have given QER values for the pion peak in the region of 1.8, similar to those for fast neutrons. In tie present uncertainty regarding the significance of hypoxia in radiotherapy, the practical gain from a reduction in OER is difficult to assess. It is hoped that the results of fast neutron radiotherapy now being carried out will help to indicate whether and to what extent a low QER is of value.
2.2 General Assessment of Pion RadiotherapyUp to the time of writing, studies of large volume, high dose
rate, pion irradiation fields have necessarily been based on calculation and extrapolation from low intensity beam experiments.Physical parameters such as absorbed dose and LET spectra can, in principle, be calculated at any part of the field for any specified ' beam and absorber. Such calculations need to be based on good physical data. Of particular interest are the spectra of the secondary products of pion capture. The experimental work described later in this thesis contributes to such data.
6 -

Calculations can be extended to the calculation of radiobiological quantities, especially RBE, QER and cell survival, provided that the relationships between the physical and biological parameters are known for the components of the field and that the properties of a complex field can be obtained by valid additive or averaging processes. At present, adequate quantitative models only exist for certain simple biological systems, especially cell cultures. Further extension to radio therapy can only be approximate in the absence of full understanding of the comj lex dynamics and interactions of .in vivo processes. As in conventional therapy, optimisation of doses and treatment procedures, for example fractionation schedules, will probably require trials on a large number of patients, followed by a long delay before cure rates can be established. However, a supporting programme of physical, dosimetric and biological studies should narrow the range of uncertainties and assist in the establishment of good semi- empirical models for practical treatment planning.
2.2.1 Expected Properties of Pion Treatment FieldsArmstrong and Chandler (1974A) have made a detailed study of a
hypothetical negative pion radiotherapy beam using a Monte Carlo radiation transport code combined with a cell inactivation model fitted to experimental data for human kidney cell cultures. The beam had a radius of 2*5 cm and a range distribution adjusted to give a nearly uniform pion capture distribution between depths of 12.5 cm and 17*5 cm. Single-sided and symmetrical opposed exposures on a 30 cm thick slab were both examined. Qhe physical data calculated were the absorbed dose distribution in and around the beam and the average LET spectra in different regions.
From these and the cell survival model, survival was calculated as a function of dose for each region, for both aerobic and anoxic irradiations. In both conditions, single-sided irradiations had the greatest RBE in the region Just beyond the peak, because of the large proportion of pion capture neutrons (average energy about 20 MeV), and the small proportion of low LET dilution. Similar properties were found at the sides of the beaks. Also calculated were OER and RBE distributions at different survival levels,, and the effects of various dose fractionation schedules. For example, for 1C$ cell
-■7 -

survival, the aerobic EBE*s for the plateau and peak regions were1.1 and .1.9 respectively, and the corresponding GER's were 2.4 and 1*6. Similar values were obtained for both single and double sided irradiations, but for the latter were more uniform in the peak regions. The ratio of peak to plateau absorbed doses was about 2.5 for single sided, and 4 for double sided irradiations.
On the basis of these calculations, the properties of a beam of this kind can be summarised as follows. The plateau region has similar properties to a gamma ray field (in the calculations the effects of pion interactions in flight - about 2?o per cm - were found to be slight). The peak region not only has the advantage of a high absorbed dose, even for single port treatment, but also has a high RBE and an OER near to that for fast neutrons. Pions produce quite well- defined beams in absorbers and have reasonably small end-of-range straggling. The dose peak can therefore be quite accurately shaped (by beam parameter adjustment) to cover a required volume at any depth in the body. In all directions, most of the dose fall-off at the edges of the peak occurs in about 2 cm, which is satisfactory for treatment fields of a few cm or more in diameter or-depth, but would be insufficiently sharp for Hie irradiation of small volumes (e.g. pituitary inactivation), for which protons or heavier ions, with less scattering and straggling, might be preferred.
The calculations described are very detailed but cover only one idealised situation. In practice, beams will not be parallel or pure, and providing a specified momentum spectrum is not a simple matter. Furthermore, patients are not of uniform density and composition, nor are tumours convenient geometrical shapes on the centre-line of the body. Tie accurate placing of Hie dose peak at Hie correct depth, in the body is a problem that is largely new to radiotherapy and may require special detection systems (possibly gamma cameras detecting pi-mesic X-rays).
Nevertheless, it is clear Hiat negative pion beams have an excellent combination of useful properties. An additional feature, not previously mentioned, is the. relative ease with which they can be focussed and deflected by magnetic fields (for the same range, protons require about four times the field to achieve the same deflection) •This is utilised to good effect in the proposed Stanford facility (Boyd et al.? 1973)(i*i et al., 1974), in which pions from-a common
- 8 -

production target are directed onto the tumour via 60 independently adjustable beam channels around a % 0 ° arc. (Superconducting magnets are specified, in order to achieve a reasonably compact and economical arrangement).
2.2.2 Comparisons v/ith other RadiationsTie low LET radiations at present used in deep therapy (gamma
rays, high energy X-rays and, to a lesser extent, electron beams) donot produce well-defined deep dose peaks. Broad secondary electronbuild-up peaks can be produced by electron beams and by X-rays fromaccelerators with energies over about 15 MeV, and may in certain casesbe suitable for the irradiation of very large volumes. Electronssuffer severe scattering which gives very diffuse beam edges, and athigh energies the secondary electrons from X-ray beams have longranges which also lead to a loss of edge definition. Tie generalcompromise for common use is an X-ray beam from an accelerator of about6 MeV. Deep therapy with this radiation, or with the fairly similar £0Co gamma rays, requires one of the many multiple port or moving beam techniques in order to concentrate dose onto tumours without unacceptable damage to overlying tissue.
These procedures are well tried and achieve valuable cure rates; any new methods must offer definite advantages if they are to be accepted. These advantages could be in the form of higher cure rates for the same tumour types, in extension of the range of treatable conditions, or in simpler treatment schedules (e.g. smaller numbers of <fields?:or dose fractions). These may have to be set against disadvantages such as high initial or running costs, inflexibility of beam orientation or low dose rate (which is likely to result in uneconomic use of both staff and equipment, as well as discomfort to patients). ‘ .
Past neutron beams, in which the dose to tissue is mainly due torecoil protons, produce depth-dose distributions similar to gamma rayand megavoltage X-ray beams, and therefore similar means must be used
252for tumour dose concentration. Cf inplants, producing neutrons by spontaneous fission, provide a means of localising a high neutron dose at the expense of dose uniformity (regions of very high dose occur • close to the sources). The Hammersmith Hospital cyclotron neutron
~ 9 ~

therapy results (Catterall et al. 197l) are the most highly detailed for any high LET radiation and show the feasibility of fast neutron therapy as well as establishing suitable doses for effective tumour treatment-with acceptable skin reaction.
It would be most difficult to establish a quantitative correlation between oxygenation, the type of radiation and cure rate from the results of therapy trials - too many variables are involved, many of which are little understood or difficult to measure in vivo. However, the similarity in absorbed dose distribution between neutron and megavoltage X-ray beams should provide a basis for comparing the effect of the dosimetric properly in which they differ most, namely LET spectrum. Overall changes in biological effectiveness should not change the success rate for optimised exposures, but if the reduced GER does cause a lower survival level for hypoxic cancer cells there should be a proportion of cases vhere it leads to a successful treatment vhich would not otherwise have been possible. (Statistical evidence alone will not, of Course, conclusively prove a causative relationship,)For this reason neutron therapy, the first high LET radiation to come into regular use, is seen as providing guidance for all proposals for high LET radiotherapy.
Katz and Sharma (1974) have applied a theoretical model to experimental aerobic and anoxic data on kidney cell cultures in order to intercompare different high LET radiations: neutrons, heavy ionbeans and negative pions. (Their track structure model was also used in the previously quoted work of Armstrong and Chandler). They summarise their findings in terms of two key parameters, the predicted relative in vitro survival (t) of anoxic and aerobic kidney cells if cultures were placed at the same depth as the tumour, and the survival (s) of aerobic cells at the body surface. They conclude that if (t) is not critical (i.e. radio-resistance of anoxic tumour cells is not a major limitation), the choice is in favour of pions, deuterons or helium ions, but if (s) is not important (i.e. treatment is not limited by skin reaction) and a near-unity value of (t) is required, then heavier ions are indicated, neon being suggested. In practice, both factors are likely to be important: the authors state thatnegative pions seem to be the best compromise, with a value of (t) better than that for oxygen, ions and a value of (s) better than that for deuterons. 3hus pions should combine efficient eradication of
- 10 -

anoxic tumour cells with a sufficiently high survival of surface region cells.
With all these charged particle beams, the peak region must be distributed with adequate uniformity of critical parameters over the full extent of a tumour. Extension of the peak in the incident beam direction reduces the peak to surface dose ratio (and the biologically effective dose even more) and increases the average GER by diluting the particle track ends or pion stars with the tracks of relatively fast particles travelling to greater depths. This is clearly not a uniform effect, being greatest at the front edge of the peak and negligible at the back. Opposed field treatment, if not impracticable for other reasons, is therefore not only advantageous for surface dose reduction but also for improving the uniformity of the properties of the peak region.
2*3 History, Present State and Future Plans
2.3.1 OriginsThe first artifically produced pions were reported in 1948 by
Gardner and Lattes. In that instance they were produced by bombarding a carbon target in the Berkeley cyclotron with 38O MeV alpha particles, but soon production by photons, neutrons and protons had also been demonstrated. Positive and negative pions were produced and, from the evidence of the photon pairs resulting from their rapid decay, the formation of neutral pions was demonstrated. By the early fifties, the major properties of pions had been discovered and measured, from cosmic ray as well as accelerator experiments, and the general characteristics of negative pion capture and secondary particle production had been studied in nuclear emulsions.
2,3*2 First Steps towards Pion TherapyRichman and Fermi are among those #10 first appreciated the
possible value of negative pions in radiotherapy but the first published work specifically on this subject appeared some years later (Fowler and Perkins, 196l). Xu this paper, pion absorbed dose distributions were calculated and compared with those from gamma and proton beams. Effective biological doses taking estimates of RBE, but not OER, into account were also made.
- 11 -

The emulsion experiments of Fowler and Mayes (1967) were carried out in a low intensity pion beam at the CEEN synchrocyclotron in about 1964 in order to provide information for calculations of the dose from pion stars in tissue. Further physical measurements in this field were carried out mainly at CEEN and LRL, Berkeley, using pion beams from synchrocyclotron targets bombarded with 600 and 730 MeV protons respectively. The pion kinetic energies were in the region of 50 to 100 MeV, corresponding to ranges in tissue from about 10 to 30 cm.
2.3.3 The Nimrod FacilityIn 1964, P. H. Fowler (1965) suggested that Nimrod, a 7 GeV proton
synchrotron which had just started operation at the Rutherford Laboratory, could provide a suitable pion source .for preliminary biological irradiations and, in collaboration with J. F. Fowler and J. Rotblat, he made proposals for an experimental programme.Unfortunately, this was not carried out and it was not until 1968 that, following discussions between R. E. Ellis and P. J. Lindop and members of the Rutherford Laboratory Radiation Protection Group, the present writer undertook a feasibility study (Perry, 1968). The writer took advantage of the low momentum required (compared with most Nimrod physics beams) to devise an arrangement which would cause little interference with the laboratory's physics programme, enabling it to have a ' high degree of availability compared wdth other facilities, and which would be economical in its demands on materials, space, electrical power and other laboratory services. The beam line (designated 7f 11) was completed and commissioned in 1970 (Perry and Hynes, 1971 )• The first biological irradiations were carried out in 1971? some preliminary results being announced in 1972 (Ellis et al., 1972), (Shewell et al.,1972) and (Winston et al., 1972).
2.3.4 Low Dose-Rate RadiobiologyUntil late 1974? all pion radiobiology had been carried out in
beams of a few square centimetres cross-section and at absorbed dose- rates in the peak always less than 200 rad/h and generally much less than this (at CEEN less than 5 rad/h). These dose-rates were far too small for many important experiments which should be carried out in pre- therapeutic studies. It is generally necessary that exposures should be given in a reasonably small fraction of the cell cycle time. (This
- 12 -

can be achieved if the system gives meaningful results from small doses or if the cell cycle can be slowed down or arrested by cooling^)
Raju and Richman (1972) have reviewed the Berkeley results. They quote RBE values in the peak region (relative to the plateau region) varying from 1.4 (arginine reversions in yeast) to 5 (proliferative capacity of ascites tumour cells). Most of the experiments however, including three with cultures of human kidney cells, gave values betv/een 2.0 and 2.5* Determinations of OER in the peak vary from 1*35 to 1.5 for vicia faba (meristem growth inhibition) to 1.9 for arginine reversions, kidney cells giving 1.6 to 1.8. The authors point out that wider peaks or higher degrees of beam contamination gave lower EBE's and higher OER1 s. Baarli et al. (1972) have similarly summarised CEEN experiments with positive and negative pions and 400 MeV neutrons.The pion results are limited by the very low dose-rates but are in general agreement with those obtained elsewhere.
The biological experiments carried out on the Nimrod beam will be discussed in Section 3*6 of this thesis.
2.3*5 Physical MeasurementsEach pion beam's biological experiments have been accompanied by
programmes of physics and dosimetry. This work is often only fully relevant to one particular beam but much is of more general interest. The Raju and Richman paper reviews the physical measurements at CEEN, Berkeley and the Brookhaven Cosmotron, and gives an extensive bibliography. The topics covered include depth-dose distributions, pion survival measurements, beam contamination studies, LET spectrometry, comparisons with positive pions and the development of techniques for peak location during and after treatment.
The physical measurements carried out on the Nimrod pion beam will be discussed in Section 3*5•
2.3.6 The Future: High Intensity BeamsThe next major stage will be the establishment of beams of
sufficient intensity to provide suitable dose-rates over realistic treatment volumes for radiotherapy trials on selected cases. A typical target specification for a facility capable of carrying out a limited programme could be a beam giving a peak achieving an absorbed dose-rate
- 13 -

of 10 racy min over a 10 cm cube (maximum, adjustable as required) centred at any depth up to 20 cm, and with means for adjusting the pion capture distribution so that the effective dose is uniform to■f fd 8- 5% over the peak region. This would require about 2 x 10 pions per second, an order of magnitude more than previously available. The product of field volume and dose-rate would appear to indicate that a larger increase in intensity would be required, but large fields can be shaped so that most of the pions and their charged secondaries stop within the useful volume (defined, for example, as the field region with more than of the maximum dose), whereas in narrow beams it is possible for over 9Ofo of the star track energy to be wasted, i.e. deposited outside the useful volume. Pion scattering and straggling, and the ranges of secondary particles are severe limiting factors in the efficient utilisation of narrow beams.
Four "second generation" beams capable of producing treatment fields, generally described as biomedical facilities, are being built or commissioned at the time of writing. These are at Stanford, based on a conventional 1 GeV electron linac but later intended to operate from a superconducting accelerator (Kaplan et al., 1973) • at Los Alamos, using the LAMPF proton linac, (Boyd, Schwettman and Simpson, 1973)# at Zurich using the SIN sector focussed cyclotron (Haefeli, 1972); and at Vancouver, based on the TRIUMF sector focussed cyclotron (Harrison and Lobb, 1973)* Clinical trials at one or more of these facilities are expected to commence after one to two years of preliminary work. Test exposures on two patients have been recently reported from LAMEF (Nuclear News, December 1974). These were not regarded as therapeutic trials, but as tests of the dose-response relationship. A
A proposal (Butterworth and Reading, 1973) has been made for a large aperture beam line, suitable for therapy trials, to replace the existing Nimrod *7*11 beam line. However, it is not now likely that this will be built (see Section 5).
Medical evaluation will require the treatment of a suff iciently large number of patients to be compared with conventionally treated controls. Two to five years will then have to elapse before the efficacy of the new technique can be properly assessed. If a statistically significant improvement in cure rates can be demonstrated for
- 14 -

a range of cancer types and sites, pion therapy may become a standard technique, particularly if the cost of producing pion beams can be brought closer to that of conventional methods. It seems reasonable to assume that the replacement of all radiotherapy by some other method will not happen before these assessments and decisions are made, but there is a greater possibility that it will become practicable to overcome the radiation resistance of hypoxic cells by the use of high electron-aff inity drugs (Hall and Chapman, 1974).
3. THE NIMROD STOPPING PION IRRADIATION FACILITY
3.1 Feasibility StudyThe first stage was an examination of the possibility of
establishing a beam of sufficient intensity for radiobiological experiments on sensitive systems, but compatible with the requirements of the Nimrod physics experimental programme (Perry, 1968).
Two types of arrangement were considered. The first was an extension of an existing and simultaneously used high momentum physics beam line, using a degrader (probably a graphite block) to slow the pions down from high momenta, typically over 500 MeV/c, to those of interest in radiotherapy: 100 to 200 MeV/c. (This corresponds tokinetic energies of 30 to 100 MeV, and ranges in soft tissue from about 5 to 30 cm) • This method was shown to have several serious disadvantages, as follows:
(i) Large angular and lateral divergences, due to multiplescattering in the degrader, giving a large effective source size which would be difficult to focus.
(ii) 80-9Q?o loss of pions due to nuclear interactions wo.thin the degrader, for an initial momentum of 500 MeV/c, and, from these, secondary neutron contamination.
(iii) Broadening of the Bragg peak due to straggling and initial momentum spread (e.g. a total spread of 9 cm about a mean range of 15 cm for an incident beam momentum of 500 MeV/c - ify.
(iv) Muons would not be attenuated by. interaction, and additional ones w/ould result from pion decay in the degrader. This wrauld cause low-LET contamination.
(v) The *upsteam1 experiment would require to operate at different momenta. Each change would require a different degrader
- 15 -

thickness to hold the emergent beam mean momentum constant, and even then other important parameters would be changed.
The overall properties were thus seen to be a very low dose-rate over a poorly defined peak, a high degree of contamination from muons (electrons also would not be greatly attenuated by a low-Z degrader) and serious inconvenience due to dependence on the high momentum experiment upstream.
The writer therefore proposed that the facility should be an independent secondary beam line, sharing only a primary proton beam and a target, with the following specification:
(i) The pion source would be a target at a focus of an 8 GeV/c(7 GeV) extracted proton beam with a mean intensity of the
11order of 10 protons per second (the pulsed structure of the beam is not important in this work, apart from possible detector saturation problems in some physical measurements).
(ii) The target (a rectangular metal block up to 100 mm long in theproton beam direction, but with a cross-section only a fewmillimetres square) would be shared with one or more high momentum secondary beam lines. Because of its low momentum, a stopping pion beam could use a much larger production angle (even over 90°) than other secondary beams, which generally lay at less than 30° to the primary proton beam. This would enable pion radiobiology to procede simultaneously with, rather than in competition with, other experiments j also the facility would occupy space not required for other beam lines. These features were considered greatly to enhance the acceptability of the project.
(iii) The dose-rate in the capture peak region should be at least 2 rad/h ,* uniform to - 1C$ over a 3 cm diameter by 3 cm deep cylindrical volume (approx. 20 cm^). It was estimated that this would require a beam intensity of 3 x 10^ pions/s, with a momentum bite of 5%, for a 'nominal mean range of 13 cm in tissue-equivalent material. For design purposes a momentum of 156 MeV/c was used (corresponding to a kinetic energy of nearly 70 MeV).
(iv) Contaminants of the pion beam should not contribute more than 30 o, and preferably less than 10$, of the total peak region
absorbed dose. Decay of pions in flight could be expected to
- 16 -

cause muon contamination, some of which would "be transported to the irradiation region. Decay of neutral pions within the target (with a half-life of 10 *^s, they are most unlikely to leave it) produces pairs of high energy gammas which may in turn produce electron pairs within the target. Some of the negative electrons will have momenta similar to the beam line design value.and in a purely magnetic channel would be transported and focussed like the negative pions, but without losses by decay in flight. The other most significant contami- nation would be neutrons, produced in or near the target and transmitted through the beam pipe, probably after scattering. The largest component of the dose from the nuclear cascade products penetrating shielding would also be due to neutrons.At the time of the study, accurate prediction of the yield-of low energy pions at large angles from 7 GeV (8 GeV/c) protons striking a copper target was difficult. The value used was obtained by extrapolation from computations by Alsmiller and Barish (1968) for protons with energies from 0.75 to 2 GeV.
This yield value can be expressed in the form:
~ 2 x 10~2f (100^) pions per steradian per interacting proton;5 p(vhere 100 is the percentage momentum bite of the beam line),^ oassuming a production angle of 90 , a copper target and a 7 GeV primary
proton beam. This value is believed to be nearly independent of pretonenergy (if over a few GeV), angle (if large) and target material. Itseemed reasonably consistent Y/ith 30 GeV values computed for smallerangles by Hagedorn and Ranf t (1966).
—8Charged pions have a half-life of 2 x 10 s. At 156 MeV/c, allov/ing for the relativistic correction to observed half-life, 12$ of the pions decay in a one metre path, and 50fo are lost in 6 metres, the length which was eventually achieved betv/een target and irradiation area. A short beam line v/as therefore sin important requirement, both for maximum pion survival and for minimum muon contamination, (it T/as noted that both the CEEN and Berkeley beam lines were about 12 m long). An important factor in determining beam line length Y/as the requirement for a massive shielding wall between the target and the experimental area; a concrete wall wrould be 3 metres thick, whereas 1.2 metres of iron would suffice and would therefore be preferable.
- 17 -

The beam intensity and peak dose-rate were then estimated forconditions ■which seemed representative of -shat might be achieved.These were: a copper target 50 mm long (in this length of theprotons in a 7 GeV beam would interact), a primary beam intensity of 11 ^2 x 10 protons per second (mean), a beam line acceptance solid angle of 5 millisteradians (based on a magnetic quadrupole pair as a collection system), and a momentum bite (“^) of 5% (equivalent to an energy spread of 6 MeV at 70 MeV or a 3 cm variation in range in tissue).
Using the pion yield figure already given, this gave an intensity 5of 1*5 x. 10 pions per second, after allowing for decay losses in a 6 m
length. If the pion captures were uniformly distributed over a 3 cm diameter by 3 cm deep cylinder of tissue and each, on average, caused a local energy deposition ("star dose”) of 30 MeV, then altogether they would produce a dose-rate of 12 rad per hour, plus an additional 0 - 2 rad per hour from pion kinetic energy dissipation within the cylinder.
Such an idealised capture distribution cannot be realised in practice. In a narrow pion beam, such as this, scattering, straggling, the ranges of secondary particles and the optical limitations of the beam transport system combine to give a non-uniform distribution. If the cylinder encloses a useful field where doses lie between 80 and lOCffo of the maximum, so as to give - lOfo uniformity, then a large proportion of the captures, and the energy dissipation from them, will occur outside the useful field. This inevitable inefficiency reduces the available product of dose-rate and useful field volume by a factor of about 5* (-As an illustration of this effect, it can be shown that, if a dose distribution were gaussian in all three dimensions, only 8>£ of the energy would be dissipated within the 8Qfo dose contour, although it is to be expected that a real irradiation field could have a rather more favourable distribution).
3«2 Beam Line Design: Basic Bequirements2he feasibility study considered only some general possible
features of the beam line. In particular it did not examine the problems of momentum selection and eff icient beam transport in any detail.
The beam line can be regarded as an optical system having three distinct functions: collection of pions over the largest practicable
- 18 -

solid angle; momentum and charge selection; and focussing onto the irradiation region. Collection and focussing were envisaged as being carried out by magnetic quadrupole pairs, acting as lenses, and selection by a simple magnetic dipole. A clear spacing of 1.2 m had to be provided between two of the components in order to allow space for an iron block shilding wall, penetrated only by a closely packed beam pipe. .
The detailed design was based on major components which were already available at the laboratory, namely a small (Nimrod type 3) bending magnet capable of deflecting 200 MeV/c singly-charged particles through 15° and up to six 13 cm aperture quadrupole magnets previously used with the Liverpool cyclotron.
For efficient particle collection a quadrupole had to be placed close to the proton beam target, tthe presence of other equipment made this impossible except at production angles near 30°. The design was based on 90°. Although a mechanical clearance problem later cause this to be increased to. 94°* the calculations were based on the geometrically simpler 90°, the apparent positional errors being less than those due to the finite width of the target. Typical Nimrod extracted proton beam targets are retangular metal prisms 30 - 100 mm long in the proton beam direction, with ends 3 “ 6 -mm square. They are generally made of copper and are mounted, in air, on thin wires or rods. BeiyIlium, aluminium and tungsten alloy have also been used. In the ’ 90°. direction the target, and therefore the pion source, is seen as a long thin horizontal rectangle: almost a line source. It was therefore considered that momentum selection would be more efficient if carried out in the vertical plane rather than in the usual horizontal plane.
The thinness of the target in the beam line direction was expected to be important if electron contamination 7/as to be kept to a low level. Neutral pions decay almost at once into photon pairs. These photons are likely to leave the target without forming electron pairs if their paths through it are small compared v/ith the radiation length (vzhich is 13 mm in Cu and-3*6 mm in W),. The photon paths are clearly shortest in the 90° direction for long, thin targets, which should ensure, minimal electron contamination of the beam.
- 19

3*3 Detailed Studies of Design and Predictions of Performance
3*3*1 First Approximation: Quadrupole PairHie general properties of a pair of the quadrupoles were first
studied in the .thin lens pair approximation. Lens powers, magnifications in both planes and acceptance solid angles were calculated from formulae given by Bahford (1966), with the aid of a Y/ang 362 programmable desk calculator. A useful aperture of 15 cm diameter was assumed. The above variables were calculated for various combinations of object distance, lens separation and doubly focussed image distance (i.e. for coplanar horizontal and vertical images). Given a requirement for producing an image of a 100 mm x 5 mm target which would lie within a 15 cm diameter beam transport pipe at an image distance (from the second lens) of 2 m, it was found that an object distance as short as 0,7 m could be used at the minimum practicable lens separation of O.35 m. The first lens would have to be focussing in the vertical plane, the second one in the horizontal plane. The lens powers required corresponded to magnet currents of only about 2Cfo and 10^, respectively, of the maximum rating for the quadrupoles (500 A).
3*3*2 Computations for Complete SystemThe general features of the design now seemed sufficiently well
established for study using the beam tracking and matching programme TRAMP (Gardner and 7/hiteside, 1961 and 1963) on the IBM 360 computer.The bending magnet, set to give a deflection of 15° in the vertical plane, was placed immediately after the quadrupole pair, and arranged so as to give a horizontal emergent beam axis. This was followed by a long drift space corresponding-to transport through the shielding wall. In early calculations, final focussing was provided by a second quadrupole pair. Double focussing with control of magnification in both planes requires three variables, provided the axial position of the double focus is not predetermined. With a quadrupole pair this implies' that'at least one of the magnets must, have a variable position. Therefore, in order to achieve the required flexibility of irradiation field size adjustment without the mechanical complexity of a moving magnet, a third quadrupole was’added. The resulting triplet could then be set up with fixed component positions if all three magnet currents were separately variable. In the interests of minimum beam line length,

all spacings between components were kept as short as possible. The actual arrangement of components is shown in Figures 1 and 2.
At first, the program was required to find suitable magnet strengths to produce an image of the target at the irradiation point, using the different magnifications in the horizontal and vertical planes to convert the long, thin target shape into a nearly square shape. Various arrangements, with and without intermediate foci in one or both planes, were tried. These all had a major defect: seriouschromatic aberration, i.e. a large vertical image shift with momentum change, even within a small momentum bite. However, it was noticed that there was a waist, in the vertical beam envelope near the irradiation point, which hardly moved with moderate changes of momentum. Inspection of the trajectories showed that this was an image of the aperture of the first quadrupole which, in the absence of other colli- mation, also formed the vertical acceptance aperture of the system.The relative achromaticity of this image was due to the closeness of the aperture to the effective dispersion plane of the bending magnet. The second quadrupole set (the triplet) was necessarily separated by the long drift space through the shielding from both these planes and imaged them close together. The result of this was that particles of different momenta, diverging because of magnetic dispersion, were recombined by the focussing effect of the triplet, (it would still be possible to apply momentum selection before this recombination took place, preferably at a highly dispersed image of the target*,)
This property is demonstrated for a point source in a simplified optical analogue in Figure 3« In Figure 3a, the limiting rays of the beam envelope for an extended source are shown for the- design momentum only. The waist at the image of the aperture of the first lens, produced by the second lens, can be seen to be close to the achromatic image plane of Figure 3b. (Two diagrams, showing the effects of dispersion and source size separately, have been used for the sake of clarity :,,)
It should be noted that at the design momentum the target is imaged close to the second lens, so as to minimise any tendency to image the target in the irradiation region. There are thus two overlapping focussing conditions: target to second lens (through the firstlens) and first lens aperture to irradiation area (through the second lens). This is closely analogous to the arrangement used in many
- 21 -

optical systems, in which two lenses are used to give a bright and nearlyUniformly illuminated field from a highly non-uniform source such as a lamp filament. In these the first lens (the lamp condenser lens) collects light from the source over a large solid angle and focusses the light to give an image of the source at the second lens (the projection lens, or in a microscope the sub-stage condenser lens).
For optimum efficiency and uniformity, the second lens images the aperture of the first lens onto the field (the projection screen or microscope slide). If these conditions are not met, there is a tendency for an out-of-focus image of the light source to appear at the field. Applied to the beam line, this concept should give a field distribution independent of target size or pion source distribution along the target. This is important when a target is shared with other users, as a change of target will not then lead to change in field distribution.
Applying these conditions to the computation, it was found possible to obtain a suitable final field, 3 cm square, at a final drift length (after the triplet) of about 1 m. All the quadrupoles were found to require less than 25/° of their maximum rated current even at the maximum envisaged beam momentum of 200 MeV/c. As expected, the final image was only slightly affected by target dimension changes in the horizontal and vertical planes or by moderate (- 2.5/°) momentum changes. Ideally a uniform ("flat-topped") field might be expected from imaging the nearly uniformly/ illuminated first quadrupole aperture, but in practice this is not achieveable, particularly in the small field size necessitated by a low beam intensity, because of residual chromatic aberration, departures of the lenses from ideal performance, (e.g. non-uniformity of field gradients and changes in effective lengths over their apertures), and pion scattering in the air, in beam pipe ■ windows and in the final absorber in which they are brought to rest (see Section 3»3»3)* Additionally, it should be noted that TRAMP is a first order computation, accurate .only'for-trajectories-at small angles to the beam axis.
Calculations of performance continued after the time at which the mechanical layout had to be fixed for final engineering design to proceed. In particular, beam trajectories were computed over a very wide momentum band and covering the complete, range of initial pion positions' and path gradients. 700 such trajectories were computed in order to predict the approximate momentum spectra at different points
- 22 -

across the final image plane in the absence of an absorber (Harris, 1970). 2his has since been carried out in greater* detail using a Monte Carlo method (Reading, 1973)* These studies have shown that pions in the irradiation plane .have a momentum spread with a full width at half maximum of 12$>. It was seen that the major mechanism of momentum selection was differential focussing by the quadrupoles rather than dispersion by the bending magnet. The simplified model, in which the functions of components are seen as separate and independent, is not valid at large deviations from the design momentum, •where the interaction of components is complex and .the performance of the system is correspondingly difficult to predict.
In the detailed studies the achromatic properties of the irradiation field were still found and could be said to result from the position of the vertical beam envelope passing through a minimum height close to the design momentum: that is, it is displaced upwards at bothlower and higher momenta. At high momenta the target image lies in the final drift space and could cause "hot spots" near the irradiation area: fortunately the vertical shift prevents serious problems from this effect. At some low momenta an unexpected large transmission occurs by an off-axis route in which quadrupole deviations cancel out the magnet dispersion. This effect, one of the problems arising from the use of a large collecting solid angle, is mitigated by these pions being spread over a wide area at the irradiation plane. (Their shorter ranges would, of course, make them stop short of the intended dose peak region in an absorber)•
3*3*3 Scattering and StragglingFowler and Perkins (l96l) considered factors which would give the
minimum possible pion peak field dimensions as functions of depth in tissue. The same factors would also limit the edge definition of large fields.
They gave the longitudinal spread due to range straggling, which results from statistical fluctuations in energy loss, as approximating to a gaussian distribution with an r.m.s. value 6 R given by:
% R = 0.026R0*54 ( £ R and R in cm),where R is the mean pion range.Qhus for R = 15 cm, £ R = 0.33 cm.
- 23 -

Ihe same authors derive the lateral spread of a pencil beam due to multiple coulomb scattering. At the end of the pion range, R, the r.m.s. lateral deviation from this effect, SL, is given by
$L = 0.07 R°'92(om)Thus for R = 15cm, $L = 0.8 cm.Elastic pion-nucleus scattering, not mentioned by Fowler and
Perkins, will also broaden the peak and should be included in detailed dose calculations. However, for narrow beams at least, such scattering can be regarded as generally leading to the loss of pions from the beam, because the mean scattering angle is large. Furthermore, only about 10fo of pions would be thus affected.
We can therefore not expect to achieve pion peaks at such depths with useful field dimensions less than about 5 mm deep by 10 mm across. Similarly, the blurring of the edges of large fields will always be at least a few millimetres in extent. As these scattering and straggling distributions refer to pion end points (star or capture distributions are closely similar), dose distributions will be somewhat wider, due to the ranges of secondary charged particles from the stars.
In the beam line studies it was found that the wide momentum bite (12?o f .w.h.m.) would be the dominant factor in the longitudinal peak distribution. The computations (confirmed by subsequent experiments) showed that this would cause range deviations of about 2 cm r.m.s. In the transverse directions, however, the beam line had to be operated close to minimal field size in order to obtain sufficient dose-rates.It was therefore to be expected that star distributions would tend to follow the gaussian distributions caused by multiple scattering rather than those predicted by geometrical optics.
3.3.4 ConclusionsThe design studies showed that the proposed beam line design
would achieve its objective of providing a negative pion beam of sufficient intensity for radiobiology on small volume systems (up to a few cm^) at moderate dose-rates. 2he pion stopping peak would be less sharp, and the ratio of peak dose to plateaux dose lower than in earlier beams, due to the wide momentum bite. This was justifiable on three grounds: with achromatic transport of pions to the irradiation
- 24 -

area to the dose-rate m s enhanced, the broader peak m s more representative of the eventual radiotherapy requirement to cover reasonably large tumour volumes, and problems of positioning and dose uniformity over the irradiated object would be less severe.
Residual aberrations and multiple coulomb scattering would make it impossible to achieve a flat-topped transverse plane peak dose distribution, at least in narrow beams. A geometrically stable field with low levels of contamination m s predicted.
3*4 Beam Line Construction and OperationFigures 1 and 2 show the elevation and plan of the facility. A
15° upward sloping axis through the beam collecting quadrupole pair is turned into the horizontal by the transverse field of the dipole bending magnet, and then passes through the main side shielding wall of the extracted proton beam blockhouse. This wall is of iron and is 1.2 m thick. The final quadrupole triplet focusses the beam onto the irradiation area in which experimental rigs are built as required. Most of the beam path 3-ies in two 13 cm diameter vacuum pipes with 0.25 nim Melinex entrance and exit windows. A working platform is provided to give access to tine irradiation area, which would otherwise be inconveniently high (2.4 m above the floor).
Biological irradiations are monitored by an integrating transmission ion chamber. This is calibrated against a small cavity chamber placed at the point of irradiation (at the required depth of tissue- simulating material, such as Perspex or water). As additional checks on exposures, the signals from a proton beam secondary emission chamber and from a proton target monitor counter telescope are also integrated. The ratio of the latter two signals will change if the primary proton beam focussing or steering change or if the target is moved or changed.
Control of exposures is achieved by switching the pion beam line bending magnet on and off. The residual dose-rate at the beam focus in the off condition is less than ifo of the exposure dose-rate. More precise control could of course be obtained by switching the primary proton beam, but this is avoided so as not to interrupt other experiments. Under these conditions, setting up of experiments and sample changing involves personnel exposures of the order of 20 raillirem per hour.
- 25 -

3.5 Performance Measurements and DosimetryThe radiation detector systems used in studies of the beam have
tended to be oriented towards the techniques common in radiation dosimetry rather than those used in high energy particle physics.
3*5*1 MaterialsThe most important requirement is for the measurement of absorbed
dose, and its distribution, in tissue-like materials. For many irradiations and measurements the pions are slowed down in a "Perspex" (acrylic resin) block built up from retangular sheets. This material was chosen because it is reasonably tissue-equivalent for pions and many other radiations, is widely used in this kind of work and is very convenient for the construction of irradiation jigs. However, compared with soft tissue, which can be regarded as approximately (^5 0^ 18^* -ersPex> (C^HqO^)^ contains no nitrogen and different proportions of the other elements, carbon largely replacing oxygen and with some deficiency in hydrogen (15$ in atomic proportions, by mass). In addition, the density of Perspex is 1.2 whereas that of soft tissue is taken to be 1.0. As the secondary products from pion capture are not believed to differ greatly for carbon, nitrogen and oxygen, the density difference could have a greater effect than differences in atomic composition.The higher density causes shorter ranges far* both pions and secondary particles, so that scattering causes less lateral displacement of the incident pions, and the star tracks are shorter. Both of these effects will cause a greater dose enhancement at the peak than in the plateau region. Solid "tissue equivalent" plastics can have more realistic densities and proportions of hydrogen and nitrogen, but invariably it is necessary to replace much of the oxygen with carbon, a particularly high proportion being required in ionisation chambers 'where an electrically conducting material is necessary. (At room temperatures, better matches can only be obtained in liquid, gel, or gaseous form). Water is often the basic material of an irradiation jig, because the biological material itself is often immersed or suspended in water. Water has a considerably higher hydrogen content than tissue, and therefore a higher stopping power for charged particles, so that their range is less than the "ideal" in spite of the density having the required value. Fast neutron doses can also be expected to be greater due to the greater number of proton recoils, but the slow neutron (n,p) reaction in
- 26 -

nitrogen vri.ll be missing. The effects'of replacing carbon and nitrogen, as pion capturing nuclei, by oxygen is not accurately known but is again expected to be small.
3*5*2 Dose MeasurementsMost dose and dose distribution measurements have been carried out
with small cavity ionisation chambers of the type used in X- and Sf-ray dosimetry. These have volumes of 0.2 and 0.6 cm3 and are air-filled.The walls are of. graphite-coated nylon and the central electrodes are thin magnesium alloy wires. Calibration is carried out with ^Co gamma rays, using sufficient build-up material to ensure electronic equilibrium. For such small volumes the filling gas should not be critical, because most secondary particles originate outside it and have sufficient range to cross the cavity, provided also that the energy (w) required to produce an ion pair is constant. However, W values do depend to some extent on particle type and in particular tend to be higher for multiply- charged particles.
For most purposes the various sources of dosimetric error with these chambers are not serious, and for relative dose distribution measurements they are of second order importance.
The final tuning of the beam line magnet currents was based on themaximum dose-rate measured by a cavity ionisation chamber at a depth of
—216.5 g cm in Perspex. For a proton beam target of copper 6 x 6 x x100 mnr a pion stopping peak-mean dose-rate of 20 rad per hour was11obtained at a proton beam mean intensity of 3 x 10. protons per second.
Figures 4 and 5 show the results of measurements along the beam axis and vertically and horizontally at the depth of maximum dose.
The. depth, width and height of the peak at the 80^-dose, contour were 40 mm, 24 mm and 20 mm respectively. The approximately ellipsoidal volume thus defined could be regarded as the "useful" field for irradiations in the peak with an absorbed dose uniformity of - 1C$. The axial distribution measurement was simplified by adding sheets of Perspex in front of an accurately centred detector fixed inside a thick Perspex block. This eliminated dose variations due to change in beam cross- section and closely simulated the dose distribution that would have been observed in a parallel beam. The ratio of peak to plateau doses obtained in this vay v/as 1.7. (Subsequent measurements showed that the "true"
- 27-

ratio of doses was 1*4? "because the beam envelope was alightly divergent between the plateau and the peak *<)
Beyond the peak, the dose fell rapidly to less than 10/o of the maximum value. The residual dose beyond the pion range is mainly attributable to electron contamination of the beam (for the same momenta, electrons have much longer ranges than pions). By extrapolating back from this dose tail, the contribution of electrons to the peak dose was estimated to be 1C$>. There was no evidence of a muon Bragg peak, -which was expected to lie just beyond the pion peak. Tais was taken as evidence of a very low muon contamination. As 5C$> of the pions decay into muons in the 6 ra beam transport length, many muons must reach the irradiation area but are distributed over a wide momentum band and are widely distributed relative to the beam axis. Their contribution to the peak dose was estimated to be less than y/o.
Approximate measurements with threshold detectors indicated an absorbed dose contribution from neutron contamination of the beam of about 1/6.
The general conclusion from these dosimetric studies was that the beam line performance was much as predicted by calculation. The small, nearly circular peak field and the broad, low peak height indicated that a wide momentum band had been brought successfully to a common focus.
The capability of the beam line to be adjusted to produce other field shapes and larger field areas was also demonstrated, but this feature has not been much used for irradiations because of the general requirement for dose-rates to be as high as can be achieved v/ith the available pion beam flux.
3*5*3 Star Distribution MeasurementsFurther information on the nature of Hie radiation field produced
by the slowing down and stopping pion beam was provided by a 170 pm thick totally depleted silicon detector. Preliminary measurements showed that, when this was operated so as to reject events dissipating less than about 3 MeV in the crystal, there were large localised energy depositions in the ionisation peak for negative pions, but not for positive pipns of the same momentum. On the other hand, the frequency of events recorded for various counter threshold energies in the plateau region were almost identical, thus demonstrating the charge
2 .8 -

independence of in-flight interactions compared with the change dependence of the capture process for stopped pions. For further measurements, a fixed threshold of 5 MeV was chosen as a compromise between good resolution of "star"-type events and adequate counting statistics. It was assumed that the events recorded would then almost all be due to heavy charged particles produced by interactions within or close to the detector. (Events resulting from stars in the absorber or the detector or mount adjacent to the silicon crystal could not be distinguished from those occurring within the silicon and therefore increased the effective detection volume by an unknown amount. It seems reasonable to assume that this effect would be less important at high threshold energies, for which most events must be-largely due to the heavier fragments and recoil nuclei with short ranges). Ihis detector system therefore provided a simple means of identifying pion interactions arid measuring their spatial distribution in an absorber, provided that the arbitrary nature of the event selection process was acceptable.
Relative star distributions, as defined by this method, were measured in "Perspex*' and in aluminium. Figure 6 shows the axial distribution of events at different depths in "Perspex". It shows a plateau event rate of about 1C$> of the peak value and a very low rate beyond the peak. Compared with the ionisation distribution (Figure 4), the peak is much higher, somewhat narrower (2.5 g cm , compared wdth 4.0 g cm” , at QCffo of maximum) and probably about 0.5 g cm deeper (this difference was comparable with experimental errors). Ihese findings are entirely consistent with the expected properties of the star distribution. The wider ionisation peak is due to the Bragg ionisation distribution and to the longer range secondary particles from pion capture, which are unlikely to produce large signals from the silicon detector.
The biological implications from these observations are that the high LET component of the plateau region dose is small but not neg- lible and that significant variations in LET spectra must occur wdthin the ionisation peak region, which could result in variations of HBE and QER. From a practical point-of-view, the silicon detector used in this way is as simple and convenient as the traditional cavity ionisation chamber and provides information which is complementary to absorbed dose measurements.
- 29 -i

From similar measurements in aluminium, Hie mean pion range and range deviation were determined for a standard set of beam line settings. From these the momentum distribution v/as derived using the range-momentum curves of Atkinson and Y/illis (1957). This distribution was found to be approximately gaussian .with maximum at 161 - 2 MeV/c and a full width at half height of 1J>%. (As straggling would cause much smaller range deviations, its effect on this result could be ignored).
3*6 Use of the Beam for RadiobiologyPion radiation fields are very complex mixtures with wide LET
spectra; they are therefore not well suited for studies in fundamental radiobiology. The experimental programmes which have been performed on the Nimrod 'ff 11 beam and elsewhere have been primarily directed towards the evaluation of the possible application of pions to radiotherapy, and to a lesser extent to radiological protection studies. The "first generation" experiments have had to 'be carried out at low; dose-rates in narrows beams which would be quite unsuitable even for experimental radiotherapy.
Irradiations on the -fJ'll beam have been performed at peak dose- rates betw/een 10 and 150 raa/h, as determined mainly by the available proton beam intensity and target, but have mostly been in the region of 15 to 50 ra.d/h.
The physical measurements already described demonstrated that such 'dose-rates can only be delivered v/ith reasonable uniformity of dose-rate and radiation quality over a peak volume of a fevr cm^, although lower but significant dose-rates are also delivered to a much larger volume of surrounding material. Collimation of a stopping pion beam v/ould hovrever cause serious secondary radiation contamination of the field due to pion interactions in the collimator.
The distinctive feature of the 11 beam is its vn.de momentum bite ( l f .v/.h.m.), vhich makes it possible to compare the properties of different regions of a broad peak. This simulates to some extent the even broader peaks vhich would be required for radiotherapy, where pions reaching the greatest depths have to pass through regions in which other pions stop, thereby diluting the high LET star doses with low/ LET ionisation.
- 30 -

There will therefore be variations in the LET dependent quantities, HBE and OER, through any broad peak, (it might be desirable to minimise these variations by using symmetrically opposed fields.)
Detailed description of the radiobiological experiments have been or will be published, so only some brief summaries will be given here.
3.6.1 Reduction in Growth of Broad Bean RootsVicia faba meristems (broad bean root tips) have been exposed
under aerobic and hypoxic conditions in the plateau region and at various' depths in the peak (Winston et al., 1973). Meristem irradiation reduces the subsequent growth of the roots. By irradiating at 4°C, so that the cell cycle was temporarily arrested, adequate doses (up to several hundred rads) could be given in spite of low beam dose-rates.
The results showed that Hie highest RBE (3*0 relative to Ra gamma rays) occurred at the dosimetric peak. An OER of 1.7 - 1.8 was observed throughout the peak region. As expected, the RBE was lower and the OER higher than in beams with lower momentum spreads. The plateau region gave an RBE of only 1.3, but Hie OER was 2.0, much closer to that of Hie peak Uian to the value for gamma rays (3.0). This appears to demonstrate Hie important effect on OER of even a small proportion of high LET radiation, in this case mainly due to pion interactions in flight.
A subsequent experiment (Winston et al., 1974) examined the entrance surface region and showed the apparent but unexplained inconsistency of boHi OER and RBE being rather higher than in the adjacent plateau region.
3.6.2 Low Temperature Irradiation of HeLa CellsHeLa cells (a culture grown from a human cancer) were irradiated
at -196°C (Nias et al., 1974). Again the cell cycle was arrested, this time practically completely. The radiation damage was "stored" and the system behaved as if all the radiation dose had been given in a single short burst at the time the cells were warmed up. Doses up to 3000 rad were given.
After culturing at body temperatures the cell survival rate was measured. An RBE (relative to 300 kV X-rays) of 1.86 was found at the dose peak. (The corresponding value for 14 MeV neutrons was 3-73*)
- 3i ~

In a later experiment (Rutherford Laboratory, 1974), the RBE in the plateau region was found to be unity.
3.6.3 Irradiation of HeLa Cells at Room TemperatureHeLa cells- have also been irradiated at normal temperatures
(Mill et al., 1975)* A similar peak RBE (2.1, relative to ^Co gamma rays) was found. In this case however the plateau was found to have a RBE of 1.4 - 1.5. No dose-rate dependence was found for doses measured in the peak between 40 and 150 rad per hour. This experiment used pions from a tungsten primary target. In a previous experiment, using a copper target, there was no clear distinction between peak and plateau survival curves. However, the difference in target material is most unlikely to be the reason for this disagreement, as it has been shown to cause very-little change in the composition of the beam.
3*6.4 Chromosome AberrationsHuman lymphocytes have been irradiated in the pion beam by Lloyd
et al., (l974). The relevance of chromosome aberrations to radiotherapy lies in the correlation between them and the inability of a cell population to divide (and hence, for a tumour to grow). This inability is often referred to as "reproductive death" or simply "death" in cell survival studies: it does not necessarily imply death in the usualsense.
The RBE in the peak was 2.1 for dicentric aberrations and 2.3 for60acentrics, relative to Co gamma rays at a dose of 150 rad and a dose-
rate of 18 rad per hour. Ihe plateau RBE was about 1.5. The dose and dose-rate dependence of the yields of different types of aberration were examined. Tie linearity of the dicentric yield with dose, both in the .peak and in the plateau, indicated that these aberrations were largely caused by single (and therefore probably highly ionising) tracks, at doses comparable with a single therapy fraction. Y/ith low*LET radiation at Hie same dose, there is a relatively greater probability that dicentrics will be caused by two separate tracks, vhich gives a yield component proportional to the square of Hie dose. Prom these results it is deduced that in pion radiotherapy'there would be less recovery between fractions, particularly In the peak, than for gamma radiation.
- 32 -

3-6.5 In Vivo Experiments with .MiceCoggle et al- (1975) report on four experiments involving mice.
The effects studied were thymus weight loss, oocyte survival, bone marrow colony forming unit (CFU-S) survival and the induction of macroscopic lens opacities..
All four systems showed Hie pions to be no more effective in the peak than in the plateau, nor any more than low LET radiations (i.e. HBE*s-of ' about 1.0 throughout). This type of result had not been* reported on the CERN or Berkeley pion beams, both of which have narrower momentum spreads. This might be taken to indicate that, with the wide momentum spreads required for therapy, there would be little to be gained by using pions. On the other hand it is probable that Hie biological end-points of these experiments, chosen for their high radiation sensitivity, are all single event effects and Hierefore not especially sensitive to high LET radiation. It should also be noted that irradiation of single organs or small regions of a mouse unavoidably involved giving substantial doses to a large part of the animal. (Local collimation of the stopping pions would have caused either secondary radiation problems or a serious loss of dose-rate). Tiis effect may limit the validity of some comparisons with other radiations and Hie RBE’s thus obtained.
4- PION CAPTURE PRODUCT SPECTROMETRY
4-1 Relevance to Dosimetry and Biological Effects >As previously stated, the biological and therapeutic properties
of negative pion beams must ultimately be determined by biological c experiments and medical trials, and not by calculation from physical properties and parameters. Biological systems and Hieir responses are far too complex for complete analysis; both radiation damage and repair processes cannot be fully assessed merely by considering irradiated organs or regions in isolation from other parts of the organism whether they are also irradiated or not. Feedback processes are believed to be particularly relevant to the repair of radiation damage.
However, quantitative physical data can be useful in Hie understanding of measured radiobiological properties and in the prediction

of future results provided adequate theoretical or empirical models are available. It should at least be possible to make reasonable estimates of basic parameters such as RBE and OER, and probably also of dose-rate and dose fractionation effects. On the other hand, the calculation of absorbed dose distribution is only limited by the accuracy of the physical data available, i.e. beam parameters, particle interactions and products, and the constitution and structure of the absorber (ultimately the tumour and surrounding tissues).
Most physical measurements on the if 11 beam have been concerned with setting up the facility for radiobiological experiments and with the associated dosimetry. The capture product measurements to be described here are of more general application and interest, as they * add to the rather small amount of experimental data on which dosimetric calculations can be based, especially for particles of charge 2 and 3? and at the lower energies in the p, d and t spectra.
From the point of view of practical application, the ideal pionstopping and target material would have been a tissue or a tissueequivalent material, and preferably a variety of such materials (e.g.muscle, fat and bone or their equivalents), but at the existing stateof knowledge, and with only a few days of beam time available, it wasconsidered advisable to carry out measurements which could be comparedwith and extend the existing published data in either oxygen or carbon,the latter being the simpler, being available as a pure solid elementat room temperature. Raju and Richman (1972) state that in bone-freeparts of the body about 2Q& of pions are captured by carbon nuclei,13%° by oxygen, y/o by nitrogen and l$o by heavier nuclei. On a simple
12 16alpha-particle model of the nucleus, C and 0 could be expected to produce similar spectra of particles of mass 1 to 4. There would be less similarity for heavier fragments, particularly those of charge6 and 7 or of mass 13 to 16 vhich could not possibly be emitted after
12 16negative pion capture in 0 but vhich might be produced from 0.A captured stopped pion contributes considerable energy from the
conversion of its rest mass; but because it imparts negligible momentum, the vector sum of the momenta of the particles emitted must be zero, with the greatest energy carried by the lightest particles (this is rigorously true for two particles, and is likely to be true for three or more).
- 3 4 -

Much of the energy is carried away from the stopping region by energetic neutrons. Heavy fragments are biologically important, in spite of the relatively small energies given to them, on account of their high LET's, which can be expected to give them high RBE values. Unfortunately, they are difficult to observe and analyse because of their very short ranges.
Approximately 2% of the pions passing through a 1 cm thick layer of tissue will undergo an in-flight nuclear interaction. The secondary products from these interactions are also of dosimetric interest, particularly for the calculation of doses in the "plateau" region, vhich extends from the skin to the stopping region. In this initial experiment only the peak region could be studied in the time available. The absence Of directional and energy-dependent properties makes it simpler to study, it is the region of greatest therapeutic interest, and there exist previous data for comparison. Future measurements should, of course, cover the whole beam path and the variation of spectra with material and emission angle.
With a good knowledge of all the components of the radiation field, absorbed dose distributions can be calculated. Apart from predicting the properties of proposed beams, such calculations are useful in regions for vhich practioal measurements are difficult: for exampleat soft tissue-bone interfaces and in bone cavities.
The work to be described extends, but does not complete, the physical basis for pion dose calculations. The results vhich can be compared with previous data show general agreement, but, as will be seen, there are some important differences.
4.2 Previous Calculations and MeasurementsGuthrie et al., (1968) applied a Monte Carlo intranuclear cascade•L2 *| I 1 pycalculation to pion capture in C, 0 and Al. They obtained
multiplicities and energy spectra for neutrons and charged secondaries,together with the excitation energy of the residual nuclei (which canbe assumed to be dissipated mainly by gamma emission, with little localenergy deposition)• This work provides a far more complete coveragethan is yet available from experimental results and has therefore beenused as a basis for dosimetry calculations. (Dutrannois et al., 1972),(Armstrong and Chandler, 1974^).
- 35 -
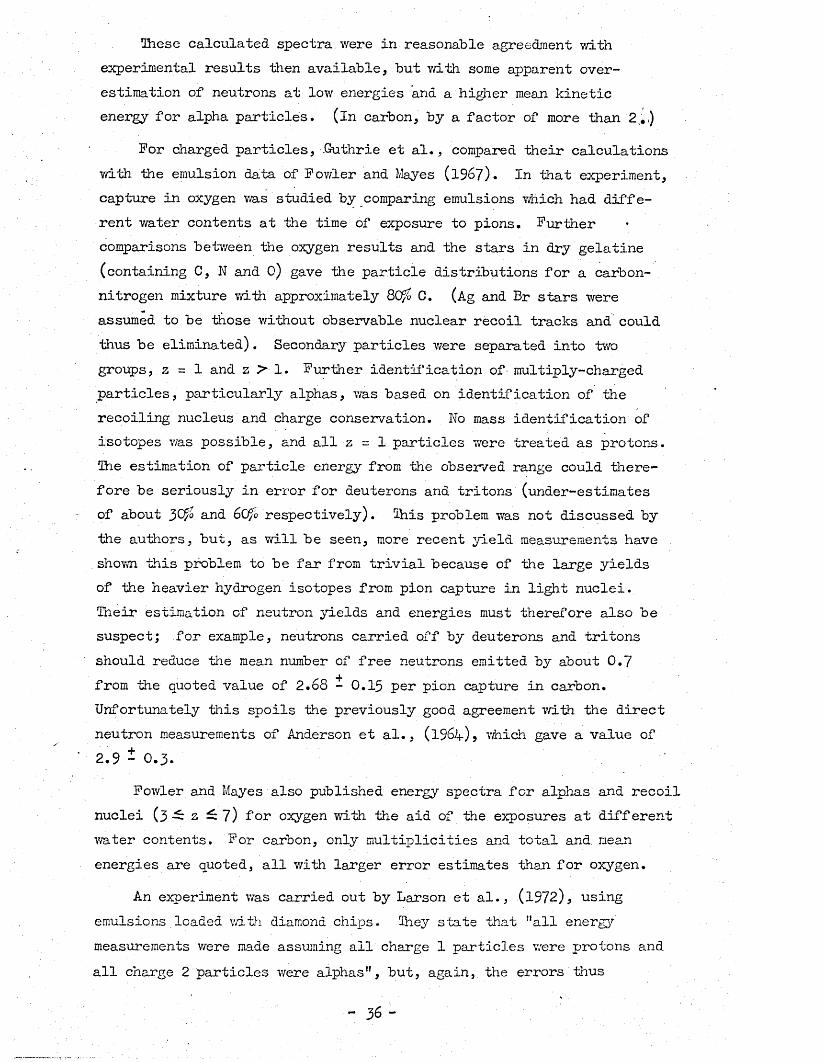
These calculated spectra were in reasonable agreedment with experimental results then available, but with some apparent overestimation of neutrons at low energies and a higher mean kinetic energy for alpha particles, (in carbon, by a factor of more than 2 .,)
For charged particles, .Guthrie et al., compared their calculations with the emulsion data of Fowler and Mayes (1967). In that experiment, capture in oxygen was studied by comparing emulsions vhich had different water contents at the time of exposure to pions. Further comparisons between the oxygen results and the stars in dry gelatine (containing C, N and O) gave the particle distributions for a carbon- nitrogen mixture with approximately 80^ C. (Ag and Br stars were assumed to be those without observable nuclear recoil tracks and could thus be eliminated). Secondary particles were separated into two groups, z = 1 and z > 1. Further identification of - multiply-charged particles, particularly alphas, was based on identification of the recoiling nucleus and charge conservation. No mass identification of isotopes was possible, and all z = 1 particles were treated as protons. The estimation of particle energy from the observed range could therefore be seriously in error for deuterons and tritons (under-estimates of about 3C£o and 6Cf/o respectively). This problem was not discussed by the authors, but, as will be seen, more recent yield measurements have shown this problem to be far from trivial because of the large yields of the heavier hydrogen isotopes from pion capture in light nuclei.Their estimation of neutron yields and energies must therefore also be suspect; for example, neutrons carried off by deuterons and tritons should reduce the mean number of free neutrons emitted by about 0.7
- ofrom the quoted value of 2.68 - 0.15 per pion capture in carbon. Unfortunately this spoils the previously good agreement with the direct neutron measurements of Anderson et al., (1964), vhich gave a value of 2.9 - 0.3.
Fowler and Mayes also published energy spectra for alphas and recoil nuclei (3 2 ^7) for oxygen with the aid of the exposures at differentwater contents. For carbon, only multiplicities and total and mean energies are quoted, all with larger error estimates than for oxygen.
An experiment was carried out by Larson et al., (1972), using emulsions loaded with diamond chips. They state that "all energy measurements were made assuming all charge 1 particles were protons and all charge 2 particles were alphas", but, again, the errors thus
- 36 -

introduced are not discussed. In their Table 3, "Number of particles per capture" is tabulated against "Energy interval", the intervals being 1, 2, 5 or 10 MeV wide. The calculated spectra of G-uthrie et al which are quoted in the same table, refer to the number of particles per cap-hire per MeV, not per energy interval. However, in a private communication from Larson, the original alpha event numbers observed for each interval are given. These appear to confirm that the published data were not normalised to a constant energy interval but to the various intervals of the table, and cannot therefore be directly compared with the adjacent calculated values (with vhich they had appeared to be in quite good agreement). If this comparison is made in vhat is believed to be the correct manner, the experimental alpha spectrum falls much more rapidly at high energies than the calculated spectrum but is in much better agreement'with the unfolded emission spectrum which will be discussed in Section 4*6.2.
Castleberry et al., (l97l) measured the spectra of protons,*~2deuterons and tritons emitted by thin (0.05 g cm ) targets of Li, Be,
^B, C, 0, Mg, S, Ca, Co and Fb, using a particle identifier system consisting of a planar proportional counter in front of a Nal(Tl) crystal scintillator. Plotting the energy loss in the former against the residual energy of particles brought to rest in the latter gave a scatter plot with 3 bands, corresponding to p, d and t. No ^ie or ^He particles were seen (no explanation is given). The thresholds for p, d and t were 6.1, 7.9 and 9.2 MeV respectively. A separate magnetic analyser experiment, with .about double these thresholds confirmed the carbon esission spectra, the most important features of which were the high relative yields of deuterons and tritons.
The branching ratios for p, d and t from carbon, above the thresholds quoted, were 0.32 - 0.07, 0.23 " 0.05 and 0.10 - 0.03 (relative abundances 49^, 33% and 15^ respectively). Ratios for a common threshold energy are not given, but would give even higher relative abundances of the heavier particles. This may be compared with the calculated multiplicities of Guthrie et al.: 1.03, 0.26 and0.08. (Relative abundances 73%9 I5/<> and 6%). It was suggested that this behaviour in C and other light elements, vhich resembles' the distribution from a ^He target, is indicative of capture on nuclear alpha-clusters.
- 37 -

Similar measurements, with better resolution but higher thresholds have been made by Budyashov et al., (1972), using a silicon surfacebarrier energy loss detector and a Csl(Tl) residual energy detector.
-2Targets were 0.15 - 0.3 g cm of Be, C, Al, S, Ca, Gu, Cd and Fb. The p, d and t thresholds were 15, 18 and 24 MeV. They also found high deuteron and triton yields on low Z targets, ^or carbon at a 24 MeV threshold the p, d, t abundances were 54$, 32$ and 14$. If we assume that heavier particles have a lower mean energy, these results are consistent with those of Castleberry et al. and, like them, suggest that the zero threshold abundances of protons and deuterons could be roughly equal with tritons about one half as common (4C$, 40$ and 20$ relative abundances). Such extrapolation is highly speculative: it isclearly desirable to make measurements with lower threshold energies.
4.3 Discussion of the Thick Target Counter-Telescope MethodWe have seen that, although a number of experiments and calculations
had produced charged particles data on vhich pion beam dosimetry could be based, there were uncertainties and gaps in the results. The experiment to be described aimed at confirming and extending Hie available data. It was intended that a wide range of particles should be identified and analysed with low energy thresholds.
In most experiments of this kind, pions are slowed nearly to rest in an absorber and are then allowed to drift onto a thin target placed . obliquely to the beam, in vhich they come to rest and are captured. Aparticle identifying detector system with its axis normal to the incident beam analyses the particles emitted by the target. Budyashov et al., for example, used this kind of arrangement.
Two-element telescopes, consisting of a thin (energy loss) detector followed by a thick (residual energy) detector, provide'a means of identifying particles and of measuring their kinetic energies. They are capable of providing large acceptance solid angles, limited only by errors due to the Increased energy losses at large deviations from normal incidence.
It is convenient to store the (nearly) coincident signals from the two detectors in a two-dimensional array so as to give a scatter diagram of energy loss versus residual energy, (in Hie experiment to be described, the array was quantized into 32 channels for energy loss and16 for residual energy on a 512-channel Laben pulse height analyser.)
- 38 -

In arrangements of this type, there is a threshold energy corresponding to particles which traverse the front detector and then have just enough energy to produce the minimum analysable pulse-height from the back detector. The upper practical limit corresponds to particles vhich are only just stopped by the back detector. Between these limits, the locus of points on the array approximates to a hyperbola, energy loss (for a given type of particle) decreasing as residual energy increases.At higher energies, where particles pass right through the back detector, both signals decrease with energy, giving a "folded-back" locus with a discontinuity at the point where the residual range of the particle equals the back detector thickness. It is important to avoid ambiguities arising from Hie folded-back part of a locus crossing the "normal" region for a lighter particle. If this effect is expected to cause trouble, it is possible to use a third detector behind the other two as an anti-coincidence gate. In this experiment the thicknesses of .the detectors and the relative abundances of particles at regions of possible ambiguity were such as to make this effect of trivial importance.
In order to cover a wide range of energies, two sets of detectors were used. In each case the front one was a thin silicon transmission detector. These have excellent resolution, low noise and, for the type of particles considered here, a constant and linear pulse height v. energy relationship. The dimensions of the silicon detectors were: 18 pmthick by 6 mm diameter and 178 pm by 12 mm diameter. The first was thin enough to give a usefully low threshold energy without being difficult to handle or use (thinner detectors, down to a few um thick are available and would give threshold energies lower by factors of 2 or 3: they are, however, extremely fragile and would give a very small signal with large fluctuations due to non-uniformity of thickness and statistical fluctuations of energy loss). The Hiicker Si detector provided an adequate signal to noise ratio for the small energy.losses of high energy protons. The corresponding back detectors were Csl(Tl) scintillators 6 mm thick by 12 mm diameter and 12 mm thick by 25 mm diameter. This material is more convenient than Nal(Tl) as, being non-hygroscopic, it needs no protection from the atmosphere'when the apparatus is not evacuated, thus making a good window-less detector for short-range particles. Unfortunately, its energy response is non-linear
~ 39 -

and both its sensitivity and the shape of pulses is dependent on dE/dot (Gwin and Murray, 19&2)• (Economic considerations alone ruled out the ' use of semiconductor rear detectors, at least for the higher range particles. They would otherwise have been preferable on account of their good linearity and resolution). Therefore, rather than incur complex scintillator calibration experiments, energies were calculated from the Si transmission detector signals.
The energy loss in the front detector, for a specified particle type and energy, could be calculated with the aid of range tables; conversely the incident energy could be derived from the energy loss provided the mass and charge of the particle had been determined.(This-will be discussed further in Section 4»5)• Thus the scinillators were used in a semi-quantitative manner, contributing only to particle identification.
The Nimrod it 11 beam line produces a high dose-rate and a broad end-of-range pealc for biological irradiations. As previously described, these properties are obtained by focussing a wide momentum band onto the irradiation area. Thus, only a small proportion of the pions would have the correct range for stopping in a thin target after slowing down in a suitable absorber: a much larger number would pass through it or not even reach it.
-2For example, a target 1 mg cm thick, one quarter of the effective thickness of the thinner of the Si detectors, would captureonly about one pion in 4000, say 250 per second for a mean beam inten-
6 2 sity of 10 pions per second. A detector of 40 mm area (large areasare not practicable with thin detectors), at a distance of only 50 mm,would collect only one in 800 of isotropically emitted particles. Aneven smaller proportion would be. collected if scattering of the nearlystopped pions in the absorber block caused a wider lateral spread onthe target foil than could be accepted by Hie telescope, an effectvhich would be aggravated by the necessary drift space between theblock and the target (the block must not be "visible" ' to the telescope).Significant portions of some of Hie spectra examined occur with fre-
—5quencies less than 10 per capture. These would Hierefore accumulate at rates of Hie order of one event per hour, or less: too low forreasonable statistics or resolution in this experiment, for vhich the total beam time available for several runs, with different gain settings and two sets of detectors, was only a few days.
- 40 -

A different approach was therefore evolved. From the point of view of micro-dosimetry rather than that of nuclear physics, the instantaneous energies (and hence energy losses) of particles as they cross a volume element in a material of interest are of more direct relevance than the original emission energies, because each gives an element of the absorbed dose and of the LET spectrum.
If, instead of using a thin target we examined the particles leaving the surface of a thick absorber we would have a picture of. the particles crossing a plane in a continuous absorber, or an average element of volume on that plane. For- isotropic secondary particle distributions from uniformly distributed sources, we would observe one half Of each component of the flux inside a continuous medium. Back- scattering should not alter this conclusion, because there will be a balance between those particles that would have been emitted by the "missing" material but scattered by the "actual" material towards the detector, and those vhich are emitted and detected but vhich would have been back-scattered by the missing material. A similar argument can be applied to the products of secondary interactions. The balancing applies also to a non-uniform distribution if the plane bisects it on a plane of symmetry, a condition vhich was largely met in this experiment by arranging that the emitting surface should intersect the beam axis at the pion stopping peak. (The required pbint was found by successive thickness adjustments of the absorber and lateral traverses of a small semiconductor detector planed close to the emitting surface.. Assuming that large pulses from the detector were due to pion stars, the pion capture distribution could be mapped and the peak found. The peak at optimum absorber thickness was aligned with the axis of the counter telescope). The telescope axis v/as perpendicular to the incident beam. The ream surface of the absorber v/as angled at 45° to both beam and telescope (this angle is not critical, but it is clear that angles close to 0° or 90° would be geometrically unsuitable).
If the observed spectra are required to represent those in an extended uniformly emitting medium, it is necessary that the source density should remain constant over the range of all secondary particles. In the experiment to be described the 8C$ pion stoppingdensity contour v/as at a depth from the surface (the 100$ contour) of
-2 - -21.4 g cm and the contour at 2.4 g cm , equivalent to protonranges in carbon for 36 MeV and 49 MeV respectively. For deuterons
- 41 ~

these' energies would be 46 and 67 MeV and for tritons, 55 and 80 MeV. For particles of charge 2 or more, the corresponding energies v/ould be too high to be of any consequence. Thus the relative numbers of singly charged particles observed would be less than in a larger or uniform field. There would also be a smaller number of products arising from secondary interactions of neutrons emitted after star capture; however, as these neutrons have a high mean energy, about 30 MeV, their, dosimetric contribution would be very small in a field as small as in the experimental beam. Their contribution in large fields should be considered as additional to the direct charged particle fluxes measured in the present experiment. .
The assumption of isotropic emission in the peak region is justifiable provided that most of the interactions occur with captured stopped pions and not in-flight, when there v/ould be a forward component of momentum to the products. In-flight interactions occur at about 2$ per g cm of path, so only a small proportion of the observed fluxes is likely to be due to these interactions. Furthermore, the residual kinetic energy of pions as they enter the peak region is •certain to be small compared with the energy provided by the pion rest mass (140 MeV). Finally, measurement at 90° to the beam should minimise the effects of a forward component of momentum. For investigation of the plateau dose region, in which in-flight interactions are the dominant cause of high LET products, angular distribution studies would of course be essential and would greatly increase the total time required for spectrum measurements.
4-3»l Spectrum UnfoldingAlthough the experiment produced data in a form more relevant to
microdosiraetry than to nuclear physics, it is of course interesting •and important to attempt to derive the initial emission spectra; this Y/ould provide critical comparisons with and possibly augment the previously available calculated and experimental spectra. It is therefore necessary to eliminate the effect of slov/ing down of secondary particles before they leave the target block. This requires an unfolding process which combines the range-energy relationships with the observed spectra.
- 42 -

Let us assume that the observed spectra emerge from the surface of a large, uniformly emitting block, and that the range-energy relationship for the material of the block is' known for each particle identified. Secondary interactions and range straggling are neglected, both being rather small effects for heavy particles of the energies considered here.
Consider a single energy, E ’, in the emission spectrum of a particle type with a corresponding range in the emitting material, ft1. The emergent spectrum from initial energy E 1 will contain all . energies up to E*, and these will have travelled all distances up to R' within the material. As the material is uniformly emitting throughout its depth, all such distances are equally probable. It then follows that all values of residual range up to R1 are 'equally probable for the emergent particles, i.e. the observed range spectrumfor a single particle; • type and initial energy is rectangular in shape
ctN(Figure 7), or (-^) observed, the number of particles per unit range interval, is constant for R R * .
A complete observed emergent range spectrum can be approximated to the sum of number of such rectangles (Figure 8). In this approximation, the emission range spectrum is represented as a number of discrete ranges, R, with intensities proportional to the height of each corresponding rectangle. In the limit, as the number of discrete ranges tends to infinity and the height of the rectangles tends to zero, the true emission range spectrum is seen to be proportional to the differential with respect to range of the observed range spectrum, dR ^dR observed. It is then a simple matter to convert this-into the initial energy spectrum.
In the conversion of energy spectra into range spectra, and vice versa, this relationship is used:
dN = dN . dE .............. (Eq. 4/1)dR dE dR
Thus the emission energy spectrum is given by:
/dN\ _ d /dN\ dR'dEyemission “ dR 'dR'observed dE
- ■ 43 -

Which reduces to:
(Ah = A A h . (Eq. 4/2)dE em dE vdR'obsConsidering the total number of particles of the specified type emitted in an energy band between and E^:
dE =1 d fW\- dE
1
/ clivn am = 1 - jol / olnn
dE em / dE 'w o b s
= " / ® \ - f aNv . . . . . . (E q . h/i)TT1 -rikdR obs Eg dR obs E^
and the average emission per unit energy interval between E^ and Eg is the same quantity divided by (Eg-E^).
For ~ we can use values of specific energy loss, (- as weassume that only collision loss is significant.
Throughout this work range and specific energy loss values were obtained from the tables of Williamson et al., (1966), except for Li ions for vhich the approximation of Barkas and Rosenfeld (l96l) v/as used.
0.26 1.7 MR (_R) • . (Eq# 4)500 q .
-2where R is range in g cmZ is absorber atomic numberE is particle kinetic energy in MeVq is particle charge in units of electronic changeMp and M are masses of a proton and the particle respectively.
Note that, by differentiation, v/e obtain
dE = E (Eq. A/5)dR 1.7R
As the telescope could not resolve % e in the presence of a much larger flux of ^He, all charge 2 particles were assumed for calculation to be.^He. Similarly all charge 3 particles were assumed to be " Li, the
- 44 -

most abundant and stable form in nature, although stable Li, 0,84 second ^Li, and 0,17 second ^Li nuclei .might also have been detected.In both cases the average errors introduced into energy measurements, and therefore dosimetric errors, will be slight.
It should be noted that the telescope signals were not gated by the incident pions. Thus delays between pion capture and particle emission did not cause the loss of parts of the emission spectra. .In particular, protons and alpha particles are known to be emitted after the beta decay of various light nuclei, which have half-lives up to about one second. (See also 4*4»3) *
It would be possible to unfold spectra from non-uniformemitters or from targets of thickness comparable with the range ofparticles within the energy limits being studied. In such cases theemission range spectra would no longer be the differentials of theobserved range spectra, and the calculations more complex. As hasalready been stated, the assumption of uniformity is considered adequatefor the present purposes except possibly for some singly chargedparticles emitted with high energies at the greatest depths in thecarbon. For a distribution decreasing with depth this would lead tosome underestimation of the low energy parts of unfolded spectra.This effect is certainly trivial for alpha particles: a 50 MeV alpha
-2has a range of only 0.2 g cm in carbon. In a future experiment itmight be considered a useful compromise to employ a target thickenough to give a good particle yield but thin enough to be a nearly
-2uniform emitter, say 0.1 to 1 g cm thick. This would-give a precisely defined source distribution function suitable for accurate spectrum unfolding.
4.4 Description of Apparatus and Experimental Techniques
4.4*1 Target Chamber and DetectorsThe apparatus used (Figure 9) consisted of an evacuated
cylindrical chamber with 0.1 mm aluminium beam entrance and exit windows and provision for mounting the detector telescope, at-A5°V 90° and 135° to the pion beam axis. As already explained, only the 90° position.was used, it being assumed that in the peak region the emission of heavy particles would be almost isotropic and that any
’ - 45 -

anisotrophy would have the least effect on observations in the 90° direction. The other angles would of course be required for studies of the plateau region, where in-flight interactions are dominant.
The slowing-down block consisted of nPerspexu sheets occupying the regions just inside and just outside the beam entrance window, the outside sheets being readily adjusted to give the required overall thickness. The exit face of the block consisted of a 45° graphite wedge with a thickness of 2.5 cm on the beam axis. The intersection of the 45° face, with the chamber and telescope axes was arranged to coincide with the pion beam axis, the whole assembly being moveable in horizontal and vertical directions. The transmission silicon detectors lay at 5 cm from this point and the Csl crystals1 front surfaces 3 cm further, these dimensions being chosen to give a good collection efficiency, adequate rejection of particles at large angles to the telescope axis and a reasonably low background from off-axis and scattered beam particles and beam contaminants (muons, electrons, photons and neutrons).
The light from the crystal was conveyed out of the vacuum chamber to the face of a photomultiplier tube by means of a 25 mm diameter ‘’Perspex” rod, the vacuum seal being provided by an 0-ring fitted round the rod. The rod also provided mechanical support for the detector assembly which was housed in a copper tube.
The vacuum system consisted of a rotary pump, with a liquid nitrogen trap to prevent condensation of damaging vapours on the silicon detector surface. The pressure was maintained at less than 50 millitorr. (High vacuum conditions were not necessary.for the particles and energies studied: the total flight path of 8 cm was only
_ 2 Q0.7 Jig cm for air at 0 C and a pressure of 50 millitorr).
4*4*2 ElectronicsThe signals from the detectors v/ere pre-amplified locally; for
the semiconductors a low-noise pre-amplifier was used. The pulses were then passed along cables about 10 m long to a radiation-shielded control room where they were further amplified and shaped before being fed into a Laben 512-channel pulse-height analyser operating in a 16 x 32-channel two-dimensional coincidence mode. The semiconductor (energy loss) signal was fed into 32 X-channels and the Csl scintillator
- 46 -

(residual energy) signal into 16 Y-channels. The channel contents were read out onto paper-tape at the end of each run. Because of the small number of channels available for each parameter, it was necessary to take several runs with different X and Y gains in order to cover a wide range of particle types and energies; for example the energy losses for alpha particles were an order of magnitude greater than for protons.
Die coincidence time resolution of the pulse-height analyser was found to vary, v/ith pulse size, between 1 and 2 jis, but this was not expected to cause any difficulty. The analyser dead-time was set to a fixed value of 32 jis. Dead-time corrections were mainly kept to less than 2CF/b. If necessary, low energy cut-offs in one or both dimensions were used to reduce dead-time losses. Channel-width, calibration, linearity, zero offset and overlap were measured, particularly in the first few channels, but apart from the first channel (o) in each dimension, there was a high degree of uniformity.
For future experiments it would be desirable for energy loss to be analysed into at least 100 linear channels, or a smaller number of logarithmically-spaced channels.
4*4*3 Normalisation • .The data collecting runs were normalised using the same methods
as for biological exposures. There were three independent systems; aproton beam monitoring signal from a secondary emission chamber, aproton target monitoring signal from a scintillation counter telescopealigned with the target and, in the pion beam itself , an integratingtransmission ionisation chamber close to the beam line exit window.Variations in the characteristics of the primary (proton) or secondary(pion) beams would cause changes in the ratios of these signals andcould provide some guidance to analysing the reasons for such changes(for example, primary beam steering or secondary beam magnet currentdrift). Statistical study of 16 sets of the three readings, coveringexposures varying in duration by a factor of over 200, show'ed the threeratios between pairs of readings to vary randomly and by similaramounts (standard deviations of ratios - 3% to - 4/^ with overall
+ \ranges all about - 7f°) showing that no one method was obviously more, or less, reliable than the others, and that no serious changes occurred in either beam during the exposures. Runs were therefore normalised
- 47 -

to an arbitrary standard exposure using an unweighted mean of the three normalising factors. It is therefore reasonable to assume that all normalisations were performed to an accuracy of better than - 5a*
• It is customary in experiments of this kind to have scintillation . counters in front of and behind the target in which interactions take place, operating in anti-coincidence so as to provide a logical gate for the detector system, which is then activated only Y/nen a pion is stopped, interacts or is highly scattered in the target. Further detectors upstream in the pion beam can define the Incident particle more closely and reduce the number of spurious events (for example, those due to recoil protons arising from neutrons in the beam). Such gating systems would not eliminate the major background problem caused by slow pions which are scattered towards the telescope and then decay. They would, however, incorrectly eliminate delayed Interaction products arising from unstable residual nuclei with life-times longer than the gating period (see Section 4.3• l) • Apart from the increased mechanical and electronic complexity that gating detectors would involve, a considerable proportion of the available beam time would have had to be used in setting up the gates for optimum, efficiency, taking into account the very different resolution times of plastic, silicon and Csl detectors, variations in pion capture delays and secondary particle transit times.
•4*4*4 CalibrationDie primary energy standard for this experiment was provided by alpha particles, which have principle energies of 5.486 MeV (86p>)
and 5*443 MeV (l2/o), with Iovy intensity lines from 4*80 to 5*545 MeV.It was sufficient for this, purpose to assume a mean energy of 5*48 MeV.
The thicker Si detector had a thickness greater than the range of .these particles and could be calibrated directly. The thinner detector, nominally 20 jon thick, transmitted the alpha particles. Die energy lost in it was determined by measuring the residual energy of emergent particles using the previously calibrated thick detector.
The observed spectrum of this residual energy was compared with those obtained from standard A1 foils of similar thickness. Even though A1 and Si have adjacent atomic numbers and similar densities the spread in the observed residual energies w/as much larger for the detector. By interpolation between'the A1 foils, the detector was
48 -

found to have a mean thickness of 18 jam. From the energy spread,, assuming ’the aluminium to be uniform, this thickness was estimated to vary by - 10°/o (standard deviation) . Such variations were greater than expected and would be a major limitation to the resolution of the system.
As checks on the detector system, the 'Vthin" telescope was ■ 241exposed to Am alphas and to recoil protons from a polyethylene
sheet exposed to AiriBe neutrons. These produced the expected types of 2~dimensional arrays. Calculation of trie recoil proton energies from the energy loss signal (see Section 4»5) showed that the Csl energy sensitivity was about 2*5 times higher for protons than for the alphas. This phenomenon v/as also observed at higher energies, in the arrays produced by the products of pion captures. It was, of course, assumed that for the types of.particle being studied the energy sensitivity of Si detectors would be constant (only for particles approaching the mass and charge of fission products would serious errors arise). A further check on the system was made by examining the maximum ipulse-tieijght produced by pion capture protons in the 12.5 mm thick Csl crystal. According to the range tables of Williamson et al., this thickness equals the range of 58 MeV protons. The cut-off energy, corresponding to the maximum pulse-height for protons entering the crystal, was calculated from the Si energy loss signal to be 5° - 4 MeV.
4*5 Analysis of Results
4.5.1 Particle Identification .The first stage of analysis was the identification of particle
types on the two-dimensional data arrays. Visual inspection alone was sufficient to identify the distinctive pattern of overlapping bands for the hydrogen isotopes (Figure 10), and the we!3.-separated single bands for charge 2 and charge 3 particles (isotopes of these not being resolvable) - (Figure ll). Calculations from energy loss and approximate residual energy confirmed such identifications but. were not generally necessary.
Note that, because of the nomenclature and assignment of channels on the Laben analyser, the 32 Si (energy loss) channels are referred to as X-channels and the 16 Csl (residual energy) channels are referred to as Y-channels, and are plotted accordingly. This is the reverse of the common convention for such: systems*

4-5*2 Background SubtractionIn this context,, the terra background refers to XI coincidences
which are not properly assignable to single secondary particles. The observed background was a continuum with high rates occurring at small values of X or I. The very large signals in one variable coinciding with small signals in the other appeared to be due to the capture of scattered pions in one detector, the small signals, from the other being due to passage of the pion, to a secondary particle from the capture or to random noise. Another source of background was due to. two or more, par tides not resolved in time. Results were analysed with apparent energy loss, X, varying at constant values of I. The intercept of- this locus with the proton and other bands produced gaussian distributions. . The background contribution to these distributions was determined by extrapolation from or interpolation between regions where the background was dominant, (particularly at very low apparent energy losses before the proton band, and between the charge 1 •and charge 2 regions).
In most spectra from the thin detector telescope, backgrounds were negligibly low except for some channels on the small signal side of the proton band and the small corrections required were readily made to an adequate degree of accmaxy. (See Figure 12). The backgrounds from the thick detectors were much larger. Some reduction was achieved by local shielding of the Csl crystal, but there remained sufficient counts to cause significant contributions in all parts of the spectra. No generally applicable analytical function was found which would fit the observed backgrounds. Interpolation of the background continuum was found to be most easily carried out when the logarithms of the counts were plotted against the logarithms of the channel numbers, the background loci then following curves of relatively little curvature. (Figure 13).
4«5»3 Analysis’of He spectrumThe charge 2 particles are discussed first, because of the
simplicity of. the analysis. The contribution from "%e particles, expected to be present only at a few percent of the ^He yield, was not separately resolvable: the constant I count distributions afterbackground subtraction being a good fit to a single gaussian. The areas of these peaks were taken to be proportional to the numbers of
- 50

particles incident on the telescope within energy bands determined from the energy loss calibration. Ideally, the pulse counts should be integrated along loci of constant incident, not residual, energy. However, this would require .complex interpolation between channels and might even introduce more errors than the second order effect it was intended to correct.
For each of the Y (Csl) channels giving a usable peak, the background continuum was estimated graphically, as described above, and subtracted. The mean energy loss and the number of counts in the peak were then determined. The Y channels could be regarded as containing bands of incident ^He energies, each of different 'width. • Calculation of incident energy directly from the energy calibration of each Y channel, which in turn had to be derived from the energy loss (X) signals, would have caused large errors, especially in channel- width determination. The calculated residual energies corresponding to the centre of each peak were therefore plotted against Y and a smooth curve (nearly a straight line) drawn. The residual energies thus smoothed were added to the Si detector energy losses to give incident particle energies. The successive differences between these energies were also plotted against Y to give interpolated and smoothed values of incident energy channel-width. Finally, the incident energy spectrum was determined by dividing the total counts in each peak by the corresponding channel-width. Table 1 shows the successive stages of the calculations for part of the He spectrum. The complete observed spectrum is shown in Figure 14»
5 *4 Particles of Charge Greater than 2The Li spectrum between 9 and 20 MeV (Figure lit-) was obtained in
a similar manner to the He spectrum. In order to obtain adequate count statistics, the exposure was as long as reasonably possible - 20 hours. The data collected on Hi is run (Figure 11) shows no clear evidence of particles of charge 4 or greater. However, the thickness of the.front detector represented a large threshold energy for the detection of such particles in Hie back detector.
4.5.5 Separation of Singly-charged ParticlesThe singly-charged particles presented a number of difficulties
in analysis. These arose from the overlapping of the p, d and t bands
- 51 -

in the XI plane, the low values of dE/dx at high energies with consequent degradation of the energy loss signal by detector noise, and the higher background counts due to spurious events, particularly in the thick detector system.
After background subtraction, gaussian distributions were fitted to the proton peaks. Those used were distinct enough for their centres, hall*-widths and heights to be measured at least to a first approximation. Only slight, if any, adjustments (based on inspection of residuals after subtraction, of the synthesised gaussians) were then required for a good final fit. The area of each peak was then calculated from the gaussian parameters. After subtraction of the proton peaks the same process was applied to the deuteron peaks and, after further subtraction, to the triton peaks. The resultant separation is illustrated in Figure 12.The sum of the synthesised peaks is seen to be a reasonable fit to the experimental data. For the deuteron, and particularly for the triton, accurate subtraction of the ” tail" of the previous peak was essential and required better counting statistics than would have been necessary for well-separated peaks (in some cases the triton peak was little more than a bulge on the side of the deuteron peak) • The accuracy of the separation of these peaks depended on the resolution of both detectors, the number of analyser channels between peaks and the number of counts in each peak, all of which are capable of inprovement in a future experiment.
4*5*6 Normalisation between Detector SystemsIAs there was no ’’absolute” normalisation for this experiment, it
was necessary to ensure that the results from the ’’thick” and ’’thin” pairs of detectors were consistent with* the same arbitrary normalisation. This was carried out by comparing a region where their results overlapped and both gave good clear data. The region chosen was the He spectrum between 20 MeV and 35 MeV. It was found that if the thick detector system counts were divided by 5*0 ** 0*1 there was excellent agreement between the two He spectra. The lines and data points in Figure 14 incorporate this factor. The p, d and t lines also appear to match well, within their larger scatter of points, using the same factor (the transition region for singly-charged particles lies at about 10 MeV). The Li spectrum was entirely based on thin detector data.
- 52 -

4*5*7 ComputationThe gaussian curve fittings were assisted by calculations carried
out on a programmable desk calculator. Computer analysis of the type used for gamma spectrometry was considered but not used, because its adaptation to this work, especially the p, d, t separation, would have been difficult on account of the small number of channels, the overlapping of peaks and the rapidly changing background. In future work computer analysis should however be used if possible. An interactive technique for successive approximation seems particularly suitable.
4*5*8 Unfolding of Emission SpectraThe unfolding process -which converts observed thick target spectra
into emission spectra has been explained in Section 4*3*1* It is based on differentiation of range spectra. In any differentiation of experimental data, care has to be taken that the result is not excessively influenced by errors and statistical fluctuations in the input data, -which must therefore be adequately smoothed and differences taken over large enough intervals, but without excessive loss of fine detail or blurring of rapid changes. Whilst the spectra could have some fine structure based on nuclear energy levels, the previous experiments (see Section 4*2) have not shown any clear evidence of it. The aim of the present work is only to show general spectral shapes and the relative abundance of different particles over broad energy bands.
The initial data for the calculations were the points of the spectra shown in Figure 14* Smooth curves were drawn through these points. From these, new data points were taken at convenient intervals. These were tabulated together with their first and second differences, which were smoothed by inspection to produce data sets in which each spectrum and its first derivative were sufficiently smooth for the subsequent calculation. These new curves were only slightly different from the initial hand-drawn curves'? they are shown in Figure 14 and tabulated in the -Second cblnmn of Tables 2 to 6. For each energy point, range and specific energy loss (columns 3 and 5) were determined from tables or by calculation (see Section 4.3*l)* The range spectrum (column 4) was then calculated and from it the emission spectrum (column 8) by taking the range spectrum differences between successive energies (column 7) and dividing them by the energy differences (as explained in Section 4*3*l)* Each of the emission spectrum values is
-53

the mean emission per unit of energy interval over the energy hand indicated. For convenience of comparison these bands are the same as in the calculation of Guthrie et al, (1968) . All spectra have the same but arbitrary normalisation.
The emission spectra are plotted as histograms in Figure 15 to 18. Each is compared, on a different scale common to all figures, with the •calculations of Guthrie et all: d and t spectra are compared -with”d + t + ^He”, He with “alpha” and Li with “Heavy Recoils” . (The ^He yield can be expected to be small, and Li nuclei can be expected to bethe most common products of charge greater than 2 at the energiesstudied).
4.5.9 ErrorsSo far, the spectra have been presented without error estimates in
the tables and graphs. As there is no absolute normalisation, only ’factors affecting the relative yields or the energy calibrations need be considered. For the observed (thick target) spectra, the main error sources are counting statistics, energy measurement (errors in which also affect the calculated energy interval), background correction and errors arising from assumptions and approximations in the methods of calculation, particularly in the p, d, t peak separation.The previously discussed assumptions on which the unfolding techniques are based introduce further errors in the initial emission spectra. . The dependence of the unfolding on a differentiation process increases the errors in the yield results especially when they cover small energy intervals.
The errors on individual points in the observed spectra of Figure 14 are very variable. The scatter of the points about the smooth curve suggests that very few points have random errors greater than - 1 Cr/2. For the Li data, however, the standard deviations from counting statistics alone are between 10 and 20?o. For the triton curve, resolution was barely adequate and Hie results very dependent on correct subtraction of Hie deuteron component; nevertheless, for all but two points Hie scatter is in the - IG o band relative to the smoothed curve. The scatter of Hie proton and deuteron points is also about.- 10/b, which is much more Hian Hie statistical count. deviation (typically of the order of 1%). These errors are believed to be the

combined effects of background-correction, peak separation, normalisation and energy channel-width. errors.
The He data has particularly little scatter? this may be attributed to adequate resolution from other peaks, low background and good counting statistics.
The range tables of Williamson et al., extensively used in the calculations, claim an. accuracy • "within 53° and often much better”. The formula used for Li ions is believed to be accurate in this energy region to better than 10/c. The linearity and charge independence of the Si detectors should be excellent: the tests wiHi alpha sources and recoilprotons were consistent with this assumption.
The consequences, for Hie emission spectra unfolding, of non- unif ormity of pion star density were discussed in Section 4*3*1* Fortunately, the observed range spectra all fall quite rapidly wi Hi , energy? this reduces Hie errors caused by source non-uniformity, which would be greatest for protons. A fall-off with depth into Hie target would produce a greatest numerical (not fractional) deficit at Hie lower energies in the unfolded emission spectra. For example, if the distri-
-2bution of proton emission had cut off completely at a depHi of 1.7 g cm in carbon (corresponding to an energy of 40 MeV), this -would have cuased an error at 5 MeV of less than 13/^ In practice Hie non-unif ormity of the pion star distribution gives no more than a 3^ deficit at this : depth and the error at 5 MeV should be less Hian 7/h As the protons have a spectrum with the largest relative component at high energies, as well as having a longer range at a given energy, Hie errors in oHier spectra will be smaller.
4*6 Discussion of Results and Comparison with Other Work
4*6.1 Thick Target SpectraThese are a special feature of this experiment, and closely .
represent the spectra of particles crossing a cavity in a solid object. . They thus provide a means of determining LET spectra wiHiin the target material, although Hie lov/ energy cut-off imposed by- the front detector limits Hie information provided in the important high-LET region.However, the spectra are fairly smoothly changing functions of energy and therefore some extrapolation at both low and high energies could reasonably be carried out.
- 55 -

The energy spectra in Figure 14 show broad maxima at about 20 MeV for protons and at about 15 MeV for deuterons and tritons.Only falling portions of spectra were observed for He and Li ions; maxima must therefore be at energies less than the detector thresholds (5 MeV and 9 MeV respectively). Even higher threshold energies apply for heavier particles, ibe absence of any clear evidence of Be and B recoils is not therefore surprising: there is no doubt that such ionsmust be produced, but simple dynamic considerations and a knowledge of the likely energies of the complementary light fragment or fragments make it clear that heavy recoil energies greater than about 10 MeV are most unlikely. Charge conservation prevents the direct production of C recoils by negative pion capture in a carbon target, but they could arise from the interaction of neutral or positively charged secondaries (in the latter case N ions are also possible).
The observed spectra apply strictly only to the pion stopping density distribution of this experiment, but extension to large, deep uniform fields would require a slight increase at the highest energies for singly-charged particles. Some allowance would also be required for a greater proportion of secondaries from interactions in flight, v/hich, from a study of events in a silicon detector, are estimated to be about 5 ~ 10% of the stars producing the spectra observed in Hie present experiment. There would also be an increased contribution of events caused by secondary neutrons (believed to be a very small effect in this experiment).
4*6.2 Unfolded Emission SpectraThis experiment had energy’thresholds lower than those for the
particle identifier measurements described in the literature, but it is useful to compare the results obtained at those energies for which comparable experimental data is available.
The p, d and t yields can be compared with the results of Budyashov et al., (1972) and Castleberry et al. Comparisons over broad energy bands give satisfactory agreement. For exanple, for a common threshold of 25 MeV the data of Budyashovet al. give relative abundances for p, d and t of (55 " l)$> (32 - l)% and (l3 - l)$ respectively (approximate statistical errors). From Tables 2 4* we obtain, for the same threshold, (53 ~ (34 - 9)% and (l3 - 3)$* (Errors estimated from thescatter of points relative to the smoothed spectra, and normalising errors.)
- 56 -

At a higher thre.shold, 40 MeV, Budyashov et al. obtain 58%? 31% and 11% whilst this experiment gives 55%? 31% and 12*% (all with errors similar to or slightly higher than for a'25 MeV threshold). Castleberry et al. give yields above different thresholds for each particle, that is 6.1, 7*9 and 9.2 MeV for p, d and t respectively. They obtained proportions of (49 - ll)%? (35 - 8)% and (l5 - 5)%« From Tables 2 - 4? using thresholds of 6, 8 and 9 MeV, we obtain 46%, 39% and 15%.
The above comparisons indicate that the error estimates are not seriously over-optimistic and give some confidence to relative yield values obtained well below the thresholds of the other experiment.Taking Hie lowest data point common to the singly-charged particles,5 MeV, as a threshold the relative yields of p, d and t are (42 - 4)%? (39 - 4)% and (19 - 2)%. In dosimetric studies, especially at the microscopic level relevant to biological effects, the overall yields are important because of the high biological efficiency attributed to the end of a particle's track, irrespective of its initial energy. Extrapolation of the above yield ratios to a zero energy threshold suggests overall p, d and t proportions of about 4C%, 4C% and 20%. All Hie experimental evidence on singly-charged particles is at variance with the widely used calculated yields of Guthrie et al., ■which are based on intranuclear cascade theory. In particular, they give overall p, d and t yields from carbon of 75%? 19% and 6%. The effect of the high yields of the heavier hydrogen isotopes on the interpretation of nuclear track emulsions, not only in the measurement of charged-particle energies, but also in the estimation of neutron yields has already been discussed in Section 4*2,
The shapes of the singly-charged particle spectra, although not expected to be accurate in detail because of errors introduced by the separation, smoothing and unfolding processes, are in general agreement with those of Castleberry et al., particularly those obtained with a magnetic spectrometer, but do not agree so well with the apparently more accurate data of Budyashov et al. (in the case of the deuteron spectrum, normalised to protons, our results give higher yields from 17 - 35 MeV and less above 40 MeV, by factors ctf up to 2). The general form of these spectra suggests two basic components: a broad high energy distribution, in which particles carry off a fairly large fraction of the initially available energy, and a low energy distribution suggesting a nuclear evaporation process. However, Castleberry et al. point out that
- 57 -

the.high relative yields of deuterons and tritons are inconsistent with a simple evaporation model but suggest a mechanism of capture on nucleon pairs of alpha clusters. /
: The unfolded He emission spectrum (Figure 17) should suffer from few of Hie errors affecting the singly-charged particles. The locus of the ions on the two-dimensional array was well separated from those : of other particles and had adequate statistics in a region of low' background. Hie assumption that /lie could be neglected is borne out by the symmetry of the constant-Y count plots. A proportion of greater than about 1G% would have been resolvable: Guthrie et al.calculated it to be less than 3% of the He yield. Even a 10% contribution would lead to energy overestimates of only 3%•
From Tables 5 and 2, the yield of He ions above a 5 MeV threshold is 1.73 times the yield of protons above the same energy, or 0.73 relative to (p + d + t). Guthrie et al. give an alpha to proton ratio of 1.07 for the same threshold., and 0.85 relative to (p + -d + t + *%e): in the latter case there is agreement within about 20% (assuming a 3f°.'rie proportion). The shape of the He spectrum shows a distinctly sharper fall with energy than, the calculated values (Figure 18). In ; this respect there is a better agreement with the diamond-loaded emulsion spectra of Larson et al., (1972), provided the published data is inter- .preted in the manner proposed in Section 4.2.. Hie mean energy of the unfolded charge 2 spectrum from 5 to 60 MeV is 11.7 MeV. This is considerably less than the corresponding value for the calculated spectrum, . about 18 MeV, but is not necessarily inconsistent with the Fowler and Mayes value of 7*6 MeV for the spectrum above a lower threshold.
The Li (charge 3) spectrum (Table 6 and Figure 18) shows a rapid fall, by a factor of about 20, between 10 and 20 MeV. The Guthrie et al. heavy recoil spectrum has a similar shape, but Fowler and Mayes' heavy recoil spectrum for oxygen is less steep in this region. Most of the Li ions ‘produced would be below the counter threshold, but the small portion of the spectrum obtained here is positively identified (by charge but not by mass) and augments the sparse information available on heavy recoils. The assumption of mass - 7 in energy • calculations is adequate for this data (see Section 4.3-l)*
As stated, no particles of charge 4 or greater were observed, ‘energies higher than the .detector thresholds (more than 10 MeV) being
- 58 - '

unlikely, (although possible) for such heavy ions. Even the thinnest-2 •practicable Si detectors, of the order of 1 mg era , about one quarter
of the thickness of the "Hiin" detector used in this experiment, would probably only transmit a small proportion of these heavy recoil ions.
5. CONCLUSIONS AND SUGGESTIONS FOR FURTHER EXPERIMENTS •
5•1 The Pion BeamAt the time of writing (mid-1975) the Nimrod ‘tf’ll beam line
described here has been used for radiobiological experiments over a period of A years without major modification to the equipment or to the magnet current settings. A 40% increase in pion yield, without a significant increase in electron contamination, has been, achieved by using a tungsten (instead of copper) primary target. Accelerator improvements have caused larger increases in intensity so that, overall, tiie intensities and dose-rates available will soon be more than an order of magnitude greater than v,hen the beam line first operated: experiments are being planned for small field irradiations at dose- rates up to 10 rad per minute. The important features of the beam are: an adequate dose-rate for a variety of sensitive biological systems; a wide momentum bite focussed achromatically to give a low, extended peak; a small useful beam area; field size largely unaffected by changes in primary target size; an acceptably low level of electron, muon and neutron contamination; and frequent availability made possible by largely "parasitic" operation' (i.e. sharing the extracted proton beam, and often a target, with high energy physics experiments).
5*2 Pion Capture Product SpectrometryThe experimental spectra of the pion capture products from carbon
add to the rather small amount of data available for dosimetric calculations. In particular they confirm the high relative yields of deuterons and tritons, as observed by other experimenters; they also extend the spectra to lower energies. The spectrum of charge 2 products for carbon,probably the first obtained using a counter technique, shows significant differences at high energies compared' with the theoretical spectrum often used in dosimetric calculations. The charge 3 spectrum, although it contains only a small proportion of Hie particles because of
'■-'5 9 -

a high threshold, is also believed to be the first such to be positively identified in this way.
The thick target spectra are presented because they are potentially useful in microdosimetry calculations, on account of their equivalence to cavity spectra. (Using the emission spectra would in effect require a reversal of the unfolding process: this would introduce unnecessaryerrors•)
It is suggested that future physical measurements on the existing beam should continue and extend the secondary particle studies described in this thesis. Target materials other than carbon and depths other' than the capture peak (including angular distribution of secondaries)
■•should be studied. Higher beam intensities and longer exposure times should also make it possible to increase the distances between target and front detector, and between detectors: this should improve energyresolution by restricting angles of incidence and should reduce backgrounds due to stray radiation and spurious coincidences.
The most serious limitation of this method is the inherent loss of information at very high LET’s due to the necessity for particles to pass right through the energy loss detector, and still have a measurable residual energy, if they are to be identified. The unidentified particles include low energy light particles and heavy recoils of almost any likely energy.
The thinnest practicable Si detectors are a few /am (about 1 mg cm“ ) thick, and those are easily damaged and only available with small areas. Proportional counters have been used in this application (e.g. by Castleberry) but the effective thickness of the gas and windows'leads to similar thresholds. The shortest identifiable tracks in nuclear, emulsions are also of this order of length.
Alternative methods of'identification and spectrometry which do not present a threshold problem, apart from normal detector noise problems, involve the use of deflections in electric and magnetic fields, and the measurement of time-of-flight, in various combinations ■ with or without an energy measuring detector (such as a Csl scintillator or a very thick semiconductor).
In general, these methods require more'complex equipment, can accept only a limited range of particles and have a much smaller solid angle than that of the Si/Csl telescope. Delayed emission, and varia
- 60 -

tions in slowing down and capture times would limit the usefulness and accuracy of time-of-flight measurements (assuming that the timing start signal is generated by the incident pion, and not by the secondary particle, in order to avoid energy losses and thresholds)* Magnetic deflection followed by energy measurement would enable particles to be identified according to (mass)-7 (charge) . Unfortunately, unless this was performed at very high accuracy there would be ambiguity between proton and alpha. Electrostatic deflection with energy measurement would determine charge but not mass; time-of-flight and energy would give mass but not charge (although this might be acceptable as the only serious ambiguity would be 3h and 3He). Thus full particle separation, used in conjunction with an energy spectrometer would require the addition of two of these three effects. However, because of the quantisation of mass and charge only low resolution would be necessary, given sufficiently accurate energy measurements. An optimised design would probably include solenoid or quadrupole magnetic focussing to increase the angular acceptance of the system.
5*3 The Future of the Beam Line
A proposal has been made for a beam line in a similar position but using specially constructed high aperture quadrupole magnets to produce a much higher pion intensity, capable of giving sufficient dose-rates and field sizes for preliminary radiotherapy trials (Reading and Butterworth, 1973)* Unfortunately, this is unlikely to be carried out for reasons of cost and uncertainties in the long-term plains for Nimrod.
The advent of the "second generation", of high intensity pion beams capable of carrying out experimental radiotherapy, might now appear to mark the end of the preliminary stage using small area low intensity beams. It is however hoped that the Nimrod radiobiological • pion irradiation facility (the it 11 beam line), with its increased dose-rate, will continue to be useful for exposures to small biological systems, for developing ancilliary equipment, and for dosimetric and other physical studies, such as further measurements of the secondary particle spectra.
- 61 -

6. ACKNOWLEDGEMENTSThe writer wishes to thank the following.His employers, Rutherford Laboratory, Science Research Council,
for permission to follow this course of study, and for providing all necessary facilities.
Drs. C. J. Batty and C. R. Hill for supervision and guidance.Colleagues in Hie Radiation Protection Group and elsewhere at
the Laboratory; in particular A. P. Jessett for data preparation,M. A. Hynes for assistance in experimental work, R. C. Hack and Dr. D. H. Reading for advice.
The writer would like to express particular gratitude to those who supported and encouraged the early stages of the pion beam project.
Mrs. H. P. Hack is thanked for her care and skill in typing and Mrs. S. L. Tims for assistance in preparing diagrams.
- 62 -

7. REFERENCESALSMILLER, R. G. A. and BARISH, J. 1968, Oak Ridge Report ORNL-TM-2277.ANDERSON, H. L., HINCKS, E. P., JOHNSON, C. S., REY, C. and SEGAR, A. M.
1964, Phys. Rev., 1£5, B392.ARMSTRONG, T. W. and CHANDLER, K. C. 19744, Radiation Research, J8, 293*ARMSTRONG, T. W. and CHANDLER, K. C. 1974B, Nucl. Instr. and Meth.,
119, 125.ATKINSON, J. H. and WILLIS, B. H. 1957, UCEL Report UCRL-2426 (Rev.).BAAHLI, J., BIANCHI, M. and DI PAOLA, M. 1972, CERN Report Dl/HP/156.BANFORD, A. P. 1966, The Transport of Charged Particle Beams, Spon, London.
BARENDSEN, G. W. 1968, in Current Topics in Radiation Research, ifc, 293> Eds. Ebert, M. and Howard, A. (North-Holland, Amsterdam),
BARKAS, W. H. and ROSENFELD, A. H. 196l, UCRL Report UCEL-8O3O (Rev.).BOYD, D. 1971, Stanford University Report TN-71-1.BOYD, D., SCHWETTMAN, H. A. and SIMPSON, J. 1973, Nucl. Instrum, and
Meth., Ill, 315.BUDYASHOV, Yu. G., ZINOV, V. G., KONIN, A. D., RABIN, N. V. and CHATRCHYAN, A. M. 1972, Soviet Fhys. JETP, 13.
BUTTERWORQH, J. and READING, D. H. 1973, Rutherford Laboratory Report RL-73-133.
CASTLEBERRY, P. J., COULSON, L., MINEHART, R. C. and ZIOCK, K. 0. H.1971, Phys. Letters; 34B, 57*
GATTERALL, M., ROGERS, R. H., OHOMLINSON, R. H. and FIELD, S. B, 1971, Brit. J. Radiol., i^, 603
COGGLE, J. E., GORDON, M. Y., LINDCP, P. J., SHEWELL, J. and MILL, A. J. 1975, Rutherford Laboratoiy Report RL-75-034*
DAVIES, H., MUIEHEAD, H. and WOULDS, J. N. 1966, Nucl. Phys., ]8, 673.DUNCAN, W. 1973, Br. Med. Bull., 2£, 33*DUTRANNOIS, J. R., HAMM, R. N., TURNER, J. E. and WRIGHT, H. A. 1972, Phys. Med. Biol., 1*£, 765*
- 63 -

ELLIS, R. E., MILL, A. J. and PERRY, D. R. 1972, Brit. J. Radiol., 45. 349.
FOWLER, P. H. 1965, Proc. Riys. Soc., 85, 1051.FOWLER, P. H. and MAYES, V. M. 1967, Proc. Phys. Soc., $2, 377.FOWLER, P. H. and PERKINS, D. H. 1961, Nature, l£°), 524.GARDNER, E. and LATTES, C. M. G. 1948, Science, 10£, 270.GARDNER,'J. W. and WHITESIDE, D. 1961 and 1963, Rutherford LaboratoryReports NIRI/m/21 and NIHL/VA4.
GU'JHRIE, M. P., ALSMILLER, R. G. and BERTINI, H. W. 1968, Nucl. Instr. and Meth., 66, 29* (Erratum in Nucl. Instr. and Meth., 1971, J91, 669)
GWIN, R. and MURRAY, R. B. 1962, IEEE Trans. Nucl. Sci., NS-9, 28.HAEFELI, P. 1972, SIN Report TM-30-ll.HAGEDORN, R. and RANFT, J. 1966, CERN Report CERN/EGFA66A«rG-^/US-S45/ RH-JRI.
HALL, E. J. and CHAPMAN, J. D. 1974, Brit. J. Radiol., i^, 513-HARRIS, L, J. 1970, Rutherford Laboratory Internal Note RP/PN/50.HARRISON, R. W. and LOBB, D. E. 1973, IEEE Trans. Nucl. Sci., NS-20. 1029.KAPLAN, H. S., SCHWETTMAN, H. A., FAIHBANK, W. M., BOYD, D. and BAGSHAW, M. A. 1973, Radiology, 108, 159.
KATZ, R. and SHARMA, S. C. 1973, Nucl. Instr. and Meth., Ill, 315.LARSON, D. A., CARRUTH, R. T. and FRENCH, J. D. 1972, Nucl. Instr. and Meth., 100, 325.
LI, G. 0., BOYD, D. and SCHWETTMAN, H. A. 1974, Phys. Med. Biol., lg,436.
LLOYD, D. C., PURROTT, R. J., DOLPHIN, G. W. and READING, D. H. 1974, Rutherford Laboratory Report RL-74-150.
MILL, A. J., LEWIS, J. D. and HALL, W. S. 1975, Rutherford Laboratory Report, KL-75-033*
NIAS, A. H. W., GREENE, D., MAJOR, D. and PERRY, D. R. 1974, Brit. J. Radiol,, 800.
NUCLEAR NEWS, 1974 (Dec.), 1£, No. 15, 76.
- 64 -

PERRY, D. R. 1968, Rutherford Laboratory Report, RHEE/M 160.FERRY, D. R. and HYNES, M. A. 1971, CERN Report 71-16. (Conf. Procs.,Eds. Baarli, J. and Dutrannois, D.) Vol. 1, p. 220.
RAJU, M. R. and RICHMAN, C. 1972, Current Topics in Radiation Research Quarterly, 8, 159*
READING, D. H. 1973, Private Communication.ROSEN, L. 1973, Proc. Nat. Acad. Sci. USA, 22, 603.RUTHERFORD LABORATORY, 1974. The Work of the Rutherford Laboratory in
1973* Eds. Smith, J. R. and Telling, P. M. pp. 78 et seq.SHEWELL, J., LINDOP, P. J., PROUKAKIS, C., ELLIS, R. E. and PERRY, D. R.1972, Brit. J. Radiol., 4>, 349.
Y/ILLIAMSON, C. P., BOUJOT, J. P. and PICARD, J. 1966, CEA Report CEA-R-3042.
WINSTON, B. M., BERRY, R. J. and PERRY, D. R. 1972, Brit. J. Radiol., M , 349
WINSTON, B. M., BERRY, R. J. and PERRY, D. R. 1973, Brit. J. Radiol., 46, 541.
WINSTON, B. M., BERRY, R. J., PERRY, D. R. and HEADING, D. H. 1974,Brit. J. Radiol., 41> 201
- 65 -

Peak CountsY X X A E E» ■ V m E SE £Eo^ Counts sm
TtT 11 wsm ’Norm
0 5.37 5.87 2.58 2.45 2.9 5.51.3
1.18 3589 3040 15501 4.29 4.79 2.43 4.35 4.4 6.8
1.2 1.23 3457 2810 14302 3.60 4.10 2.08 6.1 5.9 8.0
1.31.28 3075 2400 1220
3 3.19 3.69 1.67 7.3 7.5 9.31.3
1.33 3225 2420 12304 2.73 3.23 1.64 9.0 9.0 10.6
1.4 1.36 2797 2060 10505 2.20 2.70 1.37 12.0 10.5 12.0
1.41.39 2876 2070 1050
6 2.00 2.50 1.27 13.2 12.0 13.41.4
1.42 2650 1870 9507 1.90 2.40 1.22 14.3 13.5 14.6
1.41.43 2294 ' 1600 820
8. 1.92 2.42 1.23 14.1 15.0 16.21.4
1.44 1764 1240 630Q✓ 1.87 2.37 1.20 14.8 16.5 17.6 1.44 1283 890 450
Table 1 . Example of Calculation: Part of He Spectrum#(Thin' Detectors)
Key to Column Headings*
Y : Y-channel of 2-dimensinnal analyser. Csl scintillator signalX : Mean X-channel of signals attributed to He ions in channel Y
from Si energy-loss detector.x : X corrected for zero offset. (0.50 channels)A E : Energy loss in MeV, corresponding to x. (0.507 MeV/channel)E* : Residual energy of particles leaving Si detector, in MeV.
(Calculated fromAE, assuming alpha particles.)E f gm : Smoothed value of E», from graph of E* against Y. (MeV)E : Incident energy of particles in MeV ( «AE + E» sm ).SE : Difference between successive values of E, in MeV.Se : Smoothed value o f £ E , from graph of S E against Y.
(Assumed to be width of channel Y for alphas.)Peak Counts : Total counts in channel Y attributed to He ions.Counts/<jEsm s Peak Counts/channel width. (Counts/MeV.)Norm'd : Counts/MeV normalised to arbitrary standard exposure.
(Corrected for effective exposure and dead time.)

PROTONS1 2 3 4 5
ENERGY OBSERVED RANGE RANGE d l / d x
M eVSPECTRUM
M e V ~ l g c m "^SPECTRUM
g “ 1 cm ^ M eV g "^ c m ^3 8 .3 00 E + 03 1 . 6 6 8 E - 0 2 8 . 6 9 0 6 + 0 5 1 . 0 4 7 n + 0 24 9 • 6 0 0 t + 0 3 2 . 7 4 3 6 - 0 2 8 . 0 4 8 6+05 8 * 3 b 3E +015 1 . 0 6 0 6 +G4 4 . 0 5 0 6 - 0 2 7 . 4 b l t + 0 5 7 . 0 3 9 1 + 0 16 1 . 1 5 0 E+04 5 . 5 6 1 6 - 0 2 7 . 0 0 9 6 + 0 5 6 . 0 9 5 6 + 0 17 1 .24CE+ 04 7 .3 2 5 c~ 0 2 6 • 6 64 6+ 0 5 5 . 3 9 0 6+018 1 . 3 ^ 0 E+04. ' 9 . 2 6 9 6 - 0 2 6 . 4 4 3 6 + 0 5 4 . 844 6 + 0 19 1 . 4 1 0E+U4 1 . 1 4 6 6 - 0 1 6 . 2 1 4 E + G 5 4 . 4 07 E + 0 \
10 1 . 5 0 0 t + 04 l ' . 3 b 3 E - 0 l 6 * 0 7 3 £ + 0 5 4 . 0 4 9 E + 0 i12 1»64 0 E+04 1 . 9 1 6 6 - 0 1 5 • 730 E +0 5 3 . 4 9 4 6 + 0 11 4 1 .7 c C 6+ C 4 2 . 5 2 7 c - 0 3 5. 490 6 + 05 3 .0 b 4 k +0 116 1 . 9 0 0 E + 04 3 . 2 1 2 6 - 0 1 5 . 2 5 7 1 + 0 5 2 . 7 6 7 6 + 0 1IB 1 . 9 70 c + 0 4 3. -971 6 - 0 1 4 . 9 5 5 E + 0 5 2 . 5 1 5 E + 0 1
-20 2 . 0 0 0 6 + 04 4 . 8 0 2E—u 1 4 . 6 1 8 6 + 0 5 2 . 3 0 9 E+ 0 125 1 . 9 2 5 6 + 04 7 . 1 8 4 E - 0 1 3 • 7 09 E + U 5 1 * 9 2 7 6 + 0 130 1 . 7 4 5 6 + 0 4 9 . 9 6 5 E - G 1 2 . 9 0 4 h + 05 1 . 6 6 4 E + 0 1‘35 1 . 4 6 0 t +04 1 . 3 2 16 + 0 0 2 . 1 4 9 6 + 0 5 1 . 4 7 2 6 + 0 !40 1 . 1 2 0 6+ 0 4 * 1 . 6 7 8 E+00 1 • 4 b 1 E+05 1 * 3 2 2 6 +0145 8 • 0 0 01 + 0 3. 2 . 0 7 6 ki-s- 00 9 • 6 1 6 E+ 04 1 . 2 0 2 t + 0 150 5 . O u O t + 0 3 2 . 5 0 9 E + 0 0 5 • 5 4 0E + 04 1 . 1 0 8 6 + 0 1
6 7 8ENERGY REGION EMISSION RANGE EMISSION
• SPECTRUM . SPECTRUMMeV g - l Cm2 MeV“l
3 - . 4 5 .9 76 E + 06 6 • 340E +044 - 5 4 . 4 8b E+ 0 o 5 . 6 1 8 E + 0 45 - 6 •2 .9 5 3 E + 0 6 4 . 4 9 7 E + 0 46 • - 7 1 .b 6 3 E+06 3 • 2 4 4 E + 047 - 8 1 . 2 3 0 E + 0 6 • 2 • 404E+0 4b —'' 9 1 . 0 53 E+06 2 . 2 7 7 E+049 - 10 5 . 9 2 3 E+0 5 . 1 . 4 0 1 E + 0 4
10 - 12 . 6 . 4 4 2 E+05 1 . 7 0 8 E + 0 4It - 14 3 . 9 3 b E-+05 1 . 1 9 7 E +0414 - 16 3 . 3 9 0E + 05 1 . 159E + 04l o - 18 3 *9 89 E +05 1.5 10E+04l o - , 20 •4 . 0 5 0 E + 0 5 • 1 . 6 7 9 E+0420 25 3 . 8 1 4 E + 05 . l . b 0 1 E + 0 425 - 3 0 , 2 . 8 7 7 E+05 1 . 6 0 2 E + 0 430 - 35 • 2 . 3 4 O E +0 5 1 . 4 9 2 E + 0 435 — 4 0 •1*67 2E + 05 1 . 3 4 0 E + 0 440 - 45 . 1 -3 04 E + 05 • 1 . 0 3 3 E + 0 445 -■ 50 9 . 4 1 3 E + 04 • 6 . 1 5 0 E + 0 3
Table 2. Derivation of emission spectrum from the smoothed observed spectrum of protons emitted from pion stopping peak in carbon (see sec* 4.5.8).
All spectra in tables 2 to 6 'have the same arbitrary normalisation.

1 2 3 ‘ 4 5ENERGY OBSERVED RANGE RANGE < W d x
MeVSPECTRUMMeV**1 g cnT2
SPECTRUMg-^om2 MeV g-^cm2
4 5 . 150E + U3 1 . 6 7 7 E - 0 2 7 ,3 18 E + 0 5 1 . 4 2 1 E +0 2
5 5 * 7 7 0 c +03 2 , 4 4 4 E-0 2 6 , 9 3 6 E+05 1 . 2 0 2 E + 0 26 6 . 3 2 0 E + 0 3 3 . 3 3 8 E - 0 2 6 . 6 1 l t + 0 5 1 . 0 4 6 t + 0 27 6 , 8 0 0 t + 0 3 4 . 3 5 3 E - 0 2 6 . 3 2 0 E + 0 5 9 . 2 9 4 L + 01 .e 7 . 2 2 C E + 0 3 5 .4 fc f i t - 0 2 6. 0 5 0 1 + 05 8 . 3 7 9 t - i O l
9 7 . 5 / 0 b + 03 . 6 . 7 3 9 E - 0 2 5 • 7 o51 + 0 5 7 . 6 4 2 E + 0 110 7 , 8 6 0 E+0 3 8 , 1 0 4 E - 0 2 5 • 5 3 0 E+05 7 . 0 3 5 E + 0 112 8 , 2 o 0 t + 0 3 1 . 1 1 7 E - 0 1 5 , 0 43 E+ 05 6 . 0 9 1 t + O l14 8 , 5 u 0 E + 0 3 1 . 4 6 7 E - 0 1 4 . 5 8 C E + 0 5 5 . 3 d 8 E + 0 116 8 .5 5 C fc+ 0 2 1 . C 5 5E - C 3 4• 1 40 t + 05 4 . 84 2 t-»01IS 8 . 4 5 0 c +03 2 . 2 9 2 E - 0 1 3 . 72 3 E + 05 4 . 4 0 6 1 + 01*0 8 , 1 5 0 t + 0 3 2 . 7 6 6 E - 0 1 3 . 2 9 9 1 + 0 5 4 . 0 4 8 E +0125 ■7 •' 10 Ot + 0 3 4 * 124 t - G 1 2 . 4 0 1 1+05 3 . 3 6 1 t + 0 130 5 , 9 0 0 b + 03 s.'ma-oi • .1 . 7 2 2 E + 0 5 2 , 9 1 9 1+ 0135 4 . 7 t 0 1 + 0 3 7 . 54 SE-0 1 1 . 2 1 1 t + 0 5 2 . 5 7 6 6 * 0 1
40 3 , 6 0 0 b + 0 3 9 . 5 9 8 E - 0 1 8 . 3 3 4 E + 0 4 2 . 3 1 5 E + 0 145 2 • 6 5 0 £+0 3 l * l d 6 E + u O 5 . 5 9 4 E + 0 4 2 . 1 1 1 E + 0 1
5 0 1 *8 50 t + 0 3 1 . 4 3 5 E+00 3 . 5 0 0 t + 0 4 1 . 9 3 5 1 + 0 155 1 * 2 0 0 b + 0 3 1 . 7 0 3 E + U 0 2 . 3 5 2 6 + 0 4 1 . 7 9 3 E + 0 1eO 7 .5 0 0 h + 02 1 . 5 92E+00 1 • 2 5 4 E + 04 1 . 6 7 2 E + 0 1
6 7 8ENERGY REGION EMISSION RANGE EMISSION
SPECTRUM SPECTRUMMeV g~^cm2 MeV~^*
4 — 5 4 . 9 8 b E+06 3 . 8 0 4 E+045 — 6 3 . 6 3 3 E + 0 6 3 • 2 3 3 E + 0 46 - 7 2 . 8 65 E + Ob 2 . 9 0 I E +047 - 8 2 .3 ( i E+ Co 2 . 6 S 5 E + C 48 - 9 2 . 1 1 5 E + 0 6 2 . 6 4 1 E+049 - 10 1 •8 72 E+06 2 . 5 5 U E + 04
10 — 12 1 . 5 8 o E + 0 6 2 . 4 1 6 E + 0 412 - 14 1 . 324 E +0b 2 . 3 0 8 E + 0 414 - j 6 1 . 1 2 2 E + C 6 2 . 1 CA £ + C41 0 - 18 9 .6 2 7 E + 0 5 2 . C 8 2 E + 0 416 — 20 6 * 9 44 E + 05 2 . 1 1 6E+0420 - c3 6 . 6 37E + 0 5 1 . 7 8 1 E + 0 426 — 30 4 . * : 4 7 E + 0 5 1 . 3 4 6E +0420 - 35 2 . "j 5 t E+ C5 1 . 0 1 6E + C435 - 40 1 . 6 4 1 E+05 7 . 5 3 0 E+0 340 — 45 1 . 2 1 1 E+05 5 . 4 7 3 E + 0 345 . - 6 0 . 8 . 0 9 0 E + 0 4 3 . 9 9 9 E + 0 350 - 55 ■5.3 29 E + 04 2 .6 59E + 0355 - 6 C 2 . 1C6E+C4 1 • 7 93 E +03
Table 3. Deuteron spectra.

AJU.JLULNO1 2 3 4 5
ENERGY OBSERVED RANGE RANGE dE/dxMeV
SPECTRUMMeV~^ g cm
SPECTRUMMeV g“^cm^
5 2 . 0 1 6 t + 0 3 1 . 8 5 8 6 - 0 2 3 . 2 7 4 6 + 0 5 1 . 6 2 4 6 + 0 26 2 . 004£ + 0 3 2 . 5 1 8 6 - 0 2 2 . 9 5 9 6 + 0 5 1 . 4 2 0 6+027 2 . 1 4 2 6 + 0 3 3 . 2 6 5 E - 0 2 2 . 7 1 0 6 + 0 5 1 . 2 6 5 6 + 028 2 . 1 9 4 6 + 0 3 4 . 0 9 7 6 - 0 2 2 . 5 0 8 6+O5 1 . 1 4 3 6 + U 29 2 . 2 3 8 6 + 0 3 5 . 0 1 2 6 - 0 2 2 . 3 3 9 6 + 0 5 1 . 0 4 5 6 + 0 2
10 2 . 2 7 4 6 + 0 3 6 . 0 0 9 6 - 0 2 2 . 1 9 2 E + 0 5 9 . 6 3 8 6 + 0 112 2. 3 266 + 0 3 • 8 - . 2 4 2 6 - 0 2 1 • 946 E+0 5 8 . 3 6 8 6 + 0 114 2 . 3 5 6 6 + 03 1 . 0 7 9 6 - 0 1 1 . 7 4 8 6 + 05 7 . 4 1 8 6 + 0 116 2 . 3 5 0 6 + 0 3 . 1 . 3 6 3 6 - 0 1 1 . 5 6 9 6 + 0 5 6 . 6 7 8 E + 0 118 2 . 3c 06 + 0 3 1 . 6 7 7 6 - 0 1 1 . 4 1 1 6 + 0 5 6 . 0 8 4 6 + 0 120 2 . 2 7 0 6 + 03 2 . 0 2 0 6 - 0 1 1 . 2 7 0 6+0 5 5 . 5 9 6 6 + 0 1 ,25 2 . C 2 0 6+O3 3 . 0 0 1 6 - 0 1 9 . 4 6 0 6 + 0 4 4 . 6 8 3 6-*01*30 1 . 7 o 0 6 + 0 3 4 . 1 5 3 6 - 0 1 6 . 8 8 26 + 04 4 . 0 4 8 t + 0 135 1 . 4 0 0 6 + 0 3 5 . 4 6 9 6 - 0 1 5 . 0 0 1 6 + 0 4 3 . 5 7 2 6 + 0 14 0 1 . 1 3 0 t + 0 3 6 . 9 4 7 6 - 0 1 3 . 6 3 2 6 + 0 4 3 . 2 1 4 6 + 0 1
6 7 8ENERGY REGION EMISSION RANGE EMISSION
SPECTRUMg~ ^cm 2
SPECTRUMAieV MeV"!*
5 — 6 • 4 . 7 6 8 6 + 06 3 . 1 33 E + 0 46 — 7 3 . 3 4 2 E + 0 6 2 . 4 8 9 E + 0 47 — 8 2 . 4 2 7 E+06 • 2 . 0 1 5 E + 0 48 — 9 1 . 8 4 7 E + 06 1 . 6 8 9 E + 0 49 — 10 1 . 4 7 5 E + 0 6 1 . 4 6 8 E + 04
10 - 12 1 . 0 9b E + 0 6 1 . 2 2 0 E+04
12 — 14 7 . 7 9 9 E + 05 9 . 8 8 1 E + 0 3
14 _ 16 •6 . 2 8 0 E+ 0 5 8 . 9 1 0 E + 03l o — 18 5 . 0 27E + 05 7 . 8 7 8 E + 0 316 - <10 4 . 1 1 7 E+05 7 . 0 4 9 E + 0320' — 25 3 . 3 0 6 E + 0 5 6 . 4 33E + 0 325 ' — 30 2 . 2 3 6 E + 0 5 5 . 126E +0 3
30 — 35 1 . 4 29E+0 5 3 . 7 5 1 E + 0 335 - 40 9 .26< i E + 04 2 . 7 3OE+08
Tafrle 4. Triton spectra.

1 2 3 4' 5ENERGY OBSERVED RANGE RANGE dE/dxMeV
SPECTRUMMeV"1 g cm~2
SPECTRUMMeV g“3-cm
5 1* 6 20 c + 03 4 * 064 t ~ U 3 1 . 2 5 0 £ + 0 6 7 • 9 6 5 t + 0 26 1 *523 £ + 03 5 • 40 I E - 0 3 1 . 065 £ + 06 6 . 9 9 0 E + 0 27 1 * 4 2 6 fc+U 3 6 . 9 1 1 E - 0 3 8 . 9 0 7 8 + 0 5 6 . 2 4 6 £+028 1 . 3 3 8 2 + 0 3 8 . 5 5 0 2 - 0 3 7 . 572 c +05 5 . 6 5 9 t + 0 29 1 . 2 3 4 8 + 03 1 . 0 4 3 E - 0 2 6 . 4 9 8 E + 0 5 5 . 1 8 2 t + 0 2
10 1 . 1 73 £+03 1 . 2 4 4 8 - 0 2 5 • 614 E+ 05 4 . 7 8 6 E + 0 212 1 * 0 c 3 E + 0 3 1 - . 6 9 2 E - 0 2 4 . 2 6 2 8 + 0 5 4 . 1 6 6 8 + 0 214 8 . 8 7 0E+02 2 . 2 O 2 E - 0 2 3 . 2 d 1 E+0 5 3 . 6 9 9 £ + 0 216 7 . 6 3 O t +0 2 . 2 . 7 7 2 E - 0 2 2 . 545E+ 0 5 3 . 3 3 5 £+0218 6 . 5 3 0 £ + 02 3 . 4 0 0 8 - 0 2 1 . 9 0 6 E + 05 3 . 0 4 2 E + 0 22 0 . 5 . 5 7 0 £+ u 2 4 . 0 6 5 1 - 0 2 1 . 5 6 0 E + U 5 2 . 8 0 1 c+0225 3 . 7 2 0 £ + 02 6 • 0 4 2 E - 0 2 8 . 7 3 8 E+ 04 2 . 3 4 9 E + 0 230 2 . 4 2 0 E + 0 2 8 . 3 3 7 8 - 0 2 4 . 9 2 0 E + C 4 2 . 0 3 3 8 + 0 235 1 . 5 7 0 t ; + 02 1 . 0 9 5 8 - 0 1 2 . 8 1 7 E + 0 4 1 . 7 5 4 8 + 0 2AO 9 . 7 u 0 £ + 0 1 1 • 3 6 9 8 - 0 1 1 . 5 6 8 L + 0 4 1 . 6 1 6 L + 0 245 5 . 9 o 0 f c + 0 1 1 . 7 1 1 E - 0 1 8 . 7 5 0 E + 0 3 1 . 4 6 3 8 + 0 2
‘ 50 3* 5 o 0 c + 01 2 . 0 6 9 E - 0 1 4 • 735 E+0 3 1 . 3 5 3 8 + 0 255 2 . 0 2 0 E + 0 1 2 . 4 5 3 E - 0 1 2 • 5 3 1 E +0 3 1 . 2 5 3 E + 0 260 1 . 2U 0E+ 0 1 2 • 866 8 - 0 1 1 . 4 0 3 fc+U3 1 . 1 6 9 8 + 0 2
6 7 8ENERGY REGION EMISSION RANGE EMISSION
SPECTRUM SPECTRUMMeV g “ ^cm ^ MeV"1
5 - 6 1 .6 8 9 E + 06 •2 . 2 5 d E + 0 56 7 , 1 . 1 52 E +0d 1 . 7 4 0 E + 0 57 _ 8 7 . 9 5 1 E + 0 7 1 . 3 3 6 E + 058 9 5 • 8 3 4 E +07 ' 1 . 0 7 6 E + 059 10 4 . 3 9 9 E + 07 6 . 8 2 7 E + 0 4
10 — 12 ■3 .0 l o E + 0 7 6 . 7 4 3 E + 0 412 — 14 1 . 9 2 3 E + 0 7 9 * 8 9 0E +0414 — 16 1 . 2 9 2 E + 07 3 . 6 7 3 E + 0416 — 18 •6.6 8b-E + 0o 2 . 7 8 8 E + 0 4
I o — c0 o * 2 2 ^ E + 0 6 2 . 1 3 0 E +04
2o — <l5 3 . 5 0 7 E+Oo 1 . 3 6 c E * 0 425 — 30 1 • 6 6 4 E + 06 7 . ’594E + 033 0 — . 35 8 .0 49 E + 05 4 . 2 0 7 E + 0 335 — 40 4 • 2 4 9 E + 05 • 2 . 4 9 2 E + 0 340 — - 4 5 •2 .1 51 E +05 1 • 38 o E + 03
45 * 50 1 . 1 2 1 E + 0 5 7 . 9 0 8 E + 0 2
50 — 55 5.7 4 1 E+04 ' 4 . 4 C 6 E + 0255 — 60 2 . 7 3 2 E + 0 9 ■2.256E + 02
'Tafrle 5« He spectra*

LI IONS
I 2 3 4 5ENERGY OBSERVED RANGE RANGE dE/dxMeV
SPECTRUMMeV-1 g cm~^
SPEJTR^MMeV g"lom”
9 9 . 0 OOF+01 3 . 8 4 0 9 - 0 3 ■ 1 . 24CG+05 1 . 3 7 S c + :•) 31C 6 . 8 0 0 6+01 4 . 6 0 0 0 - 0 3 8 , 7 0 4 1 +C4 1 . 2 8 0 9 +0312 3 . 90C9+01 6 . 2 7 0 9 - 0 3 4 . 3 9 1E + 04 ' 1 . 1 2 6 5 + 0 314 2. . 2 0 0 E+0 1 x R . 1 9 0 9 - 0 3 2 . 2 249 + 04 1 . 0 1 1 5 + 0 316 1 . 2 00 E + 0 1 1 . 0 2 0 2 - 0 2 1 . 1 0 5 0 + 0 4 9 ,20 . 3 5 + 0218 7 . . 30CE+00 1 . 2 5 0 9 - 0 2 6 . 1 9 0 5 + 03 8 . 4 3 0 5 + 0 220 4,0Q0t+00 1 . 4 9 C E - C 2 3 . 15 0 b + 03 ■ 7 . 6 7 6 5 + 0 2
6 7 8ENERGY' REGION EMISSION RANGE EMISSION
SPECTRUM SPECTRUMJugV g"^om.2- MoV**i
9 - . 10 4 , 9 6 6 5 + 0 7 3 . 6 6 1 5 + 0 410 - 12 2 . 5 3 2 3 + 0 7 ’ 2 . ltv / 6 + 0 +1 2 - 14 1 . 1 5 3 5 + 0 7 1 .079c + 0 41 A. - 16 5.46 C 5 +06 5.6 5 2 9+0 3'1 6 • - 18 2 . 1 1 3 F + 0 6 2.3 8 9E+.0318 20 J , 2 6 7 E + 0 6 . 1 . 5 4 9 5 + 0 3
Table 6. Li spectra*
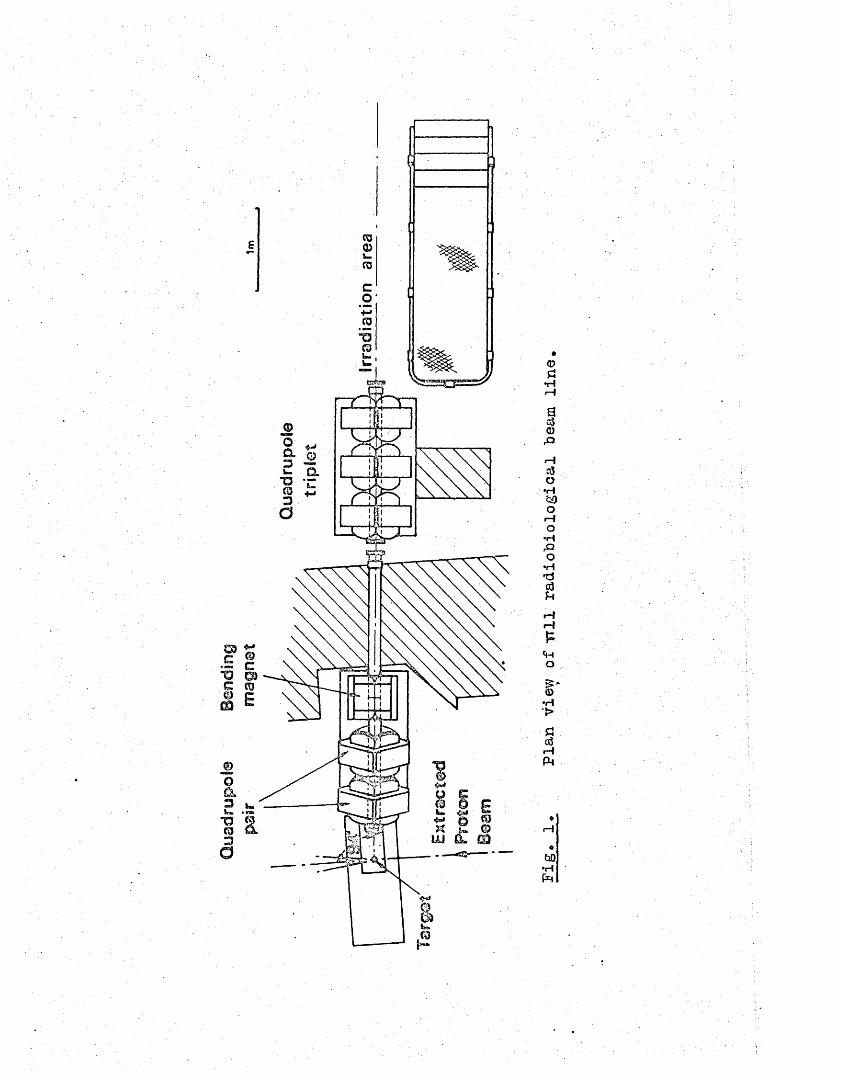
*0 ©)

Bend
ing
. Q
uadr
upot
e m
agne
t tr
iple
t
0a•HrHao30&
o3o•HSOOi—Io•H&O•H'd«3ai—l r-ltr<Hoao
•H-Pc3 > 0 I—IPI
OJtaO
•HPr

Image
of so
urce 0 HH
0 0 ■ r'f0 <H-p oK0 ©
ui
O -H01
z
CO
uIQ
£La .013
CM
to
•Hd0ddc3
Jh0QJhorarQCfldOraSh0>5o5d
S3O•HdrQdU•Pra*Hd©raodd0■Sorad-o3r—I«5«H
CM • 0
LTN O ' • c3 POd• do raS >d o ©
O4
I '-20 •H3 oCvj d0 d ,£> 0
i—I 0d +3•h dc8 <1?u y>uj f-i Q4 0 > ra »h © d ■Paj >5 d d d +3
d 4)ra -hd«»ra0 ,ra
rQ *H
1 S'd c8 O 0 yQdo *h d d>5 0 'U d c3 *«-»
§ « •H O +3 -Ho3 -P
-P cti ra
bD•HP»4
•H ■ d d -o w ud -rtS3
O -P <$ id"-" od
se ratio
to 1*
4
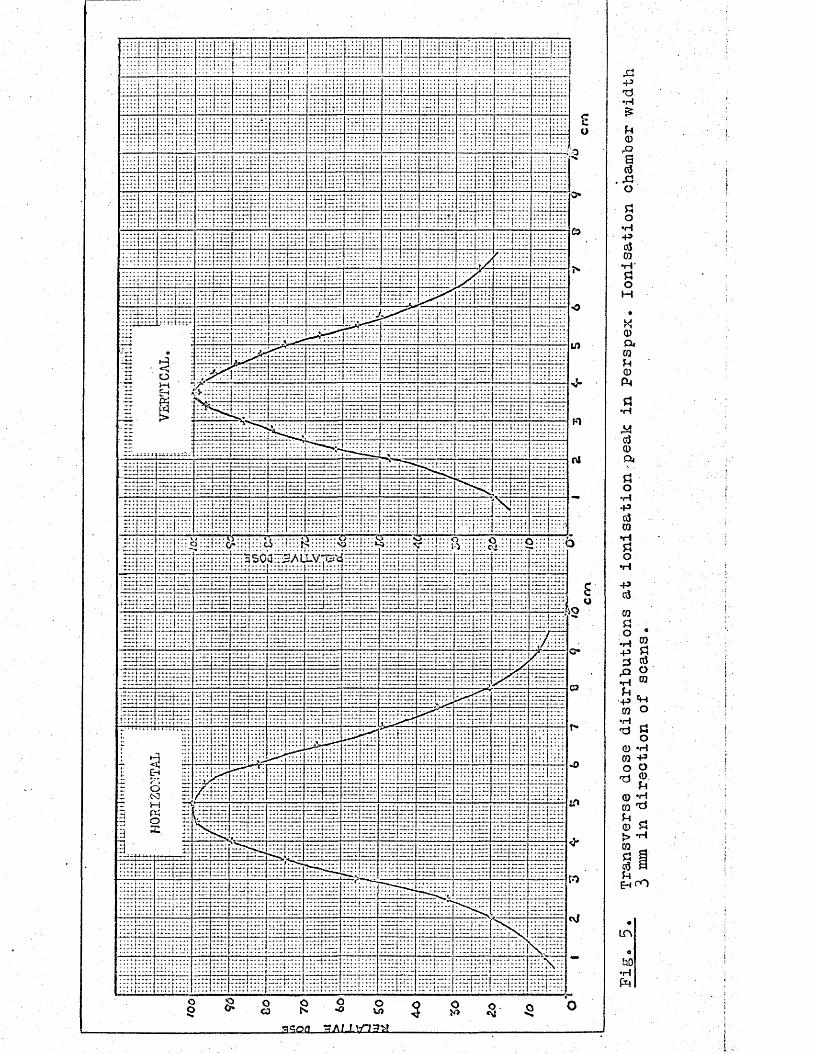
ggoa vAtJLl-nx'H
Fig*
5o Tr
ansv
erse
dose
dist
ribu
tion
s at
ioni
sati
on
peak
in Pe
rspe
x.
Ioni
sati
on
chamber
widt
h 3
mm in
dire
ctio
n of
scan
s.
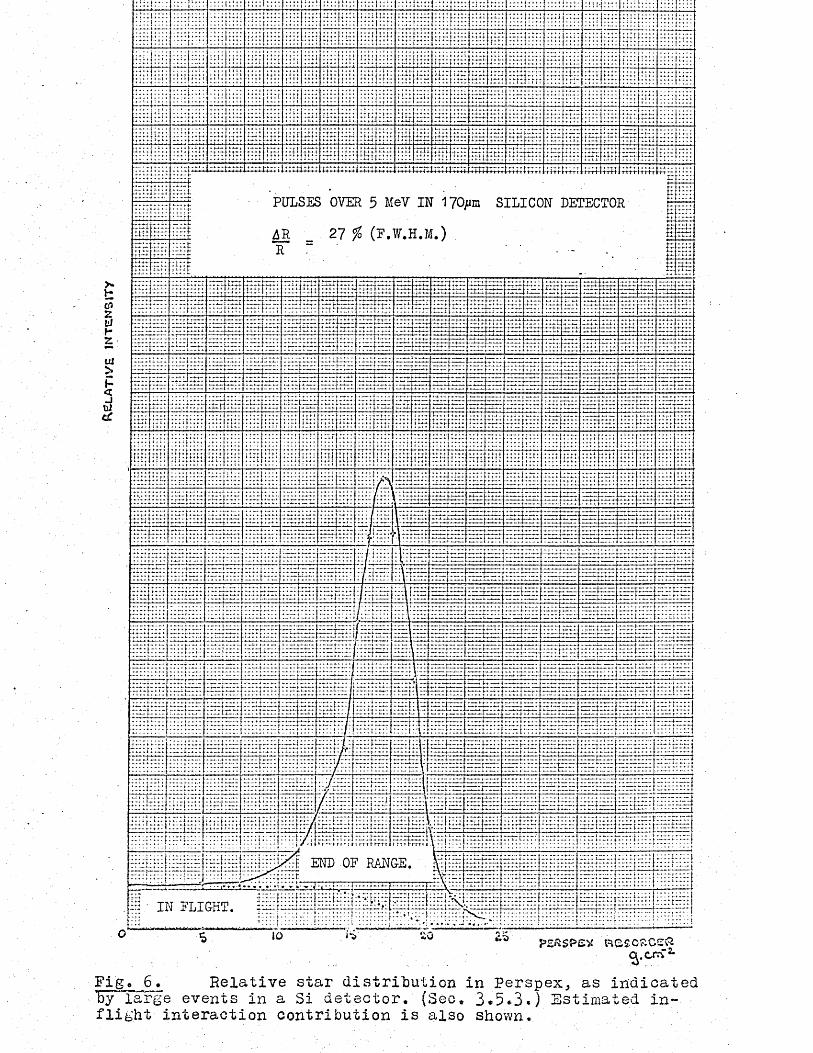
&ElAT
1'/£
INTENSITY
::: Hi HI!Hi!!;!;nU:::
iiii Hr! inf;h; :::: Hi;
iiiiHji iiii
ill!•Hi
Hi: iiiiHi! ;;;;
i::iHI! ill: !lil Hi!
ttrr.
iiiiiiIHIMI :::: HH :r:: iiiiiiiii
Hii Hi: ijriuiii ill::ttt- inLiH
iiii iiHiiHfliii iiii [iiii!i iii::::
H:i 1 iHiiiiii Sill iiHiiiilHi: ifi
1 HHHHi iii ig ii iiii HiHH iH%iH i ill iiiiiiiii
iiiiiiiii:::: :::: ;:l; :::ii ill; iiilillfi IIII Iiii hh!it;: HiiHiii
:::::::riutu: ::::
mm
: : : : n
HrtH::.; :
PULSES OVER 5 MeV IN 170jum SILICON DETECTOR AR _ 27 % (F.W.H.M.)
I::::t:::::
HiiHiii
HIT I Hi ::::Hill III!
HiHHtiirtil::r:
Hli END OF RANGE.iiiliiir.::: it; V7l r.»:« ■
-H: IN FLIGhT.
BeSCGCCv*l.CS*ra.
Fig. 6. Relative star distribution in Perspex/ as indicated I>y~ large events in a Si detector. (Sec. 3«5*3«) Estimated inflight interaction contribution is also shown.

A
Particles per Unit Range . Interval
R*Range
Pig* 7« Range spectrum in extended medium with uniformly distributed emission of monoenergetic particles.* All particles have initial range R*.
a
Observed Particles per Unit Range Interval
A
Particles
Range
RangeFig.- 6* (a) Observed range spectrum approximatedto a series of rectangles, each corresponding to a single initial range or emission energy.
(b) Discrete value initial range spectrum thus obtained•
(Straggling is neglected throughout.)

-pm fl)
f
2 £->£LcO
3•POj f-i H +»Oj O P< 0 Oa O,rf raCn .po oS'Sctf P f-i f-< bO P< aJ*H > j <H
° s <*d •n oo •0 owbo•H
(App
roxi
mate
ly
scal
e

E E E 1) E n B B B A A 9 8 7 h 4 d 3 4 3 3 4 3 3 2 3 3 3 3 4 3 4E E E D D r\ B B B •A A 9 8 8 6 5 3 3 3 2 3 3 3 3 1 3 4 3 3 2 3 3E E E I) D nV B B B B A A 9 8 7 6 5 4 2 2 l 2 3 3 3 3 2 2 l 3 4 lE E E I) D c B B B B A A 9 '9 8 7 6 5 4 4 3 3 4 4 2 2 2 ‘3 3 2 3 310 E E E JD 0 0 G B B B B A A 9 9 8 7 6 5 4 3 •3 2 3 2 2 3 3 3 2 3 3E E E D 0 n G B B B B A A A 9 9 8 8 6 5 4 3 3 2 3 2 3 3 3 2 3 l
E E E D C cvc B B A A A> A A 9' 8 8 7 5 5 4 3 3 3 3 4 3 3 3 2E E B JD n B B B A A A" A A 9 8 7 6 5 4 4 3 2 2 ■3 3 3 2E E E D B B B B A A A A 9 9 T ^8 8 7 6 5 5 4 3 4 2 2 2E E E nv B A A B B sB,,A A 9 A A" 9 8 6 6 5 4 4 4 2E E E n B A 9 A A B B A 9 9 9 T .9 9 9 8 7 7 6 5 4'E E E n</ B A 9 9 9 9 A A ^A A 9 9 9 9 9 9 •’Ka*i lE E E n B A 9 9 6 8 8 8 9 9 A 9 9 8 8 i l 8 8 d ^ BE E E $ B B A 9 9 6 6 8 8 8 8 6 8 9 y ^o 9 9 8 8 8 8 8 3 8
o E E E B G B B A A 9 9 9 8 8 8 8 8 8 1 7 7 8 8 8 8 8 8 8 8 8 8 80 10 20 30 X
( a )
Y • * • • • • •10 • . • • • • « •
. 1 2 5 6 8 8 ' M 8 8 6 5 3 12 4 6 7 8 8 7 5 4 2
2 4 6 7 8 u''fckg 8 7 5 4 21 2 3 5 6 7 8 8 7 7 5 4 3 1
1 3 4 5 6 7 B 8'5'~£U£8 7 7 6 5 4 1 2 4 5 6 7 7
2 3 4 5 6 7 ~ T• • • « « • « ' •
0 • • • • • • ' *0 10 20 30 X
( * )COUNTS SYMBOL 11 - 20' 4 1001 - 2000 A
21 - 50 5 2001 - 5000 B0 Blank 51 - 100 6 5001 - 10000 C
1 - 2 1 101 - 200 7 10001 - 20000 D3 - 5 2 201 - 500 8 > 20000 E6 - 10 3 501 - 1000 9
Fig. 10. Quasi- logarithmic representation of two-dimensional analyser array. Thin detector telescope* X is signal from Si energy-loss detector (0.0202 MeV/channel), Y is signal from Osl residual energy detector (approx. 1.1 MeV/channel for charge .l). In (a) , p and; d distributions, and (top right) part of the He distribution,can be discerned. In (b) the t distribution for Y-channels 2 to 8 after separation Is plotted. (See fig. 12 for a graph of the counts for Y = 5, together with plots of the separated components.) The curves .are the loci of the maxima of the separated p, d and t distributions.

Y 6 9 '! 3 3 2 1 2 19 9 5 3 2 2 2 1 1 1 1A A 6 4 3 2 2 2 1 1 1 1 1 1 1B A 7 4 2 2 2 1 1 1 1 1 1B A 6 3 3 3 2 1 1 1 1 1
10 0 9 t9 4 4 3 2 1 1 1 1 1 1 1 1 10 9 1 A 4 3 3 2 3 1 1 1 1 1 1 1D 8 k 5 3 A 4 2 l l l 1B 6 W 2 4\5 3 1 1 1 1 1 1 1D 8 A 8 4 3 5\4 2 1 1 1 1 1 1 1 1a 6 A\9 4 4 4 X 3 2 2 1 1 2 1 1 1 1E 9 9\A 6 4 4 5\5 3 2 2 1 1 1 1 1 1S B 6 B , d 4 4 5 5x4 3 2 1 1 1 1 1 1 1 1 1E 0 7 a \ 7 4 4 5 5 x 5 3 1 2 1 1 1 1 1 1 1 1 1D C 8 8 A\A 7 5 4 5 4 4 3 2 2 2 3 1 1 1 1 1
.0 D D A 8 8 J tsA 8 5 5 5 5 ^ < 6 - 5 4 2 3 3 2 3 1 1 1 10 H© 10 Li 20 30 X
COUNTS . SYMBOL 0 Blank
1 - 2 13 5 26 - 10 311 - 20 421 - 50 551 - 1CO 6101 . — 200 7201 - 500 8501 - 1C X 91001 - 20X A2001 - 5C00 B5C01 - 10X 0 C10X 1 - 2X 00 D
2X X 2
Fig.'ll. Two-dimensional analyser array, as in fig. 10s thin detector telescope, but with much lower sensitivity on X-channels for analysis of charge 2 and 3 particles'(0.508 MeV/channel) .Y sensitivity was approximately 2.3 MeV/channel for charge 2.The curves are the smoothed loci of the maxima of the He and Li distributions. There is no clear evidence of particles of higher Charge.

resi
dual
s
ti~r
, • • **
oo
f?
ex.
oooa. <
U)Zz<z01X
rH p• GjW) D Pi •H tJ *HCO P CD •H P
a3Pi•H
Pfng3&p
rCJ ©<D ,P pp p PPi o Q) *> Ow Q)0) H Tju cd p P<0 D 0) CO o M p P &D >» 0 d ‘4 0 P cd cdrH taO0 flj P *HPi «HO rH *P* cd O • *H. g *IA O H.P '0II 03 *H Ci<fw fl) 05P P P cd O 0 ‘P P .P P**r~JP P © *o a? p aiH n O 0 Piti^PCO
ps p ra• P o Pra o .ci o 0 Vi ra pPt oopora•H
ra o 0 d ra pcd rH 0 ■H g3 t3rara 0 piH 2 Ih -H<x5 cd jp © iO P tiD ra P'd d © cj <D cd £! d P H P o p ra •h ra 'h <H «n P o o cd0 LO rH
Pi -d cd o P 0 o •H ,P *HP Tj P ftcd P >> P cd UO p cd P pu ra «h •» © p p ra co pj o >h p cd O P O P ,QrH PS .GOJ 03 CQ O rH P•rH P P • tU ffl iU tOHH £
•H li ‘h o ^ O flJ H
©
cd

COUN
TS
PER
CHAN
NEL
Experimental DataInterpolated BackgroundData with Background Subtracted
5 10 20xX - C H A N N E L N?
Fig* 13___________ A thick detector constant-Y plot. Illustratingthe use of a log-log plot to facilitate estimation of background continuum. The overlapping peaks are p, d and t .

Rela
tive
Num
ber
of Pa
rticl
es
(MeV
)'
10Energy MeV
Fig, 14. Observed spectra of particles leaving carbon surface in pion stopping region. All spectra have the same arbitrary normalisation. For discussion of errors see text.

Guthrie et al. (calculated)
Cu
Present Experiment
Pig. 15* Unfolded emission spectrum for protons in pion capture peak in carbon. In this and following figures all experimental spectra have the same arbitrary normalisation ,(left-hand scales). The calculated spectra of Guthrie et al. are given for comparison; these are numbers per MeV per pion capture (right-hand scales).

Guthrie et al
a.
1 Present * Experiment — JO
u
20 Energy M e V ~°
Unfolded emission spectra for d and tPig. 16.

Guthrie et al‘He
Present ExperimentQ. He
bOO
Fig, 17. Unfolded emission spectrum for He,

P(X Guthrie et' al,
Heavy Recoils
Li
presentExperiment
310
JO■2° Energy M e V ^0
Fig. 18. Unfolded emission spectrum for Li.