Embed Size (px)
Citation preview

Physical and Geographical Physical and Geographical Injecting Sites Among Injecting Sites Among Injecting Drug Users Injecting Drug Users
Shane Darke, Joanne Ross Shane Darke, Joanne Ross
& Sharlene Kaye & Sharlene Kaye
NDARC Technical Report No. 77 NDARC Technical Report No. 77

Technical Report No. 77
PHYSICAL AND GEOGRAPHICAL
INJECTING SITES AMONG
INJECTING DRUG USERS
Shane Darke, Joanne Ross & Sharlene Kaye
National Drug and Alcohol Research Centre University of New South Wales
Australia
ISBN 0 7334 0624 6
©NDARC 1999

TABLE OF CONTENTS ACKNOWLEDGMENTS vi EXECUTIVE SUMMARY .. vii 1.0 INTRODUCTION .... ............................................................................. 1 1.1 Study Aims .. .......... ............................................................................. 2 2.0 METHOD ..... .......... ............................................................................. 3 2.1 Procedure .... .......... ............................................................................. 3 2.2 Structured Interview 3
2.2.1 Demographic characteristics ..................................................... 3 2.2.2 Drug use history ........................................................................ 3 2.2.3 Risk behaviours .......................................................................... 4 2.2.4 Injection-related health ............................................................... 4 2.2.5 Physical injection sites ................................................................ 4 2.2.6 Geographical injection sites ........................................................ 4
2.3 Statistical Analyses . 5 3.0 RESULTS .... .......... ............................................................................. 6 3.1 Sample Characteristics ......................................................................... 6 3.2 Drug Use History .... ............................................................................. 8 3.3 Risk-Taking Behaviours ........................................................................ 10 3.4 Injection-related problems .................................................................... 11 3.5 Physical injection sites .......................................................................... 12
3.5.1 Initial and most recent sites ........................................................ 12 3.5.2 History of physical injection sites ................................................ 14 3.5.3 Risk perceptions of physical injection sites ................................. 18 3.5.4 Factors associated with multiple physical injection sites ............ 19
3.6 Geographical injection sites .................................................................. 20
3.6.1 Initial and most recent geographical injection sites ..................... 20 3.6.2 History of injecting in geographical sites ..................................... 21 3.6.3 Frequency of use of geographical injection sites ........................ 22 3.6.4 Factors associated with injections in public locations ................. 23
4.0 DISCUSSION ......... ............................................................................. 25 4.1 Major Findings of the Study .................................................................. 25

4.2 Prevalence of use of physical injection sites......................................... 25 4.3 Risk perceptions of use of physical injection sites .............................. 27 4.4 Injection-related problems .................................................................... 28 4.5 Factors and harms associated with the use of multiple
injection sites ........ ............................................................................. 29 4.6 Prevalence of use of geographic injection sites .................................... 30 4.7 Factors and harms associated with frequent public injecting ................ 31 4.8 Summary and conclusions.................................................................... 32 5.0 REFERENCES ....... ............................................................................. 33
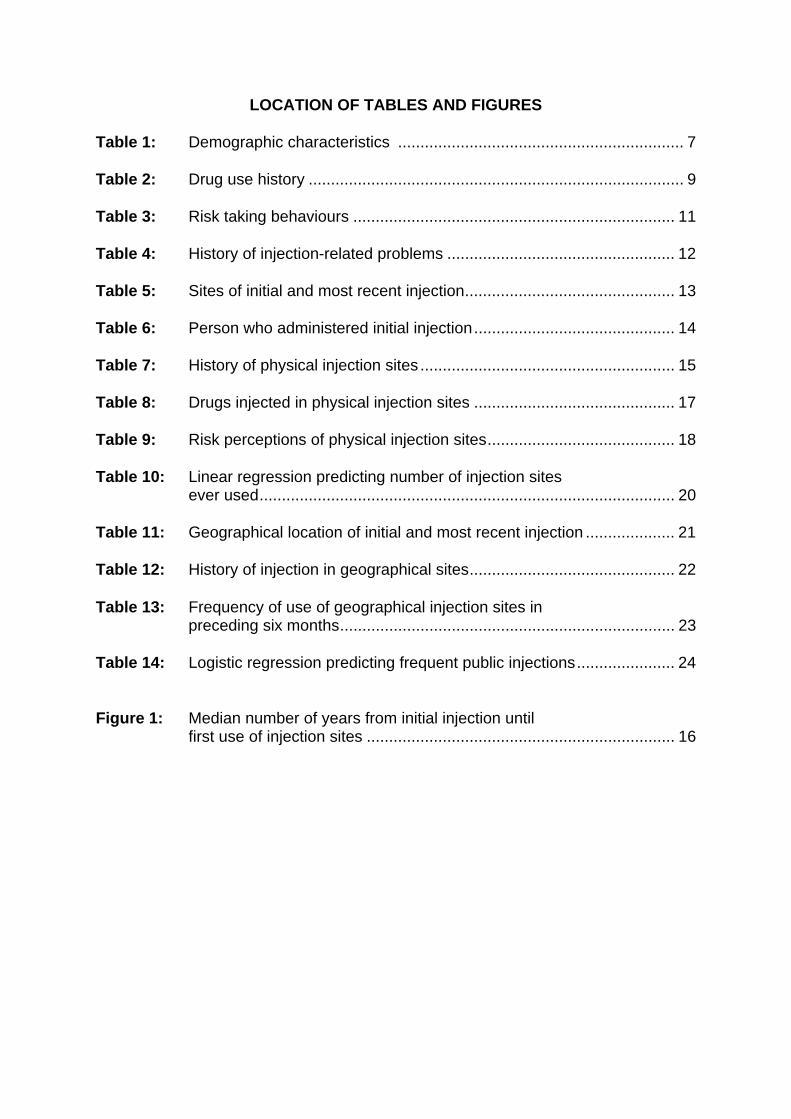
LOCATION OF TABLES AND FIGURES Table 1: Demographic characteristics ................................................................ 7 Table 2: Drug use history .................................................................................... 9 Table 3: Risk taking behaviours ........................................................................ 11 Table 4: History of injection-related problems ................................................... 12 Table 5: Sites of initial and most recent injection ............................................... 13 Table 6: Person who administered initial injection ............................................. 14 Table 7: History of physical injection sites ......................................................... 15 Table 8: Drugs injected in physical injection sites ............................................. 17 Table 9: Risk perceptions of physical injection sites .......................................... 18 Table 10: Linear regression predicting number of injection sites
ever used ............................................................................................. 20 Table 11: Geographical location of initial and most recent injection .................... 21 Table 12: History of injection in geographical sites .............................................. 22 Table 13: Frequency of use of geographical injection sites in
preceding six months ........................................................................... 23 Table 14: Logistic regression predicting frequent public injections ...................... 24 Figure 1: Median number of years from initial injection until
first use of injection sites ..................................................................... 16

ACKNOWLEDGMENTS
This research was funded by the Department of Health and Family Services. The
authors wish to thank the staff at the following organisations for their assistance: Pitt
St Centre, Resources and Education Program for Injecting Drug Users, We Help
Ourselves, Odyssey House, the Kirketon Road Centres and the Drug Intervention
Service Cabramatta. In particular, we wish to thank Ingrid van Beek, Julie Dixon, Sue
Heard, Lisa Maher, Rebecca McKetin, James Pitts and Garth Popple.
vi

EXECUTIVE SUMMARY
A sample of 200 injecting drug users were interviewed about their physical injection
sites (body parts) and the geographical locations in which they injected. The use of
multiple physical injection sites was common. The mean number of injection sites
that had been used by subjects was 3.1, and 2.0 sites had been used in the previous
six months. Sixteen percent of subjects had injected in five or more sites. Almost all
(99%) had injected in the cubital fossa (crook of the arm). The next most popular site
was the forearm (71%). Other sites included the hand (53%), foot (19%), leg (18%),
neck (10%) and groin (6%). There was a clear progression in sites used, from the
cubital fossa at initial injection to the use of sites such as the groin after 10 years of
injecting. Compared to the initial injection, the most recent injection was significantly
more likely to be in a site other than the cubital fossa (27% v 6%).
more injection sites.
during the preceding six months.
Females had used significantly more injection sites than males. There were
significant correlations between the number of injection sites ever used and: length
of injecting career, number of injection related problems experienced, number of
drug classes ever used and number of drug classes ever injected. Linear multiple
regressions revealed that a greater number of injection-related problems and a
greater number of drug classes ever injected were independently associated with the
use of
Nearly all subjects (96%) had injected in a public place, and 89% had done so in the
preceding six months. Large proportions had injected in all locations studied,
including cars (90%), public toilets (81%), the street (80%) and trains (55%).
Injecting in public places also occurred frequently. Twenty seven percent had
injected often in the street over the preceding six months, 22% had injected often in
cars and 17% had injected often in public toilets. Overall, 53% of subjects had
injected often in at least one public location
vii
Frequent injectors in public places were more likely to be male, and to have
overdosed in the preceding six months. They had injected significantly more drug

classes in the preceding six months, had injected in more physical injecting sites in
that period and had more current injection-related problems. Logistic regressions
indicated that, after controlling for the effects of other variables, being male and
having a greater number of injection-related problems were independently
associated with frequent public injections.
viii

1
y more dangerous injection sites.
tions such as endocarditis.
1.0 INTRODUCTION
A great deal of research has been conducted in recent years on the injecting
risk-taking behaviours of injecting drug users (IDU). However, this research has
focussed almost exclusively upon the risk of blood borne transmission of HIV and
hepatitis through the sharing of injecting equipment. It has long been recognised,
however, that the act of injecting per se, however, carries health risks1-5. Frequent
injections may, for example, cause vascular damage, irrespective of "safe" injecting
practices. Damage to a favourite injection site may, in course, lead to the use of
other, potentiall
To the knowledge of the authors, only one study to date has examined the
prevalence of injection sites among IDU6. This British study reported widespread use
of a variety of sites. While almost all of these British IDU had injected in their arms
(99%), significant proportions had injected in legs (42%), feet (38%), groin (24%) and
necks (14%). Injection sites were distinguished by their age of first use, with a mean
age of 20 years for injection in the arm and 28 years for injection in the groin and
neck, suggesting a career in which the more obvious injection sites are used up.
While injecting in any site carries risks, the risk of injecting in sites such as the groin
and neck is substantially greater than in sites such as the cubital fossa (crook of the
arm). It is difficult for the person to see what they are doing in such sites, increasing
the risk damaging the vein or hitting an artery. As the veins in sites such as these are
substantially larger, any damage to them may result in serious circulatory problems
and an increased risk of life threatening infec
There are also clear health implications regarding the types of drugs injected into
injection sites. The injection of oral preparations such as benzodiazepines and
methadone syrup is common among IDU in Australia and elsewhere7-11, and has
serious health consequences. The injection of temazepam has been associated with
amputations and death11-13. The injection of methadone syrup, common in Sydney8,
has been associated with fistulas, abscesses/infections in injection sites and venous
thrombosis8,14.

2
ms, are
urrently unknown.
and associated harms, beyond
ose associated with the sharing of injecting equipment.
of a
follows
. To document the physical injection site histories of IDU, and associated
nt the geographical injection site histories of IDU, and associated
arms.
took place from February to September of 1999, by means of
An issue related to the physical injection site practices of IDU concerns the
geographical location of such injections. A recent British study reported a higher rate
of overdose among those IDU who injected in public places such as streets, parks
and toilets15. Street injectors also injected more frequently and had more vascular
problems than other IDU. In New South Wales between 1992 and 1996, a quarter of
heroin overdose deaths occurred in public places16. During this period, in the region
of Sydney with the largest street-based heroin market, 70% of deaths occurred in
public places17. The risk of overdose in public places may reflect a more dependent,
risky individual. Alternatively, factors such as more rapid injecting so as to avoid
detection, with a consequently larger bolus effect, may be implicated. The
geographical injecting practices of IDU in Australia, and associated har
c
Given the paucity of data on the physical and geographical injecting practices of IDU,
the current study examined these behaviours. The study aimed to provide a more
complete picture of the injecting practices of IDU
th
1.1 Study Aims
The study aimed to examine the physical and geographical injecting sites
sample of Sydney injecting drug users. Specifically, the aims of the study were as
:
1
factors and harms;
2. To docume
factors and h
2.0 METHOD
2.1 Procedure
All respondents were volunteers who were paid A$20 for their participation in the
study. Recruitment
3
rs, either by telephone or in person, and were
creened for eligibility to be interviewed for the study. To be eligible for the study
at
ny information they provided would be kept strictly confidential and anonymous.
tered a structured interview that took between 30 and 45
e conducted by one of the research team.
mographic characteristics
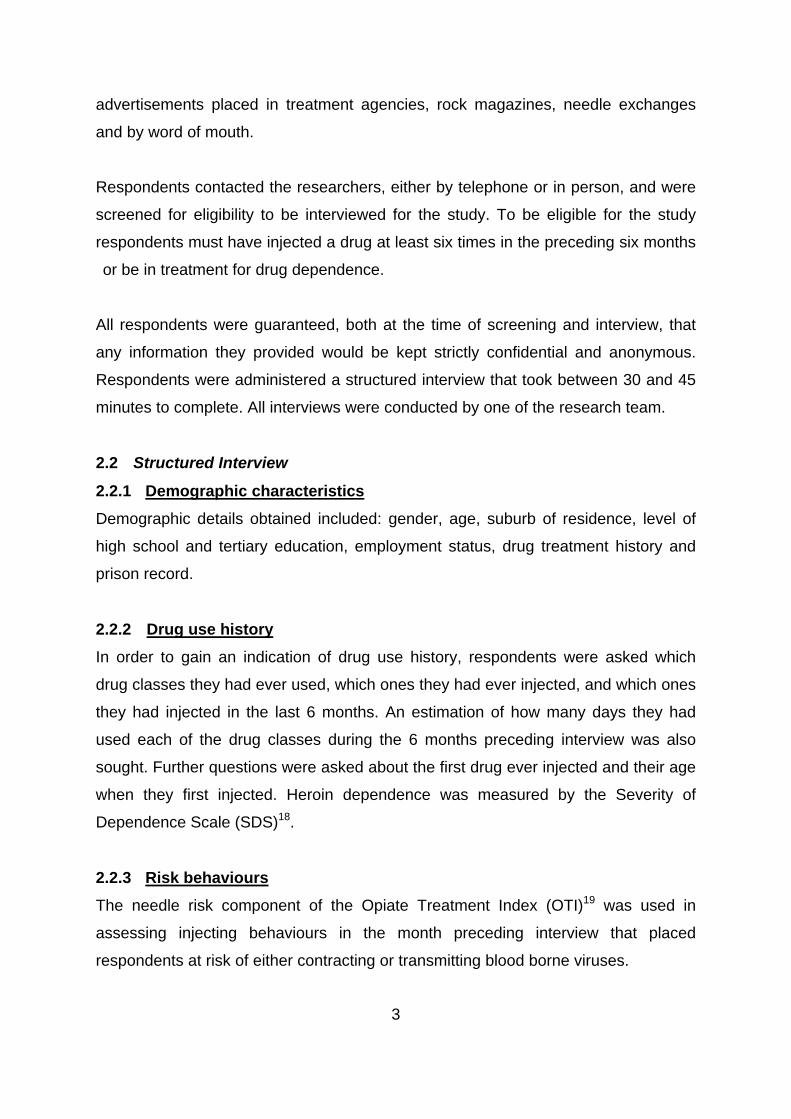
advertisements placed in treatment agencies, rock magazines, needle exchanges
and by word of mouth.
Respondents contacted the researche
s
respondents must have injected a drug at least six times in the preceding six months
or be in treatment for drug dependence.
All respondents were guaranteed, both at the time of screening and interview, th
a
Respondents were adminis
minutes to complete. All interviews wer
2.2 Structured Interview
2.2.1 De
emographic details obtained included: gender, age, suburb of residence, level of
education, employment status, drug treatment history and
D
high school and tertiary
prison record.
2.2.2 Drug use history
In order to gain an indication of drug use history, respondents were asked which
drug classes they had ever used, which ones they had ever injected, and which ones
they had injected in the last 6 months. An estimation of how many days they had
used each of the drug classes during the 6 months preceding interview was also
ought. Further questions were asked about the first drug ever injected and their age
. Heroin dependence was measured by the Severity of
s
when they first injected
Dependence Scale (SDS)18.
2.2.3 Risk behaviours
The needle risk component of the Opiate Treatment Index (OTI)19 was used in
assessing injecting behaviours in the month preceding interview that placed
respondents at risk of either contracting or transmitting blood borne viruses.

4
e they had last overdosed and whether they had ever been
dministered naloxone.
Those subjects who had ever used heroin were asked how many times they had
overdosed, how long sinc
a
2.2.4 Injection-related health
The Health Scale of the OTI was administered to gain an indication of the
respondent's injection-related problems. Questions were also asked about lifetime
istory of injection-related problems. h
2.2.5 Physical injection sites
A detailed section on physical injection sites was constructed. Questions included:
first and most recent injection sites, lifetime and recent use of injection sites, age at
first injection in each site, drugs injected into each site, and perceived danger of
dividual injection sites. in
2.2.6 Geographical injection sites
Questions on geographical injection sites included first and most recent injection
ites, lifetime and recent injection sites and frequency of injecting in individual sites.
s

5
ion 6.1.4)20.
2.3 Statistical Analyses
T-tests were used for continuous data. Where distributions were highly skewed,
medians were reported. For dichotomous categorical variables, Odds Ratios (OR)
and 95% Confidence Intervals (95% CI) were reported. In order to determine factors
associated with multiple physical injection sites, simultaneous multiple regressions
were conducted. Logistic regressions were performed to determine factors
associated with injecting in public places. All analyses were conducted using SPSS
for Windows (vers

6
.
n full-time employment.
e 15-250).
3.0 RESULTS
3.1 Sample Characteristics
The sample consisted of 200 IDU, recruited from all areas of Sydney. The mean age
of subjects was 28.4 years (SD 7.5, range 15-52), with 61% being male (Table 1)
The mean years of formal school education was 9.9 (SD 1.6, range 5-12). Twenty
nine percent of subjects had completed a trade or technical course, and 4% had
completed a university course. The majority of subjects (92%) were currently
unemployed, with 4% i
Forty percent of subjects were currently enrolled in a drug treatment programme,
with 25% of subjects currently enrolled in drug free residential programmes (median
enrolment= 2 mths, range 1-8 mths) , and 16% in methadone maintenance (21
mths, range 1-144 mths). The mean methadone dose of those enrolled in
methadone maintenance was 62.5 mg (SD 43.2, rang
Forty seven percent of subjects reported a history of imprisonment, with males being
significantly more likely than females to report such a history (57% v 30%, OR 3.22,
95% CI 1.76-5.89).

7
Table 1: Demographic characteristics
Variable Males
(N=122) Females (N=78)
Total (N=200)
Age (mean yrs)
28.9 27.6 28.4
School education (mean yrs)
9.7 10.1 9.9
Tertiary education: None Trade/technical University
62 34 3
77 19 4
68 29 4
Employment (%): Unemployed Full time Part time Student
92 3 5 0
92 4 1 3
92 4 4 1
Drug treatment (%): Not in treatment Drug free Methadone
60 25 16
59 25 15
60 25 16
Prison record (%)
57 30 47
8
caine.
six months.
(46%).
5).
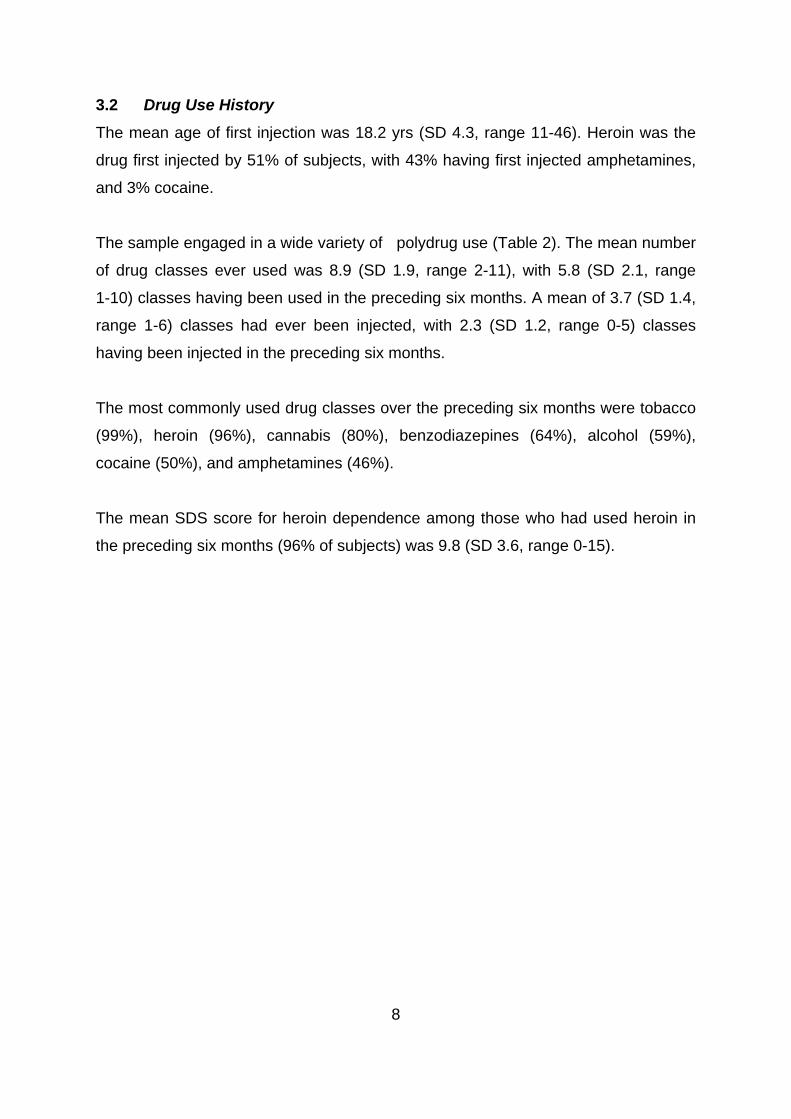
3.2 Drug Use History
The mean age of first injection was 18.2 yrs (SD 4.3, range 11-46). Heroin was the
drug first injected by 51% of subjects, with 43% having first injected amphetamines,
and 3% co
The sample engaged in a wide variety of polydrug use (Table 2). The mean number
of drug classes ever used was 8.9 (SD 1.9, range 2-11), with 5.8 (SD 2.1, range
1-10) classes having been used in the preceding six months. A mean of 3.7 (SD 1.4,
range 1-6) classes had ever been injected, with 2.3 (SD 1.2, range 0-5) classes
having been injected in the preceding
The most commonly used drug classes over the preceding six months were tobacco
(99%), heroin (96%), cannabis (80%), benzodiazepines (64%), alcohol (59%),
cocaine (50%), and amphetamines
The mean SDS score for heroin dependence among those who had used heroin in
the preceding six months (96% of subjects) was 9.8 (SD 3.6, range 0-1

9
Table 2: Drug use history
Class
Ever used
Drug Ever
Injected
Used lst 6 mths
Injected lst 6 mths
Days used lst 6 mths*
Heroin
99 99 96 96
131
Other opiates
71 58 38 23
12
Amphetamines
90 82 46 45
5
Cocaine
85 75 50 43
5
Hallucinogens
77 23 19 6
2
Benzodiazepines
87 35 64 18
21
Antidepressants
39 0 20 0
42
Alcohol
94 59
8
Cannabis
97 80
72
Inhalants
49 6
3
Tobacco
99 99
180
Mean no. drug classes
8.9 3.7 5.8 2.3
N/A
* Median number of days used in the last 6 months by those who had used the drug class in that period

10
aving done so.
valence of overdose.
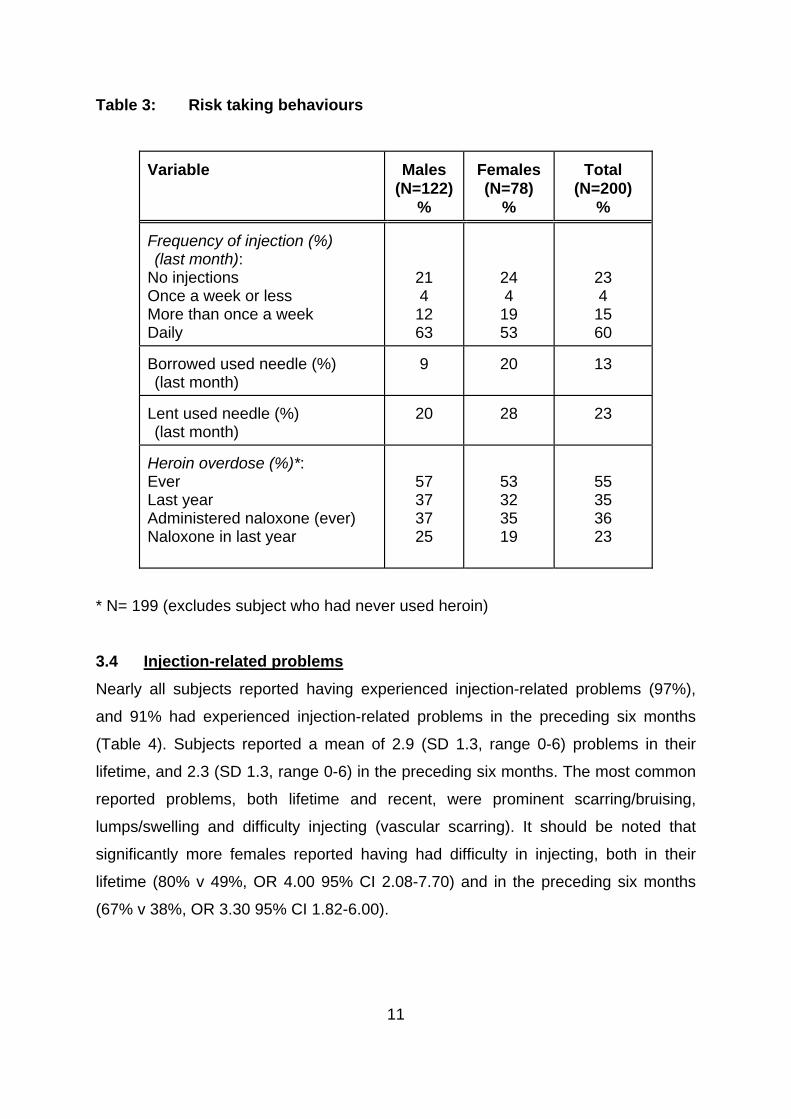
3.3 Risk taking behaviours
The majority (60%) of the sample had injected on a daily basis over the preceding
month (Table 3). The overwhelming majority (88%) of subjects not enrolled in drug
treatment had injected on a daily basis during the previous month.
Thirteen percent of subjects reported having injected with a borrowed used syringe
in the preceding month, with females significantly more likely to have done so (20% v
9%, OR 2.60 95% CI 1.14-5.96). Twenty three percent of subjects reported having
passed on their used injecting equipment during the preceding month, with no
difference in the proportions of males and females reporting h
Over a half (55%) of subjects who had ever used heroin reported having
experienced an overdose, 35% in the preceding year. The median number of
overdoses experienced was 2 (range 1-40). Thirty six percent reported having been
administered the opioid antagonist naloxone, 23% in the preceding year. There were
no gender differences in the pre
11
Table 3: Risk taking behaviours
Variable Males
(N=122) %
Females (N=78)
%
Total
(N=200) %
Frequency of injection (%) (last month): No injections Once a week or less More than once a week Daily
21 4 12 63
24 4
19 53
23 4 15 60
Borrowed used needle (%) (last month)
9 20
13
Lent used needle (%) (last month)
20 28
23
Heroin overdose (%)*: Ever Last year Administered naloxone (ever) Naloxone in last year
57 37 37 25
53 32 35 19
55 35 36 23
* N= 199 (excludes subject who had never used heroin)
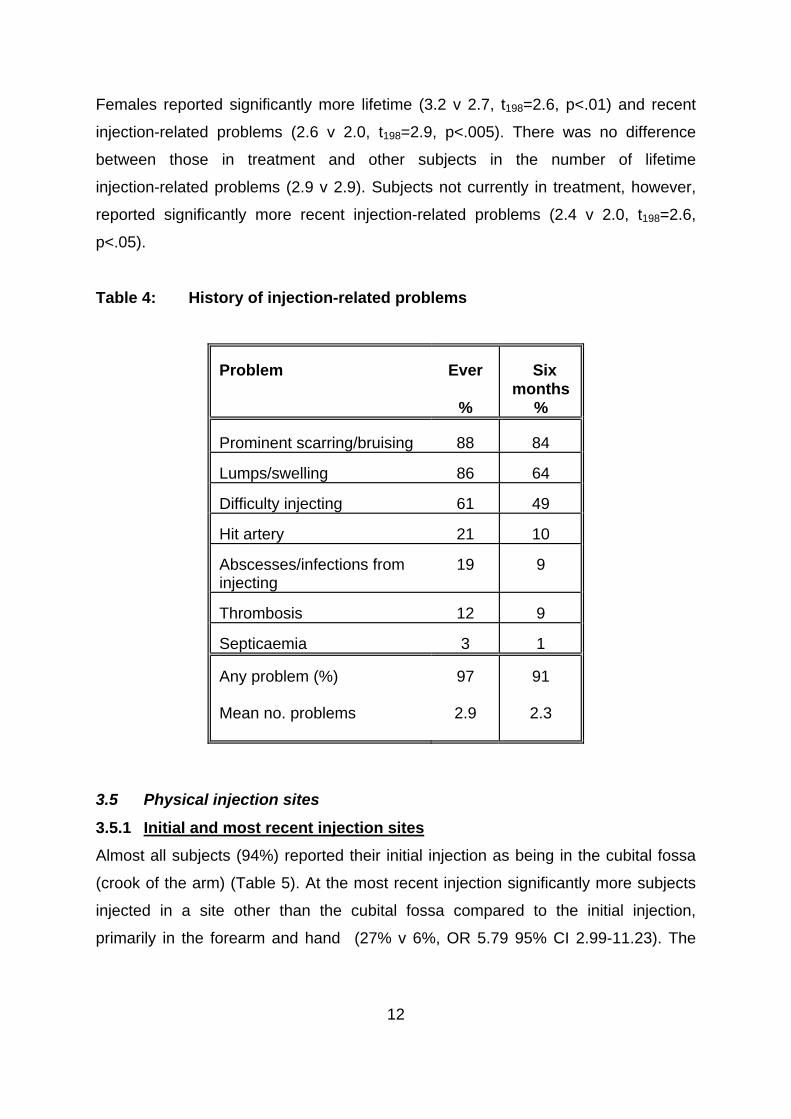
3.4 Injection-related problems
Nearly all subjects reported having experienced injection-related problems (97%),
and 91% had experienced injection-related problems in the preceding six months
(Table 4). Subjects reported a mean of 2.9 (SD 1.3, range 0-6) problems in their
lifetime, and 2.3 (SD 1.3, range 0-6) in the preceding six months. The most common
reported problems, both lifetime and recent, were prominent scarring/bruising,
lumps/swelling and difficulty injecting (vascular scarring). It should be noted that
significantly more females reported having had difficulty in injecting, both in their
lifetime (80% v 49%, OR 4.00 95% CI 2.08-7.70) and in the preceding six months
(67% v 38%, OR 3.30 95% CI 1.82-6.00).
12
mber of lifetime
jection-related problems (2.9 v 2.9). Subjects not currently in treatment, however,
problems (2.4 v 2.0, t198=2.6,
<.05).
Table 4: Hist ction-related proble
Ever Six months
Females reported significantly more lifetime (3.2 v 2.7, t198=2.6, p<.01) and recent
injection-related problems (2.6 v 2.0, t198=2.9, p<.005). There was no difference
between those in treatment and other subjects in the nu
in
reported significantly more recent injection-related
p
ory of inje ms
roblem P
% %
Prominent scarring/bruising 88 84 Lumps/swelling 86 64
ifficulty iD njecting 61 49 Hit artery 21 10 Abscesses/infections from injecting
19 9
Thrombosis 1 2 9
epticaemia S 3 1 Any problem (%)
ms
97
2.9
91
2.3 Mean no. proble
3.5 Physical injection sites
3.5.1 Initial and most recent injection sites
Almost all subjects (94%) reported their initial injection as being in the cubital fossa
(crook of the arm) (Table 5). At the most recent injection significantly more subjects
jected in a site other than the cubital fossa compared to the initial injection,
rimarily in the forearm and hand (27% v 6%, OR 5.79 95% CI 2.99-11.23). The
in
p

13
ne case who had injected in an "other" site on the last occasion injected in the
penis.
Table 5: most rec injection
Initial injection
%
Most recent injection
%
o
Sites of initial and ent
Arm (cubital fossa) 94 73 Arm (forearm) 5 12 Arm (upper) 1 2 Hand 0 6 Fingers 0 1 Leg 0 1 Foot 0 1 Toes 0 0 Groin 1 3 Neck 0 1 Other:
0 1
Subjects were asked who injected them the first time they had an injection (Table 6).
Two thirds (63%) responded that they were injected by a friend, with almost equal
t a sexual partner injected
em. There were notable gender differences. While 21% of males injected
themselves on the first occasion, only 10% of females did so (OR 2.37 95% CI
proportions reporting that they injected themselves or tha
th

14
1.01-5. ales, however, were sign m to een first
injected by a sexual partner (28% v 7%, O % 1.4
Table 6: Person who administered initial injection
erson Males (N=122)
Females (N=78)
Total
(N=200)
55). Fem ificantly ore likely have b
R 4.93 95 CI 2.13-1 2).
P
% % % Friend 67 56
63
Self 21 10
17
Partner 7 28
16
Relative 4 5
5
3.5.2 History of physical injection sites
The prevalence of injection site use is presented in Table 7. Almost all IDU (99%)
had injected in the cubital fossa, 86% in the preceding six months. The next most
popular injection site was the forearm (71%), which had been used by 48% of
ubjects in the preceding six months. A half (53%) of the sample had injected in the
he mean number of injection sites that had been used by subjects was 3.1 (SD 1.8,
most common
methods described were: use a tourniquet (52%), do not need to do anything (31%)
and pump/clench hand (14%). Females were more likely than males to report using
a tourniquet (65% v 43%, OR 2.46 95% CI 1.37-4.43), while males were more likely
to report having to do nothing (37% v 22%, OR 2.10 95% CI 1.09-4.02).
s
hand, 26% in the preceding six months. Approximately a fifth of IDU reported having
injected in the foot (19%) and/or leg (18%). Classified under "other" injection sites
were small proportions who had injected in the clavicle, shoulder, penis and breasts.
T
range 1-11), and 2.0 (SD 1.4, range 0-7) sites had been used in the previous six
months. Sixteen percent of subjects had injected in five or more sites in their
injecting careers.
Subjects were asked how they obtained a vein for injecting. The

15
Table 7: History of physical injection sites
Ever
% Last six months
% Age first injected
in site (mdn)
Arm (cubital fossa)
99 86 17
Arm (forearm)
71 48 20
Hand
53 26 21
Arm (upper)
20 12 21
Foot
19 8 22.5
Leg
18 8 24
Neck
10 4 22
Groin
6 4 26
Fingers
6 3 27.5
Toes
3 1 27
Other:
4 3 26
Mean no. sites
3.1 2.0 N/A
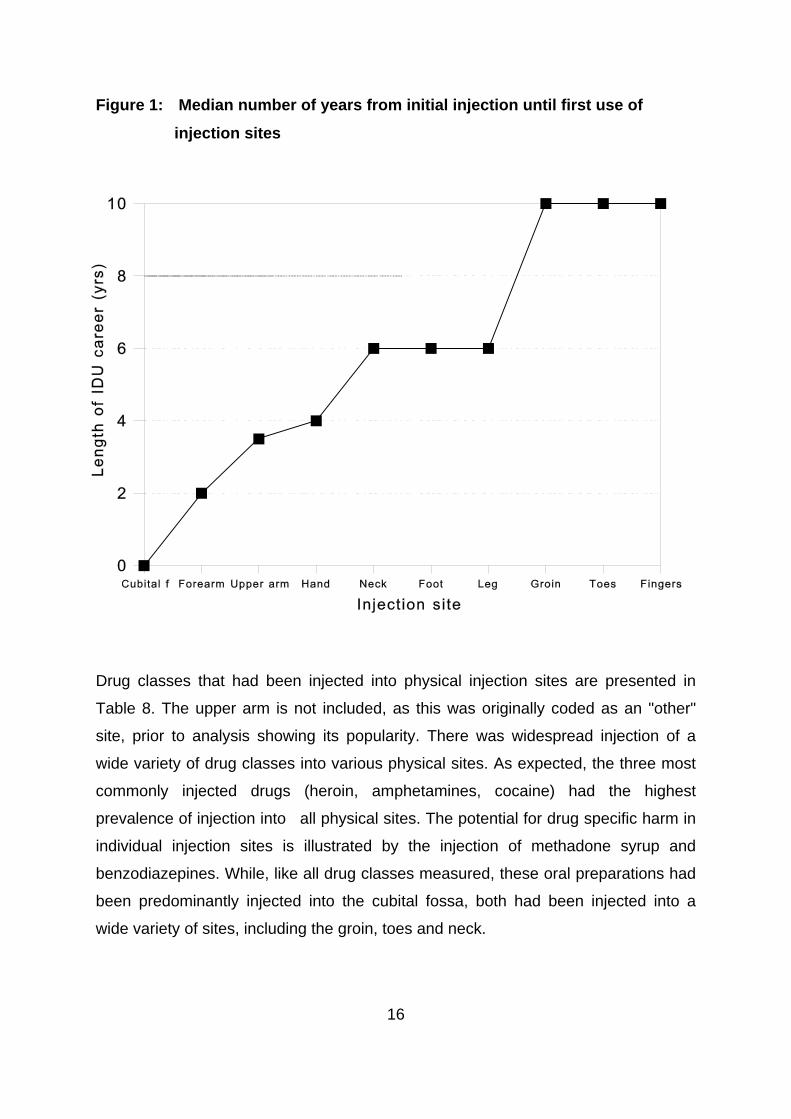
The number of years from initial injection until individual injection sites were first
employed are shown in Figure 1. There was a marked progression in the use of
different sites. On average, the forearm was first used as an injection site two years
after the initiation of injecting, the upper arm after 3.5 years and the hand after four
years. The neck, foot and leg all first occurred after six years of injecting. Injection in
the groin, toes and fingers occurred, on average, after a decade of injecting.
16
tes
es, including the groin, toes and neck.
Figure 1: Median number of years from initial injection until first use of
injection si
Drug classes that had been injected into physical injection sites are presented in
Table 8. The upper arm is not included, as this was originally coded as an "other"
site, prior to analysis showing its popularity. There was widespread injection of a
wide variety of drug classes into various physical sites. As expected, the three most
commonly injected drugs (heroin, amphetamines, cocaine) had the highest
prevalence of injection into all physical sites. The potential for drug specific harm in
individual injection sites is illustrated by the injection of methadone syrup and
benzodiazepines. While, like all drug classes measured, these oral preparations had
been predominantly injected into the cubital fossa, both had been injected into a
wide variety of sit

17
Table 8: Drugs injected in physical injection sites
Arm
(cubital) %
Arm (forearm)
%
Hand
%
Foot
%
Leg
%
Neck
%
Groin
%
Fingers
%
Toes
%
Other
% Heroin
98 65 46 15 14
9 5 5 1 22
Amphetamines
77 30 15 6 5
1 2 1 2 10
Cocaine
70 24 12 4 4
2 2 1 1 9
Methadone
44 12 4 2 2
1 2 1 1 3
Benzodiazepines
31 9 5 4 2
0 1 1 1 3
Hallucinogens
21 2 0 0 0
1 0 0 0 1

18
3.5.3 Risk perceptions of physical injection sites
Subjects were asked to rate the degree of danger involved in injecting into individual
injection sites (Table 9). As in Table 8, the upper arm was not included as it had
been originally coded as an "other" site. The cubital fossa was considered the least
dangerous place to inject, with 77% stating it was either not very dangerous or not
dangerous at all. The sites perceived to be the most dangerous were the groin and
neck, with 91% and 93% respectively believing it to be dangerous. While injecting in
the neck was considered the most dangerous activity, it was not the site least often
employed for injection. More subjects had injected in the neck than in the groin,
fingers and toes. It is worthy of note that all but one of the subjects who had injected
in the neck believed it to be dangerous.
Table 9: Risk perceptions of physical injection sites
Very
dangerous %
Quite dangerous
%
Not very dangerous
%
Not dangerous
at all %
Cubital fossa 10 18 48
29
Forearm 11 30 41
20
Leg 28 39 25
9
Hand 33 41 20
7
Foot 41 34 15
4
Fingers 47 36 13
5
Toes 48 34 15
4
Groin 69 22 7
3
Neck 78 15 4
2
3.5.4 Factors associated with multiple physical injection sites

19
(r=-0.09).
career was entered into the
odel.
of injection sites. The model was significant (f=43.4, p<.001) and
accounted for 31% of the variance.
Females had used significantly more injection sites than males (3.4 v 2.9, t198=1.98,
p<.05). There were significant correlations between the number of injection sites
ever used and: length of injecting career (r=0.18, p<.01), number of injection- related
problems experienced (r=0.48, p<.001), number of drug classes ever used (r=0.36,
p<.001) and number of drug classes ever injected (r=0.43, p<.001). There was no
significant difference between the number of sites ever used by those currently in
treatment and those not in treatment (3.3 v 2.9). There were also no significant
correlations between number of injecting sites and age (r=0.07) or years of
secondary education
In order to determine independent predictors of multiple injection sites, linear
multiple regressions were conducted. Variables entered into the initial model were:
sex, length of injecting career, years of education, treatment status, number of
injection related problems experienced, number of drug classes ever used and
number of drug classes ever injected. Length of injecting career and age were
co-linear (r=0.82). As such, only length of injecting
m
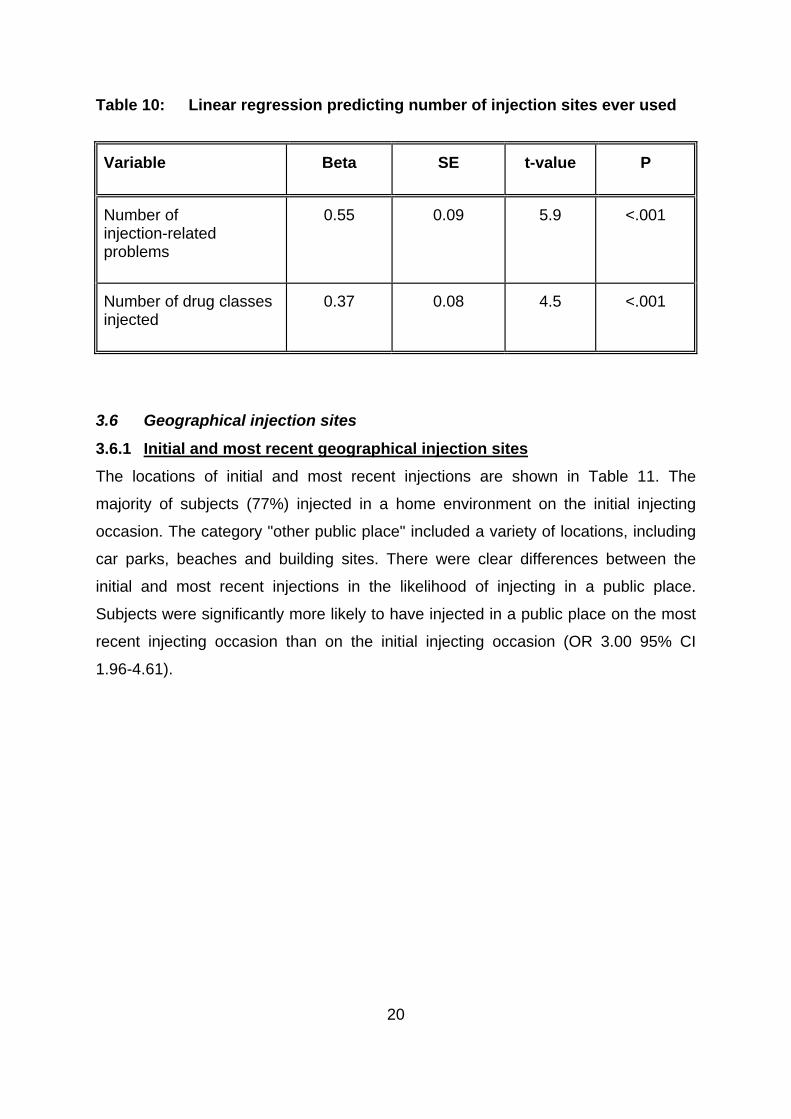
The final regression model is presented in Table 10. After controlling for the effects
of other variables, a greater number of injection-related problems and a greater
number of drug classes ever injected were significantly associated with the use of a
larger number
20
Table 10: Linear regression predicting number of injection sites ever used Variable
Beta SE t-value
P
Number of injection-related problems
0.55 0.09 5.9
<.001
Number of drug classes
jected
0.37 0.08 4.5
<.001
in
3.6 Geographical injection sites
3.6.1 Initial and most recent geographical injection sites
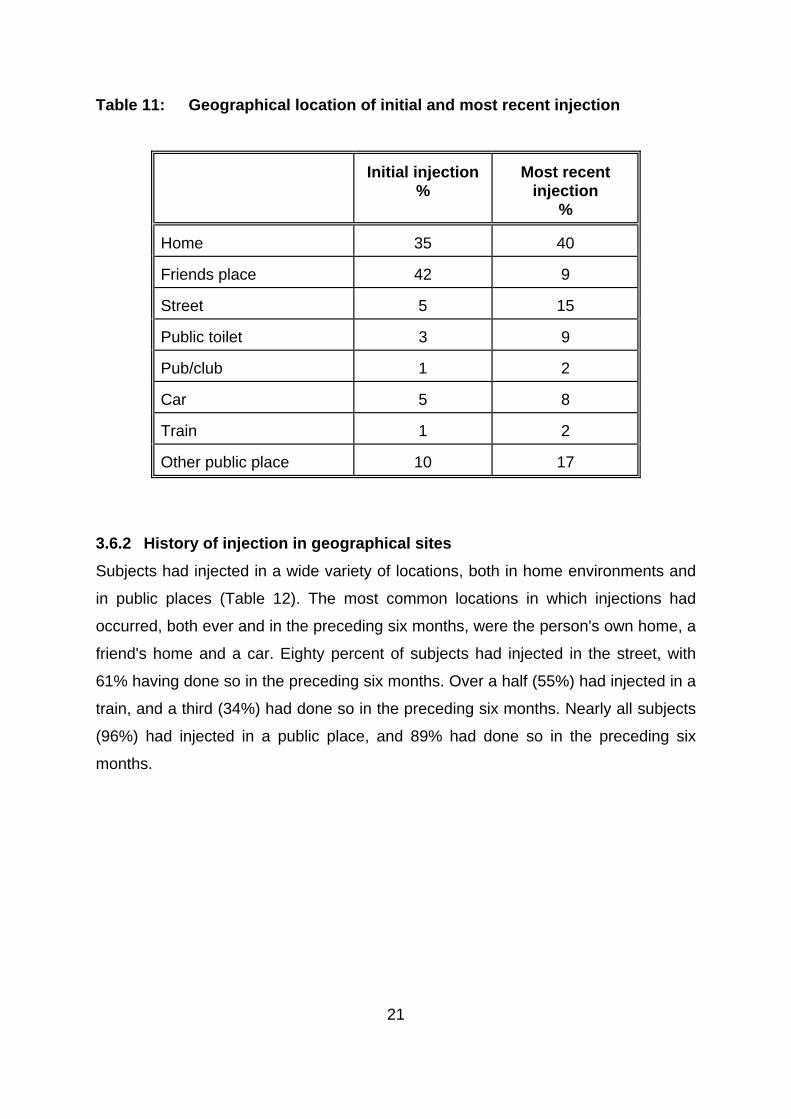
The locations of initial and most recent injections are shown in Table 11. The
majority of subjects (77%) injected in a home environment on the initial injecting
occasion. The category "other public place" included a variety of locations, including
car parks, beaches and building sites. There were clear differences between the
initial and most recent injections in the likelihood of injecting in a public place.
Subjects were significantly more likely to have injected in a public place on
the most
recent injecting occasion than on the initial injecting occasion (OR 3.00 95% CI
1.96-4.61).
21
Table 11: Geographical location of initial and most recent injection
Initial injection
% Most recent
injection %
Home 35 40 Friends place 42 9 Street 5 15 Public toilet 3 9 Pub/club 1 2 Car 5 8 Train 1 2 Other public place 10 17
3.6.2 History of injection in geographical sites
Subjects had injected in a wide variety of locations, both in home environments and
in public places (Table 12). The most common locations in which injections had
occurred, both ever and in the preceding six months, were the person's own home, a
friend's home and a car. Eighty percent of subjects had injected in the street, with
61% having done so in the preceding six months. Over a half (55%) had injected in a
train, and a third (34%) had done so in the preceding six months. Nearly all subjects
(96%) had injected in a public place, and 89% had done so in the preced
ing six
onths.
m

22
Table 12: History of injection in geographical sites
Ever
% Six months
% Home 99 92 Friends place 95 79 Car 90 68 Public toilet 81 58 Street 80 61 Pub/club 70 39 Train 55 34 Other public location 75 59 Any public location
96
89
3.6.3 Frequency of use of geographical injection sites
Subjects were asked how frequently they had injected in specific geographical
locations over the preceding six months (Table 13). Seventy one percent reported
having injected often in their own home. However, injecting in public places was also
common and frequent. Twenty seven percent reported having injected often in the
street over the preceding six months, 22% had injected often in cars and 17% had
injected often in public toilets. Overall, 53% of subjects reported having injected often
in at least one public location during the preceding six months.

23
Table 13: Frequency of use of geographical injection sites in preceding six months
Often
% Sometimes
% Rarely
%
Never
% Home
71 11 11
8
Street
27 14 20
36
Car
22 23 24
31
Friends place
20 35 26
20
Public toilet
17 19 24
37
Pub/club
8 11 21
56
Train
7 11 17
61
Other public place
19 18 22
34
3.6.4 Factors associated with injections in public locations
In order to examine which factors were associated with injecting in public places,
those subjects who reported having often injected in public places in the preceding
six months were compared with the remainder of the sample. Frequent injectors in
public places were more likely to be male (60% v 41%, OR 2.14 95% CI 1.20-3.02)
and to have overdosed in the preceding six months (31% v 19%, OR 1.96 95% CI
1.02-3.79). They had also injected significantly more drug classes in the preceding
six months (2.5 v 2.1, t198=2.2, p<.05), were more likely to have injected in more
physical injecting sites in that period (2.3 v 1.7, t198=2.9, p<.01) and had more
current injection-related problems (2.5 v 2.0, t198=2.9, p<.01). There were no
significant differences between the groups in length of injecting career, education,
needle sharing, number of drug classes used in the preceding six months or SDS
cores. s
In order to determine independent predictors of frequent public injecting, logistic
regressions were conducted. Variables entered into the initial model were: sex,
length of injecting career, years of education, treatment status, number of injection

24
sed needles, SDS score, and number of physical injection sites used in the
r controlling for the effects
f other variables, being male and a greater number of injection-related problems
Table 14 Logistic regression predicting frequent public injections
ble
related problems experienced in the preceding six months, number of drug classes
used in the preceding six months, number of drug classes injected in the preceding
six months, experience of overdose in the preceding six months, recent borrowing of
u
preceding six months.
The final regression model is presented in Table 14. Afte
o
were independently associated with frequent public injections.
Varia
OR 95% CI
Sex 2.86 2.24-3.48
Number of injection-related problems (preceding 6 mths)
1.53 1.27-1.79

25
ious sites.
elated problems.
ms.
lief of the
4.0 DISCUSSION
4.1 Major Findings of the Study
The study showed widespread use of multiple injection sites. Subjects had used an
average of three injection sites in their careers, and two in the previous six months.
Significant proportions of IDU had injected in sites such as the hand, foot, leg and
neck. A wide variety of substances, including oral preparations, had been injected
into var
The study revealed a clear career progression in the use of injection sites, from the
near universal use of the cubital fossa for the initial injection, to the use of less
common sites such as the groin and fingers after a decade of injecting. There was
an association between the number of injection sites used, and experiencing a
greater number of injection-r
The second major finding of the study was the widespread and frequent use of public
injecting locations. Nearly all subjects had injected in a public place, and 89% had
done so in the preceding six months. Injections in locations such as streets, cars and
public toilets were all common. The frequent use of public locations for injections
was associated with a greater number of injection-related proble
4.2 Prevalence of use of physical injection sites
As was the case in the British study6, the current study revealed widespread use of
almost all body sites for injection. The common public perception, reinforced by
media images, of injections taking place in the cubital fossa, represents a small
component of the injecting behaviours of IDU. Significant proportions of subjects
had injected in sites such as the hand, foot and leg. One in ten subjects had injected
in the neck. Several subjects had injected in unexpected sites, such as below the
clavicle. One in six subjects had injected in five or more different sites. Interestingly,
no subject reported injecting in the eye, which is a common lay be
behaviour of IDU.
There were noticeable differences in the prevalence of use of sites between the
Australian IDU and those reported in the British study. Equal proportions in both

26
major differences in the characteristics of the samples, as their demographics and
kely to have an IDU partner than males21, the odds of a female being
rst injected by a partner were five times those of males. Conversely, males were
who had injected in the neck/foot/leg did so after six years of
jecting. The final progression to the use of the groin and the extremities
samples had injected in the arm (although the British study did not distinguish
separate parts of the arm). However, larger proportions of British IDU had injected in
the hand (71% v 53%), foot (38% v 19%), leg (42% v 18%) and groin (24% v 6%).
While the British study was less precise in measuring body parts, e.g. not
distinguishing between hands/fingers and foot/toes, aggregating the components
indicated that the discrepancies were not attributable to the use of different
categories. It is unclear whether this reflects cultural differences, or the impact of the
use of particular drugs. For instance, the injection of the benzodiazepine
temazepam, strongly associated with serious vascular health effects, is more
common in the UK than in Australia7,8,11. The differences could also not be attributed
to
drug use careers samples were almost identical.
Subjects typically began their injecting career by injecting in the cubital fossa. This
injection was most commonly given by a friend, although significant gender
differences existed. Consistent with studies that have found that female IDU are
much more li
fi
more likely to have injected themselves.
The progression of injection sites is illustrated by the comparison of initial and most
recent injection sites. While the first injection was almost exclusively in the cubital
fossa, a quarter of subjects injected in some other location on the most recent
occasion. There appeared to be a marked injecting site "career" among these IDU.
The initial progression from the cubital fossa was to other parts of the arm: the
forearm (two years after initiation) and upper arm (3.5 years). The use of the hand,
having been practised by a half of subjects, occurred on average four years after
initial injection. Those
in
(toes/fingers) occurred a decade after the initiation of injecting.
27
jecting were all reported by large proportions of
e sample. The results indicate that most subjects continue to use earlier injection
. The fact that such substances have been injected into sites such as the
ngers and groin is cause for concern. While users may be aware that injecting into
added risks posed by
iew was prevalent, despite the large number of
jection-related problems that were reported by the sample, and the fact that
The reasons for such progressions, in all probability, relate to injection-related
problems experienced in often used sites. This view is supported by the finding that
the use of more injection sites was independently associated with a greater number
of injection-related health problems. Large numbers of the sample reported both
lifetime and current injecting-related health problems. Thus, prominent scarring,
lumps and swelling and difficulty in
th
sites, such as the cubital fossa, but add other sites to their repertoire. Regular
vascular damage would thus be occurring in a wide variety of sites.
A wide range of drug types had been injected into body sites. Heroin was the drug
that had the highest prevalence of injection in all sites, with the exception of the toes.
Amphetamines and cocaine had also been injected by substantial proportions into a
variety of sites. Of particular health interest was the fact that the two oral
preparations, benzodiazepines and methadone syrup, had been injected by some
subjects into sites such as the hand, groin, fingers and toes. As noted in the
introduction to this report, the injection of these substances has been associated with
amputations, fistulas, abscesses/infections in injection sites, venous thrombosis and
death10-13,16
fi
such sites is risky, it is doubtful that they are aware of the
injecting oral preparations into such sites.
4.3 Risk perceptions of use of physical injection sites
The IDU in this sample held a benign view of the risks of injecting in the arm. The
majority of subjects believed that this practice was either not very dangerous, or was
not dangerous at all. This v
in
subjects were moving on to other injection sites presumably, at least in part, due to
the negative effects of reported injections in the arm.

28
ected in this site than in perceived less dangerous sites such as the
roin, fingers and toes. A perception of danger is clearly not sufficient to discourage
f the neck injectors recognised neck injecting as
22, nearly all subjects reported both lifetime and
urrent injection-related problems. As noted above, prominent scarring, lumps and
is may reflect generally smaller veins in females compared
males. Females would appear to be at a higher risk for health problems that arise
pected, those not currently in treatment had more current problems
an those in treatment. Treatment has been shown to be protective against
ns
es
There was a strong belief that injecting in sites other than the arm was dangerous,
particularly the neck and groin. While these sites were less commonly used than the
arm, the perception of risk did not correspond with the prevalence of their use. Thus,
while injecting in the neck was viewed as the most dangerous activity, more of the
sample had inj
g
an activity. The fact that all but one o
dangerous illustrates this point. Given that injecting in any site carries risks, this may
not be surprising.
4.4 Injection-related problems
Consistent with previous research
c
swelling and difficulty injecting were the three most commonly reported problems.
The data clearly show that the risks associated with injecting are significant,
independent of practices such as needle sharing.
Females reported significantly more lifetime and current injection-related health
problems than males. Th
to
directly from the act of injecting than their male colleagues. In relation to this issue, it
is worth noting that males were significantly more likely to report having to do nothing
to find a vein for injection.
As would be ex
th
overdose and blood borne viruses17. The reduction of the rate of injectio
associated with drug treatment would also appear to reduce the incidence of health
problems arising directly from injecting.
4.5 Factors and harms associated with the use of multiple injection sit

29
, it is feasible that
males may be prompted to use more sites due to a higher likelihood of vascular
to account the effects of other
ariables, these two variables predicted multiple injection site use. The fact that there
be
factor in causing a move to other sites, the use of such sites as the groin is likely to
e omeone presenting with a
he current study indicated widespread and frequent use of public locations as
Females reported using significantly more injection sites than males. Given the
greater number of injection-related health problems that females reported, and more
specifically the greater difficulty they reported in relation to injecting
fe
damage.
As would be expected, there was an association between length of injecting career
and the number of injecting sites ever used. Thus, as the vascular health in a
particular site degenerates, the need to find alternative sites becomes important.
The final regression model indicated that a greater number of injection-related health
problems and the injection of more drug classes were both independent predictors of
the number of injection sites used. Thus, after taking in
v
is a strong and independent relationship between health problems and multiple
injection site use is of importance. While, as argued above, health problems may
a
caus further significant damage. The clinical picture of s
range of injecting sites is likely to include a range of vascular problems.
Similarly, the more different drug classes injected, the more sites used. The injection
of a wide variety of drug types may be a marker for the more entrenched drug user.
4.6 Prevalence of use of geographic injection sites
T
injection sites. Nearly all subjects had injected in a public location, and nearly all had
done so in the preceding six months. Injecting in a street was common: 80% had
done so, and 61% had done so in the preceding six months. Such common use of
public locations presents public health implications for the disposal of the needles
used by these IDU, many of which would presumably be left at the injection scene.

30
be assumed that many who do so will drive after intoxication.
oxicological data from intoxicated drivers from whom blood samples were taken by
any people
re travelling by train to obtain drugs, and inject on the train soon after. The major
ur in
is area are of IDU that reside outside south western Sydney altogether17.
jecting in public locations was not only prevalent, but occurred frequently. A half of
receding six
The most common place to inject, other than in a home, was in a car. This is of
concern, as it can
T
police after being stopped for dangerous driving is illustrative of this point23.
Morphine, the metabolite of heroin, was detected in 31% of those in whom drugs
were detected. Clearly the association between driving and heroin use is cause for
concern. It should be noted that 4% of fatal heroin overdoses that occurred in NSW
between 1992 and 1996 were located in cars16.
Surprisingly, over a half of the sample had injected in a train, and a third had done so
in the preceding six months. One of the likely reasons for this is that m
a
drug markets in Sydney are on train lines. The largest heroin market is located in
Cabramatta, in outer south western Sydney, to which IDU travel from all areas of
Sydney and beyond to obtain heroin. Consistent with the wide geographic appeal to
IDU of this market is the fact that over a half of heroin overdose deaths that occ
th
While public injecting was common, the initial injecting was likely to occur in a home
environment. Three quarters of subjects had their initial injection in either their own
home or that of an acquaintance (in some cases a dealer). However, when the most
recent injection was examined, only a half had done so in a home environment.
In
the sample had injected frequently in at least one public location in the p
months. A quarter of the sample reported having often injected in the street in the
preceding six months. The concerns raised above about injecting in cars is further
emphasised by the fact that 22% of the sample reported often injecting in cars in the
preceding six months.
4.7 Factors and harms associated with frequent public injecting

31
hile common in both sexes, males were significantly more likely to report frequent
months, and to have more current
jection-related problems. In terms of drug use, public injectors had injected more
aving a greater number of injection-related problems were independently
ssociated with frequent public injections.
, the
ircumstances of injecting in public locations provide clues as to why more harms
h ion in a public location, with the accompanying
he current study demonstrates that where a person injects is important, both in
W
injections in public locations (60% v 41%). There were clear harms associated with
public injecting. Frequent street injectors were more likely to have experienced a
heroin overdose in the preceding six
in
drug classes and used more injection sites in the preceding six months. The overall
picture is of a riskier sub-group of IDU.
The logistic regression indicated that, after taking into account other variables, being
male and h
a
The results of this study are consistent with those reported by Klee and Morris15
among British IDU. Klee also reported that street injectors were more likely to be
male, to have overdosed and have more vascular problems than other IDU. Thus,
the patterns of harm associated with public injecting were almost identical in two
geographically remote locations.
While public injectors may be characterised as a risky IDU sub-group
c
attac to such behaviours. An inject
risk of detection, would be performed in a hurried manner. Users would have to
locate a vein and inject as quickly as possible, there being no time for "best practice"
injecting. Health problems would thus be expected, both from the rapid nature of
the process, and the risk of infection from the environment. The rapid nature of the
injection might also increase the risk of an overdose, as a larger bolus effect may be
experienced.
4.8 Summary and conclusions
T
terms of body sites and geographical locations. The importance of location is
illustrated by the findings that poorer vascular health was associated both with

32
females, with a clear career progression to the use of more
dangerous sites. Similarly, the use of public locations for injecting, particularly by
males, was almost universal.
The current study illustrates the importance of examining needle use behaviours
beyond those related to the spread of blood borne viruses. By focusing upon needle
sharing, the extent of needle-related problems is greatly underestimated. This study
has shown this to be true both for the physical and geographical locations of
injections. If the harms associated with injecting are to be further addressed,
attention needs to be given to where IDU inject.
multiple bodily injection sites, and with frequent public injecting. The risks of such
behaviours were demonstrated by the large proportion of IDU with injection-related
problems. The study found multiple site injecting to be common among IDU,
particularly among

33
.
ss).
352.
0-415.
entre).
45-647.
5.0 REFERENCES
1. CHERUBIN, C.E. (1967) The medical sequelae of narcotic addiction. Annals
of Internal Medicine, 67, 23-32
2. HAVERKOS, H.W. & LANGE, R. (1990) Serous infections other than Human
Immunodeficiency Virus among intravenous drug users. Journal of Infectious
Diseases, 161, 894-902.
3. LEVINE, D.P. (1991) Skin and soft tissue infections in intravenous drug users.
In LEVINE, D.P. & SOBELL, J.D. Infections in intravenous drug users (New
York: Oxford University Pre
4. MORRISON, A., ELLIOTT, L. & GRUER, L. (1997) Injecting-related harm and
treatment-seeking behaviour among injecting drug users. Addiction, 92,
1349-1
5. OSTOR, A.G. (1977) The medical complications of narcotic addiction I.
Medical Journal of Australia, 1, 41
6. NATIONAL ADDICTION CENTRE (1998) Overdose and Comorbidity Among
Injecting Drug Users. A study of Injecting Practice and the Extent of Negative
Consequences Among a Community-Recruited Sample of London Drug
Injectors (London: National Addiction C
7. DARKE, S., ROSS, J. & HALL, W. (1995) Benzodiazepine use among
injecting heroin users. Medical Journal of Australia, 162, 6
8. DARKE, S., ROSS, J. & HALL, W. (1996) The injection of methadone syrup in
Sydney, Australia. Drug and Alcohol Dependence, 43, 191-198.

34
3-1375.
423.
13. n a group of
injecting drug users, British Journal of Addiction, 87, 1387-1392.
14.
h injection marks found. International Journal
of Legal Medicine, 104, 299-301.
15.
ioid users: The Opiate Treatment Index.
British Journal of Addiction, 87, 593-602.
6. SPSS inc. (1993) SPSS for Windows (SPSS inc: Chicago).
9. KLEE, H., FAUGIER, J., HAYES, C., BOULTON, T. & MORRIS, J. (1990)
AIDS-related risk behaviour, polydrug use and temazepam. British Journal of
Addiction, 85, 1125-1132.
10. ROSS, J., DARKE, S. & HALL, W. (1997) Transitions between routes of
benzodiazepine administration among heroin users in Sydney. Addiction, 92,
697-705.
11. STRANG, J., SEIVEWRIGHT, N. & FARRELL, M. (1992) Intravenous and
other abuses of benzodiazepines: The opening of Pandora's box? British
Journal of Addiction, 87, 137
12. RALSTON, G.E & TAYLOR J.A. (1993) Temazepam abuse. Addiction, 88,
RUBEN, S.M. & MORRISON, C.L. (1992) Temazepam misuse i
JENSON, S. & GREGERSON, M. (1991) Fatal poisoning with intravenously
injected methadone and no fres
DARKE, S., HALL, W., HEATHER, N., WODAK, A., & WARD, J. (1992).
Development and validation of a multi-dimensional instrument for assessing
outcome of treatment among op
1
![injecting [ 2 ] › pdf › HRDVD5.pdf · when you stop injecting, things seldom return to normal. The information in this booklet aims to reduce the harms of injecting by helping](https://img.dokumen.tips/doc/110x75/5f0c9cd87e708231d4364591/injecting-2-a-pdf-a-hrdvd5pdf-when-you-stop-injecting-things-seldom.jpg)