Embed Size (px)
Citation preview
Effect of precursor concentrations on structural, microstructural and optical properties of
nanocrystalline ZnO powder synthesized by an ultrasonic atomization technique
This article has been downloaded from IOPscience. Please scroll down to see the full text article.
2010 Phys. Scr. 82 035601
(http://iopscience.iop.org/1402-4896/82/3/035601)
Download details:
IP Address: 117.200.169.218
The article was downloaded on 26/08/2010 at 11:23
Please note that terms and conditions apply.
View the table of contents for this issue, or go to the journal homepage for more
Home Search Collections Journals About Contact us My IOPscience
IOP PUBLISHING PHYSICA SCRIPTA
Phys. Scr. 82 (2010) 035601 (6pp) doi:10.1088/0031-8949/82/03/035601
Effect of precursor concentrations onstructural, microstructural andoptical properties of nanocrystallineZnO powder synthesized by an ultrasonicatomization technique
L A Patil1, A R Bari1, M D Shinde1, Vinita Deo1 and M P Kaushik2
1 Nanomaterials Research Laboratory, Department of Physics, Pratap College, Amalner 425 401, India2 Defence Research and Development Establishment, Gwalior 474 002, India
E-mail: plalachand phy [email protected]
Received 4 December 2010Accepted for publication 19 July 2010Published 25 August 2010Online at stacks.iop.org/PhysScr/82/035601
AbstractIn this paper, we report on the effect of concentration on nanocrystalline ZnO powder preparedby an ultrasonic atomization technique, which is a promising method because of its simplicity,inexpensiveness and safety. The morphology and size of ZnO nanocrystallites associated withnanopowder were characterized by transmission electron microscopy (TEM). It revealed thatthe powder consisted of nanocrystallites with grain sizes between 8 and 15 nm. These valuesmatch the grain sizes (8–14 nm) calculated from x-ray diffraction (XRD). The XRD and TEMstudies of ZnO nanopowder showed that crystallite sizes were observed to increase with anincrease in the concentration of solution. The d values calculated from electron diffractionpatterns (TEM) of ZnO nanopowder were also in agreement with the d values calculated fromXRD. The synthesized nanopowders exhibited a direct band gap (Eg) in the range of3.36–3.42 eV.
PACS numbers: 68.37, 78.40.−q, 81.07.Bc, 81.07.Wx
(Some figures in this article are in colour only in the electronic version.)
1. Introduction
Nanostructured materials of nanometre-sized (1–100 nm)particles are particularly interesting for applicationsin advanced materials that require high reactivity, lowsuper-plasticity and unusual electro-optical properties [1].Zinc oxide is a wide band gap semiconductor with a bandgap of 3.37 eV and a large binding energy of 60 meV. Itis an important semiconductor material, having a widerange of applications such as gas sensors [2–4], luminescentdevices [5, 6], solar cells [7], chemical sensors [8] andelectrical devices. Recently, nanocrystalline ZnO gassensors [9, 10] have attracted more interest due to their
relatively better properties of detecting pollutants, toxicgases, alcohol and food freshness [11, 12].
A variety of techniques have been used to prepare ZnOnanostructures such as sol–gel [13, 14], spray pyrolysis [15],dc magnetron sputtering [16] and metal organic chemicalvapour deposition [17]. Nanostructured ZnO has manyapplications in the industrial arena; hence the preparationof nanostructured ZnO powder is an important issue.Different methods for the preparation of ZnO powder havebeen investigated before [18]. Mechanochemical processing,sonochemical processing, microemulsion, precipitation route,etc are some of them. However, these methods are noteconomically feasible for application in a nanopowder
0031-8949/10/035601+06$30.00 Printed in the UK & the USA 1 © 2010 The Royal Swedish Academy of Sciences
Phys. Scr. 82 (2010) 035601 L A Patil et al
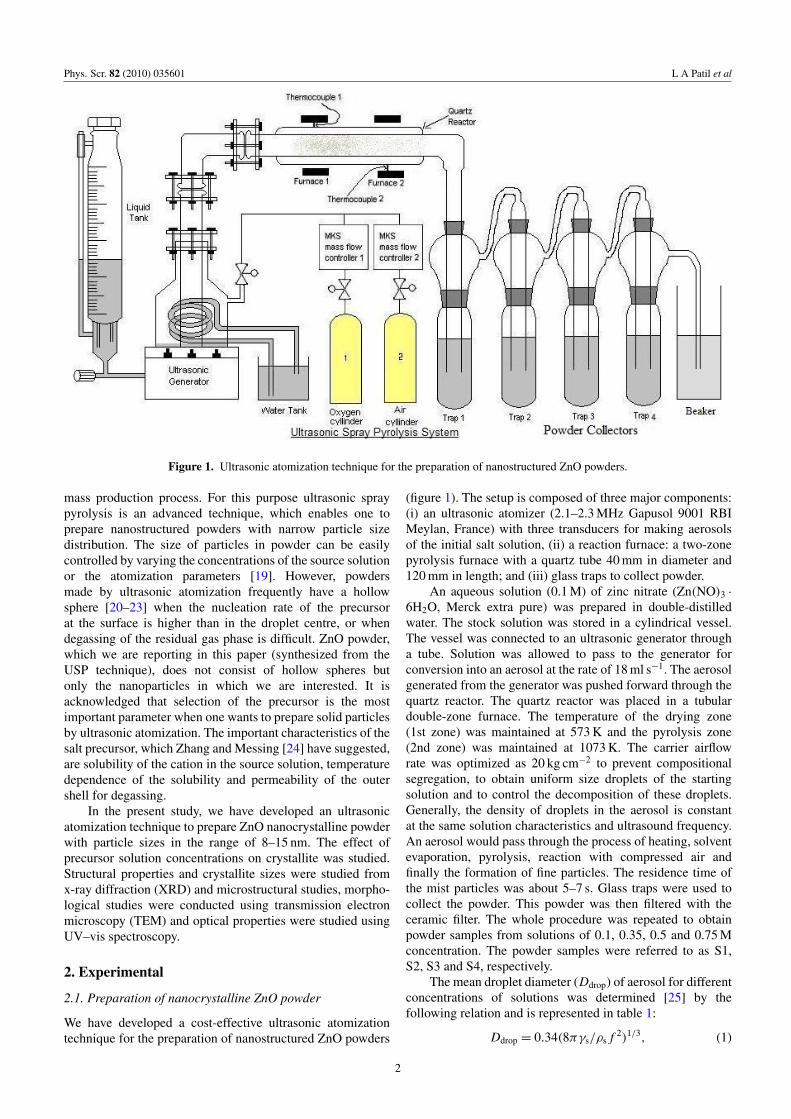
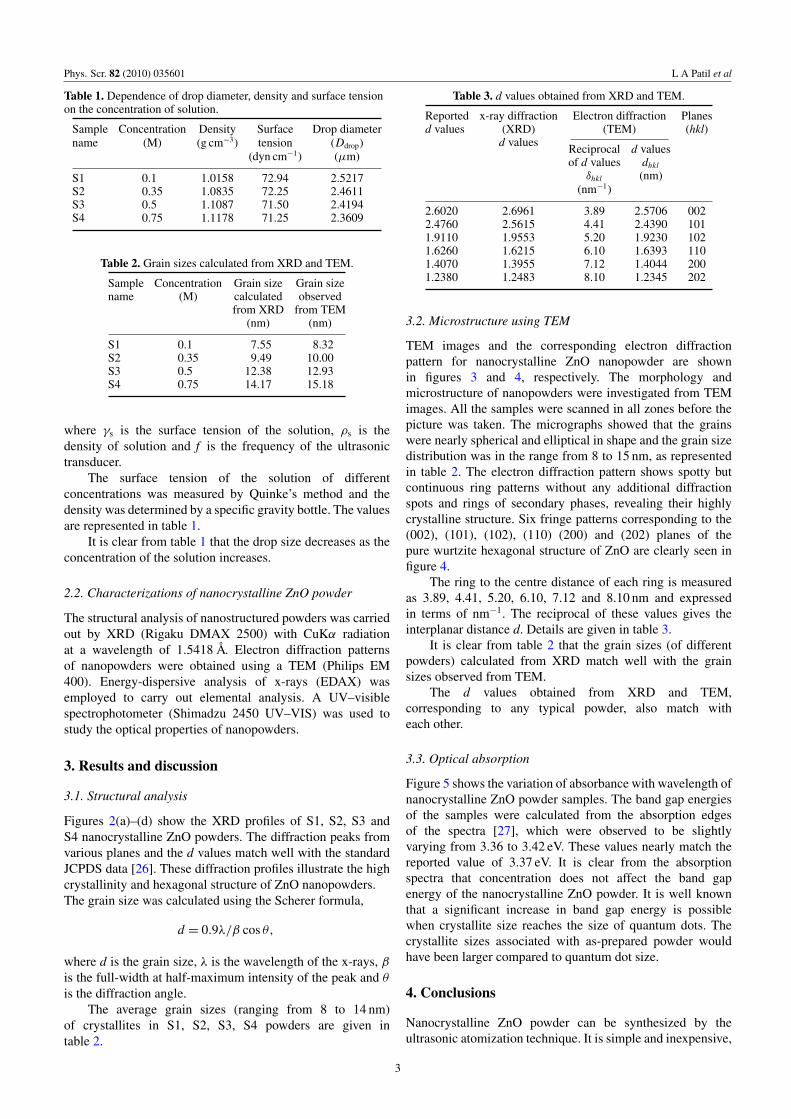
Figure 1. Ultrasonic atomization technique for the preparation of nanostructured ZnO powders.
mass production process. For this purpose ultrasonic spraypyrolysis is an advanced technique, which enables one toprepare nanostructured powders with narrow particle sizedistribution. The size of particles in powder can be easilycontrolled by varying the concentrations of the source solutionor the atomization parameters [19]. However, powdersmade by ultrasonic atomization frequently have a hollowsphere [20–23] when the nucleation rate of the precursorat the surface is higher than in the droplet centre, or whendegassing of the residual gas phase is difficult. ZnO powder,which we are reporting in this paper (synthesized from theUSP technique), does not consist of hollow spheres butonly the nanoparticles in which we are interested. It isacknowledged that selection of the precursor is the mostimportant parameter when one wants to prepare solid particlesby ultrasonic atomization. The important characteristics of thesalt precursor, which Zhang and Messing [24] have suggested,are solubility of the cation in the source solution, temperaturedependence of the solubility and permeability of the outershell for degassing.
In the present study, we have developed an ultrasonicatomization technique to prepare ZnO nanocrystalline powderwith particle sizes in the range of 8–15 nm. The effect ofprecursor solution concentrations on crystallite was studied.Structural properties and crystallite sizes were studied fromx-ray diffraction (XRD) and microstructural studies, morpho-logical studies were conducted using transmission electronmicroscopy (TEM) and optical properties were studied usingUV–vis spectroscopy.
2. Experimental
2.1. Preparation of nanocrystalline ZnO powder
We have developed a cost-effective ultrasonic atomizationtechnique for the preparation of nanostructured ZnO powders
(figure 1). The setup is composed of three major components:(i) an ultrasonic atomizer (2.1–2.3 MHz Gapusol 9001 RBIMeylan, France) with three transducers for making aerosolsof the initial salt solution, (ii) a reaction furnace: a two-zonepyrolysis furnace with a quartz tube 40 mm in diameter and120 mm in length; and (iii) glass traps to collect powder.
An aqueous solution (0.1 M) of zinc nitrate (Zn(NO)3 ·
6H2O, Merck extra pure) was prepared in double-distilledwater. The stock solution was stored in a cylindrical vessel.The vessel was connected to an ultrasonic generator througha tube. Solution was allowed to pass to the generator forconversion into an aerosol at the rate of 18 ml s−1. The aerosolgenerated from the generator was pushed forward through thequartz reactor. The quartz reactor was placed in a tubulardouble-zone furnace. The temperature of the drying zone(1st zone) was maintained at 573 K and the pyrolysis zone(2nd zone) was maintained at 1073 K. The carrier airflowrate was optimized as 20 kg cm−2 to prevent compositionalsegregation, to obtain uniform size droplets of the startingsolution and to control the decomposition of these droplets.Generally, the density of droplets in the aerosol is constantat the same solution characteristics and ultrasound frequency.An aerosol would pass through the process of heating, solventevaporation, pyrolysis, reaction with compressed air andfinally the formation of fine particles. The residence time ofthe mist particles was about 5–7 s. Glass traps were used tocollect the powder. This powder was then filtered with theceramic filter. The whole procedure was repeated to obtainpowder samples from solutions of 0.1, 0.35, 0.5 and 0.75 Mconcentration. The powder samples were referred to as S1,S2, S3 and S4, respectively.
The mean droplet diameter (Ddrop) of aerosol for differentconcentrations of solutions was determined [25] by thefollowing relation and is represented in table 1:
Ddrop = 0.34(8πγs/ρs f 2)1/3, (1)
2
Phys. Scr. 82 (2010) 035601 L A Patil et al
Table 1. Dependence of drop diameter, density and surface tensionon the concentration of solution.
Sample Concentration Density Surface Drop diametername (M) (g cm−3) tension (Ddrop)
(dyn cm−1) (µm)
S1 0.1 1.0158 72.94 2.5217S2 0.35 1.0835 72.25 2.4611S3 0.5 1.1087 71.50 2.4194S4 0.75 1.1178 71.25 2.3609
Table 2. Grain sizes calculated from XRD and TEM.
Sample Concentration Grain size Grain sizename (M) calculated observed
from XRD from TEM(nm) (nm)
S1 0.1 7.55 8.32S2 0.35 9.49 10.00S3 0.5 12.38 12.93S4 0.75 14.17 15.18
where γs is the surface tension of the solution, ρs is thedensity of solution and f is the frequency of the ultrasonictransducer.
The surface tension of the solution of differentconcentrations was measured by Quinke’s method and thedensity was determined by a specific gravity bottle. The valuesare represented in table 1.
It is clear from table 1 that the drop size decreases as theconcentration of the solution increases.
2.2. Characterizations of nanocrystalline ZnO powder
The structural analysis of nanostructured powders was carriedout by XRD (Rigaku DMAX 2500) with CuKα radiationat a wavelength of 1.5418 Å. Electron diffraction patternsof nanopowders were obtained using a TEM (Philips EM400). Energy-dispersive analysis of x-rays (EDAX) wasemployed to carry out elemental analysis. A UV–visiblespectrophotometer (Shimadzu 2450 UV–VIS) was used tostudy the optical properties of nanopowders.
3. Results and discussion
3.1. Structural analysis
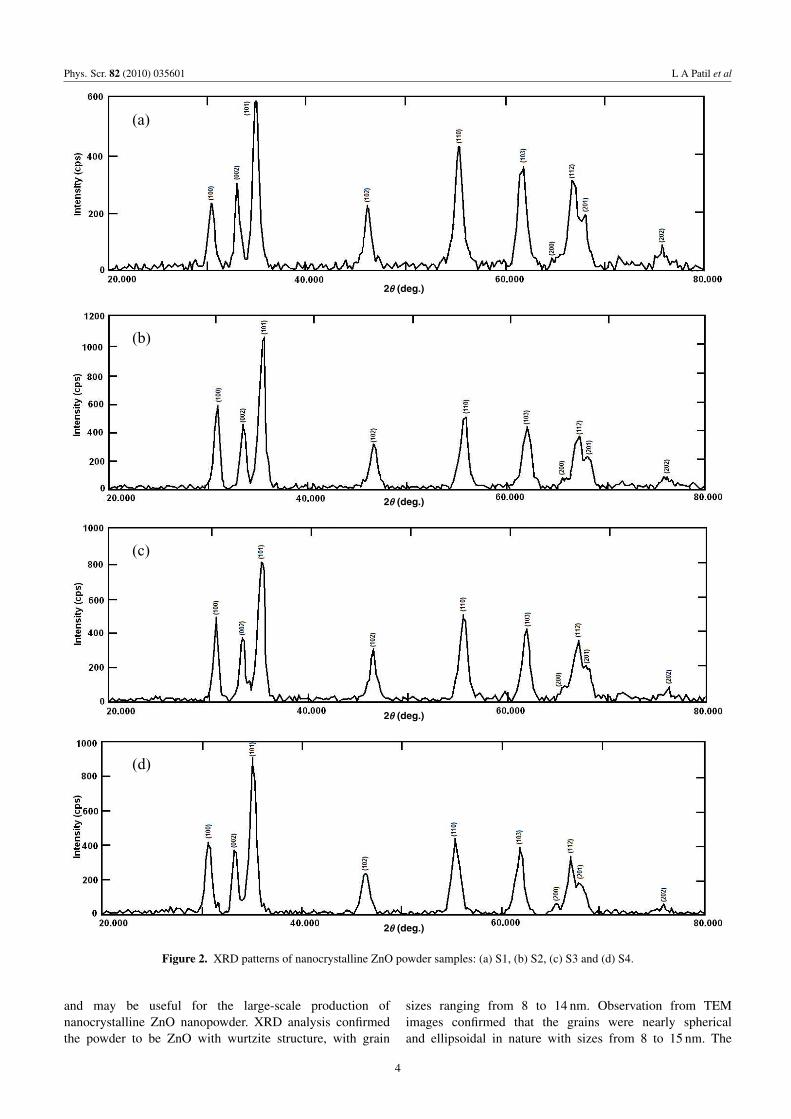
Figures 2(a)–(d) show the XRD profiles of S1, S2, S3 andS4 nanocrystalline ZnO powders. The diffraction peaks fromvarious planes and the d values match well with the standardJCPDS data [26]. These diffraction profiles illustrate the highcrystallinity and hexagonal structure of ZnO nanopowders.The grain size was calculated using the Scherer formula,
d = 0.9λ/β cos θ,
where d is the grain size, λ is the wavelength of the x-rays, β
is the full-width at half-maximum intensity of the peak and θ
is the diffraction angle.The average grain sizes (ranging from 8 to 14 nm)
of crystallites in S1, S2, S3, S4 powders are given intable 2.
Table 3. d values obtained from XRD and TEM.
Reported x-ray diffraction Electron diffraction Planesd values (XRD) (TEM) (hkl)
d valuesReciprocal d valuesof d values dhkl
δhkl (nm)(nm−1)
2.6020 2.6961 3.89 2.5706 0022.4760 2.5615 4.41 2.4390 1011.9110 1.9553 5.20 1.9230 1021.6260 1.6215 6.10 1.6393 1101.4070 1.3955 7.12 1.4044 2001.2380 1.2483 8.10 1.2345 202
3.2. Microstructure using TEM
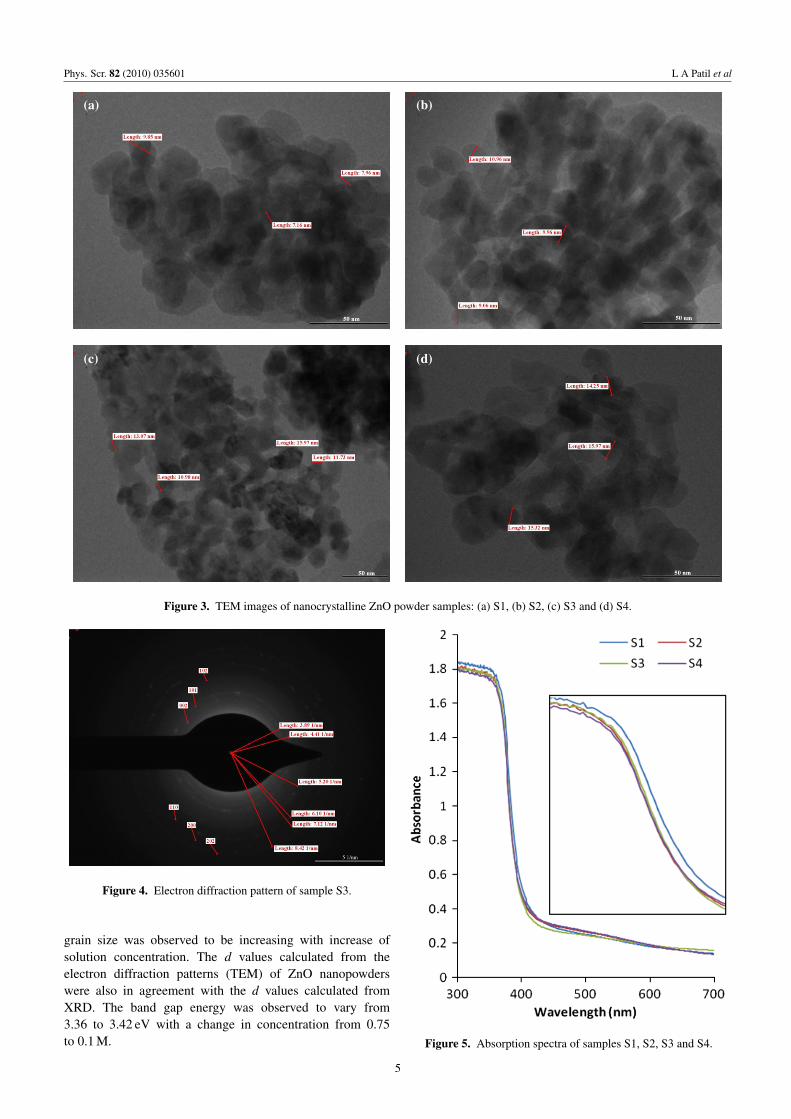
TEM images and the corresponding electron diffractionpattern for nanocrystalline ZnO nanopowder are shownin figures 3 and 4, respectively. The morphology andmicrostructure of nanopowders were investigated from TEMimages. All the samples were scanned in all zones before thepicture was taken. The micrographs showed that the grainswere nearly spherical and elliptical in shape and the grain sizedistribution was in the range from 8 to 15 nm, as representedin table 2. The electron diffraction pattern shows spotty butcontinuous ring patterns without any additional diffractionspots and rings of secondary phases, revealing their highlycrystalline structure. Six fringe patterns corresponding to the(002), (101), (102), (110) (200) and (202) planes of thepure wurtzite hexagonal structure of ZnO are clearly seen infigure 4.
The ring to the centre distance of each ring is measuredas 3.89, 4.41, 5.20, 6.10, 7.12 and 8.10 nm and expressedin terms of nm−1. The reciprocal of these values gives theinterplanar distance d. Details are given in table 3.
It is clear from table 2 that the grain sizes (of differentpowders) calculated from XRD match well with the grainsizes observed from TEM.
The d values obtained from XRD and TEM,corresponding to any typical powder, also match witheach other.
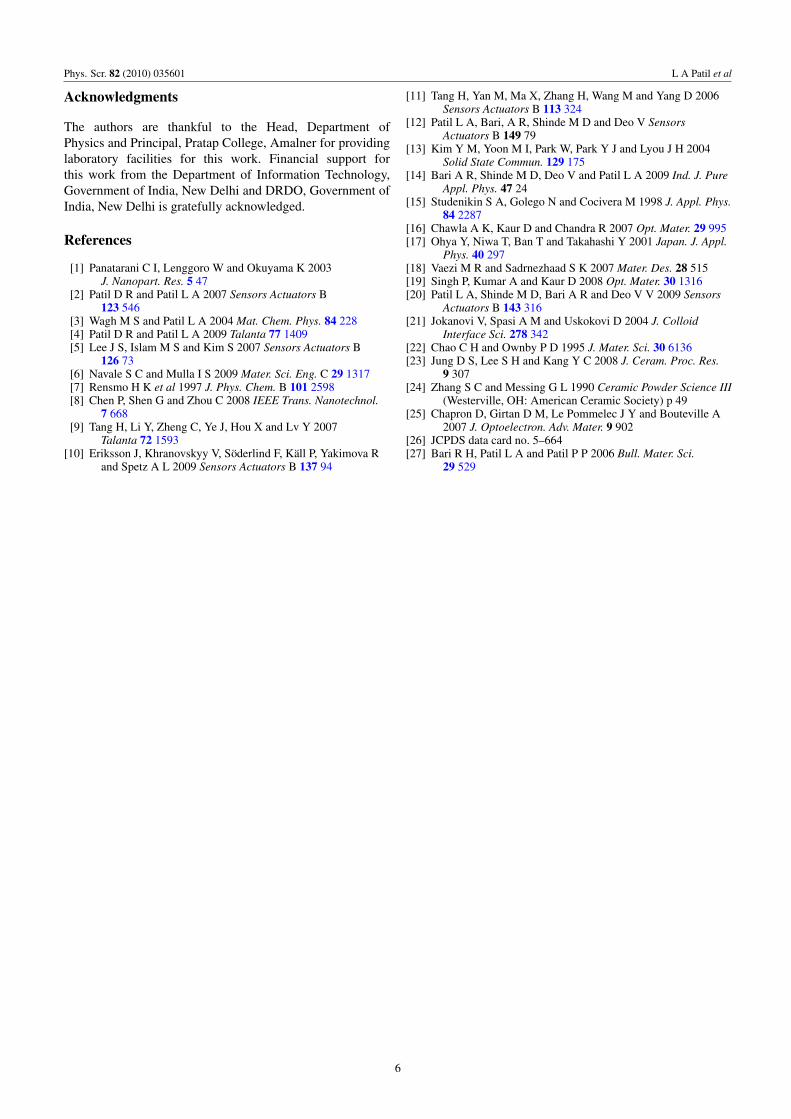
3.3. Optical absorption
Figure 5 shows the variation of absorbance with wavelength ofnanocrystalline ZnO powder samples. The band gap energiesof the samples were calculated from the absorption edgesof the spectra [27], which were observed to be slightlyvarying from 3.36 to 3.42 eV. These values nearly match thereported value of 3.37 eV. It is clear from the absorptionspectra that concentration does not affect the band gapenergy of the nanocrystalline ZnO powder. It is well knownthat a significant increase in band gap energy is possiblewhen crystallite size reaches the size of quantum dots. Thecrystallite sizes associated with as-prepared powder wouldhave been larger compared to quantum dot size.
4. Conclusions
Nanocrystalline ZnO powder can be synthesized by theultrasonic atomization technique. It is simple and inexpensive,
3
Phys. Scr. 82 (2010) 035601 L A Patil et al
(a)
(b)
(c)
(d)
2θ (deg.)
2θ (deg.)
2θ (deg.)
2θ (deg.)
Figure 2. XRD patterns of nanocrystalline ZnO powder samples: (a) S1, (b) S2, (c) S3 and (d) S4.
and may be useful for the large-scale production ofnanocrystalline ZnO nanopowder. XRD analysis confirmedthe powder to be ZnO with wurtzite structure, with grain
sizes ranging from 8 to 14 nm. Observation from TEMimages confirmed that the grains were nearly sphericaland ellipsoidal in nature with sizes from 8 to 15 nm. The
4
Phys. Scr. 82 (2010) 035601 L A Patil et al
(a) (b)
(c) (d)
Figure 3. TEM images of nanocrystalline ZnO powder samples: (a) S1, (b) S2, (c) S3 and (d) S4.
Figure 4. Electron diffraction pattern of sample S3.
grain size was observed to be increasing with increase ofsolution concentration. The d values calculated from theelectron diffraction patterns (TEM) of ZnO nanopowderswere also in agreement with the d values calculated fromXRD. The band gap energy was observed to vary from3.36 to 3.42 eV with a change in concentration from 0.75to 0.1 M. Figure 5. Absorption spectra of samples S1, S2, S3 and S4.
5
Phys. Scr. 82 (2010) 035601 L A Patil et al
Acknowledgments
The authors are thankful to the Head, Department ofPhysics and Principal, Pratap College, Amalner for providinglaboratory facilities for this work. Financial support forthis work from the Department of Information Technology,Government of India, New Delhi and DRDO, Government ofIndia, New Delhi is gratefully acknowledged.
References
[1] Panatarani C I, Lenggoro W and Okuyama K 2003J. Nanopart. Res. 5 47
[2] Patil D R and Patil L A 2007 Sensors Actuators B123 546
[3] Wagh M S and Patil L A 2004 Mat. Chem. Phys. 84 228[4] Patil D R and Patil L A 2009 Talanta 77 1409[5] Lee J S, Islam M S and Kim S 2007 Sensors Actuators B
126 73[6] Navale S C and Mulla I S 2009 Mater. Sci. Eng. C 29 1317[7] Rensmo H K et al 1997 J. Phys. Chem. B 101 2598[8] Chen P, Shen G and Zhou C 2008 IEEE Trans. Nanotechnol.
7 668[9] Tang H, Li Y, Zheng C, Ye J, Hou X and Lv Y 2007
Talanta 72 1593[10] Eriksson J, Khranovskyy V, Söderlind F, Käll P, Yakimova R
and Spetz A L 2009 Sensors Actuators B 137 94
[11] Tang H, Yan M, Ma X, Zhang H, Wang M and Yang D 2006Sensors Actuators B 113 324
[12] Patil L A, Bari, A R, Shinde M D and Deo V SensorsActuators B 149 79
[13] Kim Y M, Yoon M I, Park W, Park Y J and Lyou J H 2004Solid State Commun. 129 175
[14] Bari A R, Shinde M D, Deo V and Patil L A 2009 Ind. J. PureAppl. Phys. 47 24
[15] Studenikin S A, Golego N and Cocivera M 1998 J. Appl. Phys.84 2287
[16] Chawla A K, Kaur D and Chandra R 2007 Opt. Mater. 29 995[17] Ohya Y, Niwa T, Ban T and Takahashi Y 2001 Japan. J. Appl.
Phys. 40 297[18] Vaezi M R and Sadrnezhaad S K 2007 Mater. Des. 28 515[19] Singh P, Kumar A and Kaur D 2008 Opt. Mater. 30 1316[20] Patil L A, Shinde M D, Bari A R and Deo V V 2009 Sensors
Actuators B 143 316[21] Jokanovi V, Spasi A M and Uskokovi D 2004 J. Colloid
Interface Sci. 278 342[22] Chao C H and Ownby P D 1995 J. Mater. Sci. 30 6136[23] Jung D S, Lee S H and Kang Y C 2008 J. Ceram. Proc. Res.
9 307[24] Zhang S C and Messing G L 1990 Ceramic Powder Science III
(Westerville, OH: American Ceramic Society) p 49[25] Chapron D, Girtan D M, Le Pommelec J Y and Bouteville A
2007 J. Optoelectron. Adv. Mater. 9 902[26] JCPDS data card no. 5–664[27] Bari R H, Patil L A and Patil P P 2006 Bull. Mater. Sci.
29 529
6