Embed Size (px)
Citation preview

ORIGINAL RESEARCHpublished: 21 November 2017doi: 10.3389/fpls.2017.01989
Frontiers in Plant Science | www.frontiersin.org 1 November 2017 | Volume 8 | Article 1989
Edited by:
Daniel Pinero,
Universidad Nacional Autónoma de
México, Mexico
Reviewed by:
Andrea Zuccolo,
Sant’Anna School of Advanced
Studies, Italy
Hang Sun,
Kunming Institute of Botany (CAS),
China
*Correspondence:
Xiaoming Pang
†These authors have contributed
equally to this work.
Specialty section:
This article was submitted to
Plant Genetics and Genomics,
a section of the journal
Frontiers in Plant Science
Received: 30 March 2017
Accepted: 06 November 2017
Published: 21 November 2017
Citation:
Wang Z, Zeng Y, Zhang Z, Sheng S,
Tian J, Wu R and Pang X (2017)
Phylogeography Study of the Siberian
Apricot (Prunus sibirica L.) in Northern
China Assessed by Chloroplast
Microsatellite and DNA Makers.
Front. Plant Sci. 8:1989.
doi: 10.3389/fpls.2017.01989
Phylogeography Study of theSiberian Apricot (Prunus sibirica L.)in Northern China Assessed byChloroplast Microsatellite and DNAMakersZhe Wang 1, 2†, Yanfei Zeng 3†, Zhendong Zhang 1, Songbai Sheng 1, Ju Tian 4, Rongling Wu 2
and Xiaoming Pang 1*
1 Beijing Advanced Innovation Center for Tree Breeding by Molecular Design, National Engineering Laboratory for Tree
Breeding, Key Laboratory of Genetics and Breeding in Forest Trees and Ornamental Plants, Ministry of Education, College of
Biological Sciences and Biotechnology, Beijing Forestry University, Beijing, China, 2Center for Computational Biology, College
of Biological Sciences and Biotechnology, Beijing Forestry University, Beijing, China, 3 State Key Laboratory of Tree Genetics
and Breeding, Chinese Academy of Forestry, Beijing, China, 4 Inner Mongolia Hesheng Ecological Science and Technology
Research Institute, Huhhot, China
There is evidence that a band of dry climate separated plants in East Asia into distinctnorthern and southern groups. However, few studies have focused on the arid beltin this region, especially with regard to plants. We analyzed genetic variation in 22populations of Siberian apricot (Prunus sibirica L.), a temperate deciduous speciesdistributed in this arid belt, using two chloroplast DNA (cpDNA) sequences, sevenchloroplast microsatellite loci (cpSSRs), and 31 nuclear microsatellite loci (nSSRs), tostudy its phylogeography. Chloroplast data showed the complete fixation of two differentgenetic groups: the eastern and western groups. Genetic differentiation between the twogroups was significant (FST = 0.90925, p < 0.01). This pronounced phylogeographicbreak was also indicated by nSSR data, but there were disparities regarding individualpopulations. An asymmetric gene flow via pollen and seeds likely resulted in discordancebetween the present-day geography of nuclear and chloroplast lineages. There was adistinct boundary between the two large groups, which were fixed for two of the mostancestral chlorotypes. Two populations with the highest chloroplast genetic diversity werelocated in the Yanshan Mountains and Jinzhou, considered to be the glacial refugia.The split of chloroplasts between the eastern and western groups was estimated tohave occurred∼0.1795Ma, whereas nuclear divergence occurred approximately 13,260years ago. Linear regression analysis showed that climatic factors (annual precipitationand annual mean temperature) had a significant correlation with mean ancestry value(P < 0.05) indicated that they were potential factors for the formation of the two groups.In addition, this boundary was a contact zone between two groups from different refugia.
Keywords: cpDNA, cpSSR, glacial refugia, Northern China, phylogeography, Prunus sibirica

Wang et al. Phylogeography of the Siberian Apricot
INTRODUCTION
Phylogeographic studies have been used to investigate the effectsof past climatic changes on the genetic structure of plant species,and allow inferences to be made about species evolution. Thedistribution ranges of plants and the genetic diversity withinand among present-day populations of such organisms in theNorthern Hemisphere have been affected deeply by climaticchanges over the last 2 million years (Hewitt, 2000). It has longbeen thought that East Asia was an important mass refugiumduring climatic fluctuations over recent millions of years (Liu,1988). Indeed, East Asia has recently been suggested to havebeen divided into distinct northern (northeast China, Japan, andKorea) and southern (southeastern and southern China) regions(Manos and Stanford, 2001; Milne and Abbott, 2002; Milne,2006).
Instead of a physical barrier (mountains, ocean), an east-westarid belt which was between 35 and 45◦N, has been thoughtto act as a climate barrier between the two regions (Tiffneyand Manchester, 2001). This climate barrier has been subject todynamic changes, which decreased and increased over geologicaltime (Tiffney and Manchester, 2001; Guo et al., 2008). Baiet al. (2016) reported that the climate barrier in northern Chinapersists today and acts as a divide. However, few studies havefocused on the arid belt, and especially the plants in this region.The climate barrier was actually located at the intersection of thetwo regions, and evolution of species in this area, especially innorthern China, would be expected to be more complex than thatin the two regions.
Northern China is an appropriate area for assessing theeffects of climate change on plant evolution. It is a botanicallydiverse region which is rich in both total species numbersand proportions of endemic species and underwent majorclimatic and geological changes during the last glacial maximum(LGM). Northern China (including north and northeast China)is covered with diverse plant biomes that range from tropicalto cold forests and taiga (Gao et al., 2002). This region wasconsidered to be an important part of the south-north vegetationtransect in China, and palaeovegetation research has shown thatit was subject to past climatic oscillations (Yu et al., 2000). Thus,northern China may serve as a model region for studying themigration of tree species during the LGM.
In Europe and North America, the locations of glacial refugiaand postglacial migration routes of many plants and animalshave been determined from a combination of fossil and geneticevidence (Huntley and Birks, 1983; Webb and Bartlein, 1992;Taberlet et al., 1998; Abbott et al., 2000). Qian and Ricklefs(2000) suggested that multiple refugia for forests might haveexisted and allowed species to persist across northern Chinaduring the LGM. Recently, there is increasingmolecular evidencethat supports this hypothesis. The phylogeographical patternsof conifer species (Chen et al., 2008) and temperate deciduousspecies (Tian et al., 2009) were examined and all of them weredivided into different lineages, showing that multiple refugiawere maintained in northern China. However, only a singleglacial refugium, thought to have been located in the ChangbaiMountains, is generally acknowledged (reviewed in Qiu et al.,
2011). In addition to “traditional” refugia, small “cryptic” refugiaor “microrefugia” might also have been widespread in northernChina (Zeng et al., 2015). Bai et al. (2016) used Asian butternuts(Juglans section Cardiocaryon), covering the whole range of EastAsia, to study the role of the climate barrier in diversification.Both nuclear and chloroplast data showed that the YanshanMountains contained a dividing line, separating the northeastand southwest lineages. Similar results have been describedin other species, such as, walnut (Juglans mandshurica, Baiet al., 2010), Chinese oaks (Quercus mongolica, and Quercusliaotungensis, Zeng et al., 2011), and mono maple (Acer mono,Liu et al., 2014). However, the species studied are distributedprimarily across the whole of East Asia.
Natural forests in the arid belt are dominated by broadleafdeciduous trees; the Siberian apricot (Prunus sibirica L.) is oneof them. This temperate, deciduous, and wind-pollinated speciesis distributed widely across the mountainous areas of north andnortheast China. It can also be found in eastern Siberia andMongolia (Maynard, 1999). Siberian apricot trees are shrubsor high arbor. The height of the tree will be up to 5m inthe eastern coastal areas where the rain is plenty, but in inthe west arid region it is only a few tens of centimeter. Theseed kernels can be processed for biodiesel (Wang, 2012) andprotein drinks (Sze-Tao and Sathe, 2000) and were also used totreat asthma, coughs, and infant virus pneumonia in traditionalChinese medicine. Moreover, Siberian apricot trees have oftenbeen used for afforestation in north China (Zhang et al., 2006).Although the Siberian apricot seeds are quite profitable, thecommercial cultivar has been lacking and most of Siberianapricot seeds were collected from the wild Siberian apricot.Wild species play crucial roles in breeding programs because oftheir wide variability in terms of phonological, morphological,abiotic, and quality traits (Laidò et al., 2013). Siberian apricotis able to thrive under many types of harsh environmentalconditions such as, low temperature, strong wind, low rainfall,and poor soil. During long-term evolution, the wild Siberianapricot populations generated a large number of variations.Vavilov (1992) suggested that the apricot had originated fromthree important centers: the Chinese, the Central Asian, andthe Asia Minor centers. The Chinese center of origin may bethe actual one for the Siberian apricot (Maynard, 1999). Usingdominant inter-simple sequence repeat (ISSR), sequence-relatedamplified polymorphism (SRAP), and nuclear simple sequencerepeat (nSSR) markers, Li et al. (2013) reported a relativelyhigh level of genetic diversity, a low level of inter-populationgenetic differentiation, and a high level of intra-populationgenetic differentiation in this species. Moreover, a STRUCTUREanalysis indicated that all Siberian apricot populations couldbe divided into two main groups. However, in our previousstudy, we clustered Siberian apricot populations into four clusters(Wang et al., 2014). There was a clear boundary between easternand western clusters. Due to the limitations of the molecularmarker system used, such information may be incomplete.Consequently, additional studies based on other marker systemsand re-clustering may help to better reveal the “real” patternof the population structure in this species. This also requires amore detailed study of individual clades in a robust phylogenetic
Frontiers in Plant Science | www.frontiersin.org 2 November 2017 | Volume 8 | Article 1989

Wang et al. Phylogeography of the Siberian Apricot
framework and amore direct estimation of divergence times withaccurate age estimation methods.
Generally, seed dispersal distance is much less than that ofpollen, and population divergence due to genetic drift will bemore marked for chloroplast DNA (cpDNA) than for nuclearDNA (Ennos, 1994). Indeed, cpDNA is considered to evolvevery slowly, with low recombination and mutation rates (Wolfeet al., 1987; Clegg and Zurawski, 1992). Organelle markers couldprovide powerful tools for studying the phylogeography andmigratory footprints of species (Avise, 2000).
In this study, we re-ran the STRUCTURE analysis usingnSSR data we obtained, and used a set of chloroplast simplesequence repeats (cpSSRs) and cpDNA sequences to analyzeSiberian apricot populations in China. The major aims of thisstudy were to address the following questions: (1) How didnuclear DNA and cpDNA lineages of Siberian apricot distribute?(2) Does the Siberian apricot show any concordance between thegeographical distribution of cpDNA and nuclear DNA lineages?(3) Did refugia exist in the Siberian apricot distribution regions?(4) What is the potential factor(s) of the formation of differentlineages?
MATERIALS AND METHODS
SamplesIn total, 672 Siberian apricot individuals were collected from 22populations covering the entire range of the natural distributionin China (Wang et al., 2014). For convenience of description, thenumbers of populations were changed (Figure 1; SupplementaryTable 1). In total, 222 individuals (10–11 individuals in eachpopulation) were selected for chloroplast marker analysis.Among the populations, three were designated as “semi-wild-type” because the trees were artificially grown from seedscollected randomly from the immediate area or near theregion. The conditions and environment of growth of semi-wildpopulations were the same as wild populations. The phenotypesof the trees from semi-wild populations were very rich, and theresults of molecular experiments also showed that the geneticdiversity of the semi-wild populations was as high as that of thewild populations.
DNA ExtractionYoung leaves were collected and placed immediately in Ziplocbags preloaded with colored silica gel to dry and preserve themfor DNA extraction. Total genomic DNA was extracted from dryleaves using a modified version of the cetyl trimethylammoniumbromide method (Doyle, 1987). The quality and concentrationof the extracted DNA was determined by 1% agarose gelelectrophoresis and ultraviolet spectrophotometry.
cpSSR Amplification and GenotypingWe selected 19 cpSSR markers after an initial screening from40 candidate cpSSR markers (Bryan et al., 1999; Weising andGardner, 1999; Ohta et al., 2005; Cheng et al., 2006). Severalrepresentative amplicons of each allele were sequenced. Thevariation of some loci was not only due to the change in thenumber of repeats, but also related to indel in the flanking
regions. Finally, seven loci with variation just in motif numberwere chosen to assay 222 individuals of Siberian apricot. Theyare TPScp1, TPScp3, TPScp4, TPScp11 (Ohta et al., 2005),ccmp3 (Weising and Gardner, 1999), ARCP5 (Cheng et al.,2006), and NTCP8 (Bryan et al., 1999). The forward primerof each pair was tagged with a section of the universal M13sequence (5′-TGTAAAACGACGGCCAGT-3′) during synthesis.Amplification was performed in a 10-µL reaction mixturecontaining 1 µL of DNA template (10 ng/µL), 5 µL of 2 × Taqmix, 0.4 µL of the forward primer (1µM), 1.6 µL of the reverseprimer, 1.6 µL of M13 primer (1µM) with a fluorescent label(FAM, HEX, ROX, or TAMRA), and 1.4 µL of double distilledH2O. The reaction conditions were: 94◦C for 5min, followed by30 cycles of 94◦C for 30 s, Ta (annealing temperature) for 1min,and 72◦C for 1min, followed by 8 cycles of 94◦C for 30 s, 53◦Cfor 40 s, and 72◦C for 45 s, with a final synthesis step at 72◦C for10min. The products were separated with an ABI 3730XL DNAAnalyzer using GeneScan-500LIZ as an internal marker (AppliedBiosystems, Foster City, CA, USA). The fragments were sizedusing the Gene-Marker 1.75 software (SoftGenetics LLC, StateCollege, PA, USA).
cpDNA Amplification and SequencingUsing universal primers, we conducted an initial screening forsequence variability of various chloroplast markers against 15samples. The cpSSR haplotypes of the 15 samples were differentfrom each other based on the result of completed cpSSR analysis.The intergenic spacers (IGSs) of the following pairs of genes wereamplified using previously published primers: atpB-rbcL (Chianget al., 1998; Zhou et al., 2010), trnL-trnF (Taberlet et al., 1991),trnQ-rps16 (Shaw et al., 2007), accD-psaI, and rpl16F71-rpl16R15(Small et al., 1998). The sequencing result showed that primersatpB-rbcL and trnQ-rps16 were available and sequences of thefragments were polymorphic. Then we used them for a large-scale survey of haplotype variation. PCR was performed in a 50-µL volume, containing 20–50 ng of plant DNA, 25 µL of 2 ×
Taq mix, and each primer (2µM). Amplification was carried outunder the following conditions: 94◦C for 5min, followed by 35cycles of 94◦C for 1min, Tm for 1min, a 2-min extension at 72◦C,and a final synthesis step at 72◦C for 10min. PCR products werepurified using a TIANquick Midi Purification Kit following themanufacturer’s protocol (Tiangen). Purified PCR products weresequenced directly in both directions using the PCR primers onan ABI 3730XL DNA Analyzer (Applied Biosystems).
Chloroplast Data AnalysisSSR variants at each locus were combined into haplotypes.cpSSR haplotype variation within populations was calculatedwith the following population diversity indices: the number ofhaplotypes (N), the effective number of haplotypes (Ne), thenumber of private haplotypes (Np), Nei’s haplotype diversity (H),and the unbiased haplotype diversity (He) (Nei, 1987). Totalgenetic diversity HT, average within-population diversity HS,and two differentiation measures (GST, NST) were estimated forhaplotypes and compared via a test with 1,000 permutationsusing Permut 2.0 software (Pons and Petit, 1996).
Frontiers in Plant Science | www.frontiersin.org 3 November 2017 | Volume 8 | Article 1989

Wang et al. Phylogeography of the Siberian Apricot
FIGURE 1 | Map showing the locations of sampled populations, median-joining haplotype network and geographic distributions of the 21 chlorotypes found in theSiberian apricot. Population labels with different colors correspond to two genetic clusters identified by the program STRUCTURE: red, northern group; black,northeastern group. The dotted line is the boundary between the eastern and western groups. Circle sizes are proportional to the number of samples per chlorotype.
The atpB-rbcL and trnQ-rps16 sequences were combined intoa complete sequence. Multiple alignments were performed withthe ClustalX program (Thompson et al., 1997) and manuallyadjusted with BioEdit (ver. 7.0.4.1) software (Hall, 1999). Indelswere generally placed so as to increase the number of matchingnucleotides in a sequence position. Nucleotide diversity (Pi) (Nei,1987) and haplotype diversity (Hd) (Nei and Tajima, 1983) werecalculated using the DNA Sequence Polymorphism program(DnaSP) (Rozas et al., 2003). HT, HS, and two differentiationmeasures (GST, NST) were estimated with the same parametersas cpSSR analysis. All populations were grouped by performingspatial analysis of molecular variance (SAMOVA) using theSAMOVA software (ver. 1.0) (Dupanloup et al., 2002) thatimplements a simulated annealing approach to define groupsof populations (K) that are geographically homogeneous andmaximally differentiated from each other. The value of K wasuser-defined and set between 2 and 12, with 100 independentsimulated annealing processes in each run. The maximum FCT-value, an indicator of genetic differentiation among populationgroups, was selected to identify the number of groups (K) forthe “best” grouping of populations. Then, the observed geneticvariation among and within the populations and groups was
characterized by an analysis of molecular variance (AMOVA)using ARLEQUIN (ver. 3.5) software (Hamrick and Godt,1996). Three hierarchical divisions were identified, based on thegenetic variance: within populations, among populations withingroups, and among groups using a non-parametric permutationprocedure incorporating 10,000 iterations.
BEAST (ver. 1.8.2) software were implemented to estimatephylogenetic relationships and divergence times between cpDNAhaplotypes (Drummond et al., 2012). The F81 nucleotidesubstitution model, selected with JModel Test (ver. 2.1.7)software (Darriba et al., 2012) was used. Given the lack offossil records and substitution rates for the Siberian apricot, weused the average substitution rates of 4.62 × 10⁻⁹ substitutionsper site per year (s s−1 y−1) reported for the angiospermspecies 1–8.24 × 10⁻⁹ s s−1 y−1 to estimate the timescale ofdivergence (Richardson et al., 2001). We sampled all parametersonce every 10,000 steps from 107 Markov-coupled Markov chain(MCMC) steps. A uniform prior probability distribution wasused to accommodate the uncertainty of the prior knowledge.We compared the outcomes of all five clock models with theYule speciation process by using the TRACER program (ver.1.6) (Rambaut and Drummond, 2007) with 1,000 bootstrap
Frontiers in Plant Science | www.frontiersin.org 4 November 2017 | Volume 8 | Article 1989

Wang et al. Phylogeography of the Siberian Apricot
replicates. The strict clock model was better fit than the otherswhich showed the lowest AICM value (Supplementary Table2). Trees were then compiled into a maximum clade credibilitytree using TREEANNOTATOR (ver. 1.8.2) (Drummond et al.,2012) and FIGTREE (ver. 1.4.2) (Rambaut, 2012) softwareto display mean node ages and highest posterior density(HPD) intervals at 95% (upper and lower) for each nodeand to estimate branch lengths and average divergence times.Historical demographic history of each clade was estimatedwith mismatch distributions analysis (MDA) (Rogers andHarpending, 1992) by using ARLEQUIN (ver. 3.5) softwarewith 10, 000 permutaions. This analysis compared the expectedfrequencies of pairwise differences in haplotypes with thoseobserved under a pure population growth model (Rogers andHarpending, 1992). A goodness of fit test was perform to assessthe observed and expetedmismatch distribution and quantify thesmoothness of the observed mismatch distribution based onthe sum of squares deviations (SSD) and the raggedness index,respectively.
According to the known expected size and repeat motifof each cpSSR marker, the fragment size of all cpSSR datawere transformed into sequences data. And both cpSSR andcpDNA are chloroplast markers, we spliced them into a mixedcpDNA sequence to complete the following analysis. HT, HS,GST, and NST were estimated with the same parameters asabove. To investigate relationships between haplotypes, weconstructed a phylogenetic network tree for mixed cpDNAsequences using the median-joining model, implemented inNetwork (ver. 4.6.1.3) software (Bandelt et al., 1999). Sitemutations and indels were assumed to evolve with equalprobability, although they may exhibit different mutation rateswhen constructing a median-joining network. Each indel wasconsidered to have originated independently. The SAMOVA andAMOVA analysis were performed with the same parameters asabove.
Nuclear SSR (nSSR) Data AnalysisIn this study, we used the correlated allele frequencies modeland the admixture model (Falush et al., 2003) to re-run theSTRUCTURE program (ver. 2.3.3) Pritchard et al., 2000) basedon the previous nSSR data with a more stringent parameter,which was 1,000,000 (in previous study was 100,000) Markovchain Monte Carlo repetitions after a burn-in period of 100,000(in previous study was 25,000) iterations. The algorithm wasrun 20 (in previous study was 10) times for each K-value,from 1 to 11. The estimate of the best K was calculated asdescribed by Evanno et al. (2005) using Structure Harvester(ver. 0.6.92) software (Earl and vonHoldt, 2012). The ClusteringMarkov Packager Across K (CLUMPAK, http://clumpak.tau.ac.il/index.html) program was used to simplify the comparison ofclustering results from the STRUCTURE programs across all 20repetitions of K and to determine the most likely number ofclusters.
An approximate Bayesian computation (ABC) approach wasused to infer the recent colonization history of the Siberianapricot. The STRUCTURE analysis revealed two clusters thatcorresponded to the western group (WG) and northeastern
group (EG). To determine which among several scenarios ofthe history of divergence of populations from these regions wasthe most probable, we used the ABC procedure in DIYABC(ver. 2.0.4) software (Cornuet et al., 2014). We consideredthree demographic scenarios or models. In scenario 1, weassumed the ancestral effective population size varied at t2,and WG and EG diverged simultaneously at t1. In scenario2, the ancestral effective population size varied at t2, and WGarose via divergence from the EG at t1. In scenario 3, theancestral effective population size varied at t2, and EG arosevia divergence from WG at t1 (Supplementary Figure 1). Weused the MIGRATE software (ver. 3.6.11) (Beerli, 2006) toassess whether there was asymmetrical gene flow between thegroups. The MIGRATE program (Beerli and Felsenstein, 1999)calculates maximum likelihood (ML) estimates for both effectivepopulation size and migration rates between pairs of populationsusing a coalescent approach. The program picked a randomsubset of individuals from the larger group, with the number ofindividuals in the subset being the same as in the smaller group.We relied on a maximum likelihood estimation and used threelong chains (1,000,000), replicates = YES: 5, and randomtree =YES. To identify whether climatic factors potentially associatedwith the genetic structure and divergence between two groups,annual precipitation and annual mean temperature of eachpopulation were analyzed by regression analysis with the meanancestry value of each populations, which were calculated bySTRUCTRURE when K = 2 using R (R Core Team, 2016). Themeteorological data were obtained from China MeteorologicalData Center (http://data.cma.cn/).
RESULTS
Chloroplast DataSeven perfect chloroplast microsatellite loci were used toassay 222 Siberian apricot individuals, resulting in 18 differentalleles. In total, 15 unique cpSSR haplotypes were produced bycombinations of the 18 different alleles. Details of the haplotypefrequency and population genetic diversity are provided inSupplementary Tables 3, 4. Total genetic diversity HT, averagewithin-population diversity HS were 0.760 and 0.189 respectively.A permutation test showed that GST (0. 751) was significantlysmaller than NST (0.860, P < 0.01).
The combined alignment of the two IGS (atpB-rbcL and trnQ-rps16) was 1,400 base pairs in length. Six nucleotide substitutionsand five indels were found in the combined fragment whichrevealed eight cpDNA haplotypes (Table 1). Overall nucleotidediversity (Pi) (Nei, 1987) and haplotype diversity were 0.00120± 0.00005 and 0.57400 ± 0.00062, respectively. Total geneticdiversity HT, average within-population diversity HS were 0.652and 0.090 respectively. NST (0.881) was not significant higherthan GST (0.862). Five populations were polymorphic while theremaining 17 were fixed for a single haplotype (SupplementaryTable 5). The analysis of spatial genetic structure for cpDNAvariation using SAMOVA showed that the value of FCT reacheda plateau at K = 6 (Supplementary Figure 2). The groupingpattern of populations corresponding toK = 6 was: (P9, P10, P11,P12, P14, P15, P16, P18, P19, P20, P21); (P1, P2, P4, P5, P6, P7);
Frontiers in Plant Science | www.frontiersin.org 5 November 2017 | Volume 8 | Article 1989

Wang et al. Phylogeography of the Siberian Apricot
TABLE 1 | Variable sites of mixed cpDNA sequences from 21 chlorotypes of Siberian apricot were identified.
Mutation
position
atpB–rbcL trnQ-rps16 cpSSR
167 474 509 519 627 944 945 946 947 948 1221 1408 1410 1412 1419 1429 1438 1439 1448 1449 1457 1473
H1 A G T T G T T T – A G T – – – T G – T T – –
H2 A G T T G T T T – T G – – – – T – – – – – –
H3 A G T T G T T T – A G – – – – T – – T T – –
H4 A G T T G T – – – A A – – – – T – – T T – –
H5 A G T T G T T T – T G T T – – – – – T – – T
H6 A G T T G T T T – A G – – – – T – – T T – T
H7 G G G – G T T T T A G – – – – T G – T – – –
H8 G G G – G T – – – A A – – – – T – – T – – –
H9 G G G – G T – – – A A – – – – T – – T T – T
H10 G G G – G T T T T A G T T – – – G G T T – T
H11 G G G – G T T T T A G T T – – – – – T – A T
H12 G G G – G T T T T A G T T T – – – – – - A T
H13 G G G – G T – – – A A T T – – T – – T – A T
H14 G G G – G T T – – A A T T – – – – – T – A T
H15 G G G – G – – – – A A T T – – – – – T – A T
H16 G G G – G T – – – A A – – – – – – – T – A T
H17 G G G – G T – – – A A T T – – – – – T – A T
H18 G G G – G T – – – A A T T T – – – – – – A T
H19 G G G – G T – – – A A T T – – – G – T – A T
H20 G G G – G T – – – A A T T T – – G – T – A –
H21 G T G – T T – – – A G T T – A – – – T — A T
cpDNA sequences are numbered from the 5′- to the 3′-end in each region.
(P3, P8); (P13); (P17); and (P22). Meanwhile, AMOVA of thesix groups revealed that 91.70% of the variance was distributedamong groups (Supplementary Table 6).
A phylogeny of cpDNA haplotypes showed lineagerelationships with high statistical support (> 95%) weredivided into two clades, one associated with the EG and theother with the WG (Figure 2, Supplementary Table 5). A pointestimate for the divergence time between the two cpDNA cladesdated to 0.1795 million years ago (Ma) (95% HPD: 0.0307–0.6276Ma; Figure 2). Observed mismatch distribution of EGand WG were both multimodal (Supplementary Figure 3).Analysis of SSD and raggedness index tests suggested thatthe curves did not differ significantly from the expectedmismatch distribution (Table 2). This indicated that thenull hypothesis of recent demographic expansions was notrejected.
In combination, the mixed cpDNA sequences identified 21chlorotypes (Table 1). Sixteen of them (51 individuals) wereprivate chlorotypes (Supplementary Table 1). Eight populationswere polymorphic while the remaining 14 were fixed as a singlechlorotype. The most abundant chlorotype was H17, which wasfound in 90 individuals (40.5%) from 12 populations that werelocated in Liaoning Hill, the Greater Khingan Mountains, theNortheast Plain, and the Yanshan Mountains. Chlorotype H3,discovered in seven populations, was the second most frequentand the only chlorotype in P6 and the most western population,P1. Population P2, P17, and P22 were fixed one private
chlorotype: H1, H15, and H2, respectively. Thus, the averagewithin-population diversity, HS (0.196), based on chloroplastvariation across all populations, was much smaller than thetotal genetic diversity, HT (0.809). A permutation test showedthat NST (0.871) was significantly higher than GST (0. 758,P < 0.01).
In total, 52 mutations and four median vectors were invokedto explain the network. Genetic relationships among the 21chlorotypes, based on the network, are shown in Figure 1.The chlorotypes formed two haplogroups in the median-joiningnetwork. The right group included the most frequent chlorotype,H17, along with 11 less frequent chlorotypes whereas theleft group comprised chlorotype H3 and five others. Eachgroup exhibited a star-like topology with rare chlorotypesfrom the most widely distributed and commonly occurringchlorotypes.
The result of SAMOVA based on mixed cpDNA sequenceshowed that the value of FCT reached a peak at K = 8. However,the value of FCT reached a plateau when K = 3, and the range ofthe variance was weak after K = 3 (Supplementary Figure 4). Itwas reasonable that the populations clustered into three groups.The grouping pattern of populations corresponding toK = 3 was:(P9, P10, P11, P12, P13, P14, P17, P18, P19, P20, P21), (P1, P2, P3,P4, P5, P6, P7, P8, P22), and (P15, P16). SAMOVA of chloroplastdata variation separated all populations into two large groups andone small one. The two large groups had a distinct boundary,which was the longitude lines of P16 (Figure 1). Moreover,
Frontiers in Plant Science | www.frontiersin.org 6 November 2017 | Volume 8 | Article 1989

Wang et al. Phylogeography of the Siberian Apricot
FIGURE 2 | BEAST-derived chronograms of eight haplotypes of Siberian apricot based on two cpDNA fragments. Axis scale represents million years ago (Ma), and95% highest posterior densities (HPDs) of nodes with posterior probabilities >0.9 are shown.
AMOVA of the three groups revealed that 82.0% of the variancewas distributed among the groups (Table 3).
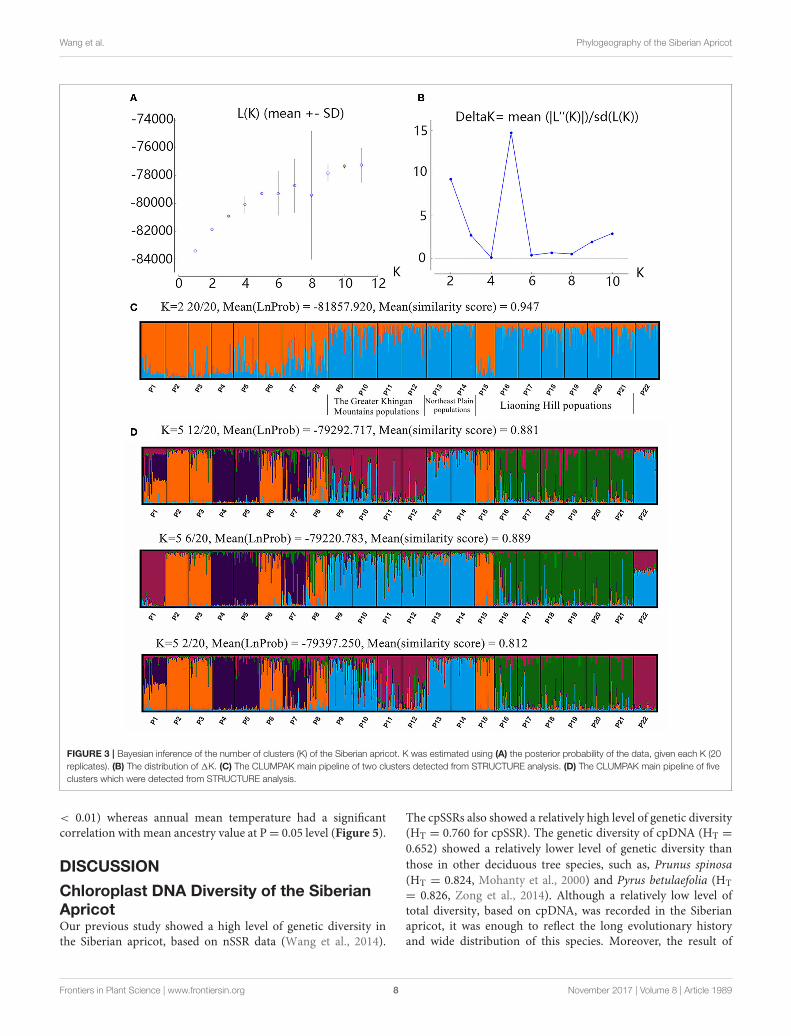
nSSR DataResults of the STRUCTURE analysis showed that the estimatedlogarithm of probability of ln P(K) showed an upward trenduntil K = 11. The data increased linearly from K = 1 to K =
5, and then showed certain amplitude fluctuations with largestandard deviations except at K = 10 (Figure 3A). The values of1K were not very large. The highest 1K occurred at K = 5 (1K= 14.72), and the second largest 1K was at K = 2 (1K = 9.30).However, the absolute values of 1K were very small (Figure 3B).The CLUMPAK main pipeline showed that all clustering resultswere unstable, with more than one clustering case for each Kexcept K = 2 (Figure 3C, Supplementary Figure 5). There werethree clustering cases whenK = 5, although it had the highest1K(Figure 3D). The biggest differences among the three clusteringcases were those of the Greater Khingan Mountains populations(P9, P10, P11, and P12), the Northeast Plain populations (P13and P14), and the extreme populations (P1 and P22) clusteredinto different clusters. It seemed more likely that this cluster hadthe structure of a sub-cluster. Thus, it seemed more reasonablethat all populations were clustered into two groups: the EG (P9,P10, P11, P12, P13, P14, P16, P17, P18, P19, P20, P21, P22) andthe WG (P1, P2, P3, P4, P5, P6, P7, P8, P15) (Figure 1).
A comparison of posterior probabilities of the three scenariosusing local linear regression indicated that scenario 3 wasthe most likely scenario, with a posterior probability of 0.48(Figure 4). For scenario 3, the median values of t1 (the time theEG arose via divergence from theWG) and t2 (the time when theancestral effective population size varied) were 663 generationsand 4,410 generations, respectively (Supplementary Figure 6,
TABLE 2 | Result of mismatch distribution analysis and neutrality test for twoclades.
Clade SSD PSSD Raggedness index PRag
WG 0.02435 0.24420 0.22849 0.54140
EG 0.01719 0.23110 0.40057 0.56650
TABLE 3 | Analysis of molecular variance (AMOVA) of chlorotypes for populationsand population groups of the Siberian apricot.
Source of variation d.f. Sum of
squares
Variance
components
Percentage of
variation
Fixation
index
Among groups 2 757.745 5.84610 Va 82.00 FSC: 0.49577
Among populationsWithin groups
19 134.310 0.63616 Vb 8.92 FST: 0.90925
Within populations 200 129.400 0.64700 Vc 9.08 FCT: 0.82002
Total 221 1021.455 7.12926
The first analysis included three groups, grouped by SAMOVA through chloroplast data.
d.f., degree of freedom; FST , variance among coefficient of individual relative to the
total variance; FSC, variance among subpopulations within groups; FCT , variance among
groups relative to the total variance.
Table 4). The median values of the effective population sizesof N1, N2, and Na were 11,500, 5,660, and 4,310, respectively.Estimates of gene flow, calculated with the MIGRATE software,and based on all 31 nSSRs data indicated high levels of gene flowbetween the two groups. The unidirectional estimate of 4 Nm
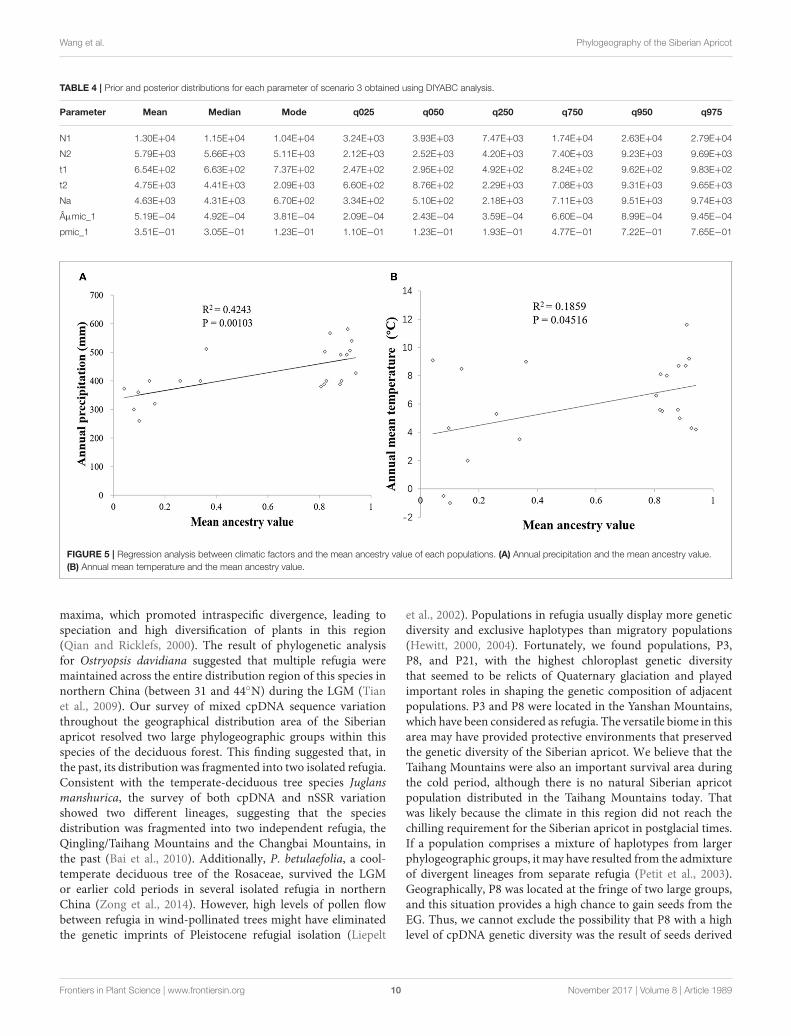
EG→WG was 344.75, and that of 4 Nm WG→EG was 322.86. Linearregression analysis showed that the annual precipitation had asignificant correlation with mean ancestry value (P = 0.00103
Frontiers in Plant Science | www.frontiersin.org 7 November 2017 | Volume 8 | Article 1989
Wang et al. Phylogeography of the Siberian Apricot
FIGURE 3 | Bayesian inference of the number of clusters (K) of the Siberian apricot. K was estimated using (A) the posterior probability of the data, given each K (20replicates). (B) The distribution of 1K. (C) The CLUMPAK main pipeline of two clusters detected from STRUCTURE analysis. (D) The CLUMPAK main pipeline of fiveclusters which were detected from STRUCTURE analysis.
< 0.01) whereas annual mean temperature had a significantcorrelation with mean ancestry value at P= 0.05 level (Figure 5).
DISCUSSION
Chloroplast DNA Diversity of the SiberianApricotOur previous study showed a high level of genetic diversity inthe Siberian apricot, based on nSSR data (Wang et al., 2014).
The cpSSRs also showed a relatively high level of genetic diversity(HT = 0.760 for cpSSR). The genetic diversity of cpDNA (HT =
0.652) showed a relatively lower level of genetic diversity than
those in other deciduous tree species, such as, Prunus spinosa
(HT = 0.824, Mohanty et al., 2000) and Pyrus betulaefolia (HT
= 0.826, Zong et al., 2014). Although a relatively low level oftotal diversity, based on cpDNA, was recorded in the Siberianapricot, it was enough to reflect the long evolutionary historyand wide distribution of this species. Moreover, the result of
Frontiers in Plant Science | www.frontiersin.org 8 November 2017 | Volume 8 | Article 1989

Wang et al. Phylogeography of the Siberian Apricot
FIGURE 4 | Posterior probability of the three scenarios.
mixed cpDNA sequences showed a much higher genetic diversity(HT = 0.809 vs. 0.670) than that of 170 plant species (Petitet al., 2005). Because the Siberian apricot is distributed in largeareas of China, across 18 longitudes and in a large range ofaltitudes (87–1,334m), the habitats of this species are complexand diverse. Moreover, combined use of two kinds of markerscan provide much more information about genetic diversity andpopulation structure than that provided by each marker alone.The populations (P3, P8, and P21) showing the highest levelof genetic diversity as revealed by mixed cpDNA sequenceswere inconsistent with those (P10, P16, and P20) revealed bynSSR data (Wang et al., 2014). This may be because the geneticdiversity of nuclear DNA is determined mainly by gene flow andenvironmental factors. However, unlike nuclear DNA, the geneticdiversity of cpDNA is determined by the length of evolutionarytime and the composition of lineages. Moreover, gene flow ofchloroplast maternally inherited genes occurs via seed dispersaland thus is more restricted than that of nuclear genes, which areinherited biparentally and dispersed by pollen and seeds (Birkyet al., 1983; Ennos, 1994). Results of the chloroplast data analysisshowed that P16, a semi-wild population, and P15 shared thesame chlorotype, indicating that they had a common origin. P16and P19 were from the same region and less than 17 km apart.Our previous study suggested that the seeds from P16 were local(Wang et al., 2014).
Population Structure of Nuclear andChloroplast DataGST explains genetic variation over all populations whereas NST
interprets the genetic differentiation influenced by haplotypefrequency and the genetic distance between haplotypes. Here,the value of NST (0.871) was significantly higher than thatof GST (0.758) using mixed cpDNA sequence data, indicatingthe presence of a phylogeographic structure. The grouping of
populations produced by SAMOVA of mix-sequences variationsstrikingly similar to that of STRUCTURE, based on nSSRs(Figure 1). SAMOVA grouped all populations into two largegroups and one small group that included P15 and P16.Additionally, the network based on mixed cpDNA sequencedata showed that all chlorotypes from each group were closelyrelated. The chlorotype H20, which was fixed in P15 and P16,was located in the right part of the network, indicating the EGgroup, and it had a close relationship with the most frequentchlorotype, H17 (Figure 1). This indicated that P16 and P15 stillbelonged to the EG. By comparison, the STRUCTURE analysisalso clustered all populations into two groups. The difference wasthat P22 was clustered into the EG and P15 was clustered intothe WG. The discordance between the present-day geographyof nuclear DNA and cpDNA lineages was likely caused by highand asymmetric levels of gene flow via pollen and seeds. Wesuggest that this kind of asymmetrical gene flow has occurredin the two populations. Although P15 was located in the EG,it had more gene exchange via pollen with the WG than withthe EG. Bai et al. (2010) reported that asymmetrical gene flowoccurred between the two large groups, with the northern group(the WG in our study) nuclear genome being introduced intothe northeastern group (the EG in our study) via pollen. Themonsoon was likely the main factor for this asymmetrical geneflow. Our results also showed whole gene flow between the twogroups was a little asymmetrical. P22 was far away from the othergroups in geographic distance, but showed a close relationshipin nuclear genetic distance (Wang et al., 2014). However, thisgeographic distance was too far away for spread via seeds.
The presence of a large number of private chlorotypes, andtwo star-like topologies exhibited in chlorotype network areusually indicative of historical expansion (Slatkin and Hudson,1991). Such an expansion is also supported by the results ofMDA which accepted the null hypothesis indicated EG andWG experienced recent demographic expansions in the past.According to coalescence theory, the most common chlorotypes,H3, and H17, which were dispersed over a large area andlocated at the center of the left and right part of chlorotypenetwork, seemed to be the most ancestral chlorotypes (Posadaand Crandall, 2001). Chlorotype H17 was the most commonchlorotype in the EG and the only chlorotype in populationsP9, P10, P11, P12, P14, P19, and P20, within which theabsence of mixed cpDNA sequences variation indicated thatthey were probably derived from adjacent population(s) throughcolonization, rather than being relicts after genetic drift or afounder event. If the latter was true, the populations wouldprobably be fixed for different chlorotypes rather than the sameone (Zhang et al., 2005; Liu et al., 2013). The latter seemed toapply more to the formation of theWG, which was filled with thesecond most frequent chlorotype, H3, although populations P1and P6 were completely fixed for it.
Refugia and Microrefugia for the SiberianApricotMultiple geographically isolated refugia existed for forests acrossEast Asia during the LGM and possibly the previous glacial
Frontiers in Plant Science | www.frontiersin.org 9 November 2017 | Volume 8 | Article 1989
Wang et al. Phylogeography of the Siberian Apricot
TABLE 4 | Prior and posterior distributions for each parameter of scenario 3 obtained using DIYABC analysis.
Parameter Mean Median Mode q025 q050 q250 q750 q950 q975
N1 1.30E+04 1.15E+04 1.04E+04 3.24E+03 3.93E+03 7.47E+03 1.74E+04 2.63E+04 2.79E+04
N2 5.79E+03 5.66E+03 5.11E+03 2.12E+03 2.52E+03 4.20E+03 7.40E+03 9.23E+03 9.69E+03
t1 6.54E+02 6.63E+02 7.37E+02 2.47E+02 2.95E+02 4.92E+02 8.24E+02 9.62E+02 9.83E+02
t2 4.75E+03 4.41E+03 2.09E+03 6.60E+02 8.76E+02 2.29E+03 7.08E+03 9.31E+03 9.65E+03
Na 4.63E+03 4.31E+03 6.70E+02 3.34E+02 5.10E+02 2.18E+03 7.11E+03 9.51E+03 9.74E+03
µmic_1 5.19E−04 4.92E−04 3.81E−04 2.09E−04 2.43E−04 3.59E−04 6.60E−04 8.99E−04 9.45E−04
pmic_1 3.51E−01 3.05E−01 1.23E−01 1.10E−01 1.23E−01 1.93E−01 4.77E−01 7.22E−01 7.65E−01
FIGURE 5 | Regression analysis between climatic factors and the mean ancestry value of each populations. (A) Annual precipitation and the mean ancestry value.(B) Annual mean temperature and the mean ancestry value.
maxima, which promoted intraspecific divergence, leading tospeciation and high diversification of plants in this region(Qian and Ricklefs, 2000). The result of phylogenetic analysisfor Ostryopsis davidiana suggested that multiple refugia weremaintained across the entire distribution region of this species innorthern China (between 31 and 44◦N) during the LGM (Tianet al., 2009). Our survey of mixed cpDNA sequence variationthroughout the geographical distribution area of the Siberianapricot resolved two large phylogeographic groups within thisspecies of the deciduous forest. This finding suggested that, inthe past, its distribution was fragmented into two isolated refugia.Consistent with the temperate-deciduous tree species Juglansmanshurica, the survey of both cpDNA and nSSR variationshowed two different lineages, suggesting that the speciesdistribution was fragmented into two independent refugia, theQingling/Taihang Mountains and the Changbai Mountains, inthe past (Bai et al., 2010). Additionally, P. betulaefolia, a cool-temperate deciduous tree of the Rosaceae, survived the LGMor earlier cold periods in several isolated refugia in northernChina (Zong et al., 2014). However, high levels of pollen flowbetween refugia in wind-pollinated trees might have eliminatedthe genetic imprints of Pleistocene refugial isolation (Liepelt
et al., 2002). Populations in refugia usually display more geneticdiversity and exclusive haplotypes than migratory populations(Hewitt, 2000, 2004). Fortunately, we found populations, P3,P8, and P21, with the highest chloroplast genetic diversitythat seemed to be relicts of Quaternary glaciation and playedimportant roles in shaping the genetic composition of adjacentpopulations. P3 and P8 were located in the Yanshan Mountains,which have been considered as refugia. The versatile biome in thisarea may have provided protective environments that preservedthe genetic diversity of the Siberian apricot. We believe that theTaihang Mountains were also an important survival area duringthe cold period, although there is no natural Siberian apricotpopulation distributed in the Taihang Mountains today. Thatwas likely because the climate in this region did not reach thechilling requirement for the Siberian apricot in postglacial times.If a population comprises a mixture of haplotypes from largerphylogeographic groups, it may have resulted from the admixtureof divergent lineages from separate refugia (Petit et al., 2003).Geographically, P8 was located at the fringe of two large groups,and this situation provides a high chance to gain seeds from theEG. Thus, we cannot exclude the possibility that P8 with a highlevel of cpDNA genetic diversity was the result of seeds derived
Frontiers in Plant Science | www.frontiersin.org 10 November 2017 | Volume 8 | Article 1989

Wang et al. Phylogeography of the Siberian Apricot
from different, large groups. P21 was also detected within a WGlineage; this might be becauseWG seeds spread eastward throughthe Bohai sea. Nevertheless, this does not affect the suggestionthat P21 was a long-term glacial survivor.
Based on the weak or absent genetic structure among thenortheast China populations of temperate forest deciduousspecies, these phylogeographic studies suggest that the currentdistributions of cool-temperate species in northeast China (theEG in our study) originated from a single glacial refugium, whichwas located in the Changbai Mountains (Hu et al., 2008; Baiet al., 2010; Liu et al., 2014; Zong et al., 2014). Recently, ithas also been proposed that many species, in fact, survived insmaller pockets at some distance from their core refugial areas,so-calledmicrorefugia, fromwhere they recolonized surroundingareas once climatic conditions improved (Stewart and Lister,2001; Hampe and Jump, 2011). Some species might even havesurvived only in such small, scattered microrefugia. Bai et al.(2016) suggested that several microrefugia were possible betweenthe Changbai and Xiaoxing’an mountains, ranging from 44 to47◦N. We should consider the most eastern population, P22, tothe north of the Changbai Mountains, and fixed for chlorotypeH2. The network analysis showed that H2 was in the left partof the network and had a close relationship with H3, whichwas most common in the WG (Figure 1). This indicated thatchlorotype H3 once appeared in all of the distribution area of theSiberian apricot. As a refuge, P22 retained only chlorotype H2during the LGM, but did not colonize other regions in postglacialtimes.
The Distinct Boundary between the TwoLarge GroupsThe DIYABC analysis showed that during the time the EGarose via divergence from the WG, there were only 663generations. Because the Siberian apricot begins to produceapricots at ∼5 years and its longevity can extend beyond40 years, we considered 20 years to represent a reasonablegeneration time, and it converted the divergence time t1 to13,260 years ago, which was the end of the LGM. Becausemicrosatellites have some inherent problems such as, uncertainmutation model and homoplasy (Selkoe and Toonen, 2006),this divergence time should be considered with caution. Ona large time scale, homoplasy at microsatellite loci tendedto underestimate divergence time (Takezaki and Nei, 1996).Indeed, the assumption of no gene flow between each branch inDIYABC analysis also probably underestimated the divergencetime (Leaché et al., 2013). The split time (0.1795Ma) of thetwo groups, based on cpDNA, which was much earlier thanthat based on nuclear data should be more reliable. Themost likely scenario showed that the WG was more ancientthan the EG. That is, chlorotype H3 and closely relatedchlorotypes are older than the most frequent chlorotype H17.Thus, P22 was the most ancient population in the EG. Thisfurther suggests that P22 was in a microrefugium during theLGM.
The distinct boundary contains a complex topography. Thenorthern part of the boundary, between P5 and P9, which areboth located in the Greater Khingan Mountains, was withoutany geographical barrier. The southern part was located in the
Liaoxi corridor, where the site type is coastal hilly plains. Onlythe middle part coincided with the Nuluerhushan Mountains,which are the eastern extension of the Yanshan Mountains.Similar division was observed with temperate deciduous trees,such as, walnut (J. mandshurica; Bai et al., 2010), Chinese oak(Q. mongolica and Q. liaotungensis; Zeng et al., 2011), monomaple (A. mono; Liu et al., 2014), and the Asian butternut(Juglans section Cardiocaryon; Bai et al., 2016). These resultsindicate that the cryptic boundary was located in the YanshanMountains and neighboring areas. Moreover, Bai et al. (2016)calculated that the divergence time of the closely related Asianbutternuts dated back to the Pliocene. This suggested that thedistinct boundary appeared far earlier than the LGM. The resultsof BEAST analysis showed that the divergence time (0.1795Ma)of EG and WG was also before the LGM. The divergencetime was in Middle Pleistocene which covered a period ofrepeated glaciation (Head and Gibbard, 2005). The factors ledthe divergence of the two groups warrant a further study. For thecurrent population distribution pattern, we suspect that climatewas an important factor in the formation of this boundary.The WG is under a temperate continental climate, whereas theclimate of the EG is temperate monsoon. Although the beltsof these two climates have shown dynamic changes in differentgeological periods, the north-south boundary between themwas always near the Yanshan Mountains (Guo et al., 2008).Rainfall and temperature, which are especially important fortemperate deciduous tree growth, were very different betweenthem. The significant correlations between the two climaticfactors and mean ancestry values proved the inference in acertain extent. Furthermore, the climate would affect the soilformation that effect tree growth indirectly (Prescott, 1950).Thus, a distinct boundary was located in the Yanshan Mountainswhere trees from the northeast China refugia and north Chinarefugia formed a recent secondary contact zone (Zeng et al.,2011). Indeed, this area was likely a secondary contact zonefor northern and southern regions of the whole of EastAsia.
CONCLUSIONS
Although regional asymmetric levels of gene flow, via pollen,and seeds, resulted in slight discordance between the present-daygeography of nuclear and chloroplast lineages for the Siberianapricot, our nuclear and cpDNA results support the existenceof a distinct boundary between the eastern and western groupsof northern China during the LGM. According to the linearcorrelation analysis, the potential factor for the formation ofthe two groups was likely the different climatic factors suchas, rainfall and temperature. Each of the two groups had itsown refugia during the LGM. Because of the extremely highlevels of chloroplast genetic diversity, the Yanshan Mountains,and Jinzhou (P21) were likely the refugia for the WG andEG, respectively. Moreover, an isolated microrefugium (P22),near the Changbai Mountains, was suggested within the EG.Overall, apart from geographic barriers, our findings highlightthe importance of climate in the present-day distribution oftemperate deciduous trees in northern China.
Frontiers in Plant Science | www.frontiersin.org 11 November 2017 | Volume 8 | Article 1989

Wang et al. Phylogeography of the Siberian Apricot
ACCESSION NUMBERS
All cpDNA sequences were deposited in GenBank under theaccession numbers KY000823-KY000832.
AUTHOR CONTRIBUTIONS
ZW, RW, and XP planned and designed the research. ZW, ZZ, JT,and SS performed experiments and analyzed data, and ZW, YZ,and XP wrote the manuscript.
ACKNOWLEDGMENTS
This work was supported by the Fundamental Research Fundsfor the Central Universities (BLYJ201517, 2016BLPX07), theProgram for New Century Excellent Talents in University bythe Ministry of Education, China (NCET-10-0223), the InnerMongolia Autonomous Region Science and Technology MajorProjects [(2014)2020] and the Projects in the National Science& Technology Pillar Program (2013BAD14B0302). The fundershad no role in study design, data collection and analysis, decision
to publish, or preparation of the manuscript. We wish to thankAohan Forestry Bureau, Inner Mongolia Autonomous Regionand Chengde Forestry Bureau in China for their help in collectingthe samples.
SUPPLEMENTARY MATERIAL
The Supplementary Material for this article can be foundonline at: https://www.frontiersin.org/articles/10.3389/fpls.2017.01989/full#supplementary-material
Supplementary Figure 1 | The three scenarios tested in DIYABC analysis. Inthese scenarios, t represents the time-scale in terms of the number ofgenerations, and N1 and N2 represent the effective population sizes of thenortheastern and northern groups.
Supplementary Figure 2 | FCT distribution of combined cpDNA data.
Supplementary Figure 3 | Mismatch distribution for two clades.
Supplementary Figure 4 | FCT distribution of mixed cpDNA sequence data.
Supplementary Figure 5 | The CLUMPAK main pipeline of all clustering.
Supplementary Figure 6 | Prior and posterior distributions for each parameter inscenario 3, obtained using DIYABC analysis.
REFERENCES
Abbott, R. J., Smith, L. C., Milne, R. I., Crawford, R.M.M.,Wolff, K., and Balfour, J.
(2000). Molecular analysis of plant migration and refugia in the Arctic. Science
289, 1343–1346. doi: 10.1126/science.289.5483.1343
Avise, J. C. (2000). Phylogeography: the History and Formation of Species.
Cambridge: Harvard University Press.
Bai, W. N., Liao, W. J., and Zhang, D. Y. (2010). Nuclear and chloroplast
DNA phylogeography reveal two refuge areas with asymmetrical gene flow
in a temperate walnut tree from East Asia. New Phytol. 188, 892–901.
doi: 10.1111/j.1469-8137.2010.03407.x
Bai, W. N., Wang, W. T., and Zhang, D. Y. (2016). Phylogeographic breaks within
Asian butternuts indicate the existence of a phytogeographic divide in East Asia.
New Phytol. 209, 1757–1772. doi: 10.1111/nph.13711
Bandelt, H. J., Forster, P., and Röhl, A. (1999). Median-joining networks
for inferring intraspecific phylogenies. Mol. Biol. Evol. 16, 37–48.
doi: 10.1093/oxfordjournals.molbev.a026036
Beerli, P. (2006). Comparison of Bayesian and maximum-likelihood
inference of population genetic parameters. Bioinformatics 22, 341–345.
doi: 10.1093/bioinformatics/bti803
Beerli, P., and Felsenstein, J. (1999). Maximum-likelihood estimation of migration
rates and effective population numbers in two populations using a coalescent
approach. Genetics 152, 763–773.
Birky, C. W., Maruyama, T., and Fuerst, P. (1983). An approach to population and
evolutionary genetic theory for genes in mitochondria and chloroplasts, and
some results. Genetics 103, 513–527.
Bryan, G. J., McNicoll, J., Ramsay, G., Meyer, R. C., and De Jong, W. S.
(1999). Polymorphic simple sequence repeat markers in chloroplast
genomes of Solanaceous plants. Theor. Appl. Genet. 99, 859–867.
doi: 10.1007/s001220051306
Chen, K. M., Abbott, R. J., Milne, R. I., Tian, X. M., and Liu, J. Q.
(2008). Phylogeography of Pinus tabulaeformis Carr.(Pinaceae), a dominant
species of coniferous forest in northern China. Mol. Ecol. 17, 4276–4288.
doi: 10.1111/j.1365-294X.2008.03911.x
Cheng, Y. J., Meng, H. J., Guo, W. W., and Deng, X. X. (2006). Universal
chloroplast primer pairs for simple sequence repeat analysis in
diverse genera of fruit crops. J. Hortic. Sci. Biotechnol. 81, 132–138.
doi: 10.1080/14620316.2006.11512039
Chiang, T. Y., Schaal, B. A., and Peng, C. I. (1998). Universal primers for
amplification and sequencing a noncoding spacer between the atpB and rbcL
genes of chloroplast DNA. Bot. Bull. Acad. Sinica 39, 245–250.
Clegg, M. T., and Zurawski, G. (1992). “Chloroplast DNA and the study of plant
phylogeny: present status and future prospects,” in Molecular Systematics of
Plants, eds P. M. Soltis, D. E. Soltis, and J. J. Doyle (New York, NY: Chapman &
Hall), 1–13.
Cornuet, J. M., Pudlo, P., Veyssier, J., Dehne-Garcia, A., Gautier, M., Leblois,
R., et al. (2014). DIYABC v2. 0: a software to make approximate Bayesian
computation inferences about population history using single nucleotide
polymorphism, DNA sequence and microsatellite data. Bioinformatics 30,
1187–1189. doi: 10.1093/bioinformatics/btt763
Darriba, D., Taboada, G. L., Doallo, R., and Posada, D. (2012). jModelTest 2:
more models, new heuristics and parallel computing. Nat. Methods 9, 772–772.
doi: 10.1038/nmeth.2109
Doyle, J. J. (1987). A rapid DNA isolation procedure for small quantities of fresh
leaf tissue. Phytochem. Bull. 19, 11–15.
Drummond, A. J., Suchard, M. A., Xie, D., and Rambaut, A. (2012). Bayesian
phylogenetics with BEAUti and the BEAST 1.7.Mol. Biol. Evol. 29, 1969–1973.
doi: 10.1093/molbev/mss075
Dupanloup, I., Schneider, S., and Excoffier, L. (2002). A simulated annealing
approach to define the genetic structure of populations. Mol. Ecol. 11,
2571–2581. doi: 10.1046/j.1365-294X.2002.01650.x
Earl, D. A., and vonHoldt, B. M. (2012). STRUCTURE HARVESTER: a website
and program for visualizing STRUCTURE output and implementing the
Evanno method. Conserv. Genet. Resour. 4, 359–361. doi: 10.1007/s12686-011-
9548-7
Ennos, R. A. (1994). Estimating the relative rates of pollen and seed migration
among plant populations. Heredity 72, 250–259. doi: 10.1038/hdy.1994.35
Evanno, G., Regnaut, S., and Goudet, J. (2005). Detecting the number of clusters of
individuals using the software STRUCTURE: a simulation study.Mol. Ecol. 14,
2611–2620. doi: 10.1111/j.1365-294X.2005.02553.x
Falush, D., Stephens, M., and Pritchard, J. K. (2003). Inference of population
structure using multilocus genotype data: linked loci and correlated allele
frequencies. Genetics 164, 1567–1587.
Gao, Q., Li, X. B., and Yang, X. S. (2002). Responses of vegetation and primary
production in north-south transect of eastern China in global change under
land use constraint. Acta Bot. Sin. 45, 1274–1284.
Guo, Z. T., Sun, B., Zhang, Z. S., Peng, S. Z., Xiao, G. Q., Ge, J. Y., et al. (2008).
A major reorganization of Asian climate by the early Miocene. Clim. Past 4,
153–174. doi: 10.5194/cp-4-153-2008
Hall, T. A. (1999). BioEdit: a user-friendly biological sequence alignment editor
and analysis program for Windows 95/98/NT. Nucleic Acids Symp. Ser. 41,
95–98.
Frontiers in Plant Science | www.frontiersin.org 12 November 2017 | Volume 8 | Article 1989

Wang et al. Phylogeography of the Siberian Apricot
Hampe, A., and Jump, A. S. (2011). Climate relicts: past, present, future. Annu.
Rev. Ecol. Evol. Syst. 42, 313–333. doi: 10.1146/annurev-ecolsys-102710-145015
Hamrick, J. L., and Godt, M. J. W. (1996). Effects of life history traits on genetic
diversity in plant species. Philos. Trans. R. Soc. B Biol. Sci. 351, 1291–1298.
doi: 10.1098/rstb.1996.0112
Head, M. J., and Gibbard, P. L. (2005). Early-Middle Pleistocene transitions: an
overview and recommendation for the defining boundary. Geol. Soc. Lond.
Spec. Publ. 247, 1–18. doi: 10.1144/GSL.SP.2005.247.01.01
Hewitt, G. (2000). The genetic legacy of the Quaternary ice ages. Nature 405,
907–913. doi: 10.1038/35016000
Hewitt, G. (2004). Genetic consequences of climatic oscillations in the
Quaternary. Philos. Trans. R. Soc. Lond. B Biol. Sci. 359, 183–195.
doi: 10.1098/rstb.2003.1388
Hu, L. J., Uchiyama, K., Shen, H. L., Saito, Y., Tsuda, Y., and Ide, Y. (2008). Nuclear
DNA microsatellites reveal genetic variation but a lack of phylogeographical
structure in an endangered species, Fraxinus mandshurica, across North-east
China. Ann. Bot. 102, 195–205. doi: 10.1093/aob/mcn074
Huntley, B., and Birks, H. J. B. (1983). An Atlas of Past and Present Pollen Maps for
Europe, 0-13,000 Years Ago. Cambridge: Cambridge University Press.
Laidò, G., Mangini, G., Taranto, F., Gadaleta, A., Blanco, A., Cattivelli, L.,
et al. (2013). Genetic diversity and population structure of tetraploid wheats
(Triticum turgidum L.) estimated by SSR, DArT and pedigree data. PLoS ONE
8:e67280. doi: 10.1371/journal.pone.0067280
Leaché, A. D., Harris, R. B., Rannala, B., and Yang, Z. H. (2013). The influence of
gene flow on species tree estimation: a simulation study. Syst Biol. 63:syt049.
doi: 10.1093/sysbio/syt049
Li, M., Zhao, Z., Miao, X. J., and Zhou, J. J. (2013). Genetic diversity and population
structure of Siberian apricot (Prunus sibirica L.) in China. Int. J. Mol. Sci. 15,
377–400. doi: 10.3390/ijms15010377
Liepelt, S., Bialozyt, R., and Ziegenhagen, B. (2002). Wind-dispersed pollen
mediates postglacial gene flow among refugia. Proc. Natl. Acad. Sci. U.S.A. 99,
14590–14594. doi: 10.1073/pnas.212285399
Liu, C. P., Tsuda, Y., Shen, H. L., Hu, L. J., Saito, Y., and Ide, Y. (2014).
Genetic structure and hierarchical population divergence history of Acer
mono var. mono in South and Northeast China. PLoS ONE 9:e87187.
doi: 10.1371/journal.pone.0087187
Liu, J., Sun, P., Zheng, X. Y., Potter, D., Li, K. M., Hu, C. Y., et al. (2013).
Genetic structure and phylogeography of Pyrus pashia L.(Rosaceae) in Yunnan
Province, China, revealed by chloroplast DNA analyses. Tree Genet. Genomes
9, 433–441. doi: 10.1007/s11295-012-0564-x
Liu, K. B. (1988). Quaternary history of the temperate forests of China. Quat. Sci.
Rev. 7, 1–20. doi: 10.1016/0277-3791(88)90089-3
Manos, P. S., and Stanford, A. M. (2001). The biogeography of Fagaceae: tracking
the Tertiary history of temperate and subtropical forests of the Northern
Hemisphere. Int. J. Plant Sci. 162, S77–S93. doi: 10.1086/323280
Maynard, D. N. (1999). Horticultural reviews. Volume 22. HortScience 34,
1131–1131.
Milne, R. I. (2006). Northern Hemisphere plant disjunctions: a window
on tertiary land bridges and climate change? Ann. Bot. 98, 465–472.
doi: 10.1093/aob/mcl148
Milne, R. I., and Abbott, R. J. (2002). The origin and evolution of tertiary relict
floras. Adv. Bot. Res. 38, 281–314. doi: 10.1016/S0065-2296(02)38033-9
Mohanty, A., Martin, J. P., and Aguinagalde, I. (2000). Chloroplast DNA diversity
within and among populations of the allotetraploid Prunus spinosa L. Theor.
Appl. Genet. 100, 1304–1310. doi: 10.1007/s001220051439
Nei, M. (1987). Molecular Evolutionary Genetics. New York, NY: Columbia
University Press. 512.
Nei, M., and Tajima, F. (1983). Maximum likelihood estimation of the number of
nucleotide substitutions from restriction sites data. Genetics 105, 207–217.
Ohta, S., Nishitani, C., and Yamamoto, T. (2005). Chloroplast
microsatellites in Prunus, Rosaceae. Mol. Ecol. Notes 5, 837–840.
doi: 10.1111/j.1471-8286.2005.01080.x
Petit, R. J., Aguinagalde, I., de Beaulieu, J. L., Bittkau, C., Brewer, S., Cheddadi, R.,
et al. (2003). Glacial refugia: hotspots but not melting pots of genetic diversity.
Science 300, 1563–1565. doi: 10.1126/science.1083264
Petit, R. J., Duminil, J., Fineschi, S., Hampe, A., Salvini, D., and Vendramin,
G. G. (2005). Invited review: comparative organization of chloroplast,
mitochondrial and nuclear diversity in plant populations. Mol. Ecol. 14,
689–701. doi: 10.1111/j.1365-294X.2004.02410.x
Pons, O., and Petit, R. J. (1996). Measwring and testing genetic differentiation with
ordered versus unordered alleles. Genetics 144, 1237–1245.
Posada, D., and Crandall, K. A. (2001). Intraspecific gene genealogies:
trees grafting into networks. Trends Ecol. Evol. 16, 37–45.
doi: 10.1016/S0169-5347(00)02026-7
Prescott, J. A. (1950). A climatic index for the leaching factor in soil formation.
Eur. J. Soil Sci. 1, 9–19. doi: 10.1111/j.1365-2389.1950.tb00714.x
Pritchard, J. K., Stephens, M., and Donnelly, P. (2000). Inference of population
structure using multilocus genotype data. Genetics 155, 945–959.
Qian, H., and Ricklefs, R. E. (2000). Large-scale processes and the Asian
bias in species diversity of temperate plants. Nature 407, 180–182.
doi: 10.1038/35025052
Qiu, Y. X., Fu, C. X., and Comes, H. P. (2011). Plant molecular phylogeography
in China and adjacent regions: tracing the genetic imprints of Quaternary
climate and environmental change in the world’s most diverse temperate
flora. Mol. Phylogenet. Evol. 59, 225–244. doi: 10.1016/j.ympev.2011.
01.012
Rambaut, A. (2012). FigTree. Version 1.4.0. Edinburgh: University of Edinburgh.
Available online at: http://tree.bio.ed.ac.uk/software/figtree/ (Accessed May
2014).
Rambaut, A., and Drummond, A. J. (2007). Tracer v1.4. Edinburgh: University
of Edinburgh. Available online at: http://tree.bio.ed.ac.uk/software/tracer/
(Accessed December 1, 2012).
R Core Team (2016). R: A Language and Environment for Statistical Computing.
Vienna: R Foundation for Statistical Computing. Avaliable online at: https://
www.R-project.org/
Richardson, J. E., Pennington, R. T., Pennington, T. D., and Hollingsworth, P. M.
(2001). Rapid diversification of a species-rich genus of neotropical rain forest
trees. Science 293, 2242–2245. doi: 10.1126/science.1061421
Rogers, A. R., and Harpending, H. (1992). Population growth makes waves in the
distribution of pairwise genetic differences.Mol. Biol. Evol. 9, 552–569.
Rozas, J., Sánchez-DelBarrio, J. C., Messeguer, X., and Rozas, R. (2003).
DnaSP, DNA polymorphism analyses by the coalescent and other methods.
Bioinformatics 19, 2496–2497. doi: 10.1093/bioinformatics/btg359
Selkoe, K. A., and Toonen, R. J. (2006). Microsatellites for ecologists: a practical
guide to using and evaluating microsatellite markers. Ecol. Lett. 9, 615–629.
doi: 10.1111/j.1461-0248.2006.00889.x
Shaw, J., Lickey, E. B., Schilling, E. E., and Small, R. L. (2007). Comparison of whole
chloroplast genome sequences to choose noncoding regions for phylogenetic
studies in angiosperms: the tortoise and the hare III. Am. J. Bot. 94, 275–288.
doi: 10.3732/ajb.94.3.275
Slatkin, M., and Hudson, R. R. (1991). Pairwise comparisons of mitochondrial
DNA sequences in stable and exponentially growing populations. Genetics 129,
555–562.
Small, R. L., Ryburn, J. A., Cronn, R. C., Seelanan, T., andWendel, J. F. (1998). The
tortoise and the hare: choosing between noncoding plastome and nuclear Adh
sequences for phylogeny reconstruction in a recently diverged plant group.Am.
J. Bot. 85, 1301–1315. doi: 10.2307/2446640
Stewart, J. R., and Lister, A. M. (2001). Cryptic northern refugia and
the origins of the modern biota. Trends Ecol. Evol. 16, 608–613.
doi: 10.1016/S0169-5347(01)02338-2
Sze-Tao, K., and Sathe, S. (2000). Functional properties and in vitro digestibility
of almond (Prunus dulcis L.) protein isolate. Food Chem. 69, 153–160.
doi: 10.1016/S0308-8146(99)00244-7
Taberlet, P., Fumagalli, L., Wust-Saucy, A. G., and Cosson, J. F. (1998).
Comparative phylogeography and postglacial colonization routes in Europe.
Mol. Ecol. 7, 453–464. doi: 10.1046/j.1365-294x.1998.00289.x
Taberlet, P., Gielly, L., Pautou, G., and Bouvet, J. (1991). Universal primers for
amplification of three non-coding regions of chloroplast DNA. Plant Mol. Biol.
17, 1105–1109.
Takezaki, N., and Nei, M. (1996). Genetic distances and reconstruction
of phylogenetic trees from microsatellite DNA. Genetics 144, 389–399.
doi: 10.1007/BF00037152
Thompson, J. D., Gibson, T. J., Plewniak, F., Jeanmougin, F., and Higgins, D. G.
(1997). The CLUSTAL_X windows interface: flexible strategies for multiple
Frontiers in Plant Science | www.frontiersin.org 13 November 2017 | Volume 8 | Article 1989

Wang et al. Phylogeography of the Siberian Apricot
sequence alignment aided by quality analysis tools. Nucleic Acids Res. 25,
4876–4882. doi: 10.1093/nar/25.24.4876
Tian, B., Liu, R. R., Wang, L. Y., Qiu, Q., Chen, K. M., and Liu, J. Q.
(2009). Phylogeographic analyses suggest that a deciduous species
(Ostryopsis davidiana Decne., Betulaceae) survived in northern
China during the last glacial maximum. J. Biogeogr. 36, 2148–2155.
doi: 10.1111/j.1365-2699.2009.02157.x
Tiffney, B. H., and Manchester, S. R. (2001). The use of geological and
paleontological evidence in evaluating plant phylogeographic hypotheses in the
Northern Hemisphere tertiary. Int. J. Plant Sci. 162:S3. doi: 10.1086/323880
Vavilov, N. I. (1992). Origin and Geography of Cultivated Plants. Transl. by. L.
Storr-best. Cambridge: Cambridge University Press.
Wang, L. (2012). Evaluation of Siberian Apricot (Prunus sibirica L.) germplasm
variability for biodiesel properties. J. Am. Oil Chem. Soc. 89, 1743–1747.
doi: 10.1007/s11746-012-2069-z
Wang, Z., Kang, M., Liu, H. B., Gao, J., Zhang, Z. D., Li, Y. Y., et al. (2014). High-
level genetic diversity and complex population structure of Siberian apricot
(Prunus sibirica L.) in China as revealed by nuclear SSR markers. PLoS ONE
9:e87381. doi: 10.1371/journal.pone.0087381
Webb, T., and Bartlein, P. J. (1992). Global changes during the last 3 million
years: climatic controls and biotic responses.Annu. Rev. Ecol. Syst. 23, 141–173.
doi: 10.1146/annurev.es.23.110192.001041
Weising, K., and Gardner, R. C. (1999). A set of conserved PCR primers for the
analysis of simple sequence repeat polymorphisms in chloroplast genomes of
dicotyledonous angiosperms. Genome 42, 9–19. doi: 10.1139/g98-104
Wolfe, K. H., Li, W. H., and Sharp, P. M. (1987). Rates of nucleotide substitution
vary greatly among plant mitochondrial, chloroplast, and nuclear DNAs. Proc.
Natl. Acad. Sci. U.S.A. 84, 9054–9058. doi: 10.1073/pnas.84.24.9054
Yu, G., Chen, X. D., Ni, J., Cheddadi, R., Guiot, J., Han, H., et al.
(2000). Palaeovegetation of China: a pollen data-based synthesis for
the mid-Holocene and last glacial maximum. J. Biogeogr. 27, 635–664.
doi: 10.1046/j.1365-2699.2000.00431.x
Zeng, Y. F., Liao, W. J., Petit, R. J., and Zhang, D. Y. (2011). Geographic variation
in the structure of oak hybrid zones provides insights into the dynamics of
speciation.Mol. Ecol. 20, 4995–5011. doi: 10.1111/j.1365-294X.2011.05354.x
Zeng, Y. F., Wang, W. T., Liao, W. J., Wang, H. F., and Zhang, D. Y.
(2015). Multiple glacial refugia for cool-temperate deciduous trees in northern
East Asia: the Mongolian oak as a case study. Mol. Ecol. 24, 5676–5691.
doi: 10.1111/mec.13408
Zhang, J., Wei, Z., and Zhao, H. (2006). Determination of ability of
several arbor and shrub species to endure and survive extreme aridity
with limited-areas methods under field conditions in Horqin Sandy
Land. Acta Ecol. Sin. 26, 467–474. doi: 10.1016/S1872-2032(06)6
0010-3
Zhang, Q., Chiang, T. Y., George, M., Liu, J. Q., and Abbott, R. J. (2005).
Phylogeography of the Qinghai-Tibetan Plateau endemic Juniperus
przewalskii (Cupressaceae) inferred from chloroplast DNA sequence
variation. Mol. Ecol. 14, 3513–3524. doi: 10.1111/j.1365-294X.2005.0
2677.x
Zhou, T. H., Li, S., Qian, Z. Q., Su, H. L., Huang, Z. H., Guo, Z. G.,
et al. (2010). Strong phylogeographic pattern of cpDNA variation reveals
multiple glacial refugia for Saruma henryi Oliv. (Aristolochiaceae), an
endangered herb endemic to China. Mol. Phylogenet. Evol. 57, 176–188.
doi: 10.1016/j.ympev.2010.07.001
Zong, Y., Sun, P., Liu, J., Yue, X. Y., Niu, Q. F., and Teng, Y. W. (2014).
Chloroplast DNA-based genetic diversity and phylogeography of Pyrus
betulaefolia (Rosaceae) in Northern China. Tree Genet. Genomes 10, 739–749.
doi: 10.1007/s11295-014-0718-0
Conflict of Interest Statement: The authors declare that the research was
conducted in the absence of any commercial or financial relationships that could
be construed as a potential conflict of interest.
Copyright © 2017 Wang, Zeng, Zhang, Sheng, Tian, Wu and Pang. This is an open-
access article distributed under the terms of the Creative Commons Attribution
License (CC BY). The use, distribution or reproduction in other forums is permitted,
provided the original author(s) or licensor are credited and that the original
publication in this journal is cited, in accordance with accepted academic practice.
No use, distribution or reproduction is permitted which does not comply with these
terms.
Frontiers in Plant Science | www.frontiersin.org 14 November 2017 | Volume 8 | Article 1989