Embed Size (px)
Citation preview

Photovoltaic Cells for Micro-Scale Wireless Sensor Nodes:Measurement and Modeling to Assist System Design
Anand Savanth1,2, Alex Weddell1, James Myers2, David Flynn1,2, Bashir-Al-Hashimi11Electronics and Computer Science, University of Southampton, UK
2ARM Ltd., Cambridge, UKasw, [email protected], anand.savanth, james.myers, [email protected],
ABSTRACTEnergy harvesting enables perpetual operation of wirelesssensor nodes by scavenging energy from the environment.Light energy harvesting using photovoltaic (PV) cells is pre-ferred as they offer the highest volumetric power output al-lowing nodes to be as small as possible. However, theirpower output can be spatially and temporally-variable. Thiswork investigates the performance of cm2-scale PV cells, andreports on a new measurement and characterization plat-form. Results show that micro PV cells perform differentlyfrom large panels: power is not simply a function of areaand light levels, and manufacturing variability can be a ma-jor issue. The method presented enables the rational de-sign of micro-scale systems, including their maximum powerpoint tracking circuits, and the evaluation of techniques forenergy-neutrality (such as workload throttling) at design-time.
Categories and Subject DescriptorsB.m [Miscellaneous]: Design management; B.7.2 [IntegratedCircuits]: Design Aids—Simulation; C.4 [Performance ofSystems]: Design Studies
KeywordsEnergy harvesting, micro-PV cells, SC converters, wirelesssensor nodes.
1. INTRODUCTIONTo enable mass deployment of wireless sensor nodes (WSN),
a number of features are important of which size, cost, powerconsumption (particularly in sleep mode), and a reliablepower supply are critical. For powering energy-neutral WSN,PV energy harvesters generally offer the highest volumet-ric power output [2], and power conversion and maximumpower point tracking (MPPT) techniques for solar energyharvesters are relatively well understood. However, the ex-tent to which available energy varies over time can cause
Permission to make digital or hard copies of all or part of this work for personal orclassroom use is granted without fee provided that copies are not made or distributedfor profit or commercial advantage and that copies bear this notice and the full cita-tion on the first page. Copyrights for components of this work owned by others thanACM must be honored. Abstracting with credit is permitted. To copy otherwise, or re-publish, to post on servers or to redistribute to lists, requires prior specific permissionand/or a fee. Request permissions from [email protected]’15, November 1, 2015, Seoul, South Korea..c© 2015 ACM. ISBN 978-1-4503-3837-0/15/11 ...$15.00.
DOI: http://dx.doi.org/10.1145/2820645.2820653.
Energy
Harvester
DCDC1
Input power
conditioning
DCDC2
Output power
conditioning
MCU
Peripherals
Radio
AFE
VSTORE
WSN SoC
Figure 1: WSN SoC with Energy Harvesting ([9]).
problems for system designers. A system design process gen-erally includes [9] 1) choosing the energy harvesting source,2) designing matching power conversion circuitry, 3) choos-ing the type/size of energy storage device, 4) estimating thepower budget of the WSN, 5) estimating the size of mi-cro harvester, 6) implementing the most appropriate MPPTtechnique, and 7) refining for any other system requirements.This complex process affects the cost and ability to deploya sensor system.
CMOS sub-threshold design techniques allow highly inte-grated system-on-chip (SoC) WSN to be implemented. Sys-tems that can run with 10’s of pico-Joules per cycle havebeen demonstrated [13], [5] and it is important to ensuresuch sensor nodes can be powered using micro harvesters ofoptimal size and power output. In such applications PV cellsare used in conjunction with a switching converter (DCDC1
in Fig. 1). Typically, a second DCDC converter is usedfor converting from VSTORE to sub-threshold voltage levelsrequired by the rest of the system.
For perpetual energy-neutral operation of such SoCs it iscrucial to have simulation models for PV cells especially forconverter designs, evaluating MPPT techniques, and sys-tem co-simulations. Prior PV cell modeling efforts ([8], [18]amongst many others) have focussed on large panels withoutput powers greater than 1mW while, as will be presentedlater, the characteristics and system dynamics differ consid-erably when micro PV cells are considered. Previous worksexploring PV cell based energy harvesting in the contextof self-powered (WSN [4], [10]) use preliminary values fromdatasheets and iteratively compute remaining model param-eters. This work utilizes data from continuous measurementof PV cell current-voltage (IV) characteristics to arrive at asimulation model.
Continuous IV curve logging has been employed in relatedworks such as [7] and [1] but with the primary objective ofreplaying them to enable repeatable design-time experimen-tal results by emulating energy sources. While [7] use fast12bit ADCs to capture IV curves within a few milli-seconds,an error of up to 70µA is allowed during emulation, whereas

RTC
Charger
32b MCU
128Mb Flash
18b 4ch ADC
12b DAC
Vbat
SPI
I2C
USB
RshPV cell
Temperature
Illumination
Vc
Embedded System
Sensors and DUT
Figure 2: Characterization System.
micro PV cells characterized in this work generate muchlower peak currents. Similarly [1] have 10’s of mV and 100’sof µA emulation error which is limiting in the context of theWSN designs considered here.
This work uses an embedded characterization platform toperform long-term continuous IV measurements on microPV cells so that post-processing can be used for evaluatinga wide range of WSN SoC design choices. The primaryobjective of this work is to use the data generated to developSPICE models for micro PV cells. The major contributionsof this work are:
• construction of a characterization system for micro PVcells (Section 2), which is applied to a two-diode PVcell model (Section 3),
• performance evaluation of different PV cells over ex-tended periods (Section 4.1),
• evaluation of MPPT techniques applicable to WSNSoC designs (Section 4.2), and consideration of theoverall energy budget (Section 4.3).
2. CHARACTERIZATION SYSTEMA low-cost, portable and precision measurement system is
necessary to enable characterising PV cells in large numbers.Sufficient battery and memory storage is required to sup-port data logging over long durations. A convenient methodto power such a system would be with batteries that canbe recharged over USB since data is eventually transferredto a PC. Thus, desirable features for the characterizationsystem (CS) are high accuracy measurements, large non-volatile memory, easy data transfer interface, rechargeablebattery operation and small form-factor.
The block diagram for the CS is shown in Fig. 2. A1Ah lipo battery which can be charged from 5V sourcesprovides sufficient energy for the CS to record device-under-test (DUT) performance continuously for several days unat-tended. A 32-bit MCU manages all the data converters andallows PC interface for post processing of data. A lightsensor, similar to [16], with integrated IR and broadbandspectrum detectors is used for measuring illumination levelsand spectral content. A 4-channel 18-bit ADC with inter-nal temperature-compensated voltage reference allows am-bient temperature, PV voltage and current measurementsat sub-mV and µA accuracy. A 12-bit DAC is used to con-trol the gate voltage (Vc) to a power NFET, which in turnacts as the variable load to the DUT PV cell. All sensors,data-converters and flash memory storage devices use built-in low-power sleep modes. No data is collected under ex-treme low-light conditions to improve battery and memoryusage. Lossless compression and byte-packing is used for
5 50 500 5000
0.0%
0.5%
1.0%
1.5%
2.0%
0 0.25 0.5 0.75 1 1.25 1.5
Current(uA)
%Er
ror
Voltage (V)
Voltage
Current
Figure 3: Voltage and current measurement %error.
better memory utilization. The CS logs time-stamped IVand ambient sensor data and periodically writes the bufferedlog to the flash device.
Although current measurement is affected by the use ofa shunt resistor, temperature, voltage and current valuesprimarily rely on calibration of the 18-bit ADC. Lux mea-surement uses the standard conversion formula provided inthe device datasheet and regression was used to arrive ata correction factor. Post correction, voltage and currentagree with calibrated instruments within 0.2% and 2% re-spectively. The 2% error is for currents below 5µA and forhigher values the error is lower (Fig. 3). Since the lightsensor covers a wide illumination range, a 20% error in mea-sured values was observed for illumination levels of 200Luxand below while for 1000Lux or greater the error is less than10%. The CS can complete a 50-point IV sweep within 5seconds. However, for measurement precision a higher set-tling time was used. This can cause some of the data pointsto be inconsistent because of fast temporal changes in illu-mination. Such data points have been excluded by post-processing (detailed in section 3.1).
3. PV CELL MODELINGMost PV cell modeling methods use information from
datasheets to compute the parameter values for simulationmodels [4]. Methods that rely only on experimental datafor obtaining parameters have also been explored; they areoften effort-intensive, requiring several IV measurements un-der controlled conditions [15]. Although IV data for the en-tire curve is obtained from the CS, an alternative modelingmethod [6] relies only on measurement of the ’remarkablepoints’, and remaining model parameters are iteratively ex-tracted. Thus, models with better accuracy can be obtainedwith fewer measurements from a relatively uncontrolled en-vironment. In addition, appreciable accuracy (<0.1% error)
Figure 4: PV cell - two diode model ([3]).

1.E-6
1.E-5
1.E-4
1.E-3
Cu
rren
t (A
)
Iph
1.E-42
1.E-36
1.E-30
1.E-24
1.E-18
1.E-12
1.E-6
0 500 1000 1500 2000 2500 3000
Cu
rren
t (A
)
Illumination (Lux)
Is1
Is2
1.E+3
1.E+5
1.E+7
1.E+9
Res
ista
nce
(Ω
)
RsRp
Figure 5: Extracted parameters vs illumination
can be attained in the first iteration of the parameter calcu-lation algorithm therefore reducing computation overheads.At these remarkable points, the CS measurement errors arenegligible (less than 0.5%).
3.1 PV Cell Parameter ExtractionThe two-diode model [3] is considered to be better than
the single diode model, particularly for representing the be-havior of PV cells under low light conditions. The seconddiode (D2 in Fig. 4) which models current due to recom-bination in the space-charge region (Is2) makes the modelmore accurate. D1 models current due to recombination inthe quasi-neutral region (Is1). All five model parameters,Rs, Rp, Is1, Is2 and Iph can be extracted from measuredperformance data, which is desirable because the modeledvalues are tuned for deployment conditions.
Parameter extraction relies on the following set of equa-tions [15] which are computed in this order. With Iph = Iscused as the initial condition, (2) to (5) are computed overmultiple iterations (depending on the desired accuracy orcomputational constraints). However, the logged data mustfirst be pruned to eliminate any inconsistent sweeps. Thepolarity of K1, which represents conductance, is an obviousindicator of inconsistent data points.
Rpo = −(dVdI
)I=Isc
(1)
K1 =
Impp
Iph−Impp+ log
[1 − Impp
Iph
]2Vmpp − Voc
(2)
K2 = log[Iph] − VocK1 (3)
Rs =Vmpp − Impp
[Iph−Impp]K1
Impp(4)
Iph = Isc + e(IscRs)K1+K2 (5)
1612
12 11
0.4
0.8
1.2
1.6
2
2.4
500 1000 1500 2000
Vo
c (V
)
Lux
5
3
55
0
10
20
30
Isc
(µA
)
Figure 6: Variation for 9 mono-crystalline PV cellsfrom the same manufacturer. Numeric values in-dicate ratio of standard deviation over mean as apercentage.
Finally Rp, Is1, and Is2 are computed using equations (6)to (9). In (7) to (9), q, k and T are the elementary charge,Boltzmann’s constant and temperature in Kelvin.
Rso = −(dVdI
)V =Voc
(6)
Is1 =(− Isc +
Voc
Rpo+
2kT
q(Rso −Rs)
)e−qVoc/kT (7)
Is2 = 2(Isc −
Voc
Rpo− kT
q(Rso −Rs)
)e−qVoc/2kT (8)
Rp =
(1
Rpo −Rs− qIs1kT
eq(IscRs)/kT − qIs22kT
eq(IscRs)/2kT
)−1
(9)Figure 5 shows the extracted parameters plotted against
illumination, with the continuous lines showing the fittedmodel. A few points are worthy of mention, to illustratehow the parameters would influence SPICE simulations.
Both resistances decrease with illumination. Rp is 3 ordersof magnitude higher than Rs; for the micro-harvester sizesconsidered here, Rs is of the order of tens of kΩ. The diodecurrents (Is1, Is2) also decrease with illumination. Whilethis is counter-intuitive, Is1 and Is2 influence the knee volt-age of the diodes causing the PV cell output voltage to behigher at brighter illumination levels.
Another design-critical issue is the variation in PV cells,which must be accounted for in simulation to evaluate best-and worst-case scenarios. Figure 6 shows the spread of opencircuit voltage (Voc) and short circuit current (Isc) for ninePV samples measured under varying indoor lighting condi-tions. The box indicates the spread in the measured samplesalong with the mean, the whiskers indicate the expected 3-sigma limits. The spread in power at MPP (Pmpp) is ex-pected to follow that of Voc because Isc has a relativelytighter distribution (lower sigma-over-mean). The 10-20%
500lux
MPP
1000 lux
1500 lux
2000 lux
0.0 0.5 1.0 1.5 2.0
0.E+0
2.E-5
4.E-5
6.E-5
8.E-5
1.E-4
0.E+0
2.E-5
4.E-5
6.E-5
8.E-5
1.E-4
0.0 0.5 1.0 1.5 2.0Voltage (V)
Cu
rren
t (A
)
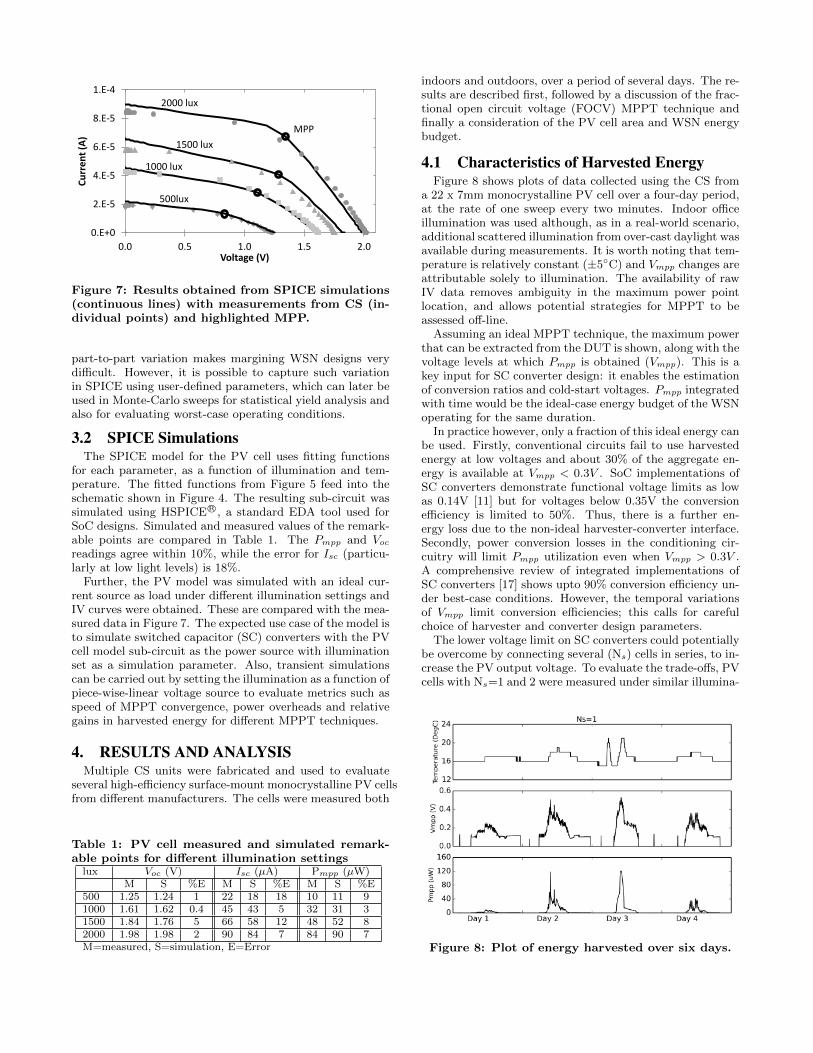
Figure 7: Results obtained from SPICE simulations(continuous lines) with measurements from CS (in-dividual points) and highlighted MPP.
part-to-part variation makes margining WSN designs verydifficult. However, it is possible to capture such variationin SPICE using user-defined parameters, which can later beused in Monte-Carlo sweeps for statistical yield analysis andalso for evaluating worst-case operating conditions.
3.2 SPICE SimulationsThe SPICE model for the PV cell uses fitting functions
for each parameter, as a function of illumination and tem-perature. The fitted functions from Figure 5 feed into theschematic shown in Figure 4. The resulting sub-circuit wassimulated using HSPICER©, a standard EDA tool used forSoC designs. Simulated and measured values of the remark-able points are compared in Table 1. The Pmpp and Voc
readings agree within 10%, while the error for Isc (particu-larly at low light levels) is 18%.
Further, the PV model was simulated with an ideal cur-rent source as load under different illumination settings andIV curves were obtained. These are compared with the mea-sured data in Figure 7. The expected use case of the model isto simulate switched capacitor (SC) converters with the PVcell model sub-circuit as the power source with illuminationset as a simulation parameter. Also, transient simulationscan be carried out by setting the illumination as a function ofpiece-wise-linear voltage source to evaluate metrics such asspeed of MPPT convergence, power overheads and relativegains in harvested energy for different MPPT techniques.
4. RESULTS AND ANALYSISMultiple CS units were fabricated and used to evaluate
several high-efficiency surface-mount monocrystalline PV cellsfrom different manufacturers. The cells were measured both
Table 1: PV cell measured and simulated remark-able points for different illumination settings
lux Voc (V) Isc (µA) Pmpp (µW)M S %E M S %E M S %E
500 1.25 1.24 1 22 18 18 10 11 91000 1.61 1.62 0.4 45 43 5 32 31 31500 1.84 1.76 5 66 58 12 48 52 82000 1.98 1.98 2 90 84 7 84 90 7M=measured, S=simulation, E=Error
indoors and outdoors, over a period of several days. The re-sults are described first, followed by a discussion of the frac-tional open circuit voltage (FOCV) MPPT technique andfinally a consideration of the PV cell area and WSN energybudget.
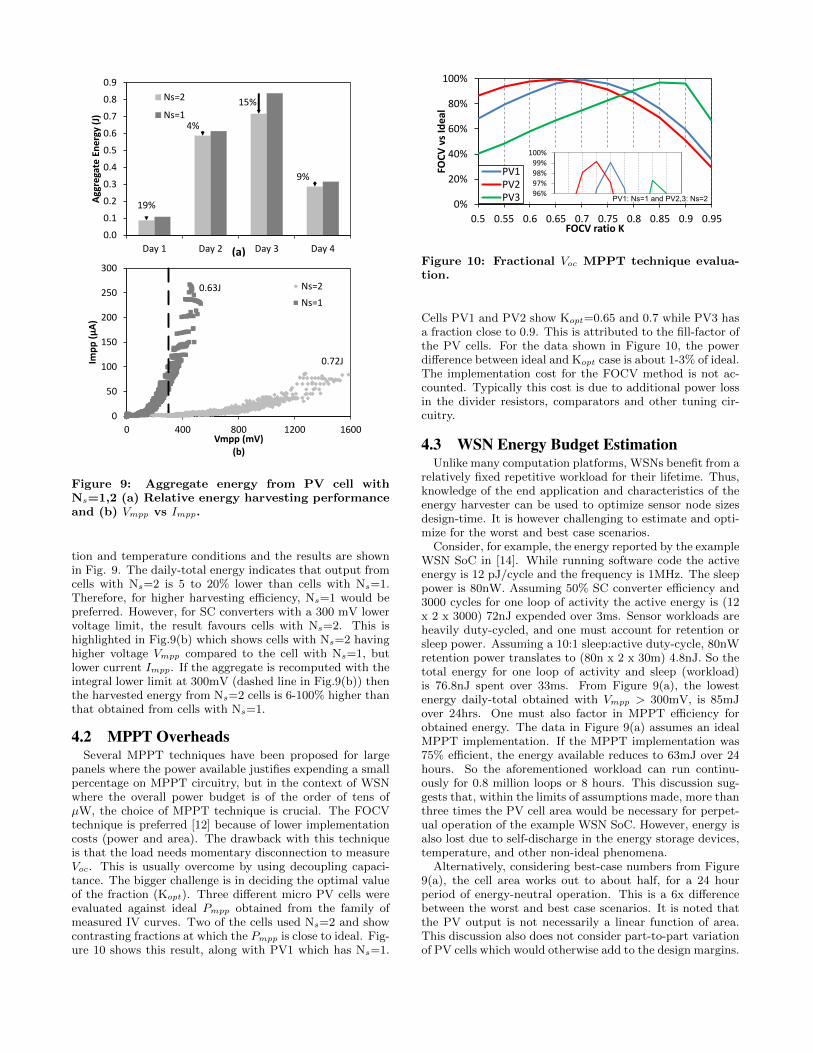
4.1 Characteristics of Harvested EnergyFigure 8 shows plots of data collected using the CS from
a 22 x 7mm monocrystalline PV cell over a four-day period,at the rate of one sweep every two minutes. Indoor officeillumination was used although, as in a real-world scenario,additional scattered illumination from over-cast daylight wasavailable during measurements. It is worth noting that tem-perature is relatively constant (±5C) and Vmpp changes areattributable solely to illumination. The availability of rawIV data removes ambiguity in the maximum power pointlocation, and allows potential strategies for MPPT to beassessed off-line.
Assuming an ideal MPPT technique, the maximum powerthat can be extracted from the DUT is shown, along with thevoltage levels at which Pmpp is obtained (Vmpp). This is akey input for SC converter design: it enables the estimationof conversion ratios and cold-start voltages. Pmpp integratedwith time would be the ideal-case energy budget of the WSNoperating for the same duration.
In practice however, only a fraction of this ideal energy canbe used. Firstly, conventional circuits fail to use harvestedenergy at low voltages and about 30% of the aggregate en-ergy is available at Vmpp < 0.3V . SoC implementations ofSC converters demonstrate functional voltage limits as lowas 0.14V [11] but for voltages below 0.35V the conversionefficiency is limited to 50%. Thus, there is a further en-ergy loss due to the non-ideal harvester-converter interface.Secondly, power conversion losses in the conditioning cir-cuitry will limit Pmpp utilization even when Vmpp > 0.3V .A comprehensive review of integrated implementations ofSC converters [17] shows upto 90% conversion efficiency un-der best-case conditions. However, the temporal variationsof Vmpp limit conversion efficiencies; this calls for carefulchoice of harvester and converter design parameters.
The lower voltage limit on SC converters could potentiallybe overcome by connecting several (Ns) cells in series, to in-crease the PV output voltage. To evaluate the trade-offs, PVcells with Ns=1 and 2 were measured under similar illumina-
Figure 8: Plot of energy harvested over six days.
19%
4%
15%
9%
0.0
0.1
0.2
0.3
0.4
0.5
0.6
0.7
0.8
0.9
Day 1 Day 2 Day 3 Day 4
Agg
rega
te E
ne
rgy
(J)
(a)
Ns=2
Ns=1
0.72J
0.63J
0
50
100
150
200
250
300
0 400 800 1200 1600
Imp
p (
µA
)
Vmpp (mV)(b)
Ns=2
Ns=1
Figure 9: Aggregate energy from PV cell withNs=1,2 (a) Relative energy harvesting performanceand (b) Vmpp vs Impp.
tion and temperature conditions and the results are shownin Fig. 9. The daily-total energy indicates that output fromcells with Ns=2 is 5 to 20% lower than cells with Ns=1.Therefore, for higher harvesting efficiency, Ns=1 would bepreferred. However, for SC converters with a 300 mV lowervoltage limit, the result favours cells with Ns=2. This ishighlighted in Fig.9(b) which shows cells with Ns=2 havinghigher voltage Vmpp compared to the cell with Ns=1, butlower current Impp. If the aggregate is recomputed with theintegral lower limit at 300mV (dashed line in Fig.9(b)) thenthe harvested energy from Ns=2 cells is 6-100% higher thanthat obtained from cells with Ns=1.
4.2 MPPT OverheadsSeveral MPPT techniques have been proposed for large
panels where the power available justifies expending a smallpercentage on MPPT circuitry, but in the context of WSNwhere the overall power budget is of the order of tens ofµW, the choice of MPPT technique is crucial. The FOCVtechnique is preferred [12] because of lower implementationcosts (power and area). The drawback with this techniqueis that the load needs momentary disconnection to measureVoc. This is usually overcome by using decoupling capaci-tance. The bigger challenge is in deciding the optimal valueof the fraction (Kopt). Three different micro PV cells wereevaluated against ideal Pmpp obtained from the family ofmeasured IV curves. Two of the cells used Ns=2 and showcontrasting fractions at which the Pmpp is close to ideal. Fig-ure 10 shows this result, along with PV1 which has Ns=1.
0%
20%
40%
60%
80%
100%
0.5 0.55 0.6 0.65 0.7 0.75 0.8 0.85 0.9 0.95
FOC
V v
s Id
eal
FOCV ratio K
PV1PV2PV3 96%
97%
98%
99%
100%
PV1: Ns=1 and PV2,3: Ns=2
Figure 10: Fractional Voc MPPT technique evalua-tion.
Cells PV1 and PV2 show Kopt=0.65 and 0.7 while PV3 hasa fraction close to 0.9. This is attributed to the fill-factor ofthe PV cells. For the data shown in Figure 10, the powerdifference between ideal and Kopt case is about 1-3% of ideal.The implementation cost for the FOCV method is not ac-counted. Typically this cost is due to additional power lossin the divider resistors, comparators and other tuning cir-cuitry.
4.3 WSN Energy Budget EstimationUnlike many computation platforms, WSNs benefit from a
relatively fixed repetitive workload for their lifetime. Thus,knowledge of the end application and characteristics of theenergy harvester can be used to optimize sensor node sizesdesign-time. It is however challenging to estimate and opti-mize for the worst and best case scenarios.
Consider, for example, the energy reported by the exampleWSN SoC in [14]. While running software code the activeenergy is 12 pJ/cycle and the frequency is 1MHz. The sleeppower is 80nW. Assuming 50% SC converter efficiency and3000 cycles for one loop of activity the active energy is (12x 2 x 3000) 72nJ expended over 3ms. Sensor workloads areheavily duty-cycled, and one must account for retention orsleep power. Assuming a 10:1 sleep:active duty-cycle, 80nWretention power translates to (80n x 2 x 30m) 4.8nJ. So thetotal energy for one loop of activity and sleep (workload)is 76.8nJ spent over 33ms. From Figure 9(a), the lowestenergy daily-total obtained with Vmpp > 300mV, is 85mJover 24hrs. One must also factor in MPPT efficiency forobtained energy. The data in Figure 9(a) assumes an idealMPPT implementation. If the MPPT implementation was75% efficient, the energy available reduces to 63mJ over 24hours. So the aforementioned workload can run continu-ously for 0.8 million loops or 8 hours. This discussion sug-gests that, within the limits of assumptions made, more thanthree times the PV cell area would be necessary for perpet-ual operation of the example WSN SoC. However, energy isalso lost due to self-discharge in the energy storage devices,temperature, and other non-ideal phenomena.
Alternatively, considering best-case numbers from Figure9(a), the cell area works out to about half, for a 24 hourperiod of energy-neutral operation. This is a 6x differencebetween the worst and best case scenarios. It is noted thatthe PV output is not necessarily a linear function of area.This discussion also does not consider part-to-part variationof PV cells which would otherwise add to the design margins.

If the sensor hardware is fixed, then the duty-cycle can bethrottled to ensure a 24hr operation. In the example statedearlier, a 30:1 duty-cycle would provide a 24hr operation forthe same PV cell area or sensor volume.
Summarily, the proposed method and model helps drawout specifications for SC converters, choose the appropri-ate MPPT technique and specify design requirements forMPPT implementations. The overall view helps estimateWSN energy budgets and workloads for the sensor. Theenergy estimate also has implications on the type and sizeof battery or super-capacitor that can be used in a sensornode design. By relying on field measurements, addressingvariation and potential worst-case conditions this modelingmethod helps design integrated WSNs with tighter toler-ances at lower costs.
5. CONCLUSIONSWSNs must rely on energy harvesting for perpetual op-
eration and longer active lifetimes. The design of energy-neutral WSNs with small form factors would be less opti-mal without design-time verification of extreme and typicalcorner cases. This work has presented a measurement andcharacterization platform for micro PV cells which providesmuch-needed data for generating a PV model to be used forWSN SoC co-simulations. In addition, the data helped iden-tify key differences in conventional rules-of-thumb that areapplied to large PV panels. Also, example analysis showedhow MPPT techniques, their implementation and WSN en-ergy budgets can be cost-effectively evaluated using datagenerated by the characterization platform.
6. ACKNOWLEDGEMENTSAuthors acknowledge Shidhartha Das for support with
SPICE modeling and Andrew Kufel for assistance with fab-rication.
7. REFERENCES[1] S. Bobovych, N. Banerjee, R. Robucci, J. P.
Parkerson, J. Schmandt, and C. Patel. SunaPlayer:High-accuracy Emulation of Solar Cells, 2015.
[2] S. Boisseau, G. Despesse, and B. A. Seddik.Electrostatic Conversion for Vibration EnergyHarvesting, Oct. 2012.
[3] D. Chan and J. Phang. Analytical methods for theextraction of solar-cell single- and double-diode modelparameters from I-V characteristics, Feb 1987.
[4] D. Dondi, D. Brunelli, L. Benini, P. Pavan,A. Bertacchini, and L. Larcher. Photovoltaic cellmodeling for solar energy powered sensor networks,June 2007.
[5] M. Fojtik, D. Kim, G. Chen, Y.-S. Lin, D. Fick,J. Park, M. Seok, M.-T. Chen, Z. Foo, D. Blaauw, andD. Sylvester. A Millimeter-Scale Energy-AutonomousSensor System With Stacked Battery and Solar Cells,March 2013.
[6] M. Glass. Improved solar array power point modelwith SPICE realization, Aug 1996.
[7] J. Hester, T. Scott, and J. Sorber. Ekho: Realistic andRepeatable Experimentation for TinyEnergy-harvesting Sensors, 2014.
[8] Y.-P. Huang. A Rapid Maximum Power MeasurementSystem for High-Concentration Photovoltaic ModulesUsing the Fractional Open-Circuit Voltage Techniqueand Controllable Electronic Load, Nov 2014.
[9] J. Jeong and D. Culler. A Practical Theory ofMicro-solar Power Sensor Networks, Nov. 2012.
[10] J.-E. Jeong, J.-H. Bae, J. Lee, C. S. Lee, J.-H. Chun,and K.-W. Kwon. A Photovoltaic Power ManagementSystem using a Luminance-Controlled Oscillator forUSN Applications, 2013.
[11] W. Jung, S. Oh, S. Bang, Y. Lee, D. Sylvester, andD. Blaauw. A 3nW fully integrated energy harvesterbased on self-oscillating switched-capacitor DC-DCconverter, Feb 2014.
[12] K. Kadirvel, Y. Ramadass, U. Lyles, J. Carpenter,V. Ivanov, V. McNeil, A. Chandrakasan, andB. Lum-Shue-Chan. A 330nA energy-harvestingcharger with battery management for solar andthermoelectric energy harvesting, Feb 2012.
[13] J. Kwong, Y. Ramadass, N. Verma, M. Koesler,K. Huber, H. Moormann, and A. Chandrakasan. A65nm Sub-Vt Microcontroller with Integrated SRAMand Switched-Capacitor DC-DC Converter, Feb 2008.
[14] J. Myers, A. Savanth, D. Howard, R. Gaddh,P. Prabhat, and D. Flynn. An 80nW retention11.7pJ/cycle active subthreshold ARM Cortex-M0+subsystem in 65nm CMOS for WSN applications, Feb2015.
[15] M. C. D. Piazza and G. Vitale. Photovoltaic sources -modeling and emulationl, 2013.
[16] J. Sarik, K. Kim, M. Gorlatova, I. Kymissis, andG. Zussman. More than meets the eye - A portablemeasurement unit for characterizing light energyavailability, Dec 2013.
[17] G. Villar-Pique, H. Bergveld, and E. Alarcon. Surveyand Benchmark of Fully Integrated Switching PowerConverters: Switched-Capacitor Versus InductiveApproach, Sept 2013.
[18] U. Zimmermann and M. Edoff. A Maximum PowerPoint Tracker for Long-Term Logging of PV ModulePerformance, Jan 2012.