Embed Size (px)
Citation preview
fpls-09-01265 August 28, 2018 Time: 19:30 # 1
ORIGINAL RESEARCHpublished: 30 August 2018
doi: 10.3389/fpls.2018.01265
Edited by:Wolfgang Hoehenwarter,
Leibniz-Institut für Pflanzenbiochemie(IPB), Germany
Reviewed by:Dirk Dobritzsch,
Martin Luther Universityof Halle-Wittenberg, Germany
Michael Hippler,Universität Münster, Germany
*Correspondence:Timo Mühlhaus
mü[email protected] Schroda
†These authors have contributedequally to this work
Specialty section:This article was submitted to
Plant Proteomics,a section of the journal
Frontiers in Plant Science
Received: 30 April 2018Accepted: 10 August 2018Published: 30 August 2018
Citation:Hammel A, Zimmer D, Sommer F,
Mühlhaus T and Schroda M (2018)Absolute Quantification of Major
Photosynthetic Protein Complexesin Chlamydomonas reinhardtii Using
Quantification Concatamers(QconCATs). Front. Plant Sci. 9:1265.
doi: 10.3389/fpls.2018.01265
Absolute Quantification of MajorPhotosynthetic Protein Complexes inChlamydomonas reinhardtii UsingQuantification Concatamers(QconCATs)Alexander Hammel†, David Zimmer†, Frederik Sommer†, Timo Mühlhaus* andMichael Schroda*
Molekulare Biotechnologie und Systembiologie, Technische Universität Kaiserslautern, Kaiserslautern, Germany
For modeling approaches in systems biology, knowledge of the absolute abundancesof cellular proteins is essential. One way to gain this knowledge is the use ofquantification concatamers (QconCATs), which are synthetic proteins consisting ofproteotypic peptides derived from the target proteins to be quantified. The QconCATprotein is labeled with a heavy isotope upon expression in E. coli and known amountsof the purified protein are spiked into a whole cell protein extract. Upon trypticdigestion, labeled and unlabeled peptides are released from the QconCAT protein andthe native proteins, respectively, and both are quantified by LC-MS/MS. The labeledQ-peptides then serve as standards for determining the absolute quantity of the nativepeptides/proteins. Here, we have applied the QconCAT approach to Chlamydomonasreinhardtii for the absolute quantification of the major proteins and protein complexesdriving photosynthetic light reactions in the thylakoid membranes and carbon fixation inthe pyrenoid. We found that with 25.2 attomol/cell the Rubisco large subunit makes up6.6% of all proteins in a Chlamydomonas cell and with this exceeds the amount of thesmall subunit by a factor of 1.56. EPYC1, which links Rubisco to form the pyrenoid, iseight times less abundant than RBCS, and Rubisco activase is 32-times less abundantthan RBCS. With 5.2 attomol/cell, photosystem II is the most abundant complexinvolved in the photosynthetic light reactions, followed by plastocyanin, photosystemI and the cytochrome b6/f complex, which range between 2.9 and 3.5 attomol/cell.The least abundant complex is the ATP synthase with 2 attomol/cell. While applying theQconCAT approach, we have been able to identify many potential pitfalls associatedwith this technique. We analyze and discuss these pitfalls in detail and provide anoptimized workflow for future applications of this technique.
Keywords: mass spectrometry, proteotypic peptide, QconCATs, photosynthesis, light reactions, pyrenoid,Rubisco, Chlamydomonas reinhardtii
Frontiers in Plant Science | www.frontiersin.org 1 August 2018 | Volume 9 | Article 1265
fpls-09-01265 August 28, 2018 Time: 19:30 # 2
Hammel et al. Applying QconCATs to Chlamydomonas
INTRODUCTION
Chlamydomonas reinhardtii has been used since many decades asa model system to study various aspects of cell biology (Harris,2008). Recent advancements, like the development of robustprotocols for genome editing (Ferenczi et al., 2017; Greineret al., 2017) or the establishment of an indexed mutant librarycomprising about 60,000 mutants (Li et al., 2016), will furtherboost Chlamydomonas as a plant model system. As a unicellulargreen alga, Chlamydomonas is particularly suited for plantsystems biology approaches (Hemme et al., 2014). Importantespecially for mathematical modeling in systems biology is theknowledge of the absolute concentrations of biomolecules in acell (Pratt et al., 2006). For proteins, this information is difficultto obtain and before the introduction of mass spectrometrywas done for example by photospectroscopy on proteinsharboring light-absorbing cofactors, by radioligand assays, orby immunoassays requiring protein standards (Merchant et al.,1991; Murakami et al., 1997; Willmund et al., 2008).
Mass spectrometry-based shotgun or discovery proteomicsaims at identifying a large number of cellular proteins andallows to quantify changes in the abundance of a subset ofthese proteins e.g., upon changing environmental conditions(Gillet et al., 2016). However, because standards are missing, thisapproach does not allow determining the absolute abundanceof a protein within a cell. A common way to achieve this is tospike a known amount of synthetic peptides that mimic peptidesproduced by the proteolytic cleavage of target analyte proteins,into a whole cell protein extract. Either the synthetic peptides orthe proteins in the extract are labeled with stable isotopes, thusleading to light and heavy peptide pairs after proteolytic cleavage.After ionization, these pairs can be separated and quantifiedby mass spectrometry, with the synthetic peptide serving ascalibrator (Barnidge et al., 2003; Gerber et al., 2003). Thisapproach has already been applied to Chlamydomonas: in onestudy, PSI-LHCI complexes were isolated from Chlamydomonascells that had been metabolically labeled by feeding an arginine-auxotrophic strain with 13C-arginine. Known amounts ofunlabeled proteotypic peptides from PSI and LHCI were thenadded to purified 13C-labeled PSI-LHCI complexes and proteinstoichiometries in the complex determined (Stauber et al., 2009).In two more studies, isotope-labeled peptides were spiked intoextracts from unlabeled Chlamydomonas cells to determineabsolute abundances of proteins involved in a variety of cellularprocesses (Wienkoop et al., 2010; Recuenco-Munoz et al., 2014).The advantage of these approaches is that they allow the absolutequantification of several target proteins in a single MS run. Thedisadvantages are the cost of the synthetic peptides, especiallyif they need to be synthesized with stable isotopes for a largenumber of target proteins, and the difficulty to quantify thesepeptides accurately, because of their tendency to irreversiblyadhere to vessel walls (Brownridge et al., 2011).
These problems may be circumvented by using so-calledquantification concatamers (QconCATs) (Beynon et al., 2005;Pratt et al., 2006). QconCATs consist of concatenated proteotypicpeptides, an affinity tag allowing purification under denaturingconditions (usually a hexa-histidine tag) and, optionally, amino
acids like cysteine or tryptophane for easy quantification.A QconCAT protein is expressed in E. coli from an in silicodesigned, codon-optimized synthetic gene cloned into anexpression vector. A defined amount of the QconCAT protein isthen added to the complex sample and, upon tryptic digestion,the proteotypic peptides from the QconCAT protein are releasedtogether with the corresponding peptides from the parentproteins. All QconCAT peptides are present in a strict 1:1ratio at the concentration determined for the entire protein.The QconCAT protein can be heavy labeled in E. coli, or theunlabeled protein added to labeled proteins from the targetorganism. A QconCAT protein has been used to quantify changesin the abundance of vacuolar transporters in tonoplast-enrichedfractions from leaves of Arabidopsis thaliana plants exposed tosalinity and drought (Pertl-Obermeyer et al., 2016). However, weare not aware of any reports on the use of QconCAT proteins forthe absolute quantification of proteins in Chlamydomonas.
Here, we report on the application of the QconCAT approachto Chlamydomonas reinhardtii for the absolute quantificationof major proteins and protein complexes in the thylakoidmembranes and in the pyrenoid that carry out photosyntheticlight reactions and carbon fixation, respectively. We analyzeproblems encountered with the QconCAT approach and providerecommendations for labs interested in applying this techniqueto Chlamydomonas or other organisms.
MATERIALS AND METHODS
Growth of Chlamydomonas CellsCells of Chlamydomonas reinhardtii strain CC-1883 were grownin TAP medium (Kropat et al., 2011) at a light intensity of30 µmol photons m−2 s−1 to mid log phase. Cells were harvestedby centrifugation for 2 min at 3,000 × g and 4◦C, resuspendedin 25 mM NH4HCO3, aliquoted at a final cell density of about5.9× 108 cells ml−1, snap-frozen in liquid nitrogen, and stored at−20◦C. The total protein concentration was measured accordingto Lowry et al. (1951).
QconCAT Protein Expression andPurificationThe coding sequence for the photosynthesis QconCAT protein(PS-Qprot) was codon-optimized for E. coli, synthesized byBiocat (Heidelberg) harboring BamHI/HindIII restriction sites,cloned into the pET-21b expression vector (Novagen), andtransformed into E. coli ER2566 cells (New England Biolabs). For15N-labeling of the PS-Qprot, M9 minimal medium was preparedwith 9.2 mM 15NH4Cl (98%, Cambridge Isotope Laboratories)and 100 µg ml−1 Ampicillin. Transformed ER2566 cells weregrown overnight at 37◦C in 15N-M9 medium (Scott et al., 2016),diluted 1:50 into 300 ml 15N-M9 medium and grown to an ODof ∼0.8 when protein expression was induced by adding IPTGto a final concentration of 0.5 mM. After another 5 h at 37◦C,cells were harvested by centrifugation for 10 min at 6,000 × gand 4◦C and the cell pellet was stored at −20◦C. Cells were lysedby sonication in 6 M guanidine-HCl, 20 mM Tris-HCl pH 8, 0.25M NaCl, 5 mM imidazole and cleared by a 20-min centrifugation
Frontiers in Plant Science | www.frontiersin.org 2 August 2018 | Volume 9 | Article 1265

fpls-09-01265 August 28, 2018 Time: 19:30 # 3
Hammel et al. Applying QconCATs to Chlamydomonas
at 13,000 × g and 20◦C. The supernatant was applied to a Co-NTA column (G-Biosciences) followed by three washes withUrea Buffer (8 M urea, 20 mM Tris-HCl pH 8, 0.25 M NaCl)containing 5 mM, 25 mM, and 100 mM imidazole, respectively.The PS-Qprot was then eluted with Urea Buffer containing500 mM imidazole. Next, the eluted protein was electrophoresedon a preparative 12% SDS-polyacrylamide gel and the gel wasnegatively stained with 0.3 M CuCl2. The protein band wasexcised and, after three washes with 0.25 mM EDTA, 0.25 mMTris-HCl pH 9 for destaining, the PS-Qprot was electroeluted byplacing the gel slice in Laemmli Buffer (24.8 mM Tris, 134.2 mMglycin, 0.1% SDS and 1 mM EDTA) into a dialysis bag with 3.5kDa MWCO (Spectrum Inc.) and applying 100 V for 1 h. Theeluted protein was concentrated and dialyzed into phosphate-buffered saline. The protein concentration was determinedspectroscopically at 280 nm on a NanoDrop spectrophotometerbased on the Lambert-Beer’s law assuming a molecular weightof the PS-Qprot of 39,945.63 and an extinction coefficient of86,860 M−1 cm−1. The latter were determined with the ExPASyProtParam tool1. The protein concentration was adjusted to1 µg/µl and the protein was stored at−20◦C.
In Solution Tryptic Digest and LC-MS/MSAnalysisFifty micrograms of total C. reinhardtii protein (correspondingto 3.87 × 10⁶ cells) were mixed with 0.25, 0.5, 2.5, and 5 µg PS-Qprot, respectively, and precipitated overnight at −20◦C afteradding ice-cold acetone to a final volume of 80%. 1 µg of the PS-Qprot were also precipitated with acetone without C. reinhardtiiprotein to obtain a total ion count of the Q-peptides alone.Precipitated proteins were pelleted by centrifugation for 20 minat 25,000 × g and 4◦C. After washing with 80% acetone, thepelleted proteins were air-dried and resuspended in 8 M urea,25 mM NH4HCO3. The samples were then supplied with DTTat a final concentration of 12.5 mM, incubated for 30 min at 25◦Cand, to carboxymethylate reduced thiols, incubated for another20 min in the dark in the presence of iodoacetamide at a finalconcentration of 25 mM. After diluting samples with 25 mMNH4HCO3 to a final urea concentration of 4 M, Lys-C was addedat a ratio of 1:100 (w/w, Lys-C to protein) and digestion allowedto take place for at least 2 h at 37◦C. Samples were further dilutedwith 25 mM NH4HCO3 to a final urea concentration of 1 Mand supplemented with acetonitrile to a final concentration of5%. Trypsin was then added at a ratio of 1:100 (w/w, trypsin toprotein) and proteins allowed to digest overnight at 37◦C. Tocomplete digestion, more trypsin was added to yield a ratio of 1:50and the samples incubated for another 3 h at 37◦C. Digestion wasterminated by adding formic acid at a final concentration of 2%.Tryptic peptides were desalted on home-made C18-STAGE tips(Empore), eluted with a solution of 80% acetonitrile/2% formicacid, dried to completion in a speed vac and stored at −20◦C.Peptides were resuspended in a solution of 2% acetonitrile, 2%formic acid just before the LC-MS/MS run. The LC-MS/MSsystem (Eksigent nanoLC 425 coupled to a TripleTOF 6600,ABSciex) was operated in µ-flow mode using a 25 µ-emitter
1https://web.expasy.org/protparam
needle in the ESI source. Peptides were separated by reversedphase (Triart C18, 5 µm particles, 0.5 mm × 5 mm as trappingcolumn and Triart C18, 3 µm particles, 300 µm × 150 mmas analytical column, YMC) using a flow rate of 4 µl/min andgradients from 2 to 35% HPLC buffer B (buffer A 2% acetonitrile,0.1% formic acid; buffer B 90% acetonitrile, 0.1% formic acid).The efficiency of 15N incorporation in the labeled peptides wasestimated according to Schaff et al. (2008). The intensities forthe monoisotopic, fully 15N labeled peak (Mi) and the preceding,first unlabeled peak (Mi−1), containing one 14N, were extractedusing PeakView v2.2 software (ABSciex) and used for calculatingthe labeling efficiency. BioFsharp2 was used for the extractionof ion chromatograms and for the quantification of peak areasof heavy Q-peptides and light native peptides. Assuming similarionization properties for non-oxidized and oxidized methionine-containing peptides, the percentage of methionine oxidation wasdetermined by extracting XICs for non-oxidized and oxidized(+16 amu) 14N peptides (% oxidation of native peptides) andnon-oxidized and oxidized (+16 amu) 15N peptides (% oxidationof Q-peptides) (Supplementary Dataset 1). The raw data of ourstudy have been uploaded to PeptideAtlas with the identifierPASS01212.
RESULTS
The PS-Qprot Targets Major Soluble andMembrane-Intrinsic PhotosynthesisProteins in ChlamydomonasTo test the applicability of QconCAT proteins for the absolutequantification of membrane-intrinsic and soluble proteins inChlamydomonas reinhardtii, we chose to focus on the majorprotein complexes driving the photosynthetic light reactionsin the thylakoid membranes, as well as the major proteinsresponsible for CO2 fixation in the pyrenoid. The former arephotosystems (PS) I and II, the cytochrome b6/f complex,plastocyanin, and the ATP synthase (Eberhard et al., 2008). Thelatter are Rubisco, the Essential Pyrenoid Component 1 (EPYC1,also known as LCI5) that links Rubisco to form the pyrenoid, andRubisco activase (Mackinder et al., 2016). While plastocyanin,EPYC1 and Rubisco activase are monomers or homooligomers,the other ones represent core subunits of heterooligomericcomplexes, i.e., psbA and psbD of PSII, psaB of PSI, petA of thecytochrome b6/f complex, atpB of the ATP synthase, and rbcLand RBCS of Rubisco. For each of these 10 proteins analyzed weselected two to four different proteotypic tryptic (Q-)peptides inthe mass range of 700–3,000 Da that in earlier studies have beendetected by LC-MS/MS with good ion intensities and normalretention times. Selected RBCS Q-peptides did not distinguishbetween RBCS1 and RBCS2. Hence, these peptides were likelydetectable by LC-MS, but there may have been ones with betterionization propensities. This photosynthesis QconCAT protein(PS-Qprot) also contained two sacrificial tryptic peptides at theN-terminus with the methionine initiator amino acid, and two
2https://github.com/CSBiology
Frontiers in Plant Science | www.frontiersin.org 3 August 2018 | Volume 9 | Article 1265

fpls-09-01265 August 28, 2018 Time: 19:30 # 4
Hammel et al. Applying QconCATs to Chlamydomonas
more at the C-terminus, each containing a hexa-histidine tag(Figure 1A).
The Measured Ratios of Q-Peptides toNative Peptides Correlate Well With theRatios at Which the PS-Qprot WasAdded to Chlamydomonas Cell ExtractThe 39.95-kDa PS-Qprot was expressed in E. coli cells grownin 15N-M9 minimal medium for stable isotope labeling. Thetandem hexa-histidine tag at the C-terminus ensured that onlyfully translated protein species were purified on the Co-NTAcolumn and allowed stringent washes with high imidazoleconcentrations to efficiently remove impurities. Nevertheless,the PS-Qprot was additionally purified by electrophoresis onan SDS-polyacrylamide gel, followed by electroelution of theprotein from the excised gel band. The eluted PS-Qprot wasquantified spectroscopically based on the presence of 14 Tyrand 12 Trp residues and correct quantification was verifiedby separating the PS-Qprot together with a BSA standard onan SDS-polyacrylamide gel and staining with Coomassie blue(Figure 1B). The 15N-labeled PS-Qprot was first subjected totryptic digestion alone and peptides were analyzed by LC-MS/MS using a short 6-min gradient to record a total ion count(Figure 1C). The latter shows that the Q-peptides separate withcharacteristic retention times and ion intensities that despite thestrict 1:1 stoichiometry of the peptides vary by a factor of about400. The labeling efficiency, as determined from 20 peptides, was99.8± 0.033% (SD).
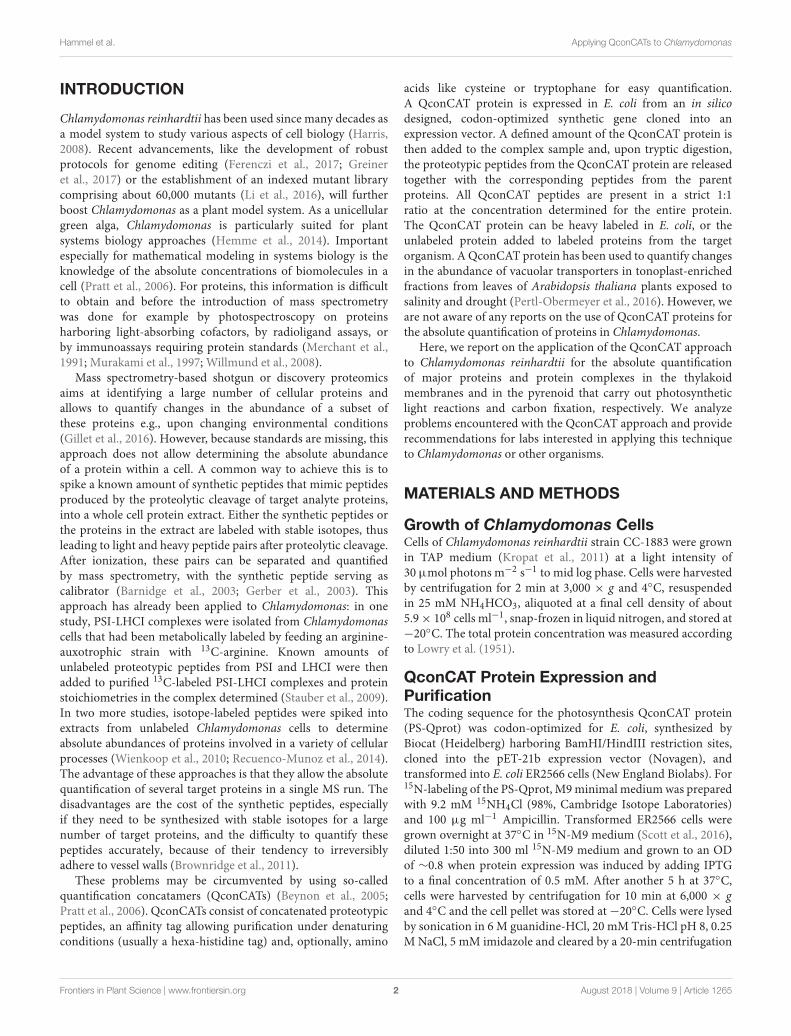
Next, 0.25, 0.5, 2.5, and 5 µg of the 15N-labeled PS-Qprotwere mixed with 50 µg of (14N) whole-cell proteins frommixotrophically grown Chlamydomonas. We employed only onepreparation of the PS-Qprot, but four independent preparationsof Chlamydomonas cells. Mixed proteins were precipitated withacetone, followed by tryptic digestion in urea and LC-MS/MSanalysis on 45-min analytical gradients. The ion chromatogramsof heavy Q-peptide and light native peptide pairs were extracted,surface areas quantified, and ratios calculated (SupplementaryDataset 1). The mean ratios ranged from 0.08 for rbcL peptideLTYYTPDYVVR in the sample with the smallest amount of PS-Qprot added to Chlamydomonas whole cell proteins up to 178for RCA1 peptide VPLILGIWGGK in the sample with the largestamount of PS-Qprot added. Nevertheless, plotting the ratios ofQ-peptides to native peptides against the amounts of PS-Qprotadded revealed generally a linear relationship for each peptide(Figure 2). Hence, the range of PS-Qprot added appeared tobe well suited for quantifying the photosynthesis target proteinschosen.
Although Target Protein Peptides WereQuantified Robustly, Their AbundancesVaried Considerably Between DifferentPeptides of the Same Target ProteinBased on the ratios of Q-peptide to native peptide and theknown amount of spiked-in PS-Qprot, the abundances of thenative peptides in the sample were calculated (in femtomoles
per 50 µg of cell proteins) (Supplementary Dataset 1). Wedetermined that a Chlamydomonas cell of the CC-1883 strainbackground on average contains 19.9 ± 2.4 pg protein (SD,n = 11; Supplementary Dataset 1), which allowed us to calculatethe absolute amount of each target protein per Chlamydomonascell. Hence, the values shown in Table 1 represent estimatesfor the abundance of a target protein in attomol per cell basedon 16 individual values for every peptide (four amounts of PS-Qprot added to four independent preparations of whole cellextracts). Although the generally low standard deviations indicatethat peptide abundances were estimated robustly, in some casesthe obtained abundance values varied considerably betweenindividual peptides of the same protein. This was particularly truefor peptides of proteins rbcL, RBCS, EPYC1, psbA, and PCY1.For these peptides, also the slopes of the linear regressions in theplots of the ratios of 15N Q-peptide to 14N native peptide againstPS-Qprot added varied considerably (Figure 2). This indicateda consistent over- or underestimation of some native peptides.To aid our interpretation of these results in the Discussion, weused the deep peptide observability predictor (d::pPop) describedby Zimmer et al. (unpublished) in this issue to get scores andranks for estimating the ionization propensities of the Q-peptidesemployed here (Table 1).
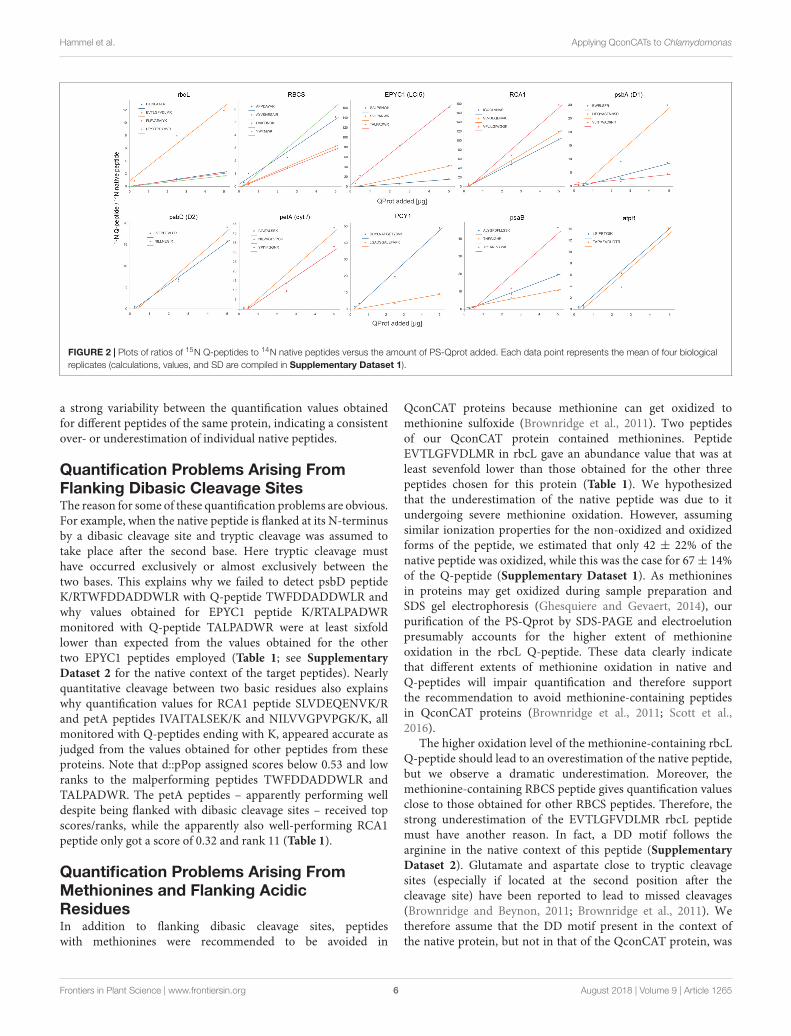
To still get a robust estimate for the absolute abundance ofthe target proteins in the whole cell protein extracts, we used themedian of all 8–16 values (each determined with four biologicalreplicates) obtained for the two to four peptides of a target protein(Table 1). Furthermore, based on this median value and themolecular weight of the mature protein, the fraction of each targetprotein in the whole cell protein extract was estimated (Table 1).With 25.2 attomol/cell the Rubisco large subunit makes up 6.6%of all proteins in a Chlamydomonas cell and with this exceedsthe amount of the small subunit by a factor of 1.56. EPYC1 iseight times less abundant than its proposed interaction partner inpyrenoids, RBCS (Meyer et al., 2012; Mackinder et al., 2016) andRubisco activase is 32-times less abundant than RBCS. Over all,abundances of Rubisco large subunit and Rubisco activase differby a factor of 50. In contrast, abundances of protein (complexes)involved in photosynthetic light reactions differ far less. Ofthese, PS II with 5.2 attomol/cell is most abundant, followed byplastocyanin, PS I and the cytochrome b6/f complex, which rangebetween 2.9 and 3.5 attomol/cell. The least abundant complex isthe ATP synthase with 2 attomol/cell.
DISCUSSION
In this study, we applied the QconCAT strategy to determinethe absolute abundance of 10 membrane-intrinsic and solubleproteins that are involved in driving photosynthetic lightreactions in the thylakoid membrane and CO2 fixation inthe pyrenoid. We could robustly quantify the native peptides,as judged from the generally low standard deviations of thequantification values and the good correlation between ratios of15N Q-peptides to 14N native peptides versus PS-Qprot added toChlamydomonas whole cell extracts in four dilutions (Table 1 andFigure 2). However, for half of our target proteins we observed
Frontiers in Plant Science | www.frontiersin.org 4 August 2018 | Volume 9 | Article 1265

fpls-09-01265 August 28, 2018 Time: 19:30 # 5
Hammel et al. Applying QconCATs to Chlamydomonas
FIGURE 1 | Properties of the PS-Qprot and its Q-peptides. (A) Sequence of the PS-Qprot and protein source of selected Q-peptides. Peptides in gray wereerroneously included and have no native partner peptide. (B) The purified, 15N-labeled PS-Qprot was quantified on a NanoDrop spectrophotometer and theconcentration adjusted to 1 µg/µl. The indicated volumes of the PS-Qprot were then separated next to a BSA standard on a 12%-SDS polyacrylamide gel andstained with Coomassie blue. (C) Extracted ion chromatograms (XICs) of the proteotypic 15N labeled Q-peptides derived from the PS-Qprot. The purified proteinwas tryptically digested and run on a short 6-min HPLC gradient. XICs of the resolved peptides were extracted using the PeakView software (ABSciex). The apex ofthe elution time is given in parentheses behind the peptide sequence. Note that due to the very short run only 28 of the 32 peptides were detected within theretention time window.
Frontiers in Plant Science | www.frontiersin.org 5 August 2018 | Volume 9 | Article 1265
fpls-09-01265 August 28, 2018 Time: 19:30 # 6
Hammel et al. Applying QconCATs to Chlamydomonas
FIGURE 2 | Plots of ratios of 15N Q-peptides to 14N native peptides versus the amount of PS-Qprot added. Each data point represents the mean of four biologicalreplicates (calculations, values, and SD are compiled in Supplementary Dataset 1).
a strong variability between the quantification values obtainedfor different peptides of the same protein, indicating a consistentover- or underestimation of individual native peptides.
Quantification Problems Arising FromFlanking Dibasic Cleavage SitesThe reason for some of these quantification problems are obvious.For example, when the native peptide is flanked at its N-terminusby a dibasic cleavage site and tryptic cleavage was assumed totake place after the second base. Here tryptic cleavage musthave occurred exclusively or almost exclusively between thetwo bases. This explains why we failed to detect psbD peptideK/RTWFDDADDWLR with Q-peptide TWFDDADDWLR andwhy values obtained for EPYC1 peptide K/RTALPADWRmonitored with Q-peptide TALPADWR were at least sixfoldlower than expected from the values obtained for the othertwo EPYC1 peptides employed (Table 1; see SupplementaryDataset 2 for the native context of the target peptides). Nearlyquantitative cleavage between two basic residues also explainswhy quantification values for RCA1 peptide SLVDEQENVK/Rand petA peptides IVAITALSEK/K and NILVVGPVPGK/K, allmonitored with Q-peptides ending with K, appeared accurate asjudged from the values obtained for other peptides from theseproteins. Note that d::pPop assigned scores below 0.53 and lowranks to the malperforming peptides TWFDDADDWLR andTALPADWR. The petA peptides – apparently performing welldespite being flanked with dibasic cleavage sites – received topscores/ranks, while the apparently also well-performing RCA1peptide only got a score of 0.32 and rank 11 (Table 1).
Quantification Problems Arising FromMethionines and Flanking AcidicResiduesIn addition to flanking dibasic cleavage sites, peptideswith methionines were recommended to be avoided in
QconCAT proteins because methionine can get oxidized tomethionine sulfoxide (Brownridge et al., 2011). Two peptidesof our QconCAT protein contained methionines. PeptideEVTLGFVDLMR in rbcL gave an abundance value that was atleast sevenfold lower than those obtained for the other threepeptides chosen for this protein (Table 1). We hypothesizedthat the underestimation of the native peptide was due to itundergoing severe methionine oxidation. However, assumingsimilar ionization properties for the non-oxidized and oxidizedforms of the peptide, we estimated that only 42 ± 22% of thenative peptide was oxidized, while this was the case for 67± 14%of the Q-peptide (Supplementary Dataset 1). As methioninesin proteins may get oxidized during sample preparation andSDS gel electrophoresis (Ghesquiere and Gevaert, 2014), ourpurification of the PS-Qprot by SDS-PAGE and electroelutionpresumably accounts for the higher extent of methionineoxidation in the rbcL Q-peptide. These data clearly indicatethat different extents of methionine oxidation in native andQ-peptides will impair quantification and therefore supportthe recommendation to avoid methionine-containing peptidesin QconCAT proteins (Brownridge et al., 2011; Scott et al.,2016).
The higher oxidation level of the methionine-containing rbcLQ-peptide should lead to an overestimation of the native peptide,but we observe a dramatic underestimation. Moreover, themethionine-containing RBCS peptide gives quantification valuesclose to those obtained for other RBCS peptides. Therefore, thestrong underestimation of the EVTLGFVDLMR rbcL peptidemust have another reason. In fact, a DD motif follows thearginine in the native context of this peptide (SupplementaryDataset 2). Glutamate and aspartate close to tryptic cleavagesites (especially if located at the second position after thecleavage site) have been reported to lead to missed cleavages(Brownridge and Beynon, 2011; Brownridge et al., 2011). Wetherefore assume that the DD motif present in the context ofthe native protein, but not in that of the QconCAT protein, was
Frontiers in Plant Science | www.frontiersin.org 6 August 2018 | Volume 9 | Article 1265
fpls-09-01265 August 28, 2018 Time: 19:30 # 7
Hammel et al. Applying QconCATs to Chlamydomonas
TABLE 1 | Absolute quantification of major proteins and protein complexes involved in driving the photosynthetic light reactions in the thylakoid membrane and CO2
fixation in the pyrenoid.
Protein (complex) d::pPop rank / score Peptide amol/cella amol/cellb % of total cell proteinc
rbcL 1 / 1 DTDILAAFR 24 ± 2.7 25.2 6.6
2 / 0.73 LTYYTPDYVVR 30.7 ± 1.8
3 / 0.68 FLFVAEAIYK 22.1 ± 1.6
5 / 0.6 (EVTLGFVDLMR 3.2 ± 0.6)d
RBCS1/2 1 / 1 AFPDAYVR 8.1 ± 2.3 16.1 1.3
2 / 0.996 AYVSNESAIR 17.4 ± 1.5
3 / 0.82 LVAFDNQK 21.3 ± 4.1
n.d. YWTMWK 13.8 ± 7.6
EPYC1 /LCI5 2 / 0.73 SVLPANWR 2.2 ± 1.0 2.0 0.3
4 / 0.68 SALPSNWK 2.7 ± 1.5
7 / 0.53 (TALPADWR 0.3 ± 0.1)
RCA1 1 / 1 VPLILGIWGGK 0.4 ± 0.1 0.5 0.1
2 / 0.72 IGQQLVNAR 0.6 ± 0.1
11 / 0.32 SLVDEQENVK 0.5 ± 0.1
PSII psbA / D1 1 / 1 VLNTWADIINR 8.3 ± 4.5 5.2 2.0e
3 / 0.88 LIFQYASFNNSR 3.1 ± 1.1
7 / 0.52 EWELSFR 10.9 ± 5.8
psbD / D2 1 / 1 NILLNEGIR 6.3 ± 3.2
2 / 0.95 LVFPEEVLPR 4.7 ± 1.7
7 / 0.32 (TWFDDADDWLR n.d.)
b6/f petA / cyt f 1 / 1 NILVVGPVPGK 2.3 ± 0.9 2.9 0.5
2 / 0.97 IVAITALSEK 3.4 ± 1.4
6 / 0.54 YPIYFGGNR 3.5 ± 1.5
PCY1 1 / 1 LGADSGALEFVPK 9.1 ± 2.7 3.5 0.2
2 / 0.65 DDYLNAPGETYSVK 1.3 ± 0.2
PSI psaB 1 / 1 ALYGFDFLLSSK 3.3 ± 0.7 3.1 1.3
3 / 0.95 TPLANLVYWK 2.5 ± 1.1
12 / 0.19 TNFGIGHR 3.6 ± 0.7
ATP synthase atpB 3 / 0.94 LSIFETGIK 4.9 ± 1.3 6.1f 1.6
7 / 0.72 TAPAFVDLDTR 8.0 ± 3.4
aMean ± SD, n = 4. bMedian of all values (n = 4 × number of peptides). cBased on median and using MWs of mature proteins. dPeptides in parentheses were notquantotypic and quantification values therefore omitted. eD1 + D2. fThere are three atpB subunits per ATPase complex, i.e., this number needs to be divided by 3 toobtain the number of ATP synthases per cell.
why we underestimated the abundance of the native peptide.Note that out of the four rbcL peptides selected, peptideEVTLGFVDLMR received the lowest score (0.6) from d::pPop(Table 1).
Also problematic is PCY1 peptide DDYLNAPGETYSVK.Because it contains the DD motif next to the N-terminaltryptic cleavage site, missed cleavages are likely to takeplace in the QconCAT protein as well as in the nativeprotein. Assuming an equally incomplete digestion in both,quantification values may still be accurate. However, missedcleavages will also affect the peptide placed N-terminallyto DDYLNAPGETYSVK in the QconCAT protein, whichis the second PCY1 peptide employed (LGADSGALEFVPK)(Figure 1). As this peptide is in a different context innative plastocyanin (Supplementary Dataset 2), where itis likely not subject to missed cleavages, we would haveoverestimated the abundance of the native peptide. This wouldexplain approximately sevenfold difference in quantificationvalues obtained for the two PCY1 peptides (Table 1). In
line with these observations, d::pPop assigned a score of 1.0to peptide LGADSGALEFVPK and only of 0.6 to peptideDDYLNAPGETYSVK (Table 1).
Quantification Problems Arising forUnknown ReasonsSome Q-peptides gave quantification results differing from thoseof other Q-peptides from the same protein with none of theobvious explanations applying, i.e., N-terminal dibasic cleavagesites, the presence of methionines, or acidic residues next to thecleavage site. These were RBCS peptide AFPDAYVR and psbApeptide LIFQYASFNNSR, which by d::pPop were ranked firstand third with scores of 1.0 and 0.88, respectively (Table 1).We have three possible explanations for this: first, the nativepeptides might contain posttranslational modifications. Second,they tertiary structures of some proteins might be retained underour digestion conditions and therefore bury tryptic cleavagesites. Third, there might be peptides derived from other proteins
Frontiers in Plant Science | www.frontiersin.org 7 August 2018 | Volume 9 | Article 1265
fpls-09-01265 August 28, 2018 Time: 19:30 # 8
Hammel et al. Applying QconCATs to Chlamydomonas
in the complex Chlamydomonas cell extract that are isobaricwith the labeled Q-peptide or the unlabeled native peptide andtherefore influence the extracted ion chromatograms used forquantification.
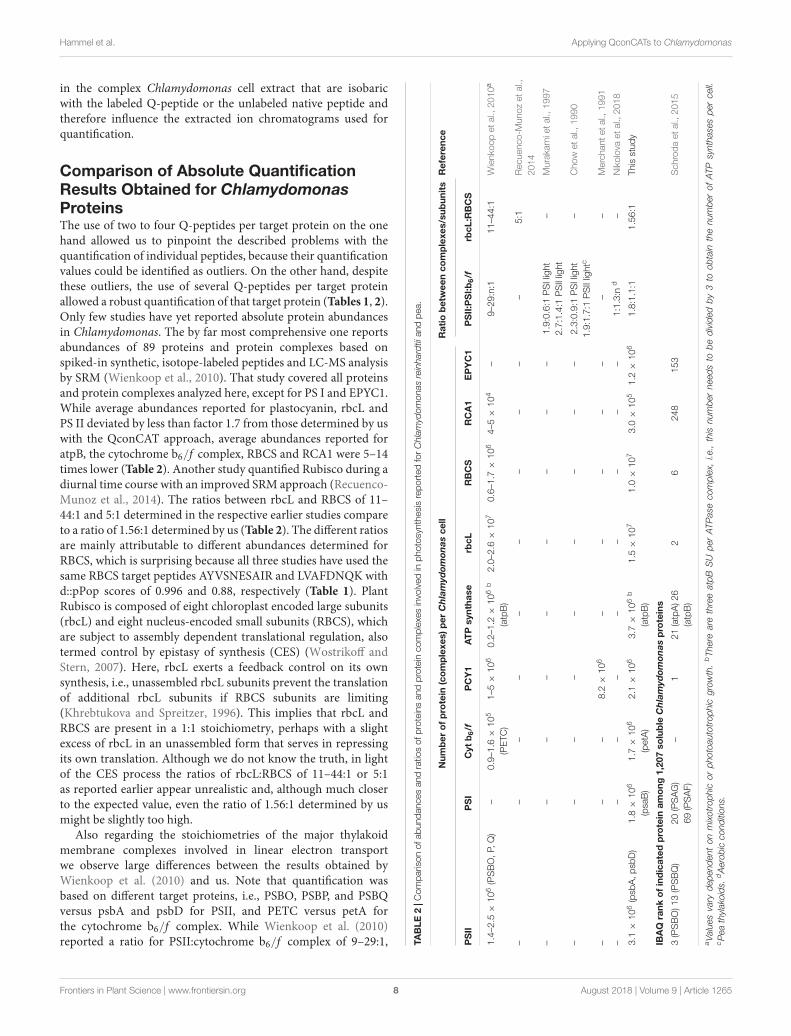
Comparison of Absolute QuantificationResults Obtained for ChlamydomonasProteinsThe use of two to four Q-peptides per target protein on the onehand allowed us to pinpoint the described problems with thequantification of individual peptides, because their quantificationvalues could be identified as outliers. On the other hand, despitethese outliers, the use of several Q-peptides per target proteinallowed a robust quantification of that target protein (Tables 1, 2).Only few studies have yet reported absolute protein abundancesin Chlamydomonas. The by far most comprehensive one reportsabundances of 89 proteins and protein complexes based onspiked-in synthetic, isotope-labeled peptides and LC-MS analysisby SRM (Wienkoop et al., 2010). That study covered all proteinsand protein complexes analyzed here, except for PS I and EPYC1.While average abundances reported for plastocyanin, rbcL andPS II deviated by less than factor 1.7 from those determined by uswith the QconCAT approach, average abundances reported foratpB, the cytochrome b6/f complex, RBCS and RCA1 were 5–14times lower (Table 2). Another study quantified Rubisco during adiurnal time course with an improved SRM approach (Recuenco-Munoz et al., 2014). The ratios between rbcL and RBCS of 11–44:1 and 5:1 determined in the respective earlier studies compareto a ratio of 1.56:1 determined by us (Table 2). The different ratiosare mainly attributable to different abundances determined forRBCS, which is surprising because all three studies have used thesame RBCS target peptides AYVSNESAIR and LVAFDNQK withd::pPop scores of 0.996 and 0.88, respectively (Table 1). PlantRubisco is composed of eight chloroplast encoded large subunits(rbcL) and eight nucleus-encoded small subunits (RBCS), whichare subject to assembly dependent translational regulation, alsotermed control by epistasy of synthesis (CES) (Wostrikoff andStern, 2007). Here, rbcL exerts a feedback control on its ownsynthesis, i.e., unassembled rbcL subunits prevent the translationof additional rbcL subunits if RBCS subunits are limiting(Khrebtukova and Spreitzer, 1996). This implies that rbcL andRBCS are present in a 1:1 stoichiometry, perhaps with a slightexcess of rbcL in an unassembled form that serves in repressingits own translation. Although we do not know the truth, in lightof the CES process the ratios of rbcL:RBCS of 11–44:1 or 5:1as reported earlier appear unrealistic and, although much closerto the expected value, even the ratio of 1.56:1 determined by usmight be slightly too high.
Also regarding the stoichiometries of the major thylakoidmembrane complexes involved in linear electron transportwe observe large differences between the results obtained byWienkoop et al. (2010) and us. Note that quantification wasbased on different target proteins, i.e., PSBO, PSBP, and PSBQversus psbA and psbD for PSII, and PETC versus petA forthe cytochrome b6/f complex. While Wienkoop et al. (2010)reported a ratio for PSII:cytochrome b6/f complex of 9–29:1, TA
BLE
2|C
ompa
rison
ofab
unda
nces
and
ratio
sof
prot
eins
and
prot
ein
com
plex
esin
volv
edin
phot
osyn
thes
isre
port
edfo
rC
hlam
ydom
onas
rein
hard
tiian
dpe
a.
Num
ber
of
pro
tein
(co
mp
lexe
s)p
erC
hla
myd
omon
asce
llR
atio
bet
wee
nco
mp
lexe
s/su
bun
its
Ref
eren
ce
PS
IIP
SI
Cyt
b6/f
PC
Y1
AT
Psy
ntha
serb
cLR
BC
SR
CA
1E
PY
C1
PS
II:P
SI:b
6/f
rbcL
:RB
CS
1.4–
2.5×
106
(PS
BO
,P,Q
)–
0.9–
1.6×
105
(PE
TC)
1–5×
106
0.2–
1.2×
106
b
(atp
B)
2.0–
2.6×
107
0.6–
1.7×
106
4–5×
104
–9–
29:n
:111
–44:
1W
ienk
oop
etal
.,20
10a
––
––
––
––
––
5:1
Rec
uenc
o-M
unoz
etal
.,20
14
––
––
––
––
–1.
9:0.
6:1
PS
Ilig
ht2.
7:1.
4:1
PS
IIlig
ht–
Mur
akam
ieta
l.,19
97
––
––
––
––
–2.
3:0.
9:1
PS
Ilig
ht1.
9:1.
7:1
PS
IIlig
htc
–C
how
etal
.,19
90
––
–8.
2×
106
––
––
––
–M
erch
ante
tal.,
1991
––
––
––
––
–1:
1.3:
nd
–N
ikol
ova
etal
.,20
18
3.1×
106
(psb
A,p
sbD
)1.
8×
106
(psa
B)
1.7×
106
(pet
A)
2.1×
106
3.7×
106
b
(atp
B)
1.5×
107
1.0×
107
3.0×
105
1.2×
106
1.8:
1.1:
11.
56:1
This
stud
y
IBA
Qra
nko
fin
dic
ated
pro
tein
amo
ng1,
207
solu
ble
Ch
lam
ydom
onas
pro
tein
s
3(P
SB
O)1
3(P
SB
Q)
20(P
SA
G)
69(P
SA
F)–
121
(atp
A)2
6(a
tpB
)2
624
815
3S
chro
daet
al.,
2015
aVa
lues
vary
depe
nden
ton
mix
otro
phic
orph
otoa
utot
roph
icgr
owth
.bTh
ere
are
thre
eat
pBS
Upe
rAT
Pas
eco
mpl
ex,
i.e.,
this
num
ber
need
sto
bedi
vide
dby
3to
obta
inth
enu
mbe
rof
ATP
synt
hase
spe
rce
ll.cP
eath
ylak
oids
.dA
erob
icco
nditi
ons.
Frontiers in Plant Science | www.frontiersin.org 8 August 2018 | Volume 9 | Article 1265

fpls-09-01265 August 28, 2018 Time: 19:30 # 9
Hammel et al. Applying QconCATs to Chlamydomonas
we determined a ratio for PSII:PSI:cytochrome b6/f complex of1.8:1.1:1. The latter fits well with ratios determined previously byspectroscopy in Chlamydomonas cells (Murakami et al., 1997)and in pea thylakoids (Chow et al., 1990) (Table 2). Also theratio for PSI:plastocyanin of 1:1.4, determined in a previousstudy based on spiked-in purified proteins, heavy labeled cellextracts and mass spectrometry (Nikolova et al., 2018), fits wellto the ratio of 1:1.2 determined here by the QconCAT approach(Table 2). MS2-based quantification via SRM as performed byWienkoop et al. (2010) and Recuenco-Munoz et al. (2014) isexpected to produce more accurate results than the MS1-basedquantification used here by us because of the high selectivity ofMS2-based quantification (Lange et al., 2008). So, what might bethe reason for the differences observed between the three studies?All studies used very similar digestion protocols, thus ruling outincomplete digestion as a possible cause. A striking difference,however, are different protocols for the extraction of cellularproteins: in the studies by Wienkoop et al. (2010) and Recuenco-Munoz et al. (2014), frozen cell pellets were homogenized ina mortar in the presence of a detergent-free extraction bufferand supernatants obtained after centrifugation were used forabsolute quantification. This may have resulted in incompleteextraction of some proteins (RBCS, RCA1, PETC, atpB) whileothers were well extracted (rbcL, PCY1, PSBO, PSBP, PSBQ). Incontrast, we directly added acetone to cell suspensions to directlyprecipitate all cellular proteins and avoid any prefractionationsteps.
Conclusions and Recommendations forAbsolute Quantification via QconCATProteinsWe conclude that absolute quantification of cellular proteins isno easy task. However, the QconCAT approach appears suitableif care is taken to avoid the many potential pitfalls associated withit. From what we have learned in this study, we recommend thefollowing workflow: first, d::pPop trained on the target organismshould be run on the chosen target proteins. Next, the peptideswith the highest d::pPop scores should be inspected manuallyfollowing the rules forwarded previously (Brownridge et al., 2011;Scott et al., 2016) to avoid in this order: (i) peptides harboringacidic residues next to their cleavage sites; (ii) peptides flankedwith dibasic residues; (iii) peptides containing methionines.Ideally, at least three peptides should be selected to also havesufficient quantification values if a peptide malperforms because
it gets post-translationally modified, is in a region not readilyaccessible to trypsin, or is isobaric with other peptides in thecomplex sample.
Placing a tandem hexa-histidine tag at the C-terminus ofthe QconCAT protein allows purification with stringent washingsteps and the presence of several tryptophanes and tyrosinesrobust spectroscopic quantification. All target proteins addressedby a QconCAT protein should be in a similar abundance range(the ten ones quantified by the QconCAT protein employed herevaried by a factor of about 50). For this, rough quantificationsby label-free methods like spectral counting (Liu et al., 2004), theempirical abundance index (Ishihama et al., 2005), or intensity-based absolute quantification (IBAQ) (Schwanhausser et al.,2011) give a good guideline. Accordingly, ranks of solubleChlamydomonas proteins rbcL, RBCS, PCY1, EPYC1, and RCA1determined previously by IBAQ (Schroda et al., 2015) fittedroughly with the abundances determined here with the QconCATapproach (Table 2). Finally, no prefractionation steps should beincluded to avoid an incomplete extraction of some proteins.
AUTHOR CONTRIBUTIONS
FS designed the QconCAT protein and performed the LC-MS/MSanalyses. AH and DZ analyzed the data. TM and MS conceivedand supervised the work. MS wrote the article with contributionsfrom all other authors.
FUNDING
This work was funded by the Deutsche Forschungsgemeinschaft(TRR 175, projects C02 and D02) and the Landesforschungs-schwerpunkt BioComp.
ACKNOWLEDGMENTS
We are grateful to Karin Gries for technical help.
SUPPLEMENTARY MATERIAL
The Supplementary Material for this article can be found onlineat: https://www.frontiersin.org/articles/10.3389/fpls.2018.01265/full#supplementary-material
REFERENCESBarnidge, D. R., Dratz, E. A., Martin, T., Bonilla, L. E., Moran, L. B.,
and Lindall, A. (2003). Absolute quantification of the G protein-coupledreceptor rhodopsin by LC/MS/MS using proteolysis product peptides andsynthetic peptide standards. Anal. Chem. 75, 445–451. doi: 10.1021/ac026154+
Beynon, R. J., Doherty, M. K., Pratt, J. M., and Gaskell, S. J. (2005). Multiplexedabsolute quantification in proteomics using artificial QCAT proteins ofconcatenated signature peptides. Nat. Methods 2, 587–589. doi: 10.1038/nmeth774
Brownridge, P., and Beynon, R. J. (2011). The importance of the digest: proteolysisand absolute quantification in proteomics. Methods 54, 351–360. doi: 10.1016/j.ymeth.2011.05.005
Brownridge, P., Holman, S. W., Gaskell, S. J., Grant, C. M., Harman, V. M.,Hubbard, S. J., et al. (2011). Global absolute quantification of a proteome:challenges in the deployment of a QconCAT strategy. Proteomics 11, 2957–2970.doi: 10.1002/pmic.201100039
Chow, W. S., Melis, A., and Anderson, J. M. (1990). Adjustments ofphotosystem stoichiometry in chloroplasts improve the quantum efficiency ofphotosynthesis. Proc. Natl. Acad. Sci. U.S.A. 87, 7502–7506. doi: 10.1073/pnas.87.19.7502
Frontiers in Plant Science | www.frontiersin.org 9 August 2018 | Volume 9 | Article 1265

fpls-09-01265 August 28, 2018 Time: 19:30 # 10
Hammel et al. Applying QconCATs to Chlamydomonas
Eberhard, S., Finazzi, G., and Wollman, F. A. (2008). The dynamics ofphotosynthesis. Annu. Rev. Genet. 42, 463–515. doi: 10.1146/annurev.genet.42.110807.091452
Ferenczi, A., Pyott, D. E., Xipnitou, A., and Molnar, A. (2017). Efficient targetedDNA editing and replacement in Chlamydomonas reinhardtii using Cpf1ribonucleoproteins and single-stranded DNA. Proc. Natl. Acad. Sci. U.S.A. 114,13567–13572. doi: 10.1073/pnas.1710597114
Gerber, S. A., Rush, J., Stemman, O., Kirschner, M. W., and Gygi, S. P. (2003).Absolute quantification of proteins and phosphoproteins from cell lysates bytandem MS. Proc. Natl. Acad. Sci. U.S.A. 100, 6940–6945. doi: 10.1073/pnas.0832254100
Ghesquiere, B., and Gevaert, K. (2014). Proteomics methods to study methionineoxidation. Mass Spectrom. Rev. 33, 147–156. doi: 10.1002/mas.21386
Gillet, L. C., Leitner, A., and Aebersold, R. (2016). Mass spectrometry applied tobottom-up proteomics: entering the high-throughput era for hypothesis testing.Annu. Rev. Anal. Chem. 9, 449–472. doi: 10.1146/annurev-anchem-071015-041535
Greiner, A., Kelterborn, S., Evers, H., Kreimer, G., Sizova, I., and Hegemann, P.(2017). Targeting of photoreceptor genes in Chlamydomonas reinhardtii viazinc-finger nucleases and CRISPR/Cas9. Plant Cell 29, 2498–2518. doi: 10.1105/tpc.17.00659
Harris, E. H. (2008). “The chlamydomonas sourcebook: introduction tochlamydomonas and its laboratory use,” in The Chlamydomonas Sourcebook,2nd Edn, eds H. H. Elizabeth, Ph.D., B. S. David, Ph.D., P. D. George and B.Witman. (San Diego, CA: Elsevier).
Hemme, D., Veyel, D., Muhlhaus, T., Sommer, F., Juppner, J., Unger, A. K.,et al. (2014). Systems-wide analysis of acclimation responses to long-term heatstress and recovery in the photosynthetic model organism Chlamydomonasreinhardtii. Plant Cell 26, 4270–4297. doi: 10.1105/tpc.114.130997
Ishihama, Y., Oda, Y., Tabata, T., Sato, T., Nagasu, T., Rappsilber, J., et al. (2005).Exponentially modified protein abundance index (emPAI) for estimation ofabsolute protein amount in proteomics by the number of sequenced peptidesper protein. Mol. Cell. Proteomics 4, 1265–1272. doi: 10.1074/mcp.M500061-MCP200
Khrebtukova, I., and Spreitzer, R. J. (1996). Elimination of the Chlamydomonasgene family that encodes the small subunit of ribulose-1,5-bisphosphatecarboxylase/oxygenase. Proc. Natl. Acad. Sci. U.S.A. 93, 13689–13693. doi: 10.1073/pnas.93.24.13689
Kropat, J., Hong-Hermesdorf, A., Casero, D., Ent, P., Castruita, M., Pellegrini, M.,et al. (2011). A revised mineral nutrient supplement increases biomass andgrowth rate in Chlamydomonas reinhardtii. Plant J. 66, 770–780. doi: 10.1111/j.1365-313X.2011.04537.x
Lange, V., Picotti, P., Domon, B., and Aebersold, R. (2008). Selected reactionmonitoring for quantitative proteomics: a tutorial. Mol. Syst. Biol. 4:222. doi:10.1038/msb.2008.61
Li, X., Zhang, R., Patena, W., Gang, S. S., Blum, S. R., Ivanova, N., et al. (2016). Anindexed, mapped mutant library enables reverse genetics studies of biologicalprocesses in Chlamydomonas reinhardtii. Plant Cell 28, 367–387. doi: 10.1105/tpc.15.00465
Liu, H., Sadygov, R. G., and Yates, J. R., and. (2004). A model for random samplingand estimation of relative protein abundance in shotgun proteomics. Anal.Chem. 76, 4193–4201. doi: 10.1021/ac0498563
Lowry, O. H., Rosebrough, N. J., Farr, A. L., and Randall, R. J. (1951). Proteinmeasurement with the Folin phenol reagent. J. Biol. Chem. 193, 265–275.
Mackinder, L. C., Meyer, M. T., Mettler-Altmann, T., Chen, V. K., Mitchell, M. C.,Caspari, O., et al. (2016). A repeat protein links Rubisco to form the eukaryoticcarbon-concentrating organelle. Proc. Natl. Acad. Sci. U.S.A. 113, 5958–5963.doi: 10.1073/pnas.1522866113
Merchant, S., Hill, K., and Howe, G. (1991). Dynamic interplay between twocopper-titrating components in the transcriptional regulation of cyt c6. EMBOJ. 10, 1383–1389.
Meyer, M. T., Genkov, T., Skepper, J. N., Jouhet, J., Mitchell, M. C., Spreitzer, R. J.,et al. (2012). Rubisco small-subunit alpha-helices control pyrenoid formation in
Chlamydomonas. Proc. Natl. Acad. Sci. U.S.A. 109, 19474–19479. doi: 10.1073/pnas.1210993109
Murakami, A., Fujita, Y., Nemson, J. A., and Melis, A. (1997). Chromatic regulationin Chlamydomonas reinhardtii: time course of photosystem stoichiometryadjustment following a shift in growth light quality. Plant Cell Physiol. 38,188–193. doi: 10.1093/oxfordjournals.pcp.a029151
Nikolova, D., Heilmann, C., Hawat, S., Gabelein, P., and Hippler, M. (2018).Absolute quantification of selected photosynthetic electron transfer proteins inChlamydomonas reinhardtii in the presence and absence of oxygen. Photosynth.Res. 137, 281–293. doi: 10.1007/s11120-018-0502-3
Pertl-Obermeyer, H., Trentmann, O., Duscha, K., Neuhaus, H. E., and Schulze,W. X. (2016). Quantitation of vacuolar sugar transporter abundance changesusing QconCAT synthtetic peptides. Front. Plant Sci. 7:411. doi: 10.3389/fpls.2016.00411
Pratt, J. M., Simpson, D. M., Doherty, M. K., Rivers, J., Gaskell, S. J., andBeynon, R. J. (2006). Multiplexed absolute quantification for proteomics usingconcatenated signature peptides encoded by QconCAT genes. Nat. Protoc. 1,1029–1043. doi: 10.1038/nprot.2006.129
Recuenco-Munoz, L., Offre, P., Valledor, L., Lyon, D., Weckwerth, W., andWienkoop, S. (2014). Targeted quantitative analysis of a diurnal RuBisCOsubunit expression and translation profile in Chlamydomonas reinhardtiiintroducing a novel Mass Western approach. J. Proteomics. 113, 143–153. doi:10.1016/j.jprot.2014.09.026
Schaff, J. E., Mbeunkui, F., Blackburn, K., Bird, D. M., and Goshe, M. B.(2008). SILIP: a novel stable isotope labeling method for in planta quantitativeproteomic analysis. Plant J. 56, 840–854. doi: 10.1111/j.1365-313X.2008.03639.x
Schroda, M., Hemme, D., and Muhlhaus, T. (2015). The Chlamydomonas heatstress response. Plant J. 82, 466–480. doi: 10.1111/tpj.12816
Schwanhausser, B., Busse, D., Li, N., Dittmar, G., Schuchhardt, J., Wolf, J., et al.(2011). Global quantification of mammalian gene expression control. Nature473, 337–342. doi: 10.1038/nature10098
Scott, K. B., Turko, I. V., and Phinney, K. W. (2016). QconCAT: internal standardfor protein quantification.Methods Enzymol. 566, 289–303. doi: 10.1016/bs.mie.2015.09.022
Stauber, E. J., Busch, A., Naumann, B., Svatos, A., and Hippler, M. (2009).Proteotypic profiling of LHCI from Chlamydomonas reinhardtii provides newinsights into structure and function of the complex. Proteomics 9, 398–408.doi: 10.1002/pmic.200700620
Wienkoop, S., Weiss, J., May, P., Kempa, S., Irgang, S., Recuenco-Munoz, L.,et al. (2010). Targeted proteomics for Chlamydomonas reinhardtii combinedwith rapid subcellular protein fractionation, metabolomics and metabolic fluxanalyses. Mol. Biosyst. 6, 1018–1031. doi: 10.1039/b920913a
Willmund, F., Hinnenberger, M., Nick, S., Schulz-Raffelt, M., Muhlhaus, T.,and Schroda, M. (2008). Assistance for a chaperone: Chlamydomonas HEP2activates plastidic HSP70B for cochaperone binding. J. Biol. Chem. 283, 16363–16373. doi: 10.1074/jbc.M708431200
Wostrikoff, K., and Stern, D. (2007). Rubisco large-subunit translation isautoregulated in response to its assembly state in tobacco chloroplasts.Proc. Natl. Acad. Sci. U.S.A. 104, 6466–6471. doi: 10.1073/pnas.0610586104
Conflict of Interest Statement: The authors declare that the research wasconducted in the absence of any commercial or financial relationships that couldbe construed as a potential conflict of interest.
Copyright © 2018 Hammel, Zimmer, Sommer, Mühlhaus and Schroda. This is anopen-access article distributed under the terms of the Creative Commons AttributionLicense (CC BY). The use, distribution or reproduction in other forums is permitted,provided the original author(s) and the copyright owner(s) are credited and that theoriginal publication in this journal is cited, in accordance with accepted academicpractice. No use, distribution or reproduction is permitted which does not complywith these terms.
Frontiers in Plant Science | www.frontiersin.org 10 August 2018 | Volume 9 | Article 1265