Embed Size (px)
Citation preview
International Journal of Applied Science and Technology Vol. 7, No. 3, September 2017
32
Photosynthetic Behavior of Gmelina Arborea Genotypes in Rooted Mini-Cuttings
Stage under Nursery Conditions, at South Pacific of Costa Rica
Carlos Ávila Arias
1
Rafael Murillo Cruz
William Hernández Castro
Institute of Research and Forest Services - INISEFOR
National University of Costa Rica
Guerald Flores Hurtado
Universidad Católica Sedes Sapientiae - UCSS
Olman Murillo Gamboa
Dagoberto Arias Aguilar
Technological Institute of Costa Rica -ITCR
Abstract
The aim of this study was to determine and interpret the photosynthetic capacity of five clones of Gmelina
arboreaat the stage of mini-cuttings rooted in INISEFORgreenhouse. The light response curve of the clones as
well as their performance in gas exchange wasevaluated, with no statistically significant differences among them.
Statistical analysis was performed using InfoStat software, an analysis of variance and comparison of means by
Tukey test wasperformed. Average values were recorded for net photosynthesis (An), stomatal conductance (Gs),
transpiration (E) and water use efficiency (WUE) with values of 9.63 µmol m-2
s-1
, 142.83 mmol m-2
s-1
, 2.40 µmol
m-2
s-1
y 4.16 µmol m-2
s-1
,respectively. Clone 6 obtained greater physiological values for net photosynthesis (An)
and stomatal conductance (Gs), and that also was located in the second place with respect to transpiration (E)
and water use efficiency (WUE).
Keywords: Gmelina arborea; photosynthetic capacity; cuttings; clones; Costa Rica
Resumen
El objetivo del presente estudio es determinar e interpretar la capacidad fotosintética de cinco clones de Gmelina
arborea en su estadío de mini-estaquilla enraizada en el vivero del INISEFOR-UNA. Se evaluó la curva de
respuesta de la luz y el intercambio gaseoso para cada uno de los cinco clones, no se registraron diferencias
estadísticamente significativas entre los genotipos evaluados. Los análisis estadísticos fueron realizados utilizando
el programa InfoStat, se realizó análisis de varianza y comparación de medias mediante la prueba de Tuckey. El
promedio registrado para la especie en cuanto a la fotosíntesis neta (An), conductancia estomática (Gs),
transpiración (E) y eficiencia en el uso del agua (WUE) fue de 9,63 µmol m-2
s-1
, 142,83 mmol m-2
s-1
, 2,40 µmol
m-2
s-1
y 4,16 µmol m-2
s-1
respectivamente. El clon 6 obtuvo los valores más altos en cuanto aAny Gs, además
registró la segunda posición con respecto a E y WUE.
Palabras clave: Gmelina arborea; capacidad fotosintética; mini-estaquilla; clones; vivero; Costa Rica
1Primaryauthor: [email protected]
ISSN 2221-0997 (Print), 2221-1004 (Online) © Center for Promoting Ideas, USA www.ijastnet.com
33
Introduction
A forestry breeding program begins with the selection of individuals with desired phenotypic characteristics in a
given population (Pastrana 2011). The identification and selection of high yield trees is the foundation to such
programs (Vallejos et al. 2010), with a superior phenotype in growth, shape and wood quality among other
desirable characteristics. Once the trees that form part of breeding program are identified, establishment and
propagation in the nursery starts. The nursery phase is essential to evaluate a number of features involved with
plant productivity, obtaining valuable information with which to commence with determining the potential of the
gene pool.Usually morphological characteristics are the preferred quality and growth indicators used in research
at the nursery, given that they are considered an expression of the physiology and genomics of the plant material;
however these provide indirect and insufficient information for accurate decision making.
Knowledge of plant physiology is essential for advances in tree breeding (Pallardy 2008) since they play an
important role in the understanding of plants and their interactions with the environment (El-Sharkawy 2006, da
Matta 2007). To obtain directly physiological parameters values and their subsequent interpretation is more
difficult, mainly because of its high variability, whichcan be attributed to the susceptibility to weather conditions,
the high cost of the necessary equipment (IRGA, Infra Red Gas Analyzer) and special the special training for the
operators in the use of such equipment. This situation may explain the existence of little physiological information
about superior genotypes for Gmelina arborea plantations. Such information would be useful for making
decisions, for example about the conditions that must be provided to different genotypes in the nursery in order to
obtain the best expression of their photosynthetic performance (Triono 2004); thereby achieving greater biomass
production, higher quality and resilience to adverse field conditions.
Parameters such as the rate of photosynthesis and carbohydrate accumulation are considered as quality indicators
in plants produced in forestry nurseries (Cetina et al. 2001). With the information obtained from the light curves
and gas exchange of clones that are evaluated, it is possible to identify genotypes with greater capacity to capture
carbon through photosynthesis. This information is useful in production programs and it would not only make
more efficient the production per unit area, but also reduce environmental pollution by increased removal of
atmospheric CO2 (López et al. 2007, González et al. 2009).
Gmelina arborea is a specie of great importance in tropical areas around the world, as an option to ensure the
supply of raw material for the forest industry (Balcorta & and Vargas 2004, Kumar 2007, Adebisi et al. 2011,
Wee et al. 2012) . Its importance lies in the rapid growth, easy adaptation to a variety of site conditions, the
variety of uses for wood (Indira 2006) and supply to producers and / or investors of a quick return on investment
(Wee et al. 2012). Murillo and Guevara (2013) report that Melina was the most productive species in forestry
nurseries of Costa Rica in 2012, with almost 50% of the approximately 7 million plants produced in that year. The
present study aimed to determine and interpret the photosynthetic capacity of five clones of Gmelina arborea in
mini-rooted cuttings of vegetative reproduction in the nursery of the Institute of Research andForest Services of
the National University (Instituto de Investigación y Servicios Forestales de la Universidad Nacional) in the south
of the country.
Materials and methods
Site Description
The study was conducted at the nursery facilities of the Institute of Research andForest Services (INISEFOR)
located in La Palma, Puerto Jiménez district, county of Golfito, Province of Puntarenas, in the south Pacific of
Costa Rica (Figure 1). Five genotypes of Gmelina arborea that are part of the genetic collection of INISEFOR,
were physiologically assessed. The vegetative reproduction nursery is located in an area with an average annual
rainfall of 3500 mm to 4000 mm, mean annual temperature of 24 °C to 28 °C (Kappelle et al. 2002) and an
altitude of 20 meters. The region is classified as premontane wet forest transition to Basal (Holdridge 1967).

International Journal of Applied Science and Technology Vol. 7, No. 3, September 2017
34
Figure 1. Study area, La Palma, Puerto Jiménez, Golfito, south pacific, Costa Rica.
Source:Villegas, 2012
Vegetative Material
The research was conducted in five genotypes of Gmelina arborea from the breeding program of INISEFOR.
Mini-cuttings (within mini-tunnels) that were in their first growth period of the vegetative reproduction process
(Figure 3) were used. Gmelina genotypes were reproduced from clonal gardens, according to usual protocols used
by INISEFOR (Abrahams &Vassart 2011).
Figure 2.Mini-tunnel environment for rooting Gmelina arboreamini-cuttings.
Measuring physiological parameters
Physiological measurements were made when mini-cuttings had rooted after spending fifteen days in the mini-
tunnels, just as, according to the protocol of reproduction, they are ready to leave the nursery to the environment
or conditions of acclimatization on a semi protected environment.

ISSN 2221-0997 (Print), 2221-1004 (Online) © Center for Promoting Ideas, USA www.ijastnet.com
35
Light Response Curves (𝑨𝒏-PPFD)
Light response curves were determined using a portable photosynthesis system (CIRAS-2, PP Systems, USA -
Figure 3) on bright and clear days (Blake and Bevilacqua 1990, Lewis et al. 2002). Average CO2 concentration
used was 366 ppm ± 7.05 ppm and air temperature 30 °C within the cuvett. Photosynthetic response to light was
measured in the first new pair of blades with full development of each plant (Evans &Poorter 2001, Blake
&Bevilacqua 1990). Fourteen levels of incident photosynthetic photon flux density were evaluated (0, 50, 100,
150, 200, 250, 300, 350, 400, 600, 800, 1000, 1200, 1400 µmol m-2
s-1
). It started with 0 µmol m-2
s-1
being
increased intensity gradually until 1400 µmol m-2
s-1
. Five branches were evaluated for each genotype, ie five
repetitions of the curve for each genotype were obtained, while the value to be reported for the species is based on
the average of the analysis of the 25 plants. The data were fitted using non formula described below rectangular
hyperbola (Thornley 1976, Marshall & Biscoe 1980,Pasian&Lieth1990, Flores 2012)
F (PPFD, Φ,Amax ,Rd ) :
An =ΦPPFD + Amax − ΦPPFD + Amax
2 − 4ΦPPFDAmax θ
2θ− Rd
Where An is the net photosynthetic rate, Φ is the quantum yield of photosynthesis, PPFD is the photosynthetic
photon flux density, Amax is the maximum photosynthetic rate at light saturation, Rd is mitochondrial respiration
rate and θis a parameter describing the convexity of the curve (Leverenz1988, Zufferey et al. 2000, Flores 2012).
LSP is the point of saturation and luminance was calculated by the equation proposed by Lieth and Pasian (1990):
𝐿𝑆𝑃 = 2(Amax + Rd )
Φ
Figure 3. Portable photosynthesis system, CIRAS-2.
Gas Exchange
Measurements were done on clear and sunny days with an air temperature of 30 ° C within the cuvett. For the
assessment of gas exchange the portable photosynthesis system (CIRAS-2, PP Systems, USA) was also used
(Figure 3) with a PLC6 cuvett at a CO2 concentration of 366.16 ppm ± 7.05 ppm , and light intensity of 1000
µmol m-2
s-1
, with the main objective to prevent photo inhibition (Evans &Poorter 2001). The physiological
variables obtained and analyzed were: net photosynthesis (An= µmolCO2 m-2
s-1
), stomatal conductance (Gs =
mmol H2O m-2
s-1
), transpiration (E = µmol H2O m-2
s-1
) and water use efficiency (WUE = µmol H2O m-2
s-1
).
Measurements were made in the first new pair of leaves with full development of each plant (Evans &Poorter
2001), these were labeled to evaluate it on five occasions at different times during day. In summary five branches
per genotype were analyzed on five separate occasions each.
Determining amount of chlorophyll
Chlorophyll measurement was performed using the SPAD-502 in the new pair of first fully developed leaves of
each plant. An average of five records per blade in five branches per genotype was taken.
Statistical Analysis
Data were analyzed using the statistical complete randomized block design, where each clone served as block
(five in total) and branches as the set of observations or experimental unit (five branches per clone-repetitions).
Statistical analysis was performed using the software InfoStat.
International Journal of Applied Science and Technology Vol. 7, No. 3, September 2017
36
Physiological gas exchange data were analyzed using a parametric analysis of variance, after checking
assumptions of parametric statistics, and differences in means were compared by Tukey test (p <0.05). For the
preparation of the light response curves (An-PPFD) data were fitted to a non-rectangular hyperbola model
(Thornley 1976, Marshall & Biscoe 1980, Lieth& Pasian 1990, Flores 2012) using the "Landflux" software ,
which was developed especially for this type of evaluation.
Results and discussion
Light response curve to light (𝑨𝒏-PPFD)
Through the process of photosynthesis, C3 plants transform carbon dioxide from the atmosphere into chemical
energy used in its growth, which is the key process driving their development (Herbohn et al. 2009, Flood et al.
2011), this process can take place only in the presence of solar light and CO2. To evaluate the photosynthetic
capacity of genotypes response a light curve (absorption of CO2) is built, and thus its gas exchange capacity is
determined. It is a function that can provide accurate information on the efficiency of the tree in the use of light
(Triono 2004). It is very important to take into account both stomatal and non-stomatal factors that can directly
influence the direct relationship between the rate of photosynthesis and stomatal conductance. In this regard,
Gonzalez et al. (2009), failed to construct light response curves for three species of Lantana sp. due to a strong
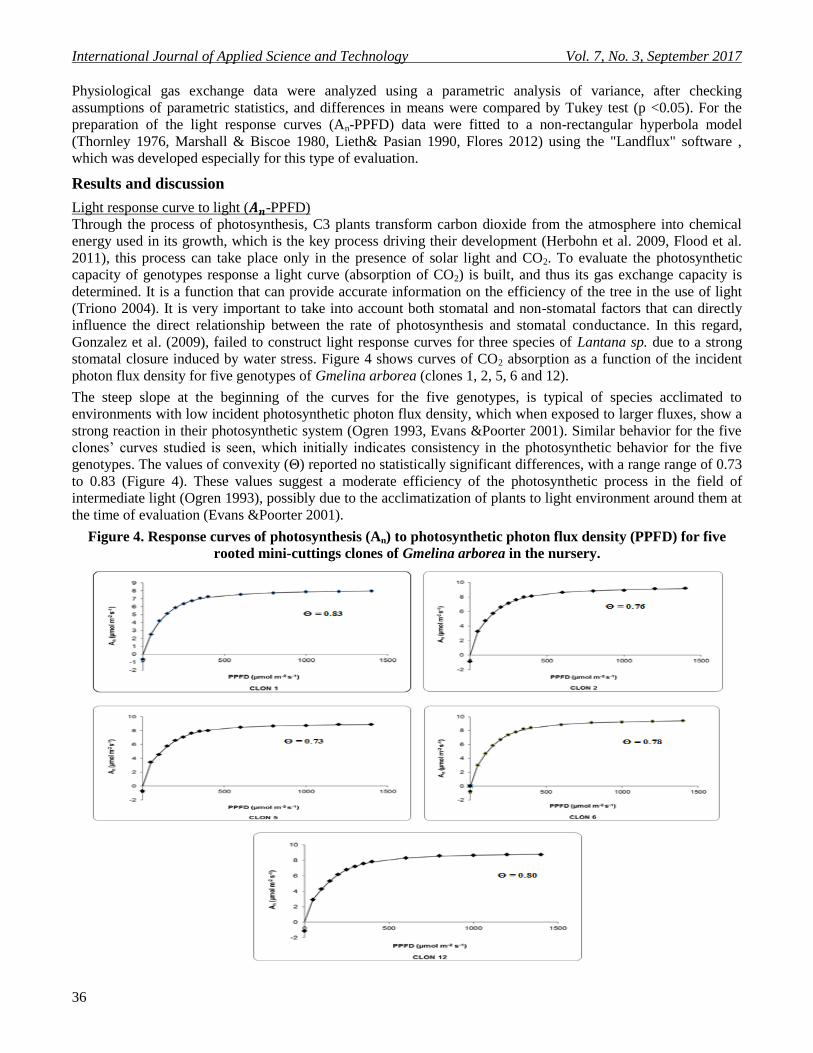
stomatal closure induced by water stress. Figure 4 shows curves of CO2 absorption as a function of the incident
photon flux density for five genotypes of Gmelina arborea (clones 1, 2, 5, 6 and 12).
The steep slope at the beginning of the curves for the five genotypes, is typical of species acclimated to
environments with low incident photosynthetic photon flux density, which when exposed to larger fluxes, show a
strong reaction in their photosynthetic system (Ogren 1993, Evans &Poorter 2001). Similar behavior for the five
clones’ curves studied is seen, which initially indicates consistency in the photosynthetic behavior for the five
genotypes. The values of convexity (Θ) reported no statistically significant differences, with a range range of 0.73
to 0.83 (Figure 4). These values suggest a moderate efficiency of the photosynthetic process in the field of
intermediate light (Ogren 1993), possibly due to the acclimatization of plants to light environment around them at
the time of evaluation (Evans &Poorter 2001).
Figure 4. Response curves of photosynthesis (An) to photosynthetic photon flux density (PPFD) for five
rooted mini-cuttings clones of Gmelina arborea in the nursery.

ISSN 2221-0997 (Print), 2221-1004 (Online) © Center for Promoting Ideas, USA www.ijastnet.com
37
From the light response curves, the various characteristics for physiological values for the five mini-cuttings’
clones studied under greenhouse conditions (Table 1) are obtained.
Table 1. Physiological Characters estimated from response curves for light mini- cuttings five clones of
Gmelina arborea in nursery.
CLON
E
RESPIRATION
(Rd)
QUANTUM YIELD
(Φ)
MAXIMUM
PHOTOSYNTHESIS
(Amax)
LIGHT SATURATION
POINT (LSP)
µmol m-2
s-1
mol/mol µmol m-2
s-1
µmol m-2
s-1
6 -1.1090 a -20% 0.0415 a 15% 8.58 a 12% 372.71 a 4%
2 -1.4127 a 2% 0.0411 a 13% 8.03 a 4% 345.37 a -4%
12 -1.3736 a -1% 0.0323 a -11% 7.68 a 0% 394.00 a 10%
5 -1.9202 a 38% 0.0305 a -16% 7.16 a -7% 336.75 a -6%
1 -1.1245 a -19% 0.0356 a -2% 6.99 a -9% 346.80 a -3%
AVER
AGE
-1.3880 0.0362 7.69 359.13
Means with a common letter are not significantly different (p> 0.05)
Values in percentage represent the difference from the population mean parameter
None of the physiological traits evaluated showed statistically significant differences between clones in regards
their response on net photosynthetic rate based on the increase in the incident photon flux density. The quantum
yield of the clones indicates apparent ability to capture light energy, electron transport and develop the enzymatic
processes; which is directly affected by water stress (González et al. 2009). The evaluated genotypes showed
values ranging from 0.030 to 0.041 (clone 6> 2> 1> 12> 5) for this parameter. The sixth clone had the highest
value, 36.6% higher compared to the lowest (clone 5). Flores (2012) evaluated five melina clones at 81 days,
which were propagatedvegetative and placed on a substrate with low pH; finding a 125% difference between the
clone with the highest average value and which recorded the lowest value. The difference between the two studies
can be attributed to genetic variation among clones evaluated as the materials are developed in different
environments (Adams et al. 2001), as well as the difference in age of the plants at the time of measurement, since
the values of physiological parameters vary with the age of the material evaluated (Lieth& Pasian 1990, Coopman
et al. 2008, Flood et al. 2011, Rojas et al. 2012). Moreover, the quantum yield values obtained in this study are
placed above those reported by Nogués and Baker (1995) and Tambussi and Graciano (2010) for C3 plants not
subjected to water stress; where these authors found values from 0.025 to 0.030 µmol m-2
s-1
. Kelly (2006), on the
other, on seedlings of Gmelina leichhardtii for different light intensities (60%, 30%, 10%) reported values
between 0.0047 and 0.0058 µmol m-2
s-1
.
For the present study the values of the maximum photosynthetic rate at light saturation (Anmax) ranged from 6.99
µmol m-2
s-1
and 8.58 µmol m-2
s-1
. The clone six recorded the highest value of maximum photosynthesis, while
clone 1 the lowest value in a range of variation of22.7% between them. The previous confirms reports by
Gliessman (2002), where C3 plants tend to have their maximum photosynthetic rates under moderate conditions
of light and temperature, and inhibition at high rates of heat and illumination pattern. The range of variation for
this parameter, again, is much lower than that reported by Vellini et al. (2008) and Flores (2012), who obtained
90.9% variation in clones of eucalyptus and 63.6% respectively in clones of melina in evaluations performed in a
nursery. Evans and Poorter (2001) conclude that the leaves acclimated to low light intensities had better
photosynthetic rates per unit leaf area than leaves acclimated to high light intensities.
Since the clones here studied are being commercially reproduced to establish productive plantations, it is
desirable that the range of variation of Anmax is minimum, which would yield smaller margin of error in the
calculations of forest production, and would achieve more effective silvicultural activities planning. Other
comparison data were reported by Kelly (2006), who studied the photosynthetic capacity of Gmelina leichhardtii
at the nursery, registering Anmax from 8.44 to 9.36 µmol m-2
s-1
, slightly higher than the values this study, which
slowly initially checks the high photosynthetic capacity of the genus melina. The light saturation point (LSP),
defined as the light intensity above which no growth occurs in CO2 fixation varied between 336.75 µmol m-2
s-
1and 394 µmol m
-2 s
-1. According to Lopez et al. (2007), between species there are differences in light
requirements and thus must be taken into account.

International Journal of Applied Science and Technology Vol. 7, No. 3, September 2017
38
Herralde (2000) reaffirms the conclusion that LSP is an important parameter for decision making, as greater
values involve a greater physiological efficiency of incident radiation. That is, clones 12 and 6 may be subject to
greater incident photon flux densities in the mini-tunnel rooting clones than clones 2, 5 and 1, to maximize
production of biomass. The desired outcome is to adjust nursery management practices that positively modify
photosynthesis, which affect the production and storage of carbohydrates, and consequently the vigor of the plant
that will be sent to the field (Cetina et al. 2001). Research studies should be performed to corroborate this
approach, and more importantly, to determine which plant tissue increase biomass would be located. While it is
true there were no statistically significant differences among the evaluated clones,except to clone 6, which
showed higher values with respect to all characters investigated except in light saturation point, where it had the
second best value. Clone 6 showed 20% less respiration, 15% higher quantum yield, 12% higher maximum
photosynthesis and 4% higher light saturation point with respect to the overall average of the five clones
investigated in this study. Therefore clone 6 was identified as the highest photosynthetic capacity of genotypes. In
second place is the clone 12 which recorded the highest light saturation point, and stood at the top in the other
traits evaluated. Moreover clone 5 showed the lowest values, so it was at the last position of the clones evaluated.
In summary, the order of the clones, of more to less desirable values in terms of the parameters obtained from the
curves of light is: 6> 12> 2> 1> 5 The presentation of individual light curves obtained for the rooted cuttings in
nursery does not reveal important details, therefore a summary graph (Figure 5) is presented. Left curves are
presented to 600 µmolfotones m-2
s-1
(Figure 5A), which is the point where the slope of the curve begins to
decline, and right across the curve for each clone is presented, to 1400 µmolfotones m-2
s-1
(Figure 5B).
Figure 5.Photosyntesis response curves (An) to photosynthetic photon flux density (PPFD), for mini-
cuttings from five clones of Gmelina arborea evaluated in the nursery.
In both figures, each clone is located in a defined position and continues that way until the LSP. With respect to
the behavior of clones based on the photosynthetic photon flux density of the order is always: 6> 2> 5> 12> 1 It
coincides with the previous finding where the clone 6 showed the best response in physiological traits evaluated
in their photosynthetic development. In this aspect the targeted by Aspinwall et al.is satisfied (2011) who
indicates greater uniformity in the behavior of individual clones when individual evaluation is performed. The
uniformity in the behavior of clones along the entire curve simplifies any changes in the nursery, helping to
identify the demand from each genotype radiation, in order to increase productivity. According to the order
obtained in Figure 6 it would be recommended to have photosynthetic photon flux conditions of 366 µmolfotones
m-2
s-1
, if it is desired to work according to the average value obtained for the species. The analysis of the
physiological parameters of the 25 light response curves evaluated, allowed the form of a response curve of the
photosynthesis photon flux density incident,at overall photosynthetic species nursery level (Figure 6).

ISSN 2221-0997 (Print), 2221-1004 (Online) © Center for Promoting Ideas, USA www.ijastnet.com
39
Figure 6. Average response curve of photosynthesis (An) to photosynthetic photon flux density (PPFD) for
the species Gmelina arborea under nursery conditions.
After three weeks of rooting stimulation, with a temperature average of 33 °C and PAR 100 µmolfotones m-2
s-
1respectively in the mini-tunnels (Abrahams &Vassart, 2011), on average, Gmelina arborea showed a
photosynthetic maximum rate of 7.89 mol CO2 m-2
s-1
and a light saturation point of 366.04 µmol m-2
s-1
. These
values are considered too high by the young age of the material and be acclimated to low PAR conditions to avoid
water stress in the cuttings. Evans and Porter (2001) indicate that pine leaves acclimated to low levels of PAR had
better daily photosynthesis per unit leaf dry mass to leaves acclimated to high levels of PAR. Likewise the
evaluated melina genotypes were very efficient in their photosynthetic mechanisms even without ideal conditions.
In these conditions the species shows its photosynthetic potential in its early stages, validating its status of rapid
growth, taking advantage of the available PAR, fixing CO2 into biomass. The above features correspond to
species that could be classed as successful invasive species in tropical environments, with high rates of growth
and photosynthesis compared to native species (Pepper et al. 2012). The light saturation point of 366.04 µmol m-2
s-1
indicates that the mini-tunnels rooting should be exposed to larger values of incident radiation, to exploit more
genotypes translating this environmental variable in biomass production (López et al. 2001). This approach
should be investigated in future studies, to determine in what tissues of the plant the largest accumulation of
biomass is presented by way of photosynthesis over the years (López et al. 2007, Araque et al. 2009), as plants
can express priorities when forming new tissues or recover structures from damages (Retuerto et al., 2003), or
change the fraction of biomass invested in leaves, stem and roots (Evans &Porter 2001).Moreover the same
authors suggest that reproductive structures act as important sinks of photo assimilates, so attention must be given
to the theory of source - sink to explain where the plant directs photo assimilates.
The quantum yield values (ᶲ) registered for the genotypes evaluated under conditions of rooted mini-cuttings,
varied between 0.030 µmol mol-1
and 0.041 µmol mol-1
, registering an average value for the sort of 0.036 µmol
mol-1
. Initially it might indicate a poor efficiency of the photosynthetic system, but with the value of initial slope
of the light curve, the species is able to reach important values of Amax at such a young age, which in turn
indicates a very important ability to use values low PAR and they activate their photosynthetic system, making it
a competitive-adaptive advantage. Flores (2012) reported values of quantum yield between 0.016 µmol mol-1
and
0.036 µmol mol-1
, slightly lower than those obtained in this work, because the plant material evaluated by Flores
(2012) were all found acclimated to low light conditions. In pine genotypes with a high quantum yield tend to
have a lower average diameter and volume growth (Aspinwall et al. 2001).
Gas Exchange
Stomatal closure to moderate levels of water stress, osmotic adjustment and high efficiency in water use, among
others, are physiological parameters that should guide clonal selection (Corcuera et al. 2005).

International Journal of Applied Science and Technology Vol. 7, No. 3, September 2017
40
In this respect the results obtained for the parameters net photosynthesis, stomatal conductance, transpiration and
efficiency in the use of water as a function of gas exchange process for five clones of Gmelina arborea under
conditions of rooted mini-cuttings in the nursery (Figure 7) are presented . The evaluations were performed using
an average PAR of 1000 m-2
s-1
± 4.34 µmol m-2
s-1
and an average CO2 concentration of 366 ppm ± 7.05 ppm.
Figure 7. Net photosynthesis (An), stomatal conductance (Gs), transpiration (E) and water use efficiency
(WUE) for rooted mini- cuttings of Gmelina arborea using five clones under nursery conditions.
Means with a letter in common are not significantly different (α = 0.05)
A significant variation in the data for each of the four physiological parameters evaluated was present, however
no statistically significant differences between the investigated clones (α = 0.05) were recorded. Two clear trends
aimed at lower and higher variation in physiological variables are observed. Clone 6 had fewer large ranges in all
characters, denoting greater accuracy and stability of results. This could be associated with the fact that it was the
clone that showed the best photosynthetic development, more stable to environmental changes genotype.
Genotypes 1 and 2 showed the greatest variability in all parameters evaluated. This offers a possible alternative
strategy in greater adaptability (Araque et al. 2009). Similarly Araque et al. (2009) found no statistically
significant difference in the values obtained from An, Gs and E in an early evaluation for four tropical tree
species.The values of each of the physiological characteristics for the five clones of Gmelina arboreaare
presented in Table 2.
Table 2. Results from evaluated variables as a function of gas Exchange for five clones of Gmelina
arboreain rooted mini-cuttings at nursery stage.
CLONE Net photosynthesis
(An)
Stomata conductance
(Gs)
Transpiration
( E )
Water Use efficiency
(WUE)
µmol m-2
s-1
mol/mol µmol m-2
s-1
µmol m-2
s-1
6 10.45 a 8% 154.40 a 8% 2.48 a 3% 4.26 a 2%
12 10.24 a 6% 154.37 a 8% 2.61 a 9% 4.02 a -3%
5 10.15 a 5% 134.03 a -6% 2.31 a -4% 4.53 a 9%
2 9.19 a -5% 150.40 a 5% 2.47 a 3% 3.82 a -8%
1 8.14 a -16% 120.97 a -15% 2.13 a -11% 4.17 a 0%
AVERAGE 9.63 142.83 2.40 4.16
Means with a common letter are not significantly different (p > 0,05)

ISSN 2221-0997 (Print), 2221-1004 (Online) © Center for Promoting Ideas, USA www.ijastnet.com
41
In the present investigation the net photosynthesis (An) ranged from 8.14 µmol m-2
s-1
to 10.45 µmol m-2
s-1
among
the five clones investigated. These values of photosynthetic rate can be considered very good when you take into
account the young age and low photon density conditions to which they were subjected (100 µmolfotones m-2
s-1
).
Clone 6, as in the data obtained from the light curves, presented the highest rate of photosynthesis, reaching 8%
above the average for that parameter; meanwhile net photosynthesis of clone 1 was 16% lower than the average of
the five clones. This implies that the clone 6 would produce more biomass than other clones during their stay in
the nursery, so it could be ready to go to field faster or be better prepared for their establishment. Naturally to
corroborate this statement, it requires further evaluation by the respective research trials (Araque et al. 2009). The
light saturation point for the species specified in the condition of mini-cuttings rooted in the nursery was 366.04
µmol m-2
s-1
. However, evaluations of gas exchange were made at a constant PAR of 1000 µmol m-2
s-1
, ie a much
higher saturation point level, so that gas exchange determinations should be made in these stages to levels of PAR
closer to its LSP, since even before then increased CO2 fixation per unit of PAR would be presented, bringing an
even more realistic value.
Stomatal conductance (Gs) is a variable that indirectly reveals the level of stomatal opening (López et al. 2007), as
an essential mechanism to reduce water loss through transpiration (Corcuera et al. 2005), and it may be affected
by merely stomatal as non-stomatal factors (González et al. 2009), as the concentration of CO2 and some chemical
signals reported for Gmelina arborea (Farquhar and Sharkey 1982, cited by Rojas et al. 2012). No statistically
significant differences between clones tested (α = 0.05) were recorded. However, high variability among clones
was presented, obtaining average values from 120.97 to 154.40 mmol m-2
s-1
. Again consistently, clone 6 was the
registered the highest value and the lowest clone 1, reaching 8% above and 15% below the general average
respectively. This wide range is possibly explained by the lack of uniformity of the water potential enabling the
locking leaves and stomatal aperture attributable to environmental conditions. Lopez et al. (2007) indicate that the
stomatal response is attributable to the physiological behavior of plants, so the high heterogeneity of stomatal
closure probably lead to functional inefficiency of the leaf factor to take into account in plant productivity
(Sánchez &Aguirreolea 2000 cited by Flores 2012). Meanwhile, Araque et al. (2009) indicates that differences in
Gscould be attributed to the anatomy of leaves per genotype. Flores (2012) reported values of Gs five clones of
Gmelina arborea whose averages ranged from 120-135 mmol m-2
s-1
, the minimum value reported by the same
author is very similar to that found in the present study, however the average value recorded in this study is 12%
higher than that reported by Flores (2012). The Gsmax values obtained in the present study for five clones of
Gmelina arborea reflect the high capacity of the photosynthetic apparatus of these genotypes. Fernandez et al.
(2010) evaluated four eucalyptus species in nurseries and determined that the water status of the plant did not
prove to be the main limiting factor for Gs and E; variables such as temperature, light radiation or saturation
deficit humidity would be the more affected both physiological processes (Fernández et al. 2010, Pepper et al.
2012).
Transpiration (E) is directly influenced by environmental conditions such as temperature, vapor pressure deficit
and level of photo synthetically active radiation (Marrichi 2009). The genotypes showed no statistically
significant differences (α = 0.05) between them. Clone 6 presented little variation (Figure 7), indicating that the
regulatory process has a well-defined relation. The average value of clone 6 was only 3% higher than the overall
average of the clones (Table 2), confirming a good alternative to limiting, especially water conditions. Clones 1,
2, 5 and 12 showed high variation in their measurements, with clone 2 which had the broadest range of from 1.7
to 3.2 µmol m-2
s-1
. Clone 1 had the most disadvantageous mean value with 11% over respiration from the overall
average, implying differential measures for treatment in the nursery, yet to be defined in future research. The
overall average for the present study was 2.40 µmol m-2
s-1
, which can be considered as a low value compared to
the value of 3.50 µmol m-2
s-1
in average reported by Flores (2012) attributed to high and constant temperature
room (29-39 °C) and the study was conducted in full dry season. Meanwhile low respiration obtained on average
for the five genotypes evaluated in this study become a competitive - adaptive advantage to reduce the rapid
depletion of soil water through stomatal closure (Larcher 2000,Tatagiba et al 2007). Water use efficiency in
(WUE) is one of the main mechanisms of adaptation (Corcuera et al 2005.), it is a characteristic of each species
and depends largely on environmental conditions (Medrano 2007); which ultimately is determined by the stomatal
behavior (Combalicer et al. 2005). A high WUE becomes a competitive and adaptive advantage where water
availability is scarce (Enmerich 2007, Rodrigues 2009). No significant differences (α = 0.05) for the parameter
among the five clones tested were found. Clone 5 showed on average the highest value for this parameter,
followed by clone 6, thanks to its low value of perspiration, since the WUE is estimated from the ratio of An/E.

International Journal of Applied Science and Technology Vol. 7, No. 3, September 2017
42
Clone 2 showed the lowest value of all with 8% less than the average WUE 5= 4.53 µmol m-2
s-1
>6= 4.26 µmol
m-2
s-1
>1= 4.17 µmol m-2
s-1
>12= 4.02 µmol m-2
s-1
>2= 3.82 µmol m-2
s-1
). The difference between clone 5 and 2
is 18.5% higher WUE.
Although these are not statistically significant differences between clones, it should be taken into account in the
protocol vegetative reproduction INISEFOR-A. Flores (2012) reported (for five melina genotypes in nursery
conditions) values WUE between 3.03 and 4.92 µmol m-2
s-1
, very close to those found in the present
investigation, despite that the material evaluated by Flores (2012) and was fully acclimatized and it was older.
Note that the values of photon density for the condition of tunnel rooting of this study were very low and the
largest increase in WUE is associated with plants under high light intensity (Combalicer et al. 2005), which
should be studied for these same genotypes at higher light intensities, at the stage of acclimatization. In summary,
although no statistically significant differences between the clones investigated were found it needs to be taken
into account that the clone 6 scored the most desirable for the parameters of net photosynthesis (An) and stomatal
conductance (Gs) physiological values, and was ranked second place in regard to perspiration (E) and water use
efficiency (WUE). Since the physiological potential is not necessarily directly related to production for all species
and all ages, further studies are needed to validate their photosynthetic potential relative to its growth and / or
biomass production in different tissues (Lopez et al. 2007), since plants can manifest priorities when forming new
tissues or recover damages in structures (Retuerto et al. 2003), or change the fraction of biomass invested in
leaves, stem and roots (Evans &Poorter 2001). On the other hand clearly clone 1 showed the lowest values in all
parameters except WUE, where he averaged as the overall average of the material evaluated.
Conclusions and recommendations
The steep slope recorded in the light curves for the five genotypes, is typical of species acclimated to
environments with low photosynthetic photon flux density incident. Statistically significant differences among
genotypes for any of the parameters obtained from the light curves (convexity of the curve, apparent quantum
yield, maximum photosynthetic rate and light saturation point) were not registered. Genotypes evaluated for
apparent quantum yield registered a range values from0.030 to 0.041, with an average of 0.036. The clone six
recorded the highest value, 36.6% higher compared to the lowest (clone 5). The maximum photosynthetic rate at
light saturation (Anmax) varied between 6.99 µmol m-2
s-1
and 8.58 µmol m-2
s-1
, with a mean of 7.89 µmol m-2
s-1
.
The light saturation point (LSP) ranged from 336.75 µmol m-2
s-1
and 394 µmol m-2
s-1
, with an average of 366.04
for the species µmol m-2
s-1
.
The light saturation point average for the species (366.04 µmol m-2
s-1
) indicates that the rooted mini-tunnels
should be exposed to larger values of incident radiation, which could obtain higher biomass production. More
specifically, 12 and 6 clones could be subjected to higher photon flux density incident on the rooted mini-tunnels.
Although no statistically significant differences among clones were determined, genotype 6 recorded the highest
values in all parameters evaluated, except in the light saturation point which has the second best value. This same
genotype recorded 20% less breathing, 15% higher quantum yield, 12% higher maximum photosynthesis and 4%
higher light saturation point with respect to the overall average for the five clones studied. As for the parameters
obtained from the evaluation of gas exchange, no statistically significant differences between genotypes for net
photosynthesis variables (An), stomatal conductance (Gs), transpiration (E) and water use efficiency (WUE) were
recorded. For net photosynthesis (An) variation was recorded from 8.14 to 10.45 µmol m-2
s-1
between clones, with
an average for the species under nursery conditions of 9.63 mol m-2
s-1
. Stomatal conductance (Gs) reported
variability from 120.97 to 154.40 mmol m-2
s-1
, with an average of 142.83 µmol m-2
s-1
. Perspiration recorded
from the wider scope from 1.7 to 3.2 mmol m-2
s-1
, 2.40 mmol m-2
s-1
average for the species. Finally a high
efficiency in water use (WUE) was recorded, which is a competitive advantage - adaptive, with values from 3.82
µmol m-2
s-1
to 4.53 µmol m-2
s-1
with an average of 4.16 µmol m-2
s-1
. Clone 6 registered the best physiological
and greater efficiency in parameters net photosynthesis (An) and stomatal conductance (Gs) , and, it ranked in
the second place with respect to transpiration (E) and water use efficiency (WUE)., In contrast, clone 1 showed
lower values for all parameters except in WUE, where it averaged as the overall group . Further studies should
validate clone 6 photosynthetic capacity and how it could be translated into higher efficiency of biomass
increments (López et al. 2001), as well as,in allocation in different tissues.

ISSN 2221-0997 (Print), 2221-1004 (Online) © Center for Promoting Ideas, USA www.ijastnet.com
43
Acknowledgments
The authors express their gratitude to MEPROME Project of the National University of Costa Rica for their
support in the development of this research, as well to the M.Sc. Program in Natural Resources Management and
Production Technology of Technological Institute of Costa Rica –ITCR -for their help in the financing of this
publication and scientific support too.
References
Abrahams, I; Vassart, N. 2011. Variaciones en la temperatura, humedad relativa y radiación fotosintéticamente activa en la
clonación por esquejes de Melina en cinco ambientes diferentes de vivero en Puerto Jiménez de Golfito. Proyecto
graduación bachillerato. Ing. Forestal. Heredia, Costa Rica. Universidad Nacional. 43 p.
Adebisi, M; Adekunle, M; Odebiyi, O. 2011. Effects of fruit maturity and pre-sowing water treatment on germinative
performance of Gmelina arborea seeds. Journal of Tropical Forest Science 23(4): 371-378.
Adams, W; Aitken, S; Joyce, D; Howe, G; Vargas, J. 2001. Evaluating efficacy of early testing for stem growth in coastal
Douglas-fir. SilvaeGenetica. 50(3-4): 167-175.
Araque, O; Jaimez, R; Azócar, C; Espinoza, W; Tezara, W. 2009. Relaciones entre anatomía foliar, intercambio de gases y
crecimientojuvenil de cuatroespeciesforestales. Interciencia. 34(10): 725-729.
Aspinwall, M; King,J; Domec, J; McKeand, S. 2011. Leaf-level gas-exchenge uniformity and photosynthetic capacity among
loblolly pine (Pinustaeda L.) genotypes of contrasting inherent genetic variation. TreePhysiology. 31: 78-91.
Balcorta, H; Vargas, J. 2004. Variaciónfenotípica y selección de árbolesenunaplantación de melina (Gmelina arborea Linn.,
Roxb.) de tresaños de edad. RevistaChapingo. 10(1): 13-19.
Blake,T; Bevilacqua, E. 1990. Early selection of Fast-growing eucalyptus clones and species. IPEF International. 26-34.
Cetina, V; Ortega, M; González, V; Vargas, J; Colinas, M; Villegas, A. 2001. Fotosíntesis y contenido de carbohidratos de
PinnusgreggiiEngelm.enrespuesta a la poda y régimen de riegoeninvernadero. Agrociencia. 35(6): 599-607.
Combalicer, M; Lee, D.K.; Woo, S.Y.; Lee, Y.K.; Jang, Y.H. 2005. Early growth and physiological characteristics of planted
seedlings in La Mesa Dam Watershed, Philippines. The Philippines Agricultural Scientist 88(3): 305-316.
Coopman, R; Reyes, M; Briceño, V; Corcuera, L; Cabrera, H; Bravo, L. 2008. Changes during early development in
photosynthetic light acclimation capacity explain the shade to sun transition in Nothofagusnitida. TreePhysiology
28: 1561-1571.
Corcuera, L; Maestro, C; Notivol, E. 2005. La ecofisiologíacomoherramienta para la selección de clones másadaptados y
productivosen el marco de unaselvicultura clonal con chopos. Invest. Agrar: Sistema RecursosForestales. 14:(3)
394-407.
DaMatta, F. 2007. Ecophysiology of tropical tree crops: an introduction. Braz. J. PlantPhysiol. 19(4): 239-244.
El-Sharkawy, M. 2006. Utilidad de la investigaciónbásicaenfisiología de la planta cultivoenrelación con el mejoramiento de
cultivos: unarevisión y unacuentapersonal. Braz. J. Plant Physiol. 18: 419-446.
Enmerich, W. 2007. Ecosystem water use efficiency in a semiarid shrubland and grassland community. Rangeland Ecology
& Management 60(5): 464-470.
Evans, J; Poorter, H. 2001. Photosynthetic acclimation of plants to growth irradiance: the relative importance of specific leaf
area and nitrogen partitioning in maximizing carbon gain. Plant, Cell and Environment. 24: 755-767.
Fernández, M; Tapias, R; Alesso, P. 2010. Adaptación a la sequía y necesidadeshídricas de EucalyptusglobulusLabill. En
Huelva. Bol. Inf. CIDEU. 8(9): 31-41.
Flood, P; Harbinson, J; Aarts, M. 2011. Natural genetic variation in plant Photosynthesis. Trends in PlantScience 16(6): 327-
335.
Flores, G. 2012. Comportamiento fisiológico, crecimiento juvenil y potencial de selección temprana en una colección clonal
de Gmelina arborea Roxb. en la empresa 3F, Córdoba, Colombia. Tesis Lic. Ing. Forestal. Cartago, Costa Rica,
Instituto Tecnológico de Costa Rica. 92 p.
González, A; Villalobos, V; Pereyra, G; Rengifo, E; Marín, O; Tezara, W. 2009. Comparación ecofisiológica de tres especies
del género Lantana L. (Verbenaceae). Acta Bot. Venez. 32(2): 417-432.
Herbohn, J; Gregorio, N; Vanclay, J. 2009. Initial gas exchange results from field trials. In ACIAR Smallholder Forestry
Project: Improving financial returns to smallholder tree farmers in the Philippines, end-of-project workshop (1,
2009, Ormoc). Eds.Harrison, S; Bosch, A; Herbohn, J; Mangaoang, E. Ormoc, PH. 83-91 p.
Herralde, F. 2000. Estudio integral de las respuestas ecofisiológicas al estrés hídrico: caracterización de variedades de
Almendro. Tesis Dr. Barcelona, España, Universidad de Barcelona. 140 p.
Indira, E. 2006. Provenance variations in Gmelina arborea with particular reference to tree form. Journal of Tropical Forest
Science. 18(1): 36-50.
Kappelle, M; Castro, M; Acevedo, L; Monge, H. 2002. Ecosistemasdel Area de ConservaciónOsa (ACOSA). INBio. Heredia,
Costa Rica. 496 p.
International Journal of Applied Science and Technology Vol. 7, No. 3, September 2017
44
Kelly, J. 2006. Growth and photosynthetic responses of Australian subtropical rainforest species to variable light
environments: implications for restoration and mixed-species plantations. Thesis Master.Sc. Florida, US, University
of Florida. 68 p.
Kumar, A. 2007. Growth performance and variability in different clones of Gmelina arborea (Roxb.). SilvaeGenetica. 56:
32-36.
Larcher, W. 2000. Temperature stress and survival ability of Mediterranean sclerophyllous plants. Plant Biosystems. 134:
279-295.
Leverenz, J. 1988. The effects of illumination sequence, CO2 concentration, temperature and acclimation on the convexity of
the light response curve. Physiol. Plant. 74: 332-341.
Lewis, J; Lucash, M; Olszyk, D; Tingey, D. 2002. Stomatal responses of Douglas-fir seedlings to elevated carbon dioxide
and temperature during the third and fourth years of exposure. Plant, Cell and Environment 25: 1411-1421.
Lieth, J; Pasian, C. 1990. A model for net photosynthesis of roses leaves as function of photosynthetically active radiation,
leaf temperature, and leaf age. Journal of the American Society for Horticultural Science 115(3): 486-491.
López, M; Peña, C; Aguirre, J; Trejo, C; López, A. 2007. Estudio comparativo de intercambio gaseoso y parámetros
fotosintéticos en dos tipos de hojas de frijol (PhaseolusvulgarisL.) silvestre y domesticado. Revista UDO Agrícola
7(1): 49-57.
Marrichi, A.H.C.; 2009. Caracterização da capacidadefotossintética e da condutância estomática em sete clones comerciais de
Eucalyptuseseuspadrões de respostaao déficit de pressão de vapor. Dissertação de mestrado. Piracicaba,
Brasil,Universidad de São Paulo. 104 p.
Marshall, B; Biscoe, P. 1980. A model for C3 leaves describing the dependence of net photosynthesis on irradiance. Journal
of Experimental Botany. 31(1): 29-39.
Medrano, H; Bota, J; Cifre, J; Flexas, J; Ribas-Carbó, M; Gulías, J. 2007. Eficiencia en el uso del agua por las plantas.
Investigaciones Geográficas 43: 63-84.
Murillo, O.; Guevara, V. 2013. Capítulo IV, Estado y manejosostenible de losrecursosgenéticosforestales, pp 66-75. En:
Estado de losrecursosgenéticosforestales de Costa Rica. MINAET/FAO/CONAGEBIO, San José, Costa Rica. 159 pp.
Ogren, E. 1993. Convexity of the Photosynthetic Light-Response Curve in relation to intensity and direction of light during
growth. Plant Physiol. 101: 1013-1019.
Pallardy, S. 2008. Physiology of woody plants. 3ª ed.Missori,US,Elsevier. 469 p.
Pastrana, I. 2011. Potencial genético de Acacia mangium. Tesis M.Sc. Córdoba, CO, Universidad de Córdoba. Facultad de
CienciasAgrícolas. 100 p.
Pimienta, E; Robles, C; Martínez, C. 2012. Ecophysiological responses of native and exotic young trees to drought and
rainfall. Rev. Fitotec. Mex. 35(5): 15-20.
Retuerto, R; Rodríguez, S; Fernández, B; Obeso, J. 2003. Respuestascompensatorias de plantas a situaciones de estrés.
Ecosistemas. 1: 7 p.
Rojas, A; Moreno, L; Melgarejo, L; Rodriguez, M. 2012. Physiological response of gmelina (Gmelina arborea Roxb.) to
hydric conditions of the colombian Caribbean. AgronomíaColombiana 30(1): 52-58.
Rodrigues, J. 2009. Ecofisiologia de Aldina heterophyllaSpruce Ex Benthemum gradiente vegetacional na Amazônia Central.
Dissertação de mestrado.Manaus, Brasil,Botânica - INPA. 99 p.
Sojka, R; Oosterhuis, D; Scott, H. 2005. Root oxygen deprivation and the reduction of leaf stomatal aperture and gas
exchange. In: Handbook of Photosynthesis (second ed.). Taylor & Francis Group. Florida, USA. 299-314 pp.
Tatagiba, S; Pezzopane, J; Reis, E; Dardengo, M; Effgen, T. 2007. Comportamento fisiológico de dois clones de Eucalyptus
na época e chuvosa. Cerne 13(2): 149-159.
Thornley, J. 1976. Mathematical models in plant physiology. Academic Press Inc. UK. 318 p.
Triono S. 2004. PotensiPenyerapanKarbondioksida pada TanamanAkasia (Acacia crassicarpa) dan Gmelina (Gmelina
arboreaLinn.) BerdasarkanModelPertumbuhanLogistik dan KurvaResponCahaya. InstitutPertanianBogor.
Indonesia. 74 pp.
Vallejos, J.; Badilla, Y.; Picado, F.; Murillo, O. 2010. Metodología para la selección e incorporación de árboles plus en
programas de mejoramiento genético forestal. Revista Agronomía Costarricense 34(1): 105-119.
Vellini, A; Paula, N; Alves, P; Pavani, L; Bonine, C; Scarpinati, E; Paula, R. 2008. Respostas fisiológicas de diferentes
clones de eucalipto sob diferentes regimes de irrigação. Revista Árvore. 32(4): 651-663.
Villegas, J. 2012. Niveles óptimos de concentración de regulador de crecimiento en el enraizamiento de esquejes y
preparación foliar previa a la cosecha de clones de Melina (Gmelina arborea Roxb.) en el vivero forestal del
INISEFOR, La Palma de Puerto Jiménez, Golfito. Bach. Ing. Forestal. Heredia, Costa Rica. Universidad Nacional.
47 p.
Wee, A; Li, C; Dvorak, W. 2012. Genetic diversity in natural populations of Gmelina arborea: implications for breeding and
conservation. New Forests. 43: 411-428.
Zufferey, V; Murisier, F; Schultz, R. 2000. A model analysis of the photosynthetic response of Vitisvinifera L. cvs Riesling
and Chasselas leaves in the field: I. Interaction of age, light and temperature. Vitis. 39(1): 19-26.