Embed Size (px)
Citation preview
PHOTOSYNTHESIS YIELD ANALYZER MINI-PAM
Portable Chlorophyll Fluorometer
Handbook of Operation
2.115 / 04.96 2. Edition: August 1999
minip_1eb.doc
© Heinz Walz GmbH, 1999
Heinz Walz GmbH • Eichenring 6 • 91090 Effeltrich • Germany Phone +49-(0)9133/7765-0 • Telefax +49-(0)9133/5395
E-mail [email protected] • Internet www.walz.com
Printed in Germany


CONTENTS
1 Safety instructions ........................................................................ 1 1.1 General safety instructions ........................................................ 1 1.2 Special safety instructions......................................................... 1
2 General Information .................................................................... 2 3 Basic Operation of the MINI-PAM............................................. 4 4 Description of the eight Keyboard Functions ............................ 7
4.1 Single key operations ................................................................ 7 4.2 Double key operations............................................................... 8
5 Important Points for Correct YIELD-Measurements ............ 10 6 Description of the Memory-Function ....................................... 12 7 The Mode-Menu ......................................................................... 14
7.1 List of Menu points ................................................................. 15 7.2 Description of the Mode-menu points..................................... 17
8 Components of the MINI-PAM................................................. 29 8.1 Main Control Unit ................................................................... 29
8.1.1 Fluorescence excitation and detection .............................. 30 8.1.2 Special information on MINI-PAM/B .............................. 31 8.1.3 Internal halogen lamp as actinic light source .................... 33 8.1.4 Rechargeable battery......................................................... 34 8.1.5 LC-display......................................................................... 35 8.1.6 Electronic components ...................................................... 36 8.1.7 Description of the connectors ........................................... 37
8.2 Fiberoptics MINI-PAM/F and Miniature Fiberoptics MINI-PAM/F1 ........................................................................ 38
8.3 Leaf-Clip Holder 2030-B ........................................................ 41 8.4 Micro Quantum/Temp.-Sensor 2060-M.................................. 45 8.5 External Halogen Lamp 2050-HB........................................... 45 8.6 Dark Leaf Clip DLC-8 ............................................................ 47
I
CONTENTS
9 Data Transfer.............................................................................. 48 10 Operation of the MINI-PAM via a PC-Terminal and the
RS 232 Interface ......................................................................... 51 11 Maintenance................................................................................ 53
11.1 Internal battery and its replacement ........................................ 53 11.2 Halogen lamp and its replacement .......................................... 54 11.3 Fuse replacement..................................................................... 55 11.4 EPROM and its replacement ................................................... 55
12 Chlorophyll Fluorescence Measurements with the MINI-PAM.................................................................................. 57
12.1 Chlorophyl fluorescence as an indicator of photosynthesis .... 58 12.2 The PAM measuring principle ................................................ 64 12.3 Assessment of photosynthesis with the MINI-PAM: Outline
of the most important functions in practical applications. ...... 67 12.3.1 Maximal photochemical yield Fv/Fm ............................... 67 12.3.2 ML-BURST (menu point 5).............................................. 68 12.3.3 AUTO-ZERO (menu point 2) ........................................... 69 12.3.4 Fo, Fm (menu point 25) .................................................... 70 12.3.5 INT.TEMP (menu point 35).............................................. 71 12.3.6 qP, qN and NPQ (menu points 26 and 27)........................ 73 12.3.7 YIELD-measurements of illuminated samples ................. 75 12.3.8 ACT-LIGHT and ACT+YIELD (menu points 12 and 13)76 12.3.9 LIGHT CURVE (menu point 17) and LIGHT-
CURVE+REC (menu point 18) ........................................ 79 12.3.10 YIELD- and ETR-averaging (menu point 11) .................. 82 12.3.11 INDUCTION CURVE (menu point 21) and
INDUCTION CURVE+RECOVERY (menu point 22).... 83 12.3.12 Repetition Clock (menu point 28: REP-CLOCK and
double key function ON+MEM)....................................... 85
II

CONTENTS
III
13 Appendix ..................................................................................... 87 13.1 Technical specifications .......................................................... 87 13.2 List of warnings and errors...................................................... 91 13.3 PIN-assignments...................................................................... 93 13.4 List of commands for operation of MINI-PAM via
PC-terminal by user-written software ..................................... 94 13.5 Selected reviews on chlorophyll fluorescence and related
topics ....................................................................................... 98 14 Rechargeable battery ............................................................... 104 15 Warranty conditions ................................................................ 105


CHAPTER 1 SAFETY INSTRUCTIONS
1
1 Safety instructions
1.1 General safety instructions 1. Read the safety instructions and the operating instructions first.
2. Pay attention to all the safety warnings.
3. Keep the device away from water or high moisture areas.
4. Keep the device away from dust, sand and dirt.
5. Always ensure there is sufficient ventilation.
6. Do not put the device anywhere near sources of heat.
7. Connect the device only to the power source indicated in the operating instructions or on the device.
8. Clean the device only according to the manufacturer’s recommendations.
9. Ensure that no liquids or other foreign bodies can find their way inside the device.
10. The device should only be repaired by qualified personnel.
1.2 Special safety instructions 1. The MINI-PAM Photosynthesis Yield Analyzer is a highly
sensitive research instrument which should be used only for research purposes, as specified in this manual. Please follow the instructions of this manual in order to avoid potential harm to the user and damage to the instrument.
2. The MINI-PAM employs high intensity light sources which may cause damage to the eye. Avoid looking directly into these light sources during continuous illumination or saturation pulses.

CHAPTER 2 GENERAL INFORMATION
2 General Information The Photosynthesis Yield Analyzer MINI-PAM has been developed with special attention to the quick and reliable assessment of the effective quantum yield of photochemical energy conversion in photosynthesis. The most relevant information is obtained by a single key operation within a second and up to 4000 data sets can be stored for later analysis. Due to a novel opto-electronic design and modern microprocessor technology, the MINI-PAM is extremely compact and at the same time highly sensitive and selective. It is ideally suited for rapid screening of photosynthetic activity in the field, green house and laboratory and due to its robust, waterproof housing it can be used even in extreme environments.
The MINI-PAM, like all PAM Fluorometers, applies pulse-modulated measuring light for selective detection of chlorophyll fluorescence yield. The actual measurement of the photosynthetic yield is carried out by application of just one saturating light pulse which briefly suppresses photochemical yield to zero and induces maximal fluorescence yield. The given photochemical yield then immediately is calculated, displayed and stored. Numerous studies with the previously introduced PAM Fluorometers have proven a close correlation between the thus determined YIELD-parameter (ΔF/Fm') and the effective quantum yield of photosynthesis in leaves, algae and isolated chloroplasts. With the help of the optional Leaf-Clip Holder 2030-B also the photosynthetic active radiation (PAR) can be determined at the site of fluorescence measurement, such that an apparent electron transport rate (ETR) is calculated. In addition to this central information, the MINI-PAM also provides the possibility of measuring fluorescence quenching coefficients (qP, qN, NPQ), applying continuous actinic light for measurement of induction curves (Kautsky-effect) and automatic recordings of light-saturation
2

CHAPTER 2 GENERAL INFORMATION
3
curves with quenching analysis. For these purposes, an extensive MODE-menu is provided.
While the MINI-PAM was conceived as a typical stand-alone instrument for field experiments, it can also be operated under laboratory conditions in conjunction with a PC and the special Windows-software WinControl. When the MINI-PAM is connected to a PC, the information on instrument settings and data registration is continuously exchanged, such that both ways of operation are equivalent.
The WinControl software provides so-called "tooltips" with short explanations of the numerous functions of the MINI-PAM. Hence, use of WinControl is recommended particularly to the beginner for becoming acquainted with the principles of operation and of chlorophyll fluorescence information. It should be emphasized that there is no risk of serious mistakes causing damage. Hence, beginners may feel free to "play" with the system, trying out all functions. For this purpose, the Chart-window is particularly useful, as it records all fluorescence changes like a chart recorder.
This manual deals mainly with the MINI-PAM as such, operated as a stand alone unit. A separate manual will be provided for the WinControl software.
CHAPTER 3 BASIC OPERATION OF THE MINI-PAM
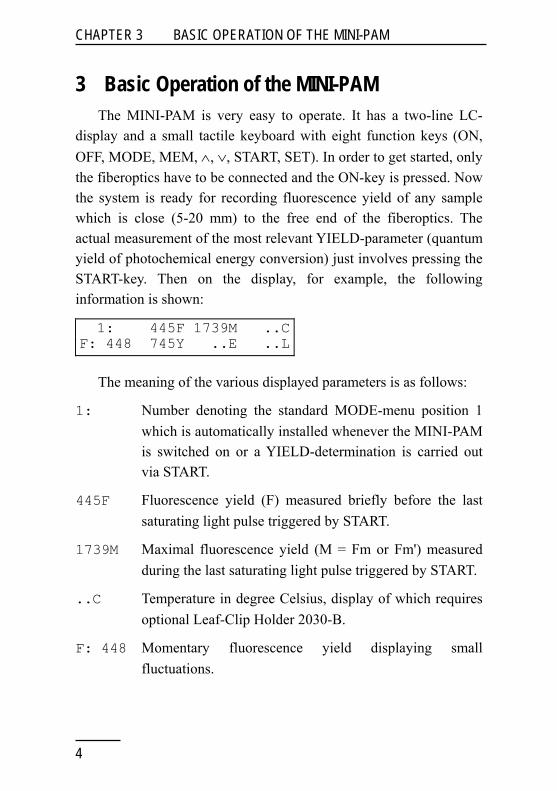
3 Basic Operation of the MINI-PAM The MINI-PAM is very easy to operate. It has a two-line LC-display and a small tactile keyboard with eight function keys (ON, OFF, MODE, MEM, ∧, ∨, START, SET). In order to get started, only the fiberoptics have to be connected and the ON-key is pressed. Now the system is ready for recording fluorescence yield of any sample which is close (5-20 mm) to the free end of the fiberoptics. The actual measurement of the most relevant YIELD-parameter (quantum yield of photochemical energy conversion) just involves pressing the START-key. Then on the display, for example, the following information is shown:
1: 445F 1739M ..C F: 448 745Y ..E ..L
The meaning of the various displayed parameters is as follows:
1: Number denoting the standard MODE-menu position 1 which is automatically installed whenever the MINI-PAM is switched on or a YIELD-determination is carried out via START.
445F Fluorescence yield (F) measured briefly before the last saturating light pulse triggered by START.
1739M Maximal fluorescence yield (M = Fm or Fm') measured during the last saturating light pulse triggered by START.
..C Temperature in degree Celsius, display of which requires optional Leaf-Clip Holder 2030-B.
F: 448 Momentary fluorescence yield displaying small fluctuations.
4
CHAPTER 3 BASIC OPERATION OF THE MINI-PAM
745Y The most relevant YIELD-parameter determined by the last saturating light pulse triggered by START, calculated as follows:
YIELD = Y/1000 = (M-F)/M = ΔF/M = ΔF/Fm' (Genty-parameter)
With a dark-adapted sample ΔF/Fm = Fv/Fm, corresponding to the maximal yield of photochemical energy conversion.
..E Relative rate of electron transport (ETR), display of which requires optional Leaf-Clip Holder 2030-B. It is calculated by the formula:
ETR = E = YIELD x PAR x 0.5 x ETR-factor
..L Light intensity in terms of PAR (quantum flux density of photosynthetically active radiation), display of which requires Leaf-Clip Holder 2030-B.
After every operation of START the obtained data set with the corresponding time and date is entered into a RAM-memory, with a storage capacity of 4000 data sets. The stored data can be called on the display via the MEM-key. Previously recorded data can be recalled by using the arrow-keys (∧ or ∨). Stored data can be printed out via an RS 232 interface or transferred on a PC for further analysis.
The MINI-PAM has been pre-programmed at the factory with standard settings (see list in 7.1) for all relevant measuring parameters (for example Measuring Light Intensity, Gain, Damping, Saturation Pulse Intensity, Saturation Pulse Width etc.). These standard settings are optimized for measurements with standard leaf samples at approx. 12 mm distance between fiberoptics and leaf surface. For special applications, there is great flexibility for appropriate adjustment of all measuring parameters with the help of the extensive MODE-menu, using the arrow-keys (∧ and ∨) in
5

CHAPTER 3 BASIC OPERATION OF THE MINI-PAM
6
combination with the SET-key. Details are given in the MODE-menu list (see 7.2).

CHAPTER 4 DESCRIPTION OF KEYBOARD FUNCTIONS
4 Description of the eight Keyboard Functions
Fig. 1: Photosynthesis Yield Analyzer MINI-PAM
4.1 Single key operations ON To switch MINI-PAM on (short pressing of the key).
To activate the backlighting of the display (switches automatically off when no key operation for 50 s; power saving for field use); requires 3 s pressing of the key.
OFF To switch MINI-PAM off; will occur automatically, if no key operation for 4 min (power saving for field use), unless disabled via menu point 10.
MODE To return to MODE-menu after using the MEM- or SET-keys.
7

CHAPTER 4 DESCRIPTION OF KEYBOARD FUNCTIONS
MEM To enter the MEMORY-level of stored data with the last stored data set being displayed.
∧, ∨ To select one of 51 points of the MODE-menu or one of 4000 data sets when MEMORY is activated:
To change a particular parameter setting in the MODE-menu after operating the SET-key.
For advancement by several steps these keys can be kept pressed.
START To trigger a saturating light pulse for assessment of YIELD and related fluorescence parameters.
SET To start and stop selected function.
4.2 Double key operations Besides the single key operations, there is a number of double key operations which can serve as short-cuts for selecting/carrying out certain items/commands in the MODE-menu. For this purpose, the first key must be kept firmly pressed before briefly pressing the second key.
MODE+START To return to standard display (menu position 1).
MODE+SET To move from one functional block in the MODE-menu to the next (see list in 7.1).
MODE+∧ To move to MODE-menu point 17: LIGHT CURVE (carried out via SET).
MODE+∨ To move to MODE-menu point 21: IND.CURVE.
MODE+ON To switch measuring light on/off.
MODE+MEM To move to MODE-menu point 28: REP-CLOCK.
8

CHAPTER 4 DESCRIPTION OF KEYBOARD FUNCTIONS
9
ON+SET To switch actinic light on/off.
ON+START To start/stop actinic illumination with yield-measurement (see menu point 13).
ON+MEM To start/stop the clock for repetitive triggering of selected function (e.g. saturation pulses when 29: CLOCK-ITEM in position SAT).
ON+∧ To start/stop a LIGHT CURVE (equivalent to menu point 17).
ON+∨ To start/stop an INDUCTION CURVE (equivalent to menu point 21).
SET+OFF To reset program, if MINI-PAM for some reason does not respond to key-operations.
If the MINI-PAM is switched on by RS 232-access the key-controller may not respond. In this case push the ON-key once.
Note:Whenever a command is given which involves the switching on and off of the actinic halogen light source, a short beep-sound confirms that the command is carried out. In addition, there is a more extended beep for the duration of a saturating light pulse.
CHAPTER 5 IMPORTANT POINTS
5 Important Points for Correct YIELD-Measurements
The main purpose of the MINI-PAM is the reliable determination of the YIELD-parameter ΔF/Fm (Genty-parameter). This task is carried out by the MINI-PAM with exceptional sensitivity and reproducibility. Because of the central importance of this particular type of measurement, a special section is devoted to it in this handbook (see section 12.3). Here just the most important practical aspects are outlined which are essential for correct YIELD-measurements:
1) The distance between sample and fiberoptics should be approx. 10-15 mm, such that a normal leaf at standard settings gives a signal of 200-500 units.
2) The AUTO-ZERO function (MODE-menu point 2) should be applied (while sample is removed), in order to suppress any unavoidable background signal which otherwise would cause some lowering of the YIELD-reading (see 12.3.3).
3) In practice, YIELD-measurements make sense only, if the light conditions of the sample are well controlled. For example, a leaf may be severely damaged in Calvin cycle activity and still show a high YIELD-value when dark-adapted or in weak light. The overall photosynthetic performance should be assessed during steady state illumination at a photon flux density which is somewhat below saturation in a control sample. For highest accurracy it is essential that the PAR is measured close to the spot of the sample where also fluorescence is detected. For this purpose the optional Leaf-Clip Holder 2030-B is available (see 8.3). On the basis of the measured YIELD- and PAR-data an apparent electron transport rate (ETR) is calculated and displayed
10
CHAPTER 5 IMPORTANT POINTS
11
(...E). The plot of ETR vs. PAR corresponds to a light-response curve of photosynthesis (see 12.3.9).
4) When YIELD is measured under field conditions, it is essential that the leaf position and effective PAR are not inadvertently changed. During the actual measurement, the fiberoptics must be stably fixed with respect to the leaf surface for ca. 2 s, e.g. with the help of the Leaf-Clip Holder 2030-B.
5) Dark YIELD-measurements require special conditions (see also 12.3.1). As already pointed out in 3), such measurements cannot give information on the overall photosynthetic performance. They are useful to specifically assess the state of PS II, for example following light stress treatment. In this case, it is essential, that the measuring light does not induce any significant increase of fluorescence yield. For this purpose, the MODE-menu point 5 provides the possibility of applying the measuring light in short pulse bursts, thus cutting its integrated intensity to 1/5 (see 12.3.2).
CHAPTER 6 DESCRIPTION OF THE MEMORY-FUNCTION
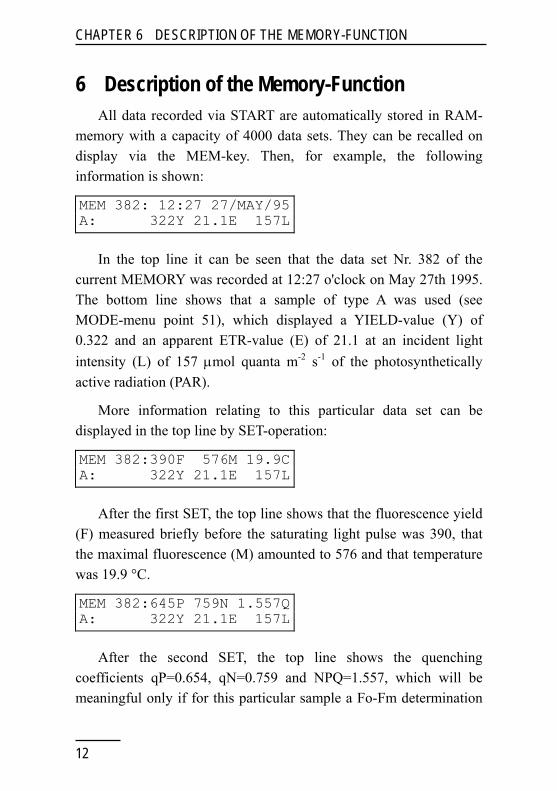
6 Description of the Memory-Function All data recorded via START are automatically stored in RAM-memory with a capacity of 4000 data sets. They can be recalled on display via the MEM-key. Then, for example, the following information is shown:
MEM 382: 12:27 27/MAY/95 A: 322Y 21.1E 157L
In the top line it can be seen that the data set Nr. 382 of the current MEMORY was recorded at 12:27 o'clock on May 27th 1995. The bottom line shows that a sample of type A was used (see MODE-menu point 51), which displayed a YIELD-value (Y) of 0.322 and an apparent ETR-value (E) of 21.1 at an incident light intensity (L) of 157 μmol quanta m-2 s-1 of the photosynthetically active radiation (PAR).
More information relating to this particular data set can be displayed in the top line by SET-operation:
MEM 382:390F 576M 19.9C A: 322Y 21.1E 157L
After the first SET, the top line shows that the fluorescence yield (F) measured briefly before the saturating light pulse was 390, that the maximal fluorescence (M) amounted to 576 and that temperature was 19.9 °C.
MEM 382:645P 759N 1.557Q A: 322Y 21.1E 157L
After the second SET, the top line shows the quenching coefficients qP=0.654, qN=0.759 and NPQ=1.557, which will be meaningful only if for this particular sample a Fo-Fm determination
12
CHAPTER 6 DESCRIPTION OF THE MEMORY-FUNCTION
13
(MODE-menu point 25) had been carried out beforehand (see 12.3.4).
Further operation of SET (2x) leads back to the original display with time and date.
Using the arrow keys ∧ and ∨ one can move within the memory and display any previously recorded data sets.
All data stored in MEMORY can be cleared by the CLEAR MEMORY function (MODE-menu point 39). For safety's sake, this command does not only require execution by SET, but in addition confirmation by the ∧-key. The memory is organized in form of a ring storage and its clearance normally is not required, as old data will be automatically overwritten.
The MEMORY-front normally corresponds to the MEM-No. under which the last set of data was stored. It can be moved to any number between 1 and 4000 with the help of MODE-menu point 38.
After any change in instrumental settings, the complete set of settings will be stored upon the next YIELD-measurement in the Report-file of the WinControl program (see separate manual). This is indicated by "Saved Settings" in the MEMORY-display.
Data stored in MEMORY can be readily transferred to a PC via the RS 232 cable (see section 9).

CHAPTER 7 THE MODE-MENU
7 The Mode-Menu The MODE-menu contains 51 items corresponding to a variety of measured values, instrumental settings or special commands. The positions of the various menu points were arranged for optimal practicability, with the most frequently used functions being closest to the standard position 1.
Increasing or decreasing position numbers are selected by the ∧- or ∨-arrow keys, respectively. Changes are terminated via SET or MODE. Starting from position 1, at increasing numbers there are mostly MODE-points involving commands (for example, 2: AUTO-ZERO), while at decreasing numbers the MODE-points for instrumental settings prevail (for example, 50: MEASURING LIGHT INTENSITY). Some of the MODE-menu positions can be directly reached via double key operations (see list in section 4.2 above).
Irrespective of the selected menu position, a YIELD-measurement can be initiated at any time by pressing the START-key. Normally, the system then automatically returns to the menu position 1 where the measured data set is displayed. The only exceptions are menu-positions 11, 25-27 and 34, where the displayed values are of primary interest.
The operations related to the various points of the MODE-menu are either directly carried out via SET (e.g. 2: AUTO-ZERO: 50) or initiated/terminated (e.g. 50: MEAS-INT: 8) by pressing SET. Settings are changed by arrow key operations (∧, ∨) and become immediately effective. The numbers following the double points show the present settings.
14
CHAPTER 7 THE MODE-MENU
7.1 List of Menu points The Menu points are organized in functional blocks. The starting point of each block can be reached successively by simultaneous pressing of MODE and SET. The frequently used positions MARK, MEAS-INT and GAIN can be readily selected by going backwards from position 1 using the ∨-key.
The below list shows the default settings, which can be reset at any time by the command 36: RES. SETTINGS. The first points of the functional blocks which can be quickly reached by the MODE+SET command, are emphasized by boldface printing. The double-key commands by which some of the menu points can be quickly accessed are also listed.
Menu points: Quick access via: 1. Standard display MODE+START 2. AUTO-ZERO: 0(SET) 3. MEAS.LIGHT: ON (SET) MODE+ON 4. M.FREQ: LOW (SET) 5. ML-BURST: OFF(SET) 6. LIGHT AV15s:OFF(SET) 7. EXT.LIGHT-S:ON (SET) 8. LIGHT CALIB: (SET) 9. DISP.ILLUM.:OFF(SET) 10. AUTO-OFF: ON (SET) 11. AV. YIELD and ETR 12. ACT-LIGHT: OFF(SET) 13. ACT+YIELD: OFF(SET) 14. ACT-WIDTH 0:30 (SET) 15. ACT-INT: 5 (SET) 16. AL-FACT: 1:00 (SET) 17. LIGHT CURVE:OFF(SET) MODE+∧
15

CHAPTER 7 THE MODE-MENU
18. L.CURVE+REC:OFF(SET) 19. LC-WIDTH 0:10 (SET) 20. LC-INT: 3 (SET) 21. IND.CURVE: OFF(SET) MODE+∨ 22. IND.C+REC: OFF(SET) 23. IND-DELAY 0:40 (SET) 24. IND-WIDTH 0:20 (SET) 25. Fo and Fm (SET) 26. qP and qN (SET) 27. NPQ (SET) 28. REP-CLOCK: OFF(SET) MODE+MEM 29. CLOCK-ITEM:SAT(SET) 30. CLK-TIME:00:30(SET) 31. TIME 17:32:56 (SET) 32. DATE 17-OCT (SET) 33. YEAR 1997 (SET) 34. BATT: 12.4V (11.8) 35. INT.TEMP: 23C 36. RES.SETTINGS: (SET) 37. PROGR.D2.07(280698) 38. MEMORY: 12 (SET) 39. CLEAR MEMORY (SET) 40. LIGHT-OFFS: 0(SET) 41. LIGHT-GAIN:1.00(SET) 42. TEMP.OFFS: 0.0(SET) 43. TEMP.GAIN: 1.00(SET) 44. ZERO-OFFS: 20(SET) 45. ETR-FAC: 0.84 (SET) 46. SAT-WIDTH:0.8s(SET) 47. SAT-INT: 8 (SET) 48. DAMP: 2 (SET)
16
CHAPTER 7 THE MODE-MENU
49. GAIN: 2 (SET) 50. MEAS-INT: 8 (SET) 51. MARK: A (SET)
7.2 Description of the Mode-menu points The following list briefly describes the items contained in the MODE-menu, some of which are outlined in more detail in section 12.3 (Assessment of photosynthesis yield with the MINI-PAM). Standard settings are shown.
Standard menu-position for display of the data measured by last saturating light pulse
triggered by START. The 4 central parameters F, M, Y and E, the present fluorescence signal F: (with blinking *), temperature (°C) and and ambient PAR (L) are displayed.
1: 445F 1739M 19.9C F: 448 745Y 6.2E 20L
Command for determination of signal in absence of sample (background signal), the
value of which is displayed and automatically subtracted, such that signal becomes zero without sample. This offset value remains effective for all following measurements until being deliberately changed. It has to be newly determined whenever 50: MEASURING LIGHT INTENSITY or 49: GAIN are modified. If this is not done there is a warning ?NEW OFFSET? when YIELD is determined by START. The warning will stop when a new offset is determined via menu point 2 or the given offset is confirmed in menu position 1 via SET.
2: AUTO-ZERO: 20(SET) F: 448 745Y 6.2E 20L
On/off switch of measuring light. Under standard conditions the measuring light is
on. When switched off, a negative signal indicates the AUTO-ZERO value (see menu point 2). The switch can also be operated via MODE + ON without entering the MODE-menu.
3:MEAS.LIGHT: ON (SET) F: 448 745Y 6.2E 20L
17

CHAPTER 7 THE MODE-MENU
Switch between the standard measuring pulse frequency of 0.6 kHz (LOW) and 20
kHz (HIGH). At 20 kHz the signal/noise is increased by a factor of 5-6. On the other hand, at this high frequency the measuring light intensity can induce substantial fluorescence changes. Hence, 20 kHz normally should be used only when its actinic effect can be neglected relative to a stronger ambient light (e.g. above 100 μmol quanta m-2 s-1).
4: M.FREQ: LOW (SET) F: 448 745Y 6.2E 20L
Switch between normal signal detection (continuously pulsed measuring light) and
signal detection by short bursts of measuring light. In the latter case, pulse trains are 0.2 s with dark-intervals of 0.8 s, resulting in a reduction of integrated measuring light intensity by a factor of 5. This can be advantageous for assessment of the maximal photochemical yield after dark-adaptation (ΔF/Fm = Fv/Fm). In the ML-BURST mode the basic frequencies of 0.6 or 20 kHz are maintained.
5: ML-BURST: OFF(SET) F: 448 745Y 6.2E 20L
When this function is enabled, the readings of the external light sensor are averaged
over a period of 15 s, in order to account for fluctuations of light intensity. It is important that the sensor remains fixed in a given position for 15 s before the actual measurement of quantum yield.
6:LIGHT AV15s:OFF(SET) F: 448 745Y 6.2E 20L
Switch to enable display of external LIGHT-SENSOR readings (in ON-
position). When in OFF-position, the PAR-values stored in an internal list are effective. This list is created via the LIGHT-CAL function (see next menu point).
7:EXT.LIGHT-S:ON (SET) F: 448 745Y 6.2E 20L
Automatized routine for determination of PAR-values of the 12 ACTINIC LIGHT
Intensity settings in a given measuring geometry. These values are stored in a list, which is effective whenever the EXT.LIGHT-
8:LIGHT-CALIB: (SET) F: 448 745Y 6.2E 20L
18
CHAPTER 7 THE MODE-MENU
SENSOR is OFF (menu point 7). For this determination the LIGHT-SENSOR must be fixed instead of the sample in front of the fiberoptics. When the routine is carried out, the LIGHT AVERAGING function (menu point 6) is disabled. If it is afterwards required, it must be manually enabled. After the LIGHT-CALIBRATION the EXT.LIGHT-SENSOR (menu point 7) is in the OFF-position.
When in ON-position, the DISPLAY is continuously illuminated. It should be
noted, that this may cause considerable costs of battery power. When in OFF-position, DISPLAY ILLUMINATION can be transiently turned on for 40 s by pressing ON for 3 s.
9: DISP.ILLUM:OFF(SET) F: 448 745Y 6.2E 20L
On/off switch to enable/disable the power saving automatics which turn off the
MINI-PAM after 4 min without key operation. It is advisable to disable the AUTO-OFF when the MINI-PAM is connected to an external power supply (via CHARGE-socket). Whenever the instrument is switched off manually, the AUTO-OFF function is enabled again (automatic reset to ON-position). The AUTO-OFF function is also automatically enabled when battery voltage drops below 11.2 V.
10: AUTO-OFF: ON (SET) F: 448 745Y 6.2E 20L
Function to average a number of consecutive YIELD- and ETR-deter-
minations. The SET-key is used to reset the counter to 0 and to erase the averaged values of the preceding measurements. For safety's sake the reset must be confirmed by pressing the ∧-key. The averaged YIELD and ETR are shown in the top line, whereas in the bottom line the values of the last measurement are displayed.
11:AV. 564Y 5.9E 8No F: 448 745Y 6.2E 20L
On/off switch of the internal actinic light source (halogen lamp). This can also be
directly operated via ON + SET. The internal actinic lamp is not
12: ACT-LIGHT: OFF(SET) F: 448 745Y 6.2E 20L
19

CHAPTER 7 THE MODE-MENU
meant to be turned on for extended periods of time, as this may lead to excessive internal heating. Therefore, the illumination periods are restricted (see menu point 14: ACT-WIDTH). There is a blinking sign (ACT) in the upper left corner while actinic illumination is on.
On/off switch of the internal actinic light source, with additional application of a
saturation light pulse for YIELD-assessment at the end of the illumination time which is set by menu point 14: ACT-WIDTH. There is a blinking sign (A+Y) in the upper left corner of the display while actinic illumination with terminal YIELD-determination is running. This function can be also directly started from standard position 1 by double key operation ON + START.
13: ACT+YIELD: OFF(SET) F: 448 745Y 6.2E 20L
Setting of actinic illumination time. The setting can be modified via SET and the
arrow-keys in 10 s steps. Maximal setting is limited to 5 min (5:00) in order to avoid excessive internal heating.
14:ACT-WIDTH 0:30 (SET) F: 448 745Y 6.2E 20L
Setting of intensity of internal actinic light source (halogen lamp). The setting can be
modified via SET and the arrow-keys between 0 and 12. The range covered by intensities 1-12 can be shifted up and down with the help of AL-FACT (menu point 16).
15: ACT-INT: 5 (SET) F: 448 745Y 6.2E 20L
Actinic light factor by which the range of actinic intensities (ACT-INT, menu point
15) can be shifted up and down. The standard factor of 1.00 can be modified between 0.5 and 1.5 via SET and the arrow keys. The relationship between AL-FACT and PAR is non-linear.
16: AL-FACT: 1.00 (SET) F: 448 745Y 6.2E 20L
When switched on via SET, first the maximal YIELD in the absence of actinic
light (Fv/Fm) is measured and then a series of 8 consecutive YIELD-measurements at increasing light intensities is started. This function
17:LIGHT CURVE:OFF(SET) F: 448 745Y 6.2E 20L
20
CHAPTER 7 THE MODE-MENU
can be also directly started by double key operation ON + ∧. The time periods at the different intensities are set by menu point 19: LC-WIDTH. There is a blinking sign (LC) in the upper left corner of the display while a LIGHT CURVE is recorded. The series involves YIELD-determinations at 8 settings of actinic light. It starts with the intensity-setting, which is selected by 20: LC-INT, where one can choose between values from ACT-INT 1 to 5, with the standard setting being ACT-INT 3. The range of absolute PAR-values corresponding to these settings can be moved up and down with the help of menu point 16: AL-FACT or by changing the distance between fiberoptics and sample. The effective PAR-values at the sample surface may be calibrated by the LIGHT-CALIBRATION routine (menu point 8). A LIGHT CURVE can provide profound information on the overall photosynthetic performance of a plant, even if the illumination periods are too short to achieve true steady states. Note: Due to the unavoidable internal heating during recording of a LIGHT CURVE, assessment of absolute fluorescence signal amplitudes is problematic, but this does not affect correct determination of the ratio ΔF/Fm'.
When switched on via SET, a LIGHT CURVE is measured as described for menu
point 17 and in the following dark period the recovery of YIELD is assessed by 6 consecutive measurements at 10 s, 30 s, 60 s, 2 min, 5 min and 10 min following illumination. Note: Due to the unavoidable internal heating during recording of a LIGHT CURVE assessment of absolute fluorescence signal amplitudes is problematic, but this does not affect correct determination of the ratio ΔF/Fm'.
18:L.CURVE+REC:OFF(SET) F: 448 745Y 6.2E 20L
LC-WIDTH determines the illumination time at each intensity setting. 10 s are
19: LC-WIDTH 0:10 (SET) F: 448 745Y 6.2E 20L
21
CHAPTER 7 THE MODE-MENU
sufficient for so-called "rapid light curves". It is limited to 3 min in order to avoid excessive internal heating.
The LC-INT determines the starting intensity which can be chosen between
settings 1 to 5. LIGHT CURVES always involve 8 intensities. Hence, more emphasis may be put either on the linear rise or on the plateau region of the curve.
20: LC-INT: 3 (SET) F: 448 745Y 6.2E 20L
This function starts registration of a dark-to-light INDUCTION CURVE with
Saturation Pulse Quenching Analysis. Normally dark-adapted samples are used. First a saturation pulse is given for determination of Fo, Fm and Fv/Fm. After a certain dark time, set by IND. DELAY (menu point 23), ACTINIC LIGHT at a given intensity (ACT-INT, menu point 15) is turned on and 8 saturation pulses are applied at intervals determined by IND.WIDTH (menu point 24).
21: IND.CURVE: OFF(SET) F: 448 745Y 6.2E 20L
In addition to the recording of dark-to-light INDUCTION CURVE (as described for
menu point 21), after turning off the ACT.-LIGHT 6 saturation pulses are applied at 10 s, 30 s, 60 s, 2 min, 5 min and 10 min to assess the dark recovery of fluorescence parameters.
22: IND.C+REC: OFF(SET) F: 448 745Y 6.2E 20L
Delay time between first saturation pulse and turning-on of ACT-LIGHT. The
default setting is 40 s. Possible settings range from 5 s to 10 min.
23:IND-DELAY 0:40 (SET) F: 448 745Y 6.2E 20L
Time interval between two consecutive saturation pulses during recording of
IND.CURVE. The default setting is 20 s. Possible settings range from 5 s to 3 min.
24:IND-WIDTH 0:20 (SET) F: 448 745Y 6.2E 20L
Function to sample the minimal 25:Fo: 530 Fm:2650(SET) F: 448 745Y 6.2E 20L
22
CHAPTER 7 THE MODE-MENU
fluorescence, Fo, and maximal fluorescence, Fm, of a dark-adapted sample by use of the SET-key. The thus sampled values are stored until new values are sampled via SET. With START a normal YIELD-determination is carried out and the given Fo- and Fm-values are maintained. The stored Fo- and Fm-values are used for determination of the quenching coefficients qP, qN and NPQ (see menu points 26 and 27). In some applications, in order to obtain minimal Fo it is advantageous to make use of the ML-BURST function (see menu point 5).
Coefficients of photochemical quenching, qP, and non-photochemical quenching, qN,
as defined by the following equations:
26: qP:1000qN:000 (SET) F: 448 745Y 6.2E 20L
qP=(M-F)/(M-Fo) and qN=(Fm-M)/(Fm-Fo)
In order to obtain the usual values between 0 and 1, the displayed values have to be multiplied by 0.001. qP is set to 000 if M<F and qN is set to 000 if M>Fm. qN is set to 1.000 if M<Fo.
Note: M here represents the maximal fluorescence measured by a saturation pulse in any given light state (normally denoted Fm'), whereas Fm and Fo are the particular values sampled via menu point 25 after dark-adaptation. The thus determined values of qP and qN should be considered approximations only, as a possible non-photochemical quenching of Fo is not taken into consideration.
Parameter describing non-photochemical quenching defined by the equation:
27: NPQ:1.440 (SET) F: 448 745Y 6.2E 20L
NPQ = (Fm-M)/M
Note: M here represents the maximal fluorescence measured by a saturation pulse in any given light state (normally denoted Fm'), whereas Fm is the particular value sampled via menu point 25 after dark-adaptation. NPQ has been shown to be closely related to the
23
CHAPTER 7 THE MODE-MENU
excess light energy which is actively dissipated by plants into heat in order to avoid photodamage. Contrary to qN, NPQ-determination does not require knowledge of Fo and is not affected by non-photochemical quenching of Fo. NPQ is set to 0.000 if M>Fm.
On/off switch of repetition clock which serves to trigger a number of functions
which are specified in menu point 29: CLOCK ITEM. This function can be also directly started by double key operation ON + MEM.
28: REP-CLOCK: OFF(SET) F: 448 745Y 6.2E 20L
This menu point allows to choose between the following functions to be triggered by
the REPETITION CLOCK:
29: CLOCK-ITEM:SAT(SET) F: 448 745Y 6.2E 20L
SAT-PULSE, ACT-LIGHT, ACT + YIELD, LIGHT CURVE, L-CURVE + REC., IND. CURVE , IND.C + REC.
Setting of clock interval, which is the time between two consecutive saturation pulses
(or other functions) triggered by the REP-CLOCK (menu point 28). The setting can be modified via SET and the arrow-keys in 10 s steps. Possible settings range from 0:10 to 42:30. When moving beyond the maximal time, the lowest values are reached and vice versa.
30: CLK-TIME: 0:30(SET) F: 448 745Y 6.2E 20L
Display of present time which can be modified via SET and the arrow-keys.
With SET one can move from the hours to minutes and vice versa. The change is terminated via MODE.
31: TIME 14:43:51 (SET) F: 448 745Y 6.2E 20L
Display of present date which can be modified via SET and the arrow-keys.
With SET one can move from the days to months and vice versa. The change is terminated via MODE.
32: DATE 17-OCT (SET) F: 448 745Y 6.2E 20L
Display of present year which can be 33: YEAR 1999 (SET) F: 448 745Y 6.2E 20L
24
CHAPTER 7 THE MODE-MENU
modified via SET and the arrow-keys. The change is terminated via MODE.
Display of battery voltage. The value in brackets shows the voltage observed
during the last saturation pulse (transiently decreased value due to high current of halogen lamp). YIELD-measurements may become erroneous, if the voltage during a pulse drops below 8.0 V (Error message 6: CHECK BATTERY). The battery voltage is a non-linear function of the remaining battery capacity. When dropped below 11.2 V (without saturation pulse) the remaining capacity is approx. 20 % and recharging soon will become necessary. In this case there is a warning (BAT-sign blinking in the left corner of the upper display line).
34: BATT: 12.8V (12.3) F: 448 745Y 6.2E 20L
Display of internal temperature of the instrument which is measured close to the
optical unit. An increase of temperature causes a decrease of measuring light intensity and, hence, simulates a decrease of fluorescence yield. This may effect measurements of qP, qN and NPQ, but not of YIELD and ETR.
35: INT.TEMP: 24C F: 448 745Y 6.2E 20L
Command to reset all instrument settings (which can be varied via the MODE-
menu) to the standard settings preset at the factory (see in section 7.1).
36: RES.SETTINGS: (SET) F: 448 745Y 6.2E 20L
Number and date of origin of current program version of the MINI-PAM which
is resident on EPROM.
37: PROGR.M2.24(170299) F: 448 745Y 6.2E 20L
Function to move the present MEMORY-front to any number between 1 and 4000.
This function may be important when the MEMORY is full and the user wants to avoid overwriting of certain older data.
38: MEMORY: 125 (SET) F: 448 745Y 6.2E 20L
25
CHAPTER 7 THE MODE-MENU
Note: The MEMORY-front is identical to the MEM-number under which the last data set was stored. It advances by 1 with each following YIELD-determination.
Command to erase all data accumulated in MEMORY. For safety's sake this command
is not yet carried out by SET but requires confirmation by pressing the ∧-key. Then the MEMORY-front is reset to 0 and the data set recorded with the next saturation pulse will be in MEM position 1.
39: CLEAR MEMORY (SET) F: 448 745Y 6.2E 20L
Function for adjustment of PAR-reading by comparison with calibrated device.
Particular care must be taken that both sensors are exposed to the same photon flux density. After SET, the PAR-reading (L) can be adjusted by the arrow-keys in steps of 1 μmol quanta m-2 s-1. For proper calibration over a wide range of PAR also adjustment of LIGHT-GAIN (menu point 41) may be required. This can be checked by comparison with calibrated device at a different PAR-value.
40: LIGHT-OFFS: 20(SET) F: 448 745Y 6.2E 20L
Function for adjustment of PAR-reading. The adjustment via LIGHT-GAIN should
be carried out after a preceding adjustment by LIGHT-OFFS (menu point 40) at a different light intensity, such that the slope of the response curve can be evaluated. For highest accuracy, the LIGHT-OFFS then may have to be adjusted once more (menu point 40).
41:LIGHT-GAIN:1.00(SET) F: 448 745Y 6.2E 20L
Function for adjustment of leaf temperature-reading with optional Leaf-
Clip Holder 2030-B in comparison with calibrated device. After SET, the temperature reading can be adjusted by the arrow-keys in 0.1 °C steps. For proper calibration over a wide temperature range also adjustment of TEMP-GAIN (menu point 43) may be required. This can be checked by comparison with a calibrated device at different temperatures.
42:TEMP.OFFS: 0.0(SET) F: 448 745Y 6.2E 20L
26
CHAPTER 7 THE MODE-MENU
Function for adjustment of leaf temperature-reading with optional Leaf-
Clip Holder 2030-B. The adjustment via TEMP-GAIN should be carried out after a preceding adjustment by TEMP-OFFS (menu point 42) at a different temperature, such that the slope in the temperature response curve can be evaluated. For highest accurracy, TEMP-OFFS then may have to be adjusted once more (menu point 42).
43:TEMP.GAIN:1.00 (SET) F: 448 745Y 6.2E 20L
Display of present zero offset value which normally is identical to the value obtained
automatically via AUTO-ZERO (menu point 2). Following SET, this value can be manually modified using the arrow-keys.
44: ZERO-OFFS: 20(SET) F: 448 745Y 6.2E 20L
Display of current factor applied for calculation of relative electron transport
rate (ETR) which for a standard leaf is defined as follows:
45: ETR-FAC: 0.84 (SET) F: 448 745Y 6.2E 20L
ETR = Yield x PAR x 0.5 x 0.84
The standard factor 0.84 corresponds to the fraction of incident light absorbed by a leaf. The preset value, which corresponds to an average observed with a variety of leaf species, can be modified via SET and the arrow-keys.
Setting of the width of saturating light pulses for YIELD-determination. The
setting can be changed between 0.4 and 3.0 s in 0.2 s steps.
46: SAT-WIDTH:0.8s(SET) F: 448 745Y 6.2E 20L
Setting of saturation pulse intensity for YIELD-determination. Settings can be
changed between 0 and 12.
47: SAT-INT: 8 (SET) F: 448 745Y 6.2E 20L
Setting of electronic signal damping. The three settings correspond to the following
48: DAMP: 2 (SET) F: 448 745Y 6.2E 20L
27

CHAPTER 7 THE MODE-MENU
28
time constants (defined for 63.2 % of a signal change): 1: 0.05 s, 2: 0.2 s, 3: 1 s.
Setting of electronic signal gain (amplification factor) which can be varied
between 1 and 12. By increasing GAIN not only the signal but also the noise increases in proportion. Any change in GAIN requires a new determination of the unavoidable background signal via AUTO-ZERO (menu point 2).
49: OUT-GAIN: 2 (SET) F: 448 745Y 6.2E 20L
Setting of intensity of measuring light which can be varied between 0 and 12.
Any change in MEAS-INT requires a new determination of the unavoidable background signal via AUTO-ZERO (menu point 2).
50: MEAS-INT: 8 (SET) F: 448 745Y 6.2E 20L
Letter from A to Z for identification of a particular type of sample. This MARK is
entered into the MEMORY with every new data set measured in connection with a saturation pulse. It can be helpful when a number of different plants are assessed in the field.
51: MARK: A (SET) F: 448 745Y 6.2E 20L
CHAPTER 8 COMPONENTS OF THE MINI-PAM
29
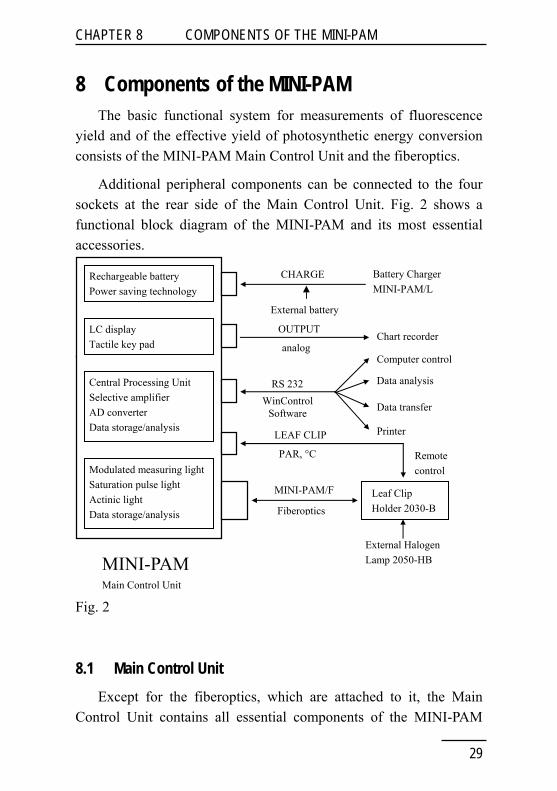
8 Components of the MINI-PAM The basic functional system for measurements of fluorescence yield and of the effective yield of photosynthetic energy conversion consists of the MINI-PAM Main Control Unit and the fiberoptics.
Additional peripheral components can be connected to the four sockets at the rear side of the Main Control Unit. Fig. 2 shows a functional block diagram of the MINI-PAM and its most essential accessories.
control
Fig. 2
8.1 Main Control Unit Except for the fiberoptics, which are attached to it, the Main Control Unit contains all essential components of the MINI-PAM
MINI-PAM Main Control Unit
Remote control
CHARGE
WinControl Software
Computer control
Data analysis
Printer
Data transfer
Rechargeable battery Power saving technology
LC display Tactile key pad
Central Processing Unit Selective amplifier AD converter Data storage/analysis
Modulated measuring light Saturation pulse light Actinic light Data storage/analysis
Leaf Clip Holder 2030-B
RS 232
MINI-PAM/F
Fiberoptics
LEAF CLIP
PAR, °C
OUTPUT
analog
Battery Charger MINI-PAM/L
External battery
Chart recorder
External Halogen Lamp 2050-HB
CHAPTER 8 COMPONENTS OF THE MINI-PAM
Fluorometer. These include the optics for fluorescence excitation and detection, the selective amplifier, the data acquisition and storage system, an actinic light source for saturation pulses and continuous illumination, a large rechargeable battery and the user interface, with the LC-display and keyboard. Details on some of these components are given in the following sections.
8.1.1 Fluorescence excitation and detection In the standard version of the MINI-PAM fluorescence is excited by pulse modulated red light from a light-emitting-diode (LED). The pulse-width is 3 μs and pulse frequency is 0.6 or 20 kHz. In the so-called "burst-mode" pulse trains of 0.2 s are alternating with 0.8 s dark-intervals. The LED-light is passed through a cut-off filter (Balzers DT Cyan, special) resulting in an excitation band peaking at 650 nm, with a very small "tail" at wavelengths beyond 700 nm. Fluorescence is detected with a PIN-photodiode at wavelengths beyond 700 nm, as defined by a long-pass filter (type RG 9, Schott).
The effective intensity of the measuring light at the level of the sample is an important parameter for correct determination of the minimal fluorescence yield, Fo, of a dark-adapted sample. Its absolute value depends on
• intensity setting (menu point 50, preset value 8),
• measuring frequency (menu point 4, preset at 0.6 kHz),
• burst mode status (menu point 5, preset to be off),
• distance between fiberoptics and sample (standard 12 mm).
At the standard distance of 12 mm between fiberoptics and sample, and at measuring light intensity 8, the quantum flux density of photosynthetic active radiation typically amounts to 0.15 μmol
30

CHAPTER 8 COMPONENTS OF THE MINI-PAM
quanta m-2 s-1 at 0.6 kHz and 5 μmol quanta m-2 s-1 at 20 kHz. These values are lowered to 1/5 when the burst mode is active. At such low intensities an "actinic effect" of the measuring light normally can be excluded.
8.1.2 Special information on MINI-PAM/B Recently strong blue LEDs with an emission peak around 470 nm have become available and the MINI-PAM/B was developed which employs such LED as measuring light source. Using 470 nm measuring light has a number of technical and practical consequences which shall be briefly outlined.
• Excitation filters:
The 470 nm LED light is passing through a set of short-pass filters with λ < 620 nm (Balzers DT Cyan special).
• Detector filters:
The PIN-photodetector is protected by a set of long-pass filters with λ > 650 nm (Balzers R65 and Schott RG 645).
• Measuring light:
At the same intensity setting (MEAS-INT) the integrated intensity of the measuring light pulses of the blue version is less than that of the red version by approximately a factor of 3. Therefore, the MEAS-INT can be applied at higher settings without the risk of an actinic effect.
• Actinic light:
The actinic light passes the same filters as the measuring light. Therefore, the short-pass wavelength of 620 nm not only applies to measuring light but to actinic light and saturation pulse light as well. Consequently, as the red component of the halogen lamp
31
CHAPTER 8 COMPONENTS OF THE MINI-PAM
is cut off, the absolute values of actinic light intensities are lower than in the standard instrument version and in order to obtain equivalent PAR-values, correspondingly higher intensity settings must be chosen.
• Spectral shifts:
It is an unavoidable property of halogen light sources that the emission spectrum shifts from red to blue when the light output increases with increasing power. This property may complicate the assessment of photosynthetically active radiation and consequently of relative electron transport rate (ETR) as well. As the red part of the spectrum is not used in the MINI-PAM/B, this aspect is less problematic than in the standard instrument version.
• Chlorophyll excitation:
In most photosynthetic organisms blue light excites chlorophyll fluorescence about as well as red light. However, in organisms with phycobilisomes (cyanobacteria and red algae) the yield of blue light excited fluorescence is rather low. This is due to the fact that most of the chlorophyll in these organisms is associated with photosystem I and in a low-fluorescent state. Therefore, the use of the blue instrument versions cannot be recommended for the study of such organisms (e.g. also lichen with cyanobacteria as photobionts).
32

CHAPTER 8 COMPONENTS OF THE MINI-PAM
• Chlorophyll emission:
As the cut-off wavelength of the detector filter is shifted from 710 nm in the standard version to 650 nm in the blue version, the latter also detects the main chlorophyll emission peaking around 685 nm which originates mainly from photosystem II and, hence, shows higher values of variable fluorescence.
8.1.3 Internal halogen lamp as actinic light source A miniature 8 V/20 W halogen lamp (type Bellaphot, Osram) serves as light source for saturation pulses and for continuous actinic illumination. The light is filtered two-fold by a heat-reflecting filter (Balzers, Calflex-X, special) and by a short-pass filter (Balzers, DT Cyan, special), such that white light with negligible content of wavelengths beyond 700 nm (standard version) or beyond 640 nm (MINI-PAM/B) is obtained.
It is not recommended to operate the internal halogen lamp for extended periods of actinic illuminations as this would lead to excessive internal heating. This aspect must be taken particularly serious when light curves are automatically recorded (menu points 17 and 18) and when the range of actinic intensities is increased by AL-FACT (menu point 16). A temperature-sensor, which is mounted in the vicinity of the lamp, causes turn-off of the lamp power supply when 70 °C is reached. It is turned on again when temperature has dropped to approx. 55 °C. The internal temperature, the value of which is displayed under menu point 35, affects the output of the measuring light LED. A 1 °C temperature rise leads to approx. 1 % lowering of the measuring light intensity. While not affecting the actual YIELD-measurement (i.e. ΔF/Fm'), this will lead to a corresponding drop in the fluorescence signal. For prolonged actinic illumination, particularly at high intensities, the External Halogen
33
CHAPTER 8 COMPONENTS OF THE MINI-PAM
Lamp 2050-HB in combination with the Leaf-Clip Holder 2030-B is recommended.
8.1.4 Rechargeable battery A relatively large rechargeable lead acid battery (12 V/2 Ah) is mounted in the bottom of the MINI-PAM housing. For recharging, the Battery Charger MINI-PAM/L is provided which is connected to the CHARGE-socket at the rear side of the MINI-PAM. The charger, which operates at input voltages between 100 and 240 V AC, features an overload protection. Full charging of an empty battery takes approx. 5 hours. Battery voltage is displayed under menu point 34. The warning 'BAT' is given in the upper left corner of the display when voltage drops below 11.2 V in the resting state. If in this situation the AUTO-OFF function (menu point 10) is disabled, it will be automatically enabled again. In addition, there is the warning Err. 3: 'LOW BATTERY' which, however, is coupled to measurements involving START. After this error message approximately 20 further measurements can be made and the battery should be soon recharged. In brackets also the voltage is given which was measured during the last saturation pulse. It is normal that voltage drops by 0.5 V during a saturation pulse. However, if it drops below 8 V, YIELD-measurements may become erronous, as Fm' is likely to be underestimated. In this case, there is the warning Err. 6: 'CHECK BATTERY'.
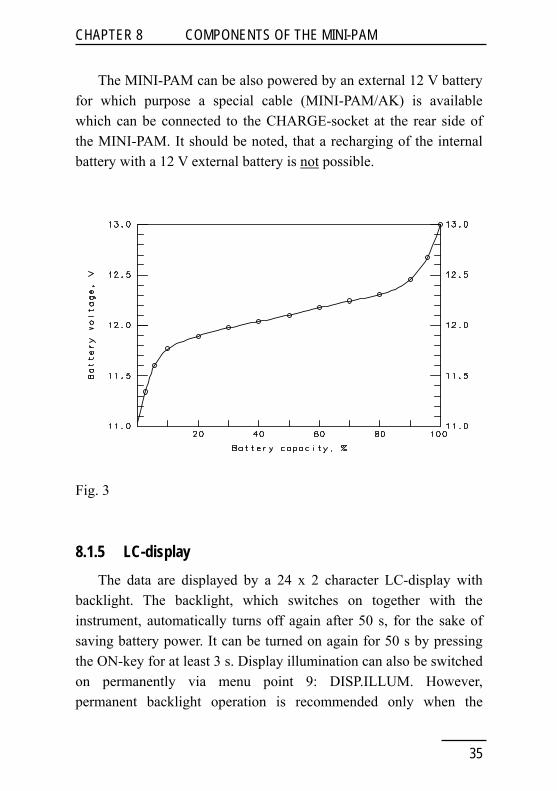
With a fully charged battery the displayed voltage is 12.5 - 12.9 V. In first approximation, battery voltage can be taken as a measure of remaining battery power. The functional relationship between capacity (Ah) and voltage of a new battery is depicted in Fig. 3. It is apparent that battery voltage first drops steeply to about 12.3 V and then slowly decreases to about 11.8 V, from whereon there is a steep further drop to values below 11 V.
34
CHAPTER 8 COMPONENTS OF THE MINI-PAM
The MINI-PAM can be also powered by an external 12 V battery for which purpose a special cable (MINI-PAM/AK) is available which can be connected to the CHARGE-socket at the rear side of the MINI-PAM. It should be noted, that a recharging of the internal battery with a 12 V external battery is not possible.
Fig. 3
8.1.5 LC-display The data are displayed by a 24 x 2 character LC-display with backlight. The backlight, which switches on together with the instrument, automatically turns off again after 50 s, for the sake of saving battery power. It can be turned on again for 50 s by pressing the ON-key for at least 3 s. Display illumination can also be switched on permanently via menu point 9: DISP.ILLUM. However, permanent backlight operation is recommended only when the
35
CHAPTER 8 COMPONENTS OF THE MINI-PAM
battery charger is connected, as it increases basic power consumption from 0.7 W to 1.5 W.
The information shown on the LC-display is intentionally restricted to the most relevant parameters. Additional information can be called on display in connection with the 51 menu points and by entering the MEMORY.
8.1.6 Electronic components The extremely compact design of the MINI-PAM is a consequence of recent progress in miniaturization of solid state integrated circuits. The central processing unit features a powerful CMOS microcontroller. The program software is stored in a CMOS EPROM. This EPROM is readily accessible after removing the bottom of the MINI-PAM (see 11.4) and can be exchanged by the user, if program up-dates become available. A CMOS RAM with 128 kB serves as data memory, providing storage capacity for 4000 data sets.
36
CHAPTER 8 COMPONENTS OF THE MINI-PAM
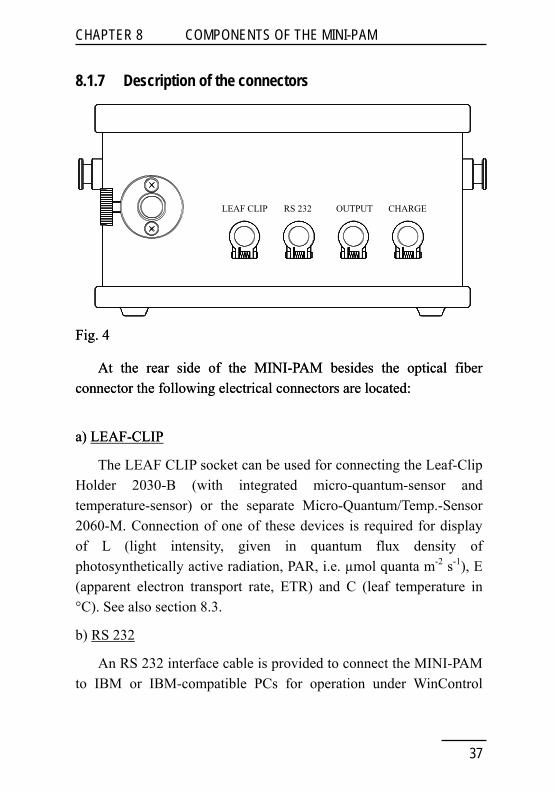
8.1.7 Description of the connectors
LEAF CLIP RS 232 OUTPUT CHARGE
Fig. 4 Fig. 4
At the rear side of the MINI-PAM besides the optical fiber connector the following electrical connectors are located: At the rear side of the MINI-PAM besides the optical fiber connector the following electrical connectors are located:
a) LEAF-CLIP a) LEAF-CLIP
The LEAF CLIP socket can be used for connecting the Leaf-Clip Holder 2030-B (with integrated micro-quantum-sensor and temperature-sensor) or the separate Micro-Quantum/Temp.-Sensor 2060-M. Connection of one of these devices is required for display of L (light intensity, given in quantum flux density of photosynthetically active radiation, PAR, i.e. µmol quanta m-2 s-1), E (apparent electron transport rate, ETR) and C (leaf temperature in °C). See also section 8.3.
b) RS 232
An RS 232 interface cable is provided to connect the MINI-PAM to IBM or IBM-compatible PCs for operation under WinControl
37
CHAPTER 8 COMPONENTS OF THE MINI-PAM
software, data transfer (see 9) or for remote control of the MINI-PAM functions via PC keyboard operation (see 13.4).
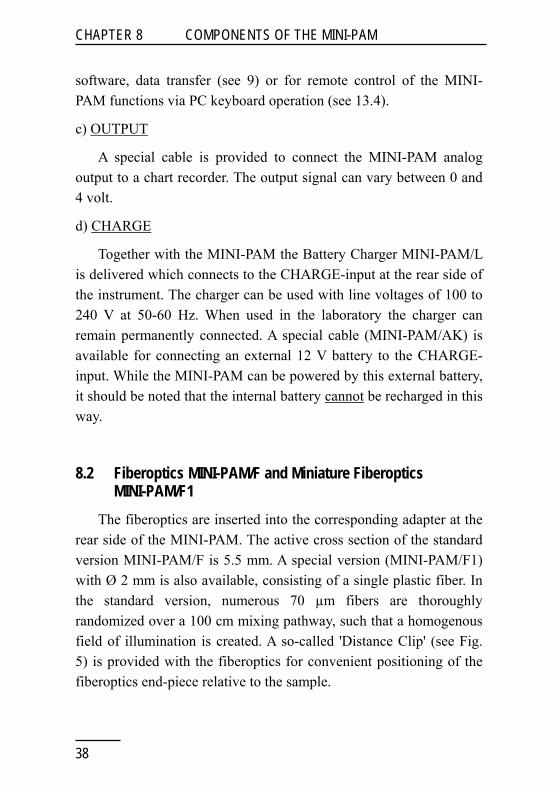
c) OUTPUT
A special cable is provided to connect the MINI-PAM analog output to a chart recorder. The output signal can vary between 0 and 4 volt.
d) CHARGE
Together with the MINI-PAM the Battery Charger MINI-PAM/L is delivered which connects to the CHARGE-input at the rear side of the instrument. The charger can be used with line voltages of 100 to 240 V at 50-60 Hz. When used in the laboratory the charger can remain permanently connected. A special cable (MINI-PAM/AK) is available for connecting an external 12 V battery to the CHARGE-input. While the MINI-PAM can be powered by this external battery, it should be noted that the internal battery cannot be recharged in this way.
8.2 Fiberoptics MINI-PAM/F and Miniature Fiberoptics MINI-PAM/F1
The fiberoptics are inserted into the corresponding adapter at the rear side of the MINI-PAM. The active cross section of the standard version MINI-PAM/F is 5.5 mm. A special version (MINI-PAM/F1) with Ø 2 mm is also available, consisting of a single plastic fiber. In the standard version, numerous 70 µm fibers are thoroughly randomized over a 100 cm mixing pathway, such that a homogenous field of illumination is created. A so-called 'Distance Clip' (see Fig. 5) is provided with the fiberoptics for convenient positioning of the fiberoptics end-piece relative to the sample.
38

CHAPTER 8 COMPONENTS OF THE MINI-PAM
Fig. 5
Two spacer rings may be used to define fixed distances. The fiberoptics exit plane is positioned at a 60° angle relative to the sample plane. In this way shading of the sample is minimized, if the fiberoptics are pointing towards the sample from the side opposite to incident light. The sample may be placed either below the hole or, preferentially with normal leaves, above the hole. In the latter case, the leaf can be held between the folded part of the clip. The former possibility applies e.g. to thick leaves, lichens and mosses. The distance between fiberoptics exit plane and sample has considerable influence on signal amplitude and effective light intensities. Unavoidably, with a 60° angle between sample plane and fiberoptics there is a range of distances between fiberoptics and leaf which will result in a light intensity gradient. The relative magnitude of this gradient is reduced with increasing fiber distance. However, this point should not be of too much concern, as there is anyway a larger vertical light gradient within the leaf due to chloroplast shading by the top chloroplast layer. Also, the measured signal will be dominated by that part or the leaf which receives maximal intensity,
39
CHAPTER 8 COMPONENTS OF THE MINI-PAM
as this also is most strongly excited by the measuring light and emits most of the fluorescence which is received by the fiberoptics.
For measurements with leaves the special Leaf-Clip Holder 2030-B was developed, featuring an integrated micro-quantum-sensor and a thermocouple (see 8.3). For this holder also a 90° fiberoptics adapter (2030-B90) is available.
The fiberoptics should be handled with care. Excessive bending, in particular close to the connector plug, should be avoided, as it would lead to fiber breakage with resulting loss in signal amplitude. The fibers are protected by a steel-spiral and plastic mantle which provides a natural resistance to strong bending.
In addition to the standard fiberoptics MINI-PAM/F, with an active diameter of 5.5 mm, a miniature fiberoptics with 2 mm active diameter (MINI-PAM/F1) is available for small spot measurements. This is particularly recommended for use in conjunction with the Portable Photosynthesis System HCM-1000. For this purpose a modified top window of the HCM-1000 can be provided which allows to approach the clear fibertip at 60° angle close to the leaf surface with minimal shading of the sample. Combined measurements of fluorescence and gas exchange provide unique complementary information on the photosynthetic performance of a plant.
Using the Miniature Fiberoptics MINI-PAM/F1 the signal amplitude is particularly sensitive to the distance between fibertip and sample. A standard distance of 4 mm provides for a homogenous field of illumination and a very satisfactory signal amplitude, approximately equal to that obtained with the 5.5 mm Ø fiberoptics at the standard distance of 12 mm. Signal amplitude can be further increased at least 4 fold, when the fibertip is advanced to the sample surface. It should be noted, however, that in this case the measuring
40
CHAPTER 8 COMPONENTS OF THE MINI-PAM
light may show an actinic effect. This can be counteracted by use of the ML-BURST function (MODE-menu position 5, see 12.3.2).
Because of the strong influence of sample distance on signal amplitude, particularly with the 2 mm Ø fiberoptics, it is recommended to clamp the fiberoptics tip at fixed distance to the sample surface. Otherwise there may be substantial errors, even in the ratio measurement of ΔF/Fm, when the distance changes between the consecutive measurements of F and Fm, separated by approximately 1 s (see 12.3.7).
8.3 Leaf-Clip Holder 2030-B The Leaf-Clip Holder 2030-B may substitute for the standard 'Distance Clip' as a device for defined positioning of the fiberoptics relative to the leaf plane. The leaf is resting on a perspex tube with widened crest, which can be vertically adjusted, to account for different leaf thicknesses. The fiberoptics axis forms a 60° angle with the leaf plane. In this way shading of the sample can be largely avoided when external actinic illumination is applied. For special applications using the internal actinic lamp a 90° fiberoptics adapter (2030-B90) is available which can be readily mounted instead of the standard 60° adapter. This is e.g. particular useful for recordings of LIGHT CURVES, providing more homogenous illumination and higher signal amplitudes (see 12.3.7). The distance between fiberoptics and leaf can be varied. Standard distances are defined by spacer rings. In addition, the Leaf-Clip Holder 2030-B displays the following features:
41

CHAPTER 8 COMPONENTS OF THE MINI-PAM
- Micro-quantum-sensor monitoring PAR
This tiny sensor is unique in monitoring the photosynthetic active radiation (PAR) at the very spot where also fluorescence is measured and at which photosynthetic performance is assessed. This function already is fulfilled, when approximately 10 % of the total measuring area is occupied by the sensor. The resulting loss in signal amplitude is small. If wished, the sensor can also be moved out of the measuring field which is limited by a metal ring of 10 mm inner diameter. With its tip resting on this ring, even without penetrating into the measuring field the sensor will accurately monitor incident light intensity under natural day light conditions, when the leaf-clip holder is positioned such that light incidence is mainly from the front.
Essential opto-electronical elements of this micro-quantum-sensor are a 1.5 mm cross-section diffusing disk; a 0.5 mm diameter fiber guiding the scattered light to the detector; a filter combination selecting the photosynthetic active wavelength range between 380 and 710 nm; and a blue-enhanced silicon photodiode. Despite its small dimensions, the diffuser displays properties of 'cosine correction', i. e. also light impinging at rather small incidence angles (e. g. with rising or setting sun) is reliably monitored. Due to the equalization of leaf and sensor planes, automatically achieved by fastening the leaf in the clip, the measured effective PAR very closely corresponds to the PAR at that spot of the leaf where fluorescence is measured. The micro-quantum-sensor measures incident photosynthetic radiation in µmol quanta m-2s-1, i.e. in units of flux density. Hence, the measured parameter is identical to PPFD (photosynthetic photon flux density). It is displayed at the end of the second line of the LCD (...L) when the leaf-clip holder is connected. The sensor was calibrated against a LI-COR Quantum Sensor (Type LI-190). The stability of calibration depends strongly on keeping the
42

CHAPTER 8 COMPONENTS OF THE MINI-PAM
diffuser clean. Also, it must be pointed out that there is some decrease in sensitivity when the sensor is moved from the center of the measuring field to its periphery. It is advisable to check calibration regularly by comparison with a standard quantum sensor, like the LI-190. Any deviation can be corrected by entering a recalibration factor via menu point 41: LIGHT GAIN. A substantial increase of the calibration factor from its original value of 1.00 indicates dirt-deposition on the diffuser, which may be reversed by gentle cleaning using a cotton-tip, moistened with some alcohol. In addition, it is possible to enter an offset value via menu point 40: LIGHT-OFFS.
- Thermocouple monitoring leaf temperature
A NiCr-Ni thermocouple is mounted in the perspex tube on which the studied leaf area is resting. Its tip is forming a loop which gently presses against the lower surface of the leaf. In this way there is effective temperature equilibration and the thermocouple is protected from direct sun radiation. The reference couple is located on the circuit board, in close proximity to the thermovoltage amplifier (AD), enclosed in the bottom part of the holder. The relationship between thermovoltage and temperature is almost linear. With decreasing temperatures there is a small decline of ΔV/°C. Calibration was performed at 25 °C. At 0 °C or -15 °C the deviation amounts to 0.5 or 0.8 °C, respectively. An offset value can be entered via menu point 42: TEMP-OFFS. The measured temperature is displayed at the end of the first line of the LCD (...C) when the Leaf-Clip Holder 2030-B is connected. Temperature resolution is 0.3 °C. The temperature as well as the PAR data are automatically stored in the memory after every saturation pulse, together with the fluorescence data.
43
CHAPTER 8 COMPONENTS OF THE MINI-PAM
- Remote control push button
Pressing the 'remote' control push button on the handle of the Leaf-Clip Holder 2030-B is equivalent to operation of START on the MINI-PAM keyboard. In practice, this offers the advantage, that the experimenter can use both hands for positioning the leaf within the holder and at the same time trigger a recording by remote control. In this way, sampling is considerably facilitated, which is particularly helpful when many recordings are averaged to increase the accuracy of determinations.
Approx. 0.2 seconds elapse between pushing the remote control button and triggering of the saturation pulse. The actual start of the measurement is announced by a beep-sound. From that moment onward the leaf clip should be held steady for approx. one second.
- Tripod mounting thread
Mounting the Leaf-Clip Holder 2030-B on a tripod (e. g. Compact Tripod ST-2101A) facilitates long term recordings with the same plant. Such recordings can be automated by using the Clock-function.
- Holes for mounting External Halogen Lamp 2050-HB
Two holes are provided in the front bottom part of the holder for mounting the optional External Halogen Lamp 2050-HB (see 8.5). This lamp allows long periods of illumination with strong light, as e. g. required for photoinhibitory treatment. It is not recommended to use the internal halogen lamp for this purpose, as this would lead to excessive internal heating and rapid depletion of battery power.
44
CHAPTER 8 COMPONENTS OF THE MINI-PAM
8.4 Micro Quantum/Temp.-Sensor 2060-M The Micro Quantum/Temp.-Sensor 2060-M essentially displays the same features as outlined above for the Leaf-Clip Holder 2030-B (see 8.3), except that the micro-sensors of PAR and temperature are not mounted in a leaf-clip. This device is rather designed for experiments with objects which are not leaf-shaped, like crustose lichens and cushions of moss. The two miniature sensors can be attached to the site where fluorescence is monitored without interfering with the actual measurement. A defined position with respect to the object and the fiberoptics exit plane can be achieved with the help of a special holder, in analogy to the 'Distance Clip' (shown in Fig. 5).
It should be pointed out that the sensitivity of the micro quantum sensor is affected by bending the relatively long, flexible light guide which bridges the distance between the small diffusing disk at the object and the detector in the metal housing. Therefore, this device cannot substitute for a reliable quantum sensor like the LI-COR Quantum Sensor (Type LI-190), against which it was originally calibrated. Recalibration via menu points 40 and 41 is recommended when bringing the sensor and the metal housing into a fixed position with respect to the object.
8.5 External Halogen Lamp 2050-HB The External Halogen Lamp 2050-HB provides a strong light source for prolonged illumination periods, for which purpose the internal halogen lamp is not suited because of the heat developing within the MINI-PAM housing. A 20 W lamp is powered by an external battery (e. g. NP-3/12). Its intensity can be varied steplessly via a 15-turn potentiometer. Power consumption is minimized by special electronic circuitry. The lamp is equipped with a heat-
45
CHAPTER 8 COMPONENTS OF THE MINI-PAM
reflecting, sealed window. In addition, for standard applications a short-pass filter (λ<700 nm) is provided, which is mounted directly on the lamp. This filter passes almost all visible light and only eliminates the long wavelength radiation, against which the fluorescence detector is not protected. For special applications, other filters (e. g. daylight or blue) are available with which, however, the maximal possible intensities are lower.
The External Halogen Lamp 2050-HB is meant to be used in conjunction with PAR-measurements, as performed with the Leaf-Clip Holder 2030-B. In its normal application, it is mounted on the Leaf-Clip Holder, with the light (8° beam divergence angle) shining at an approx. 60° incident angle with respect to the leaf plane on the site where fluorescence and PAR are measured. The optimum angle, giving maximal PAR and minimal shading by the fiberoptics can be manually adjusted, preferentially using a white piece of paper instead of a leaf. With the 15-turn potentiometer defined PAR-values can be chosen, which are read off the MINI-PAM LC-display. A switch is provided to turn the lamp on/off.
A major application of the External Halogen Lamp 2050-HB is the adjustment of defined light intensities for measurements of light saturation curves under field conditions. For this purpose, the light obtained from this lamp may substitute or complement the natural daylight. Intensities corresponding to PAR-values of more than 3000 µmol quanta m-2s-1 can be achieved, exceeding the intensity of direct sun light. Hence, this light source can be also useful for photoinhibitory treatment of leaves and of other photosynthesising organisms in the field. It should be noted that application of such high light intensities will cause a substantial rise of leaf-temperature, which is monitored by the thermosensor integrated in the Leaf-Clip Holder 2030-B and can be read off the LC-display of the MINI-PAM.
46
CHAPTER 8 COMPONENTS OF THE MINI-PAM
47
8.6 Dark Leaf Clip DLC-8 The Dark Leaf Clip DLC-8 weighs approx. 4 g and, hence, can be attached to most types of leaves without any detrimental effects. It is equipped with a miniature sliding shutter which prevents light access to the leaf during a dark-adaptation period and which is opened for the actual measurement only, when exposure to external light is prevented by the fiberoptics. Proper dark-adaptation is essential for determination of the maximal quantum yield Fv/Fm (see 12.3.1).
Different from the other leaf clips, with the Dark Leaf Clip DLC-8 the fiberoptics are positioned at right angle with respect to the leaf surface at the relatively short distance of 7 mm. As a consequence, signal amplitudes are approx. 2-3 times higher than with the Leaf-Clip Holder 2030-B. In order to avoid signal saturation, the settings of MEAS-INT (menu point 50) and GAIN (menu point 49) have to be correspondingly lowered with respect to the standard settings. For optimal results the burst mode of measuring light (menu position 5: ML-BURST) is recommended (see 12.3.2).
When the shutter is still closed and measuring light is on, an artifactual signal is observed, which is due to a small fraction of the measuring light which after reflection from the closed shutter penetrates to the photodetector. However, the reflection is much smaller when the shutter is opened and the measuring light hits the strongly absorbing leaf instead of the shiny metal. Therefore, it is recommended to carry out compensation of the unavoidable background signal by AUTO-ZERO (menu point 2) with the fiberoptics end directed into the air.

CHAPTER 9 DATA TRANSFER
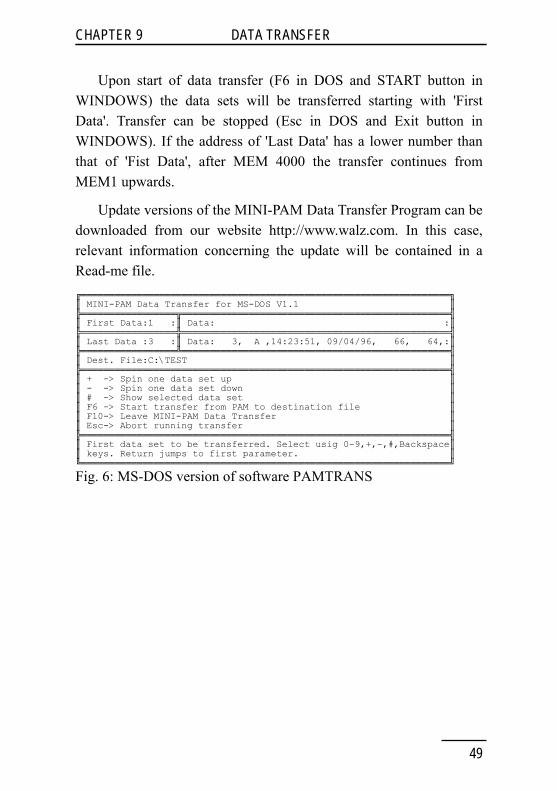
9 Data Transfer Since the introduction of the WinControl software, the normal way of data transfer from the MINI-PAM to a PC is via a special routine provided by WinControl (see separate manual). In addition, two other programs are provided for the transfer of data from the MINI-PAM via RS-232 interface cable to a PC. MS-DOS and WINDOWS versions of the MINI-PAM DATA TRANSFER program PAMTRANS are available on the disk which is delivered together with the MINI-PAM. They are installed as follows:
MS-DOS version: Enter 'A:' and enter 'INSTALL'. After connection of the RS 232 cable and definition of the communication port (COM 1, 2, ...) the system is ready for data transfer.
WINDOWS version: Enter 'A:\SETUP' at the Program Manager level of WINDOWS (select first 'File' and then 'Run'). Then SETUP will be initialized and PAMTRANS.WIN installed. Before data transfer can be carried out, the RS 232 cable has to be connected and the communication port (COM 1, 2, ...) has to be defined.
With the WINDOWS-version transfer of 1000 data sets takes ca. 90 s, as compared to 9 min with the MS-DOS version. The steps required for carrying out the transfer of defined data sets, which are almost identical for the two versions, shall be briefly described. Fig. 6 and Fig. 7 illustrate the screen layouts used with MS-DOS- and WINDOWS-versions, respectively. After start of the program the last measured data set is entered by default into the 'Last Data' field. The user can enter MEMORY-numbers defining the limits of the transfer into the 'First Data' and 'Last Data' fields. Before starting the transfer, a Destination File must be entered into the corresponding parameter field. The data are processed as text file and the extension .TXT will be automatically added to the Destination File name.
48
CHAPTER 9 DATA TRANSFER
Upon start of data transfer (F6 in DOS and START button in WINDOWS) the data sets will be transferred starting with 'First Data'. Transfer can be stopped (Esc in DOS and Exit button in WINDOWS). If the address of 'Last Data' has a lower number than that of 'Fist Data', after MEM 4000 the transfer continues from MEM1 upwards.
Update versions of the MINI-PAM Data Transfer Program can be downloaded from our website http://www.walz.com. In this case, relevant information concerning the update will be contained in a Read-me file. ╔══════════════════════════════════════════════════════════════════╗ ║ MINI-PAM Data Transfer for MS-DOS V1.1 ║ ╠═════════════════╦════════════════════════════════════════════════╣ ║ First Data:1 :║ Data: :║ ╠═════════════════╬════════════════════════════════════════════════╣ ║ Last Data :3 :║ Data: 3, A ,14:23:51, 09/04/96, 66, 64,:║ ╠═════════════════╩════════════════════════════════════════════════╣ ║ Dest. File:C:\TEST ║ ╠══════════════════════════════════════════════════════════════════╣ ║ + -> Spin one data set up ║ ║ - -> Spin one data set down ║ ║ # -> Show selected data set ║ ║ F6 -> Start transfer from PAM to destination file ║ ║ F10-> Leave MINI-PAM Data Transfer ║ ║ Esc-> Abort running transfer ║ ╠══════════════════════════════════════════════════════════════════╣ ║ First data set to be transferred. Select usig 0-9,+,-,#,Backspace║ ║ keys. Return jumps to first parameter. ║ ╚══════════════════════════════════════════════════════════════════╝
Fig. 6: MS-DOS version of software PAMTRANS
49

CHAPTER 9 DATA TRANSFER
50
Fig. 7: WINDOWS version of software PAMTRANS

CHAPTER 10 MINI-PAM OPERATION VIA PC-TERMINAL
10 Operation of the MINI-PAM via a PC-Terminal and the RS 232 Interface
The MINI-PAM is basically conceived as a stand-alone instrument, i.e. the most essential measurements can be carried out without the need for any peripheral instruments. However, when used under laboratory conditions, operation via PC and the dedicated WinControl software has distinct advantages, particularly with respect to data display (see separate WinControl manual). In addition, there is the possibility to connect the MINI-PAM via the RS 232 interface to a PC and to control all functions by PC-keyboard operations using user-written software. For this purpose, first a suitable terminal program must be installed which allows communication between the PC and the MINI-PAM. In WINDOWS the TERMINAL program is available (under Accessories in the Program Manager). In order to enable this program for communication with the MINI-PAM the following steps are required:
• Define communication parameters (SETTINGS-menu) Baud rate 9600 Data bits 8 Stopbits 1 Parity none Protocol Xon/Xoff Connector Com 1 or 2
• Define terminal preferences (SETTINGS menu) Colums 132 Terminal fond Fixed sys
• Create MINI-PAM.trm (SAVE AS ... in FILE-menu)
For the communication between PC and MINI-PAM a special set of commands is provided which is listed in the Appendix (section 13.4). Each command consists of one or several low-case letters
51

CHAPTER 10 MINI-PAM OPERATION VIA PC-TERMINAL
52
which may be followed by further specifications. Any command is executed via 'Return'.
The following examples may serve to illustrate the principle of MINI-PAM TERMINAL operation:
• Enter 'bp' and the MINI-PAM will answer with a beep after 'Return' (which is always required and from here onward will not be mentioned anymore).
• 'a1' will switch on actinic light, which will be switched off again by 'a0'.
• 's' starts a saturation pulse
• with 'f' and 'fmp' the values of the fluorescence parameters F and Fm', as measured with the last saturation pulse, can be called on display.
In this way, it is possible to carry out all MINI-PAM functions by remote control from a PC terminal and to transfer information from the MINI-PAM to a PC. In principle, using the TERMINAL-program also a network of MINI-PAM Fluorometers can be operated.

CHAPTER 11 MAINTENANCE
11 Maintenance 11.1 Internal battery and its replacement The internal battery is essentially 'maintenance free'. However, even when the instrument is switched off, there is some discharge, which is stimulated by elevated temperatures. If it is forseeable that the instrument will not be used for some months, the battery should be charged beforehand. Excessive discharge of the battery should be avoided, as this may cause irreversible damage. Such damage involves lowering of the capacity and increase of internal resistance, with the consequence that recharging becomes necessary after relatively short times of operation and that there is an excessive lowering of voltage during a saturation pulse. In this case, battery replacement is recommended.
The MINI-PAM features a number of functions and warnings which make it highly unlikely that excessive discharge of the battery occurs inadvertently:
• AUTO-OFF (when there was no key operation for 4 min)
• Backlight-off (50 s after switching the instrument on)
• Menu point 34: BATT (display of battery voltage in the resting state as well as with application of a saturation pulse)
• Warning 'BAT' on the display, when battery voltage drops below 11.2 V in the resting state
• Error message 3: 'LOW BATTERY' when battery voltage drops below 11.2 V (coupled to measurements involving START).
• Error message 6: 'CHECK BATTERY' when battery voltage drops below 8.0 V during a saturation pulse.
53

CHAPTER 11 MAINTENANCE
• When battery voltage drops below 8.0 V the CLOCK is automatically turned off. This is important as the CLOCK disables the AUTO-OFF function.
If replacement of the battery becomes necessary, this is readily accessible after removing the 4 screws at the bottom of the MINI-PAM. The battery is attached to the bottom piece by double-sided adhesive tape. After disconnecting the cables, the battery can be detached by means of a screw-driver used as a lever. The replacement battery comes with adhesive tape. When connecting the cables, please note the proper contact polarities (red/positive and black/negative).
11.2 Halogen lamp and its replacement Due to a very efficient optical system, very high light intensities can be obtained with the internal 8 V/20 W halogen lamp, without applying the maximal allowable voltage. This results in a long life time of the lamp which is primarily meant to generate saturation pulses. Continuous operation is limited to 5 min periods in order to avoid excessive internal heating of the MINI-PAM. For longer illumination periods we recommend the External Halogen Lamp 2050-HB in combination with the Leaf Clip Holder 2030-B.
For replacement of the internal halogen lamp the MINI-PAM is opened by removing the bottom part (4 screws). The lamp is held in a pre-focused position by an aluminum mounting-frame, which is fastened to the optical compartment by two screws. These screws can be removed with a hex nut screw driver delivered together with the MINI-PAM. Spare Halogen Lamps (SL-8/20) with mounting-frame are available.
54

CHAPTER 11 MAINTENANCE
11.3 Fuse replacement Two fuses are provided: 4 A: halogen lamp circuit 500 mA: general electronics For replacement, put the MINI-PAM upside down and remove the bottom part (4 screws). The fuses are located on the main board, with the 500 mA fuse being more close to the side featuring the various connectors.
11.4 EPROM and its replacement The location of the EPROM on the microcontroller board is indicated in Fig. 8, which shows a view on the interior of the MINI-PAM in its upside-down position after removing the bottom part (4 screws). The EPROM contains the software of the current program version (see menu point 37). It can be readily exchanged against a new EPROM when program updates become available. Please note the little red dot at the side of the EPROM which is directed to the side of the MINI-PAM housing where the various connectors are. For lifting the EPROM, a paper-clip can be useful. Put a finger on it, so that it does not jump up. When installing the replacement, make sure that the red dot is on the proper side (there is also an arrow on the EPROM socket). Push in the EPROM firmly, until there is a click and it sits level at all sides. After EPROM replacement it is recommended to reset the instrument settings and to clear the memory (menu point 36 and 39).
55
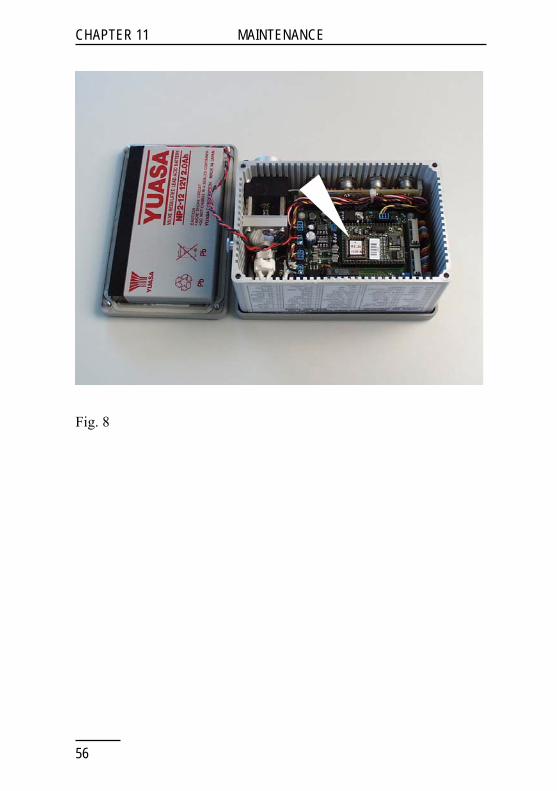
CHAPTER 11 MAINTENANCE
56
Fig. 8
CHAPTER 12 MEASUREMENTS WITH THE MINI-PAM
12 Chlorophyll Fluorescence Measurements with the MINI-PAM
Chlorophyll fluorescence is a large signal and in principle its measurement is rather simple. Hans Kautsky already observed chlorophyll fluorescence changes by his bare eyes in 1931 and suggested that these are related to photosynthesis. In the following 50 years, with the progress of modern electronics and photooptics, highly sensitive and fast fluorometers were developed which contributed substantially to the elucidation of the basic mechanisms involved in the complex process of photosynthesis. Chlorophyll fluorescence always has been a pioneering tool. Many aspects which eventually were analyzed in great detail by more specific methods, were first discovered by chlorophyll fluorescence measurements. Such discoveries are still taking place, presently mostly at the level of regulation of the complex photosynthesis process under the control of changing environmental factors. This still is a widely open field of plant science, as only recently the instrumentation and methodology for in situ fluorescence measurements and analysis has become generally available. Progress in this field of research has been greatly stimulated by the invention of the Pulse-Amplitude-Modulation (PAM) measuring principle (see section 12.2 below). The first PAM-101 Chlorophyll Fluorometer, with its accessory modules 102 and 103, as well as the PAM-2000 Portable Fluorometer have been successfully used all over the world, as can be judged from the large number of publications based on investigations carried out with these instruments.
The MINI-PAM differs from the previously issued PAM fluorometers in that it is further miniaturized and optimized in order to perform one particular type of measurement with the greatest ease, accuracy and reliability, namely the determination of the effective quantum yield of photosynthetic energy conversion, ΔF/Fm', the so-
57

CHAPTER 12 MEASUREMENTS WITH THE MINI-PAM
called Genty-parameter. In the following sections some background information on this and other fluorescence parameters is given, and special aspects on fluorescence measurements with the MINI-PAM are outlined, in order to make optimal use of this instrument.
12.1 Chlorophyl fluorescence as an indicator of photosynthesis Photosynthesis involves reactions at five different functional levels:
• processes at the pigment level
• primary light reactions
• thylakoid electron transport reactions
• dark-enzymic stroma reactions
• slow regulatory feedback processes
In principle, chlorophyll fluorescence can function as an indicator at all of these levels of the photosynthesis process. Chlorophyll is the major antenna pigment, funneling the absorbed light energy into the reactions centers, where photochemical conversion of the excitation energy takes place.
58
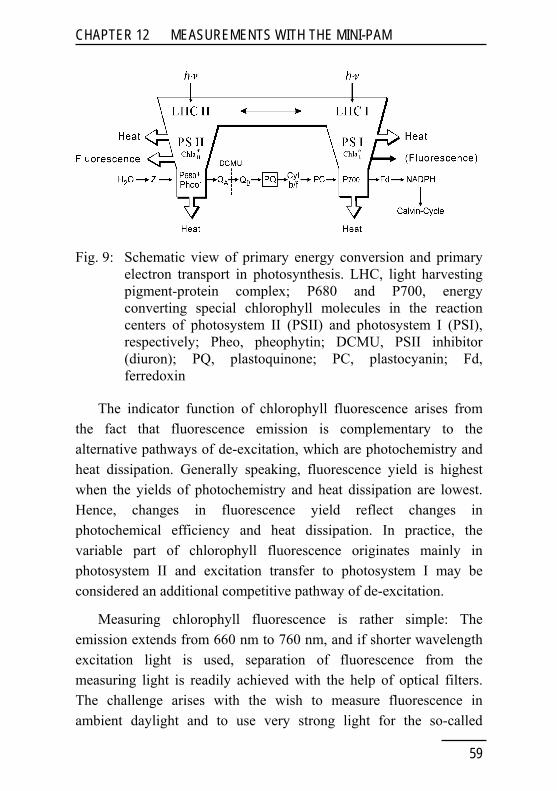
CHAPTER 12 MEASUREMENTS WITH THE MINI-PAM
Fig. 9: Schematic view of primary energy conversion and primary electron transport in photosynthesis. LHC, light harvesting pigment-protein complex; P680 and P700, energy converting special chlorophyll molecules in the reaction centers of photosystem II (PSII) and photosystem I (PSI), respectively; Pheo, pheophytin; DCMU, PSII inhibitor (diuron); PQ, plastoquinone; PC, plastocyanin; Fd, ferredoxin
The indicator function of chlorophyll fluorescence arises from the fact that fluorescence emission is complementary to the alternative pathways of de-excitation, which are photochemistry and heat dissipation. Generally speaking, fluorescence yield is highest when the yields of photochemistry and heat dissipation are lowest. Hence, changes in fluorescence yield reflect changes in photochemical efficiency and heat dissipation. In practice, the variable part of chlorophyll fluorescence originates mainly in photosystem II and excitation transfer to photosystem I may be considered an additional competitive pathway of de-excitation.
Measuring chlorophyll fluorescence is rather simple: The emission extends from 660 nm to 760 nm, and if shorter wavelength excitation light is used, separation of fluorescence from the measuring light is readily achieved with the help of optical filters. The challenge arises with the wish to measure fluorescence in ambient daylight and to use very strong light for the so-called
59
CHAPTER 12 MEASUREMENTS WITH THE MINI-PAM
'quenching analysis'. For this purpose the PAM measuring principle has been developed which allows monitoring fluorescence against 106 times larger background signals (see 12.2).
From the viewpoint of fluorescence emission there are two fundamentally different types of competing de-excitation processes:
• photochemical energy conversion at the PS II centers
• non-photochemical loss of excitation energy at the antenna and reaction center levels
By both mechanisms, the maximal potential fluorescence yield is 'quenched' and, hence, 'photochemical' and 'non-photochemical fluorescence quenching' can be distinguished. For interpretation of fluorescence changes, it is essential to know the relative contributions of these two different quenching mechanisms to the overall effect. If, for example, fluorescence yield declines, this may be caused by
• an increase of the photochemical rate at the cost of fluorescence and heat-dissipation
• or an increase of heat-dissipation at the cost of fluorescence and photochemistry
These two possibilities can be distinguished by the so-called 'saturation pulse method':
With a very strong pulse of white light the electron transport chain between the two photosystems can be quickly fully reduced, such that the acceptors of PSII become exhausted. Hence, during the saturation pulse photochemical fluorescence quenching becomes zero and any remaining quenching must be nonphotochemical. It is assumed that changes in non-photochemical quenching are too slow to become effective within the approx. 1 second duration of a saturation pulse.
60

CHAPTER 12 MEASUREMENTS WITH THE MINI-PAM
Fig. 10:
On the basis of these considerations so-called 'quenching coefficients' qP and qN were defined, which can be determined by simple fluorescence measurements (see 12.3.6). For qP- and qN-determination it is necessary to define the extremes of maximal and minimal fluorescence yield, which are given in the dark-adapted state (see 12.3.4). However, quenching analysis is not restricted to qP- and qN-determination and very relevant information can be also obtained without previous dark-adaptation of the samples. This is an important point for field investigations, for which the MINI-PAM was optimized.
In recent years, evidence from a number of research groups has shown that the overall quantum yield of photochemical energy conversion can be assessed by the simple expression:
YIELD = (Fm'-F)/Fm' = ΔF/Fm'
61

CHAPTER 12 MEASUREMENTS WITH THE MINI-PAM
This expression, which was introduced by Genty et al. (1989) is identical to the YIELD-parameter measured by the MINI-PAM (see 12.3.7). With this fluorometer, YIELD-determination has become exceedingly simple: The fiberoptics are held at short distance (ca. 10 mm) to a sample, and the START-key is pressed. Everything else is proceeding automatically within seconds:
• the present fluorescence yield F is sampled
• a saturation pulse is applied
• Fm' is sampled (displayed as ... M)
• YIELD = (Fm'-F)/Fm' is calculated and shown on the LC-display
• the obtained data are stored in the MEMORY.
The simplicity of this measurement is contrasted by the profound information it provides. In steady-state illumination, as prevailing under field-conditions, the YIELD-parameter reflects the efficiency of the overall process. Any change at the various functional levels (outlined at the start of this section) will be reflected in this parameter. The accuracy of this measurement is very high, and as recordings are quick, very detailed information on the photosynthetic performance of plants under varying environmental and physiological conditions can be obtained.
For full assessment of fluorescence information, knowledge of environmental parameters is required, in particular of light intensity and temperature. For example, if the measured YIELD of leaf A is lower than that of leaf B, this does not necessarily mean that leaf A is photosynthetically less competent than leaf B. The difference could as well arise from leaf A being exposed to stronger light or to a lower temperature than leaf B. The MINI-PAM offers the possibility to measure photosynthetically active radiation (PAR) and temperature at the same spot of a leaf where also fluorescence is measured (see
62
CHAPTER 12 MEASUREMENTS WITH THE MINI-PAM
8.3), such that together with every YIELD-value also the corresponding values of PAR and temperature are entered into the file of automatically stored data. When PAR is known, the apparent rate of electron transport (ETR) is calculated (displayed as ...E).
For assessment of overall photosynthetic performance, measurements in the steady-state are most informative. On the other hand, additional information on the various partial reactions can be obtained from analysis of so-called 'induction kinetics'. Upon a dark-light transition, fluorescence yield displays a series of characteristic transients, the so-called 'Kautsky effect', which reflect the whole complexity of the process. The rapid transients contain information on primary electron transport reactions, while the slow transients reflect reactions at the level of enzyme regulation. Analysis of the slow transients is greatly facilitated by use of the saturation pulse method, which allows to distinguish between the contributions of photochemical and non-photochemical quenching.
Since the introduction of the PAM Fluorometer in 1985, there has been a boom in chlorophyll fluorescence research, at the basic as well as at the applied level. This is reflected in a large number of publications, due to which there has been considerable progress in understanding of the indicator function of chlorophyll, of photosynthesis as such, and of the regulation of photosynthesis under stress conditions. The review articles, and the original papers cited therein, which are listed in the Appendix (section 13.5) cover a representative part of the work which so far was carried out. This literature may be useful to become informed in more detail about chlorophyll fluorescence and possible applications of the PAM Fluorometer.
63
CHAPTER 12 MEASUREMENTS WITH THE MINI-PAM
12.2 The PAM measuring principle With conventional chlorophyll fluorometers, the same light is used for driving photosynthesis and for exciting fluorescence. Separation of fluorescence from stray excitation light then is achieved by appropriate combinations of optical filters (e.g. excitation by blue light and protection of the detector by a red filter, which only passes the red fluorescence). Such conventional fluorometers are of rather limited use for ecophysiological research, as their function is severely disturbed by ambient daylight. In order to distinguish between fluorescence and other types of light reaching the photodetector, fluorescence excitation can be 'modulated': When a special 'measuring beam' is rapidly switched on/off, the fluorescence signal follows this on/off pattern and with the help of suitable electronic devices the resulting modulated signal can be separated. Standard devices for this purpose are lock-in amplifiers which tolerate background signals several hundred times larger than the fluorescence signal. For the extreme requirements of chlorophyll fluorescence quenching analysis by the so-called saturation pulse method (see 12.1), a new modulation principle was developed which tolerates a ratio of 1:106 between fluorescence and background signal. This measuring principle is patented (DE 35 18 527) and licensed exclusively to the Heinz Walz GmbH.
The pulse-amplitude-modulation (PAM) principle displays the following essential features (see also Fig. 11):
Fluorescence is excited by very brief but strong light pulses from light-emitting diodes. With the MINI-PAM, these pulses are 3 μs long and repeated at a frequency of 600 or 20000 Hz. The LED light passes a short-pass filter (λ<670 nm) and the photodetector is protected by a long-pass filter (λ>700 nm) and a heat reflecting filter. A highly selective pulse amplification system ignores all signals except the fluorescence excited during the 3 μs measuring pulses.
64
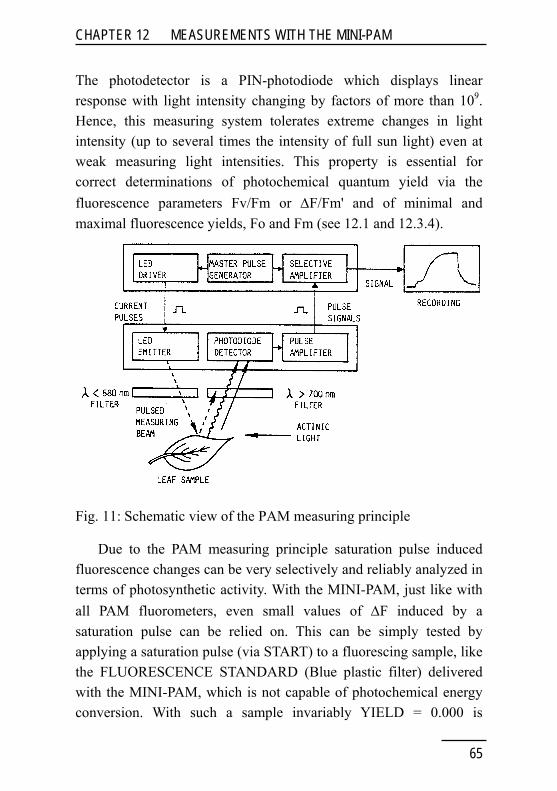
CHAPTER 12 MEASUREMENTS WITH THE MINI-PAM
The photodetector is a PIN-photodiode which displays linear response with light intensity changing by factors of more than 109. Hence, this measuring system tolerates extreme changes in light intensity (up to several times the intensity of full sun light) even at weak measuring light intensities. This property is essential for correct determinations of photochemical quantum yield via the fluorescence parameters Fv/Fm or ΔF/Fm' and of minimal and maximal fluorescence yields, Fo and Fm (see 12.1 and 12.3.4).
Fig. 11: Schematic view of the PAM measuring principle
Due to the PAM measuring principle saturation pulse induced fluorescence changes can be very selectively and reliably analyzed in terms of photosynthetic activity. With the MINI-PAM, just like with all PAM fluorometers, even small values of ΔF induced by a saturation pulse can be relied on. This can be simply tested by applying a saturation pulse (via START) to a fluorescing sample, like the FLUORESCENCE STANDARD (Blue plastic filter) delivered with the MINI-PAM, which is not capable of photochemical energy conversion. With such a sample invariably YIELD = 0.000 is
65

CHAPTER 12 MEASUREMENTS WITH THE MINI-PAM
displayed. Such reliable performance, which is not possible with conventional amplifier systems, is of particular importance when photosynthesis yield is low due to stress conditions. In such cases it is essential to be sure that total inhibition really is indicated by YIELD = 0.000. These aspects are illustrated in Fig. 12.
Note: A small lowering of fluorescence yield observed upon application of a saturation pulse to the FLUORESCENCE STANDARD is a genuine effect which results from a transient temperature increase within the sample (see 12.3.4).
Fig. 12: Comparison of fluorescence responses of photosynthetically active (Nerium; Lichen, +water) and inactive (Lichen, dry) plant samples with those of a fluorescing plastic filter. ML, measuring light; SP, saturation pulse. The calculated values of effective quantum yield of energy conversion in PSII (YIELD) are depicted.
66
CHAPTER 12 MEASUREMENTS WITH THE MINI-PAM
12.3 Assessment of photosynthesis with the MINI-PAM: Outline of the most important functions in practical applications.
As soon as the MINI-PAM is switched on, it continuously monitors the fluorescence yield of a sample which is close to the fiberoptics exit. In section 12.1 it was outlined, in which way fluorescence yield relates to the effective quantum yield of photochemical energy conversion. Assessment of this very fundamental information is made automatically by two consecutive measurements of fluorescence yield (initiated by START), one briefly before and one during a short pulse of saturating light. The effective quantum yield of photochemical energy conversion (Y, YIELD) is then simply calculated from the equation Y = ΔF/Fm. Although this sounds easy and straightforward, in practice certain aspects must be taken into consideration to obtain optimal and meaningful results (for a brief outline, see section 5). While it is almost trivial that the actual measurement must be correct, it is also important that the conditions are properly chosen to give meaningful information. Both of these two aspects are dealt with in the following sections, which outline the most important functions of the MINI-PAM, corresponding to some selected points of the MODE-menu. A short description of all 51 points of the MODE-menu is given in section 7.
12.3.1 Maximal photochemical yield Fv/Fm In green plants the maximal quantum yield of photosystem II is observed after dark adaptation when all reaction centers are open (all primary acceptors oxidized) and heat dissipation is minimal. Then a saturation pulse induces maximal fluorescence yield, Fm, and maximal variable fluorescence, Fv, such that also ΔF/Fm = Fv/Fm is maximal. Fv/Fm, if properly assessed, is a reliable measure of the potential quantum yield of PS II. It is lowered by all effects which
67

CHAPTER 12 MEASUREMENTS WITH THE MINI-PAM
cause inhibition of PS II reaction centers and increase of heat dissipation. In this respect, photoinhibition is particularly relevant. Phenomenologically, both an increase of Fo or a decrease of Fm may contribute to a decrease of Fv/Fm = (Fm-Fo)/Fm. While an increase of Fo points to photodamage, a decrease of Fm reflects enhanced nonradiative energy loss (heat dissipation), which can be viewed as an expression of photoprotection.
12.3.2 ML-BURST (menu point 5) Plants can differ widely with respect to their requirements for dark-adaptation. For some indoor potted plants less than 0.1 µmol quanta m-2s-1 may already cause closure of PS II centers accompanied by a fluorescence increase, whereas most outdoor plants display close to minimal fluorescence yield and maximal Fv/Fm in the steady-state at 10-40 µmol quanta m-2s-1. Even if a sample is kept in absolute darkness, the actual fluorescence measurement requires some excitation light. With the MINI-PAM, under standard conditions this amounts to ca 0.15 µmol quanta m-2s-
1. It can be decreased by lowering the measuring light intensity (menu point 50: MEAS-INT) or by applying the 'burst mode' (menu point 5: ML-BURST).
The burst mode is particularly useful for a quick check whether the measuring light intensity is too high or not. By intermittent dark periods the integrated intensity is cut to 1/5, which will result in a lowering of fluorescence yield and an increase in Fv/Fm in very light sensitive plants. In this case, the MEAS-INT could be further lowered via menu point 50. Application of the burst mode has two advantages: First, there is no loss in signal/noise ratio. Second, there is no need to repeat AUTO-ZERO via menu point 2.
68

CHAPTER 12 MEASUREMENTS WITH THE MINI-PAM
12.3.3 AUTO-ZERO (menu point 2) The MINI-PAM, like any other chlorophyll fluorometer, is not absolutely selective for chlorophyll fluorescence but also shows a small signal when no plant sample is in contact with the fiberoptics. This false signal originates from traces of scattered measuring light which reach the photodetector despite the blocking filters. Most importantly, this signal is not dependent on properties of the investigated sample and, therefore, is constant as long as the measuring light intensity (menu point 50) and the gain (menu point 49) are not changed.
The false signal can be automatically subtracted from all measured fluorescence signals by the AUTO-ZERO function (menu point 2). For this purpose, the sample is removed and in menu position 2 AUTO-ZERO is carried out via SET. Thereafter the signal (F) without a sample fluctuates around 0 and sample specific fluorescence can be assessed. Any changes in GAIN (menu point 49) or MEAS-INT (menu point 50) lead to corresponding changes in the offset voltage caused by the false signal. Therefore, in this case AUTO-ZERO has to be repeated. If this is not done and a new YIELD-determination is made via START, there is the warning? NEW OFFSET?, which reminds the user to first carry out AUTO-ZERO (without sample) in order to determine YIELD correctly. If the user prefers to keep the old offset value, the warning can be overruled simply by pressing SET (while in menu position 1).
Any false signal which is not compensated by AUTO-ZERO (menu point 2) or manually by ZERO-OFFS (menu point 44) will lead to underestimation of Y (ΔF/Fm' or Fv/Fm). Normally, i.e. with a leaf at 10-15 mm distance from the fiberoptics, the error is small (approximately 2 %). The error can increase considerably, when samples with low chlorophyll content and unfavorable geometries are assessed. In such cases, the signals can be made large by
69
CHAPTER 12 MEASUREMENTS WITH THE MINI-PAM
applying maximal measuring light intensity and maximal gain. However, in this way also the background signal is increased and AUTO-ZERO becomes very essential. For example, in an experiment with a 1 mm² piece of a leaf at maximal gain and measuring light intensity quite reproducibly an Fv/Fm = 0.610 to 0.630 was measured, when no offset was applied. However, when AUTO-ZERO was properly applied, Fv/Fm = 0.795 to 0.815.
12.3.4 Fo, Fm (menu point 25) Fo and Fm are defined as the minimal and maximal fluorescence yields of a dark adapted sample, respectively. Knowledge of Fo and Fm is required for determination of the quenching coefficients qP, qN and NPQ (see section 12.3.6). Fo and Fm determination is carried out in menu position 25 via SET. Then in menu position 26 there is automatic reset of qP to 1.000 and of qN to 000 and in menu position 27 NPQ is reset to 0.000. With all consequent applications of saturation pulses (via START), calculation of the quenching coefficients will be based on these Fo, Fm values, until they are re-determined via SET in menu position 25. As outlined in section 12.3.2, the threshold of light intensity below which a sample is dark-adapted can vary considerably. In most plants Fm/Fo = 5 to 6, which is equivalent to Y = Fv/Fm = 0.800 to 0.835. Such high values can be measured only when true dark-adaptation is reached and the measuring procedure is optimized as outlined in the preceding sections 12.3.2 and 12.3.3.
For Fv/Fm, just as for YIELD-measurements in general, the absolute signal amplitudes are of no concern, as long as Fo and Fm are measured under the same conditions. However, measurements of absolute signal amplitudes are important for full assessment of photoinhibition (see 12.3.1) and also for calculation of the quenching coefficients qP, qN and NPQ (see 12.3.6). It must be emphasized,
70

CHAPTER 12 MEASUREMENTS WITH THE MINI-PAM
however, that it is not a simple matter to compare absolute fluorescence values of a sample measured at different times and under different conditions. While it is almost trivial that the sample must be in exactly the same position with respect to the fiberoptics (e.g. in a suitable leaf-clip) and that the same settings of MEAS-INT (menu point 50) and GAIN (menu point 49) must be used, it is less obvious that the sensitivity of the fluorometer is affected by temperature. A 1 °C increase results in an approximately 1 % decrease in signal amplitude. This is due to the fact that the efficiency of the light-emitting-diode, which provides the pulse-modulated measuring light, slightly drops with increasing temperature. Hence, any internal heating of the fluorometer will lead to a corresponding decrease of the signal amplitude (see section 12.3.5). To take this aspect into account, the MINI-PAM features measurement of internal temperature (menu point 35), which is automatically registered with every YIELD-measurement and stored in MEMORY.
12.3.5 INT.TEMP (menu point 35) As outlined in the preceding section, the output of the measuring light LED is a function of temperature, a feature common to all solid-state lamps. Intensity decreases by approximately 1 % per °C. In practice, this has to be accounted for whenever signal amplitudes are compared. It is of no concern for YIELD-measurements (signal ratios ΔF/Fm' or Fv/Fm), except for a small local temperature increase within the LED when pulse frequency is switched from 0.6 to 20 kHz during a saturating light pulse which affects selectively Fm.
The internal temperature of the MINI-PAM, which is measured in the optical compartment in the vicinity of the halogen lamp, is displayed under menu point 35: INT.TEMP. It can increase
71
CHAPTER 12 MEASUREMENTS WITH THE MINI-PAM
considerably with prolonged operation of the halogen lamp, particularly at the higher intensity settings and when a high AL-FACT (menu point 16) is used. Therefore, actinic illumination time (menu point 14: ACT-WIDTH) is limited to 5 min and not more than 2 min are recommended for recordings of LIGHT CURVES, which involve 8 consecutive illumination periods (see section 12.3.9). Nevertheless, internal temperature increases of 10-20 °C are not uncommon, which will cause a decrease of measuring light intensity in the order of 10-20 %.
Small temperature related decreases of measuring light intensity also occur when the frequency is switched from 0.6 to 20 kHz. This is normally the case during actinic illumination with the internal halogen lamp. The extent of decrease depends on measuring light setting (menu point 50: MEAS-INT) and the length of the period at 20 kHz. It can be ignored at all measuring light settings for times below 2 s and amounts to approx. 1 % when a 3 s pulse is given at ML-setting 12. Hence, the effect on YIELD-determinations can be considered marginal. During prolonged 20 kHz operation at maximal ML-setting, the effective intensity drops by 2-3 %. This effect is reversible within a few minutes after returning to 0.6 kHz.
Changes in measuring light intensity induced by temperature changes, just like any effect on the sensitivity and selectivity of fluorescence measurements with the MINI-PAM, can be also evaluated by monitoring the fluorescence signal of the FLUORESCENCE STANDARD delivered together with the instrument. This blue plastic filter (Roscolene Surprise Blue) emits red fluorescence at an intensity similar to a leaf. As there is no photochemical energy conversion, fluorescence yield of this sample is constant during illumination, provided temperature is not changing. Using the Leaf-Clip Holder 2030-B with the integrated temperature-sensor, it can be readily shown that continuous actinic
72
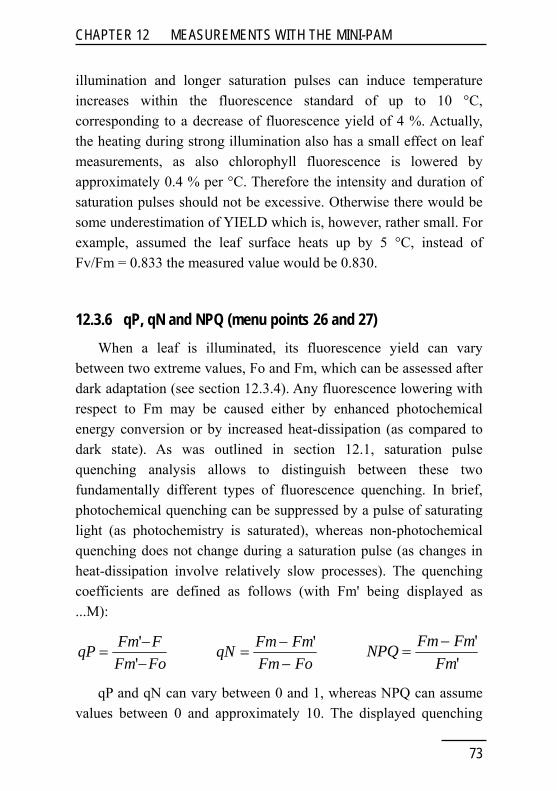
CHAPTER 12 MEASUREMENTS WITH THE MINI-PAM
illumination and longer saturation pulses can induce temperature increases within the fluorescence standard of up to 10 °C, corresponding to a decrease of fluorescence yield of 4 %. Actually, the heating during strong illumination also has a small effect on leaf measurements, as also chlorophyll fluorescence is lowered by approximately 0.4 % per °C. Therefore the intensity and duration of saturation pulses should not be excessive. Otherwise there would be some underestimation of YIELD which is, however, rather small. For example, assumed the leaf surface heats up by 5 °C, instead of Fv/Fm = 0.833 the measured value would be 0.830.
12.3.6 qP, qN and NPQ (menu points 26 and 27) When a leaf is illuminated, its fluorescence yield can vary between two extreme values, Fo and Fm, which can be assessed after dark adaptation (see section 12.3.4). Any fluorescence lowering with respect to Fm may be caused either by enhanced photochemical energy conversion or by increased heat-dissipation (as compared to dark state). As was outlined in section 12.1, saturation pulse quenching analysis allows to distinguish between these two fundamentally different types of fluorescence quenching. In brief, photochemical quenching can be suppressed by a pulse of saturating light (as photochemistry is saturated), whereas non-photochemical quenching does not change during a saturation pulse (as changes in heat-dissipation involve relatively slow processes). The quenching coefficients are defined as follows (with Fm' being displayed as ...M):
qP Fm FFm Fo
=−−''
qN Fm FmFm Fo
=−−
' NPQ Fm Fm
Fm=
− ''
qP and qN can vary between 0 and 1, whereas NPQ can assume values between 0 and approximately 10. The displayed quenching
73
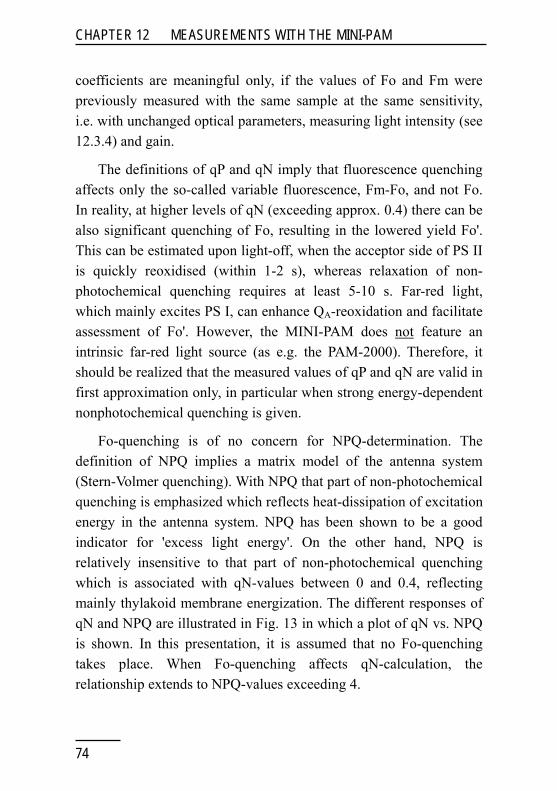
CHAPTER 12 MEASUREMENTS WITH THE MINI-PAM
coefficients are meaningful only, if the values of Fo and Fm were previously measured with the same sample at the same sensitivity, i.e. with unchanged optical parameters, measuring light intensity (see 12.3.4) and gain.
The definitions of qP and qN imply that fluorescence quenching affects only the so-called variable fluorescence, Fm-Fo, and not Fo. In reality, at higher levels of qN (exceeding approx. 0.4) there can be also significant quenching of Fo, resulting in the lowered yield Fo'. This can be estimated upon light-off, when the acceptor side of PS II is quickly reoxidised (within 1-2 s), whereas relaxation of non-photochemical quenching requires at least 5-10 s. Far-red light, which mainly excites PS I, can enhance QA-reoxidation and facilitate assessment of Fo'. However, the MINI-PAM does not feature an intrinsic far-red light source (as e.g. the PAM-2000). Therefore, it should be realized that the measured values of qP and qN are valid in first approximation only, in particular when strong energy-dependent nonphotochemical quenching is given.
Fo-quenching is of no concern for NPQ-determination. The definition of NPQ implies a matrix model of the antenna system (Stern-Volmer quenching). With NPQ that part of non-photochemical quenching is emphasized which reflects heat-dissipation of excitation energy in the antenna system. NPQ has been shown to be a good indicator for 'excess light energy'. On the other hand, NPQ is relatively insensitive to that part of non-photochemical quenching which is associated with qN-values between 0 and 0.4, reflecting mainly thylakoid membrane energization. The different responses of qN and NPQ are illustrated in Fig. 13 in which a plot of qN vs. NPQ is shown. In this presentation, it is assumed that no Fo-quenching takes place. When Fo-quenching affects qN-calculation, the relationship extends to NPQ-values exceeding 4.
74

CHAPTER 12 MEASUREMENTS WITH THE MINI-PAM
Fig. 13: Relationship between qN and NPQ
12.3.7 YIELD-measurements of illuminated samples With every application of START a YIELD-measurement is carried out and on the LC-display of the MINI-PAM in the standard menu position 1 the following signals measured in connection with a particular saturation pulse are shown:
• F, fluorescence yield measured briefly before triggering of the saturation pulse;
• M, fluorescence yield reached during the saturation pulse;
• Y, effective yield of photochemical energy conversion calculated as YIELD = (M-F)/M;
• E, apparent electron transport rate (ETR) calculated as ETR = YIELD * PAR * 0.5 * ETR-factor (displayed when Leaf-Clip Holder 2030-B is connected)
75
CHAPTER 12 MEASUREMENTS WITH THE MINI-PAM
This and additional information is stored in the MEMORY (see section 6) and can be transferred via the RS 232 interface to a PC using the WinControl software (see separate manual) or the PAMTRANS software (see 9).
Formally, there is no difference between YIELD-measurements with dark-adapted or illuminated samples. In the former case, F and M correspond to Fo and Fm (see 12.3.4) and Y corresponds to Fv/Fm, the maximal photochemical quantum yield (see 12.3.1). In practice, YIELD-determinations of illuminated samples are more easy, as the effect of measuring light intensity can be neglected. On the other hand, the interpretation of YIELD-data from illuminated samples requires somewhat more background knowledge. Whereas the dark-adapted state is well defined, there is an infinite number of light states, mainly determined by quantum flux density (PAR), illumination time, temperature and the physiological state of the sample. Therefore, YIELD-measurements should be carried out at defined light intensities and after defined periods of exposure to these intensities.
In one of its most common applications, the MINI-PAM assesses YIELD of plants in their natural light environment under steady-state conditions. In this case, use of the Leaf-Clip Holder 2030-B with automatic measurement of PAR and leaf temperature is very convenient (see 8.3). For adjustment of defined PAR-values the External Halogen Lamp 2050-HB (see 8.5) can be recommended.
12.3.8 ACT-LIGHT and ACT+YIELD (menu points 12 and 13) For shorter periods of actinic illumination also the internal halogen lamp can be used (see 8.1.3). As this leads to internal heating, illumination times are limited to 5 min. However, even much shorter times often are sufficient for reaching close to steady state, when the sample before has been kept in ambient light for some time. The actinic light can be turned on/off either by the double
76
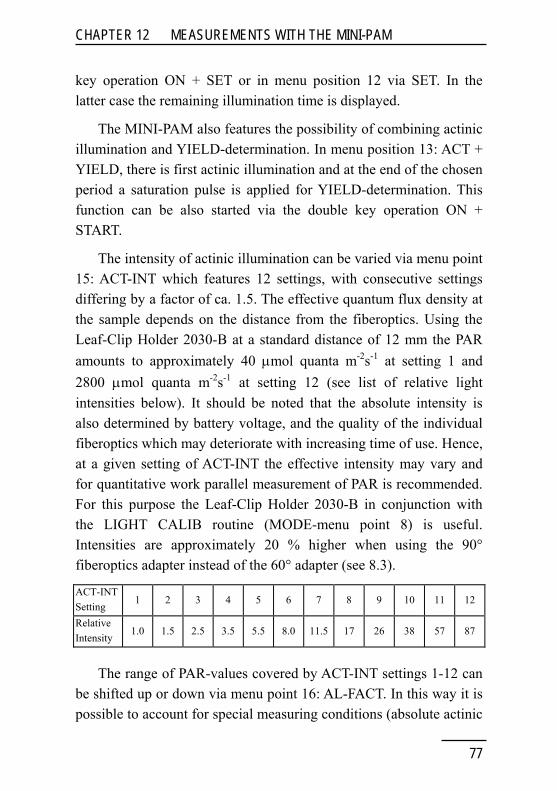
CHAPTER 12 MEASUREMENTS WITH THE MINI-PAM
key operation ON + SET or in menu position 12 via SET. In the latter case the remaining illumination time is displayed.
The MINI-PAM also features the possibility of combining actinic illumination and YIELD-determination. In menu position 13: ACT + YIELD, there is first actinic illumination and at the end of the chosen period a saturation pulse is applied for YIELD-determination. This function can be also started via the double key operation ON + START.
The intensity of actinic illumination can be varied via menu point 15: ACT-INT which features 12 settings, with consecutive settings differing by a factor of ca. 1.5. The effective quantum flux density at the sample depends on the distance from the fiberoptics. Using the Leaf-Clip Holder 2030-B at a standard distance of 12 mm the PAR amounts to approximately 40 μmol quanta m-2s-1 at setting 1 and 2800 μmol quanta m-2s-1 at setting 12 (see list of relative light intensities below). It should be noted that the absolute intensity is also determined by battery voltage, and the quality of the individual fiberoptics which may deteriorate with increasing time of use. Hence, at a given setting of ACT-INT the effective intensity may vary and for quantitative work parallel measurement of PAR is recommended. For this purpose the Leaf-Clip Holder 2030-B in conjunction with the LIGHT CALIB routine (MODE-menu point 8) is useful. Intensities are approximately 20 % higher when using the 90° fiberoptics adapter instead of the 60° adapter (see 8.3).
ACT-INT 1 2
Setting 3 4 5 6 7 8 9 10 11 12
Relative Intensity
1.0 1.5 2.5 3.5 5.5 8.0 11.5 17 26 38 57 87
The range of PAR-values covered by ACT-INT settings 1-12 can be shifted up or down via menu point 16: AL-FACT. In this way it is possible to account for special measuring conditions (absolute actinic
77

CHAPTER 12 MEASUREMENTS WITH THE MINI-PAM
intensities at sample site being exceptionally low or high) or for differences in light saturation properties of plants. The latter aspect is particularly relevant in conjunction with the automatic recording of light response curves (see 12.3.9). It is important to note that the relationship between AL-FACT and PAR is non-linear. It depends on the setting of ACT-INT (menu point 15) and also on battery voltage. For example, at setting 10 and with a freshly charged battery the PAR is increased by a factor of ca. 1.7 when AL-FACT is increased from 1.0 to 1.5, and PAR is decreased by a factor of ca. 0.4 when AL-FACT is decreased from 1.0 to 0.5. In practice, it is recommended to measure the effective PAR with the Leaf-Clip Holder 2030-B.
The duration of the actinic illumination periods is set via menu point 14: ACT-WIDTH, with an upper limit of 5:00. For longer illumination times an external actinic light source, like the External Halogen Lamp 2050-HB is recommended. When several actinic illumination periods are consecutively triggered, as with CLOCK-operation or LIGHT CURVE recordings (see 12.3.9), the ACT-WIDTH should be small, in order to avoid excessive internal heating of the MINI-PAM. In these applications it is limited to 3 min.
The ACT + YIELD function provides very essential information on the state of the photosynthetic apparatus of a sample. At a given photon flux density of photosynthetically active radiation (PAR), which can be monitored by the micro-quantum-sensor incorporated in the Leaf-Clip Holder 2030-B, the measured values of YIELD and ETR of different samples can be directly compared and interpreted in terms of relative electron transport rates. The efficiency of photosynthetic electron transport can be limited by numerous steps in the long sequence of reactions between the primary process of photochemical energy conversion at the reaction centers and the export of the assimilates out of the chloroplasts. In the steady state,
78

CHAPTER 12 MEASUREMENTS WITH THE MINI-PAM
the overall yield of assimilation is equivalent to the yield of energy conversion at PS II. For a limitation to become apparent, the system must be 'put under light pressure'. For example, if some stress factor has caused a decrease in Calvin cycle activity, this will be only expressed in YIELD or ETR, if a sufficiently high PAR is applied to make dark enzymic steps of the Calvin cycle limiting. The maximal YIELD of a dark-adapted sample, as measured by Fv/Fm (see 12.3.1) and by YIELD-values at low PAR, will be affected only, if the stress treatment has caused a limitation at the level of the primary reactions of energy conversion (excitation energy capture efficiency and charge separation efficiency at the reaction centers). This is, for example, the case after photoinhibitory treatment. Photoinhibition occurs, if a sample is exposed for longer time periods to excessive light intensities. To what extent a given light intensity is excessive depends on the physiological state of the sample and can be judged by YIELD-measurements (see following section 12.3.9 on LIGHT CURVES). A suppression of YIELD upon exposure of a sample to excessive light does not necessarily reflect permanent damage, but can also reflect a high potential for photoprotection by non-radiative energy dissipation. The latter is associated with high values of qN and NPQ (see 12.3.6).
12.3.9 LIGHT CURVE (menu point 17) and LIGHT-CURVE+REC (menu point 18)
The recording of a LIGHT CURVE involves 9 consecutive YIELD-measurements. The illumination series may start at ACTINIC INTENSITY 1, 2, 3, 4 or 5 (set via the LC-INT function, MODE-menu point 20). This feature allows to adjust the range of applied intensities to the light adaptation properties of the sample (sun or shade plant). When choosing the start-intensity, it should be also considered that a lower intensity range reduces the danger of
79

CHAPTER 12 MEASUREMENTS WITH THE MINI-PAM
instrument overheating with longer illumination times. An alternative possibility to vary the ACTINIC INTENSITY range is given by the ACT-FACT function (menu point 16). This shifts all intensities up or down.
Before starting a LIGHT CURVE recording, a sample should be well adapted to a moderate light intensity, which is close to the light intensity experienced by the plant in its natural environment. In this way the requirement of long illumination periods for reaching steady-state can be avoided. The length of the actinic-light-periods is determined by LC-WIDTH (menu position 19). This is limited to 3:00 min in LIGHT CURVE recordings. With the 8 consecutive illumination periods applied during a LIGHT CURVE it is advisable not to exceed 2:00 min in order to avoid excessive internal heating of the MINI-PAM.
A LIGHT CURVE is started either in menu position 17 via SET or in any other menu position by double key operation ON + ∧. The same commands apply for termination of a LIGHT CURVE. After starting a LIGHT CURVE there is first a YIELD-determination in the absence of actinic illumination for assessment of the maximal quantum yield. The sample should be sufficiently shaded, such that the external light does not contribute substantially to the PAR, which is approximately 100 μmol quanta m-2s-1 at setting 3 of ACT-INT, when the Leaf-Clip Holder is used under standard conditions. Intensities are approximately 20 % higher when the 90° fiberoptics adapter is used instead of the 60° adapter (see 8.3). Another advantage of the 90° light incidence is a more homogeneous illumination.
ACT-INT is automatically increased during the course of a LIGHT CURVE and YIELD is automatically determined at the end of each illumination period, the length of which is determined by the ACT-WIDTH. This results in a total of 9 YIELD- and ETR-values,
80
CHAPTER 12 MEASUREMENTS WITH THE MINI-PAM
which are stored in MEMORY (see 6) or transferred to a PC for further processing. Light Curves are displayed under WinControl (see separate manual).
Additional information on the dark-recovery of YIELD-lowering during actinic illumination can be obtained by the function L-CURVE+REC. This function can be started either via SET in menu position 18 or by ON+∨. It can be terminated by the same commands. The actual illumination program with L - CURVE + REC is identical to that of a LIGHT CURVE. In addition, after termination of the last illumination period, in the absence of actinic light the recovery of YIELD in the dark is assessed by 6 consecutive saturation pulses applied at 10 s, 30 s, 60 s, 2 min, 5 min, 10 min after light-off. In this way, different types of non-photochemical quenching can be distinguished which contribute to the lowering of the PS II quantum yield. It is generally assumed that the rapid recovery within the first 30-60 s reflects the disappearance of energy dependent nonphotochemical quenching, in parallel with the relaxation of the transthylakoidal ΔpH. The slower recovery within the first 10-30 min is considered to reflect a change of energy distribution in favor of PS II (so-called State Shift). The apparently irreversible YIELD-lowering (with respect to the original dark state) is expression of "photoinhibition".
LIGHT CURVES as measured with the MINI-PAM contain somewhat different information than the conventional light response curves. Correct measurement of the latter requires the attainment of steady state at each PAR-value, which takes at least 10 min. LIGHT CURVES recorded with short illumination times (down to 5 s; so-called Rapid Light Curves, RLC) allow insight into the physiological flexibility with which a plant sample can adapt its photosynthetic apparatus to rapid changes of light intensity. Hence, RLC contain information on induction as well as saturation
81
CHAPTER 12 MEASUREMENTS WITH THE MINI-PAM
characteristics of photosynthesis. LIGHT CURVES measured during the course of a day (e.g. triggered by the Repetition Clock, see 12.3.12) may show largely different characteristics due to the fact that the physiological state of the photosynthetic apparatus is regulated by environmental factors in a highly dynamic manner. Whereas for proper recording of a conventional light response curve it is essential that all conditions (like temperature, CO2-concentration, humidity) are kept constant over extended periods of time, LIGHT CURVES are sufficiently fast that they can characterize a momentary state of a plant in a naturally changing environment.
12.3.10 YIELD- and ETR-averaging (menu point 11) With normal samples under standard conditions the signal/noise ratio obtained with the MINI-PAM is rather high, such that a single measurement results in the reliable determination of YIELD and ETR (see 12.3.7). In practice, the averaging function is most useful in order to obtain representative information on the photosynthetic performance of a heterogeneous sample. For example, repeated measurements at one particular sample site may give YIELD- and ETR-values fluctuating by no more than 0.001, whereas the values at another site may differ by more than 0.1 units. This is particularly true for outdoor measurements where the effective incident light intensity depends strongly on sample position, possible shading etc. In order to assess the effective quantum yield and the apparent electron transport rate of a sample in a given situation under natural conditions, the sample holder ideally must be attached such that there is no sample shading. As this ideal can be only more or less approached, unavoidably there is some variability in the results, and averaging can be useful. The averaged data are not stored in the memory. On the other hand, as every individual data set is stored in MEMORY, which can be later transferred to a PC (see 9), users may
82
CHAPTER 12 MEASUREMENTS WITH THE MINI-PAM
prefer to evaluate statistical aspects of the data at a later stage, applying standard programs. The optional WinControl software also allows averaging of stored data in a most comfortable way.
Another case where averaging is advantageous relates to measurements under extreme environmental conditions which cause almost complete loss of variable fluorescence, i.e. when YIELD approaches zero, while ETR may still be substantial due to high PAR-values. Under such conditions, even the MINI-PAM becomes limited by the signal/noise ratio in YIELD-determination, which can be improved by averaging.
Before use of the averaging function, the SET-key must be pressed in menu position 11 and AV. YIELD RESET must be confirmed by pressing the ∧-key. Then with every application of a saturation pulse the measured values of YIELD (Y) and ETR (E) will be averaged until another reset is carried out.
12.3.11 INDUCTION CURVE (menu point 21) and INDUCTION CURVE+RECOVERY (menu point 22)
Dark/light induction curves (Kautsky effect) contain complex information on the photosynthetic performance of a plant at different functional levels (see 12.1). By repetitive application of saturating light pulses and quenching analysis additional information is obtained which is essential for reliable interpretation of the Kautsky effect. After a longer period of darkness, Calvin-cycle enzymes are partially inactivated. They are light-activated during the first minutes of illumination. During this induction period oxygen instead of CO2 serves as terminal electron acceptor. O2 dependent electron flow (Mehler-Ascorbate-Peroxidase Cycle) as well as cyclic electron flow at photosystem I create a large proton gradient, which will be used for ATP-synthesis only after Calvin cycle has been light activated.
83
CHAPTER 12 MEASUREMENTS WITH THE MINI-PAM
This leads to strong "energy-dependent" nonphotochemical fluorescence quenching during the first minutes of illumination (characterized by low Fm'-values), which partially declines again when CO2-fixation takes over and ATP is consumed.
In order to record an INDUCTION CURVE with the MINI-PAM, a fixed geometry between sample and fiberoptics must be assured for the duration of the recording. The recording is started by MODE-menu function 21: IND.CURVE. It is also possible to record the light/dark recovery in addition to the dark/light induction (22:IND.CURVE+REC). In this case information on post-illumination reactions are obtained, in particular on the recovery of various components of nonphotochemical quenching (see 12.3.9), the extent of photoinhibition and also on dark electron flow between stroma (or cytoplasma) and the electron carrier in the thylakoid membrane.
Induction curves are either recorded via the analog output of the MINI-PAM using a chart recorder or via the RS 232 interface using a PC under WinControl-software. The latter offers the possibility of online registration and display of various derived fluorescence parameters, like effective quantum yield and quenching coefficients (see separate WinControl manual).
Before recording of the actual induction curve, a single saturation pulse is applied for assessment of Fo, Fm and Fv/Fm after dark adaptation. This is a prerequisite for correct quenching analysis (see 12.3.1, 12.3.4 , 12.3.6). The delay between this saturation pulse and onset of illumination can be varied (23: IND.DELAY); its default value is 40 s. Another variable is the time interval between two consecutive saturation pulses during actinic illumination (24: IND.-WIDTH), with a default setting of 20 s.
Due to the outstanding role of molecular O2 during the induction period, O2 partial pressures within the sample has a strong influence
84
CHAPTER 12 MEASUREMENTS WITH THE MINI-PAM
on all features of the the induction curves. This aspect is particularly relevant for endosymbiotic phycobionts, as O2 is consumed by their own and the host's dark-respiration and O2-diffusion is restricted (see recent report by Schreiber, Gademann, Ralph and Larkum: Assessment of photosynthetic performance of Prochloron in Lissoclinum patella in hospite by chlorophyll fluorescence measurements. Plant Cell Physiol. 38(8), 945-951, 1997).
12.3.12 Repetition Clock (menu point 28: REP-CLOCK and double key function ON+MEM)
The Repetition Clock is primarily meant to trigger saturation pulses for YIELD-determination at defined time intervals which are set in menu position 30: CLK-TIME. The standard interval of 20 s is appropriate for the recording of fluorescence induction curves with repetitive YIELD-determination. The CLOCK can be started/stopped in menu position 28 via SET. Then on the display the remaining time to the next start of a function is shown. Start/Stop of the CLOCK is also possible in other menu positions via the double key operation ON+MEM.
Besides YIELD-measurements also other functions can be repetitively triggered by the CLOCK. For this purpose the MODE-menu point 29 (CLOCK-ITEM) is provided which allows to choose between:
1: SATURATION PULSE (SAT)
2: ACT+YIELD (A+Y)
3: LIGHT CURVE (LC)
4: L-CURVE+REC. (LC+)
5: INDUCTION-CURVE (IC)
85
CHAPTER 12 MEASUREMENTS WITH THE MINI-PAM
86
6: INDUCTION-C+REC. (IC+)
The CLOCK can be very useful for long term characterization of the photosynthetic performance of a plant in its natural environment, e.g. over the course of a day. As after every YIELD-determination the corresponding data set is stored in MEMORY, in principle the researcher just needs to start the CLOCK in the morning and collect the data at night. In this context it is important to note that the full capacity of a freshly charged battery allows approximately 12 hours continuous operation of the MINI-PAM with standard YIELD-determination every minute (total of ca. 720 saturation pulses). When the CLOCK is running, the usual power saving function of AUTO-OFF is disabled, with the consequence that there could be excessive discharge of the battery. Therefore, in order to avoid battery damage (see 11.1) the CLOCK is automatically switched off when battery voltage drops below 8.5 V.
CHAPTER 13 APPENDIX
13 Appendix
13.1 Technical specifications
Photosynthesis Yield Analyzer MINI-PAM
Measuring light source: Light emitting diode, emission maximum at 650 nm; 12 intensity settings, standard intensity 0.15 µmol m-2s-1 PAR; modulation frequency 0.6 or 20 kHz; Auto 20 kHz function; burst-mode, 1/5 integrated intensity
Halogen lamp: 8 V/20 W blue enriched, filtered to give λ<710 nm; 12 intensity settings, max. 6000 µmol m-2s-1 PAR with continuous actinic illumination, max. 18000 µmol m-2s-1 PAR during saturation pulses
Signal detection: PIN-photodiode protected by long-pass filter (λ>710 nm); selective window amplifier (patented); sampling rate, 150 µs/point
Microcontroller: CMOS 80C52 Memory: Program memory, CMOS EPROM 32 kB;
Data buffer, CMOS RAM 128 kB, providing memory for up to 4000 data sets
Measured and calculated parameters: Fo, Fm, Fm', F, Fv/Fm (max. yield),
ΔF/Fm' (yield), qP, qN, NPQ, PAR and °C (using Leaf-Clip Holder 2030-B), ETR (i.e. PAR x ΔF/Fm')
87
CHAPTER 13 APPENDIX
Display: 2 x 24 character alphanumerical LC-display with backlight; character size 4.5 mm
User interface: 2 x 4 tactile keypad Power supply: Internal rechargeable battery 12 V/2 Ah,
providing power for ca. 1000 yield measurements; automatic power/off when not used for 4 min; Battery Charger MINI-PAM/L
PC-terminal operation: Via RS 232 interface using special command set; for remote control of all functions
Data output and transfer: Analog output, 0-4 V; transfer on PC, via RS 232 as ASCII-file using DOS or Windows version of PAMTRANS Data Transfer Program or WinControl Software
Dimensions: 19 cm x 13 cm x 9.5 cm (L x W x H) Weight: 2.05 kg Permissible ambient temperature: -5 to 45 °C
Windows-Software WinControl for online PC-operation via RS 232-interface
Special functions: Chart-display of fluorescence parameters Induction curve registration Light curve registration Curve averaging Display of saturation pulse kinetics Report file Data transfer
88

CHAPTER 13 APPENDIX
Fiberoptics MINI-PAM/F
Design: Randomized 70 µm glass-fibers with steel spiral envelope forming single plastic shielded bundle with stainless steel adaptor ends
Dimensions: Active diameter, 5.5 mm; outer diameter, 8 mm; length, 100 cm
Weight: 0.18 kg
Battery Charger MINI-PAM/L
Power Supply: 100 to 240 V AC, 50/60 Hz Output: 18 V/45 W Dimensions: 13.5 cm x 6 cm x 3.6 cm (L x W x H) Weight: 0.26 kg
Transport Case MINI-PAM/T
Design: Plastic case with custom foam packing Dimensions: 42.5 cm x 34 cm x 13.5 cm (L x W x H) Weight: 1.9 kg
Leaf Clips:
Standard Clip
Design: Positioning leaf surface at 60° with respect to fiberoptics, for undisturbed incidence of natural light
89
CHAPTER 13 APPENDIX
Dark Leaf Clip DLC-8 (optional)
Design: Made of anodized aluminum with felt contact areas and sliding shutter (closure); weight, 3.6 g
Leaf-Clip Holder 2030-B (optional)
Design: 60° or 90° attachment of fiberoptics; for simultaneous recording of PAR and °C at measuring site
Micro quantum sensor: Selective measurement of photosynthetically active radiation, PAR (380-710 nm), 0 to 20000 µmol m-2s-1
Thermocouple: Ni-CrNi, ∅ 0.1 mm, -20 to 60 °C Power supply: Via cable connecting to MINI-PAM Output: PAR and °C on LC-display of MINI-PAM;
push-button trigger-signal to start saturation pulse for yield-measurement
Weight: 0.35 kg
External Halogen Lamp 2050-HB (optional) Wavelength: <710 nm Light intensity: max. 3000 µmol quanta m-2s-1, stepless
setting Power supply: 12 V/max. 1.6 A e. g. via Battery NP-3/12 Length of the connecting cable: 120 cm Weight: 0.25 kg
90
CHAPTER 13 APPENDIX
Micro Quantum/Temp.-Sensor 2060-M (optional) for simultaneous recording of PAR and °C at measuring site
Micro quantum sensor: Selective measurement of photosynthetically active radiation, PAR (380-710 nm), 0 to 20000 µmol m-2s-1
Thermocouple: Ni-CrNi, ∅ 0.1 mm, -20 to 60 °C Power supply: Via cable connecting to MINI-PAM Output: PAR and °C on LC-display of MINI-PAM Length of sensor cables: 30 cm Weight: 0.22 kg
Miniature Fiberoptics MINI-PAM/F1 (optional) for small spot measurements
Design: Single plastic-fiber with adaptor for MINI-PAM
Dimensions: Active diameter, 2 mm; length, 150 cm
13.2 List of warnings and errors Errors in MINI-PAM performance and warnings concerning sub-optimal use of the instrument are signalled by messages in the upper left corner of the display line. The following list briefly describes the various error messages:
Err. OVERFLOW: >3500
Maximal signal level was exceeded. The distance to the sample should be increased. Alternatively, the GAIN (menu point 49) or the MEAS-INT (menu point 50) may be decreased. In the latter cases, the zero offset must be newly determined (2: AUTO-ZERO).
91

CHAPTER 13 APPENDIX
Err. SIGNAL LOW: <130
Signal/noise ratio can be improved by increasing the signal: For this purpose, decrease distance between fiberoptics and sample; or increase GAIN (menu point 49) or MEAS-INT (menu point 50). In the latter cases, the zero offset must be newly determined (2: AUTO-ZERO).
Err. LOW BATTERY
Battery voltage has dropped below 11.2 V which means that only 20-30 further measurements are possible: Recharge battery or connect external battery by special cable (MINI-PAM/AK, optional).
Err. ? NEW OFFSET ?
Last measurement may be erroneous as GAIN (menu point 49) or MEAS-INT (menu point 50) was changed without being followed by new zero offset determination (2: AUTO-ZERO). The warning can be overruled by pressing SET while in menu position 1.
Err. ! CHECK BATTERY !
Battery voltage drops during application of a saturation pulse below 8.5 V, which means that it is almost empty or too old: Recharge or possibly replace battery.
Err. MEMORY: 001
Maximal MEMORY-number of 4000 is reached. With further measurements, the new data sets will replace the old data sets starting from No. 1.
Additional warnings and information are given by messages in the left corner of the upper display line:
92

CHAPTER 13 APPENDIX
BAT Battery voltage has dropped below 11.2 V: Be prepared that the error message 3 (LOW BATTERY) will appear when START is applied.
ACT Actinic illumination is running.
A+Y Actinic illumination with terminal YIELD-determination (menu point 12) is running.
CLK REPETITION-CLOCK (menu point 28) is running.
LC Automatic recording of a LIGHT CURVE (menu point 17) is running.
LC+ Automatic recording of a LIGHT CURVE + RECOVERY (menu point 18) is running.
IC Automatic recording of an INDUCTION CURVE (menu point 21) is running.
IC+ Automatic recording of an INDUCTION CURVE + RECOVERY (menu point 22) is running.
REC Recovery part of LIGHT INDUCTION CURVE is running.
SAT A saturating light pulse is applied for YIELD-determination.
13.3 PIN-assignments "LEAF CLIP"
1: +5 V
7
6
5
43
2
1
2: GND 3: ⎫ Analog inputs Leaf-Clip Holder 4: ⎬ 2030-B or Micro Quantum/Temp.- 5: ⎭ Sensor 2060-M 6: Remote control button 7: -5 V
93

CHAPTER 13 APPENDIX
"RS 232"
5
43
2
1
1: Not used 2: Not used 3: TxD 4: RxD 5: GND
"OUTPUT"
2
1
1: Signal output 0-4 V 2: GND
"CHARGE"
32
1
1: Charge input +18 V 2: GND 3: External input +12 V (max. 13.8 V).
ATTENTION: Internal battery cannot be charged via this input.
13.4 List of commands for operation of MINI-PAM via PC-terminal by user-written software
As described in chapter 10, the MINI-PAM can be operated by remote control from a PC terminal. For this purpose a suitable TERMINAL-program must be installed and the RS 232 interface cable connected to the corresponding communication port. The following commands are executed via 'Return'. Please note that only low-case letters are effective.
94

CHAPTER 13 APPENDIX
In custom applications it should be made sure that at least 50 ms elapse between two consecutively sent letters. The communication has lower priority than the measuring routines and at higher rates letters may get lost. For some commands the measuring program is transiently stopped. Hence, data transfer should not occur during measurements.
In addition, also the WinControl software is available, which has been optimized for the communication between PC and MINI-PAM and features a number of most comfortable functions for data acquisition and analysis (see separate manual).
Command Corresponding point in MODE-menu
Description
? 37: Date of Software version (current EPROM)
a1/a0 12: Act. light on/off aix 15: Act. Intensity with setting x (x = 0
... 12) awx 14: Act. Width with setting x (x = 10 s
... 5 min) a01/a00 10: AUTO-OFF on/off af or afx 16: ACT.-FACTOR (x = 0.5 ... 1.5) ay1/ay0 13: Act. Light + YIELD on/off b BREAK, to stop all running
functions be1/be0 Enable/Disable beep-function bp or bpx Beep with length x (1 = 10 ms) c1/c0 28: CLOCK on/off ct or ctx 30: CLOCK time (interval x = 10 ...
990 s) ci or cix 29 CLOCK item (1..6) d or dx 48: Damping setting (x = 1 ... 3)
95
CHAPTER 13 APPENDIX
Command Corresponding point in MODE-menu
Description
dat or dat(ddmmyy)
32: Date (day month year)
dl1/dl0 9: Display light on/off dsx Display MODE-menu point x e 1: ETR (electron transport rate) ea 11: Averaged ETR (Leaf Clip) ec1/ec0 Echo on/off ef or efx 45: ETR-factor (defined as x)
f 1: Fluorescence yield before last sat.pulse, F
f* 1: Momentary fluorescence yield, F*
fmp 1: Max. fluor. yield during last sat.pulse, Fm'
fm 25: Max. dark adapted fluor., Fm fo 25: Min. dark adapted fluor., Fo fos 25: Fo-Fm determination fz or fzx 44: ZERO-OFFSET (defined as x) fzs 2: AUTO-ZERO determination g or gx 49: Gain setting (x = 1 ... 12) ic1/ic0 21: Induction Curve on/off ic+1/ic+0 22: IC+Recovery on/off idx 23: Induction delay iwx 24: Induction width l 1: Light int. (PAR meas. with
ext.light sensor) la1/la0 6: Light average on/off lg or lgx 41: Light gain (Leaf Clip) lo or lox 40: Light offset (Leaf Clip) lc1/lc0 17: Light curve on/off lc+1/lc+0 18: Light curve + Recovery on/off le1/le0 7: Ext. light sensor on/off lec1 8: Light cal lr Read light list lw Write light list
96
CHAPTER 13 APPENDIX
Command Corresponding point in MODE-menu
Description
li or lix 20: Light curve start-intensity lw or lwx 19: Light curve step width m1/m0 3: Measuring light on/off ma or max 51: Mark of sample (x = A ... Z) mb1/0 5: ML-BURST function on/off mf1/0 4: ML-frequency (20/0.6 kHz) mi or mix 50: ML-intensity (x = 1 ... 12) me or mex 38: MEMORY-number (x = 1 ...
4000) mez 39: CLEAR-MEMORY (attention!
data will be erased) npq 27: NPQ-parameter o or ox Display of data set Mem.x o+ or o+x Display of data sets from 1 to x of Display of data set format pao MINI-PAM switched off pas Display of present MINI-PAM
settings paz 36: MINI-PAM settings reset to
standard qn 26: Display of present qN qp 26: Display of present qp s Start saturation pulse si or six 47: Sat. pulse intensity (x = 1 ... 12) sw or swx 46: Sat. pulse width (x = 0.4 ... 3.0) t 1: External temperature ti 35: Internal temperature tox 42: External temperature offset tgx 43: External temperature gain tim(hhmm) 31: Time (hour minute) ub 34: Battery voltage us 34: Battery voltage during last sat.
pulse ver No. of program version vx Voltage at channel x of A/D
97
CHAPTER 13 APPENDIX
Command Corresponding point in MODE-menu
Description
converter (x = 0 ... 7) y 1: YIELD measured with last sat.
pulse ya 16: Averaged YIELD yn 16: No. of averaged YIELD-values yz 16: Reset YIELD-averaging function
13.5 Selected reviews on chlorophyll fluorescence and related topics
Allen JF (1992) Protein phosphorylation in regulation of photosynthesis. Biochim Biophys Acta 1098:275-335
Allen JF (1995) Thylakoid protein phosphorylation, state 1-state 2 transitions, and photosystem stoichiometry adjustment: redox control at multiple levels of gene expression. Physiol Plant 93:196-205
Baker NR and Horton P (1987) Chlorophyll fluorescence quenching during photoinhibition. In: Kyle DJ, Osmond CB and Arntzen CJ (eds) Photoinhibition, pp 145-168. Elsevier, Amsterdam
Björkman O (1987) Low-temperature chlorophyll fluorescence in leaves and its relationship to photon yield of photosynthesis in photoinhibition. In: Kyle DJ, Osmond CB and Arntzen CJ (eds) Photoinhibition, pp 123-144. Elsevier, Amsterdam
Björkman O and Demmig-Adams B (1994) Regulation of photosynthetic light energy capture, conversion, and dissipation in leaves of higher plants. In: Schulze E-D and Caldwell MM (eds) Ecophysiology of Photosynthesis. Ecological Studies 100, pp 17-47. Springer, Berlin
98

CHAPTER 13 APPENDIX
Bolhar-Nordenkampf HR, Long SP, Baker NR, Öquist G, Schreiber U and Lechner EG (1989) Chlorophyll fluorescence as a probe of the photosynthetic competence of leaves in the field: a review of current instrumentation. Functional Ecology 3:497-514
Bose S (1982) Chlorophyll fluorescence in green plants and energy transfer pathways in photosynthesis. Photochem Photobiol 36:725-731
Briantais J-M, Vernotte C, Krause GH and Weis E (1986) Chlorophyll a fluorescence of higher plants: chloroplasts and leaves. In: Govindjee, Amesz J and Fork DC (eds) Light Emission by Plants and Bacteria, pp 539-583. Academic Press, Orlando
Butler WL (1978) Energy distribution in the photochemical apparatus of photosynthesis. Annu Rev Plant Physiol 29:345-378
Critchley C (1998) Photoinhibition. In: Raghavendra, A. S. (ed) Photosynthesis: 264-272. Cambridge University Press
Dau H (1994a) Molecular mechanisms and quantitative models of variable photosystem II fluorescence. Photochem Photobiol 60:1-23
Dau H (1994b) Short-term adaptation of plants to changing light intensities and its relation to Photosystem II photochemistry and fluorescence emission. J Photochem Photobiol B:Biol 26:3-27
Demmig-Adams B (1990) Carotenoids and photoprotection in plants: A role for the xanthophyll zeaxanthin. Biochim Biophys Acta 1020:1-24
Demmig-Adams B and Adams WW, III (1992) Photoprotection and other responses of plants to high light stress. Annu Rev Plant Physiol Plant Mol Biol 43:599-626
99
CHAPTER 13 APPENDIX
Edwards GE and Baker NR (1993) Can CO2 assimilation in maize leaves be predicted accurately from chlorophyll fluorescence analysis? Photosynth Res 37:89-102
Falkowski PG and Kolber Z (1995) Variations in chlorophyll fluorescence yields in phytoplankton in the world oceans. Aust J Plant Physiol 22:341-355
Govindjee (1990) Photosystem II heterogeneity: the acceptor side. Photosynth Res 25:151-160
Govindjee (1995) Sixty-three years since Kautsky: Chlorophyll a fluorescence. Aust J Plant Physiol 22:131-160
Holzwarth AR (1991) Excited-state kinetics in chlorophyll systems and its relationship to the functional organization of the photosystems. In: Scheer H (ed) Chlorophylls, pp 1125-1151. CRC Press, Boca Raton
Horton P and Bowyer JR (1990) Chlorophyll fluorescence transients. In: Harwood JL and Bowyer JR (eds) Methods in Plant Biochemistry, Vol 4, pp 259-296. Academic Press, New York
Horton P and Ruban AV (1992) Regulation of Photosystem II. Photosynth Res 34:375-385
Joshi MK and Mohanty P (1995) Probing photosynthetic performance by chlorophyll a fluorescence: Analysis and interpretation of fluorescence parameters. J Sci Ind Res 54:155-174
Karukstis KK (1991) Chlorophyll fluorescence as a physiological probe of the photosynthetic apparatus. In: Scheer H (ed) Chlorophylls, pp 769-795. CRC Press, Boca Raton
Kolber Z and Falkowski PG (1993) Use of active fluorescence to estimate phytoplankton photosynthesis in situ. Limnol Oceanogr 38:1646-1665
100
CHAPTER 13 APPENDIX
Krall JP and Edwards GE (1992) Relationship between photosystem II activity and CO2 fixation in leaves. Physiol Plant 86:180-187
Krause GH and Weis E (1984) Chlorophyll fluorescence as a tool in plant physiology. II Interpretation of fluorescence signals. Photosynth Res 5:139-157
Krause GH and Weis E (1991) Chlorophyll fluorescence and photosynthesis: The basics. Annu Rev Plant Physiol Plant Mol Biol 42:313-349
Lavorel J and Etienne AL (1977) In vivo chlorophyll fluorescence. In: Barber J (ed) Primary Processes of Photosynthesis, pp 203-268. Elsevier, Amsterdam
Lichtenthaler HK (1992) The Kautsky effect: 60 years of chlorophyll fluorescence induction kinetics. Photosynthetica 27(1-2):45-55
Lichtenthaler HK and Rinderle U (1988) The role of chlorophyll fluorescence in the detection of stress conditions in plants. In: CRC Critical Reviews in Analytical Chemistry, pp S29-S85. CRC Press, Boca Raton
Melis A (1991) Dynamics of photosynthetic membrane composition and function. Biochim Biophys Acta 1058:87-106
Mohammed GH, Binder WD and Gillies SL (1995) Chlorophyll fluorescence: a review of its practical forestry applications and instrumentation. Scand J For Res 10:383-410
Moya I, Sebban P and Haehnel W (1986) Lifetime of excited states and quantum yield of chlorophyll a fluorescence in vivo. In: Govindjee, Amesz J and Fork DC (eds) Light Emission by Plants and Bacteria, pp 161-190. Academic Press, Orlando
Papageorgiou G (1975) Chlorophyll fluorescence: An intrinsic probe of phyotosynthesis. In: Govindjee (ed) Bioenergetics of Photosynthesis, pp 319-371. Academic Press, New York
101

CHAPTER 13 APPENDIX
Pfündel E and Bilger W (1994) Regulation and possible function of the violaxanthin cycle. Photosynth Res 42:89-109
Renger G (1992) Energy transfer and trapping in photosystem II. In: Barber J (ed) The Photosystems: Structure, Function and Molecular Biology, pp 45-99. Elsevier, Amsterdam
Renger G and Schreiber U (1986) Practical applications of fluorometric methods to algae and higher plant research. In: Govindjee, Amesz J and Fork DC (eds) Light Emission by Plants and Bacteria, pp 587-619. Academic Press, Orlando
Schreiber U (1983) Chlorophyll fluorescence yield changes as a tool in plant physiology I. The measuring system. Photosynth Res 4:361-371
Schreiber U, Bilger W and Neubauer C (1994) Chlorophyll fluorescence as a nonintrusive indicator for rapid assessment of in vivo photosynthesis. In: Schulze E-D and Caldwell MM (eds) Ecophysiology of Photosynthesis, Vol 100, pp 49-70. Springer, Berlin Heidelberg New York
Schreiber U, Hormann H, Neubauer C and Klughammer C (1995) Assessment of photosystem II photochemical quantum yield by chlorophyll fluorescence quenching analysis. Aust J Plant Physiol 22:209-220
Schreiber U and Bilger W (1987) Rapid assessment of stress effects on plant leaves by chlorophyll fluorescence measurements. In: Tenhunen JD, Catarino FM, Lange OL and Oechel WC (eds) Plant Response to Stress - Functional Analysis in Mediterranean Ecosystems. NATO Advanced Science Institute Series, pp 27-53. Springer, Berlin-Heidelberg-New York-Tokyo
102

CHAPTER 13 APPENDIX
103
Schreiber U and Bilger W (1993) Progress in chlorophyll fluorescence research: major developments during the past years in retrospect. Progress in Botany 54:151-173
Schreiber U and Neubauer C (1990) O2-dependent electron flow, membrane energization and the mechanism of non-photochemical quenching of chlorophyll fluorescence. Photosynth Res 25:279-293
Schreiber U, Bilger W, Hormann H and Neubauer C (1998) Chlorophyll fluorescence as a diagnostic tool: basics and some aspects of practical relevance. In: Raghavendra A. S. (ed) Photosynthesis: 320-336. Cambridge University Press
Seaton GGR and Walker DA (1992) Measuring photosynthesis by measuring fluorescence. In: Barber J, Guerrero MG and Medrano H (eds) Trends in Photosynthesis Research, pp 289-304. Intercept, Andover, Hampshire
van Kooten O and Snel JFH (1990) The use of chlorophyll fluorescence nomenclature in plant stress physiology. Photosynth Res 25:147-150
Walker D (1992) Tansley Review No. 36. Excited leaves. New Phytol 121:325-345
Wilhelm C and Büchel C (1993) In vivo analysis of slow chlorophyll fluorescence induction kinetics in algae: progress, problems and perspectives. Photochem Photobiol 58:137-148
Williams WP and Allen JF (1987) State 1/state 2 changes in higher plants and algae. Photosynth Res 13:19-45

CHAPTER 14 RECHARGEABLE BATTERY
14 Rechargeable battery The Photosynthesis Yield Analyzer MINI-PAM is equipped with a rechargeable sealed-lead acid battery.
The life time is 1-3 years and it depends on the specific application. A 10 °C rise of the temperature will decrease battery life by approx. 25%. Near the end-of-life the standby capacity of the battery will be reduced. When this reduction becomes persistently, please replace the battery.
The battery cannot be overcharged, when the battery charger supplied with the instrument is used! Do not use any other battery charger!
Never store the instrument with a discharged or partially discharged battery! It is recommended to charge the battery every three months during the storage period.
For optimum performance always recharge the battery
immediately after discharging!
Never leave the battery in a discharged stage!
Never short-circuit the battery terminals!
104
CHAPTER 15 WARRANTY CONDITIONS
15 Warranty conditions All products supplied by the Heinz Walz GmbH, Germany, are warranted by Heinz Walz GmbH, Germany to be free from defects in material and workmanship for one (1) year from the shipping date (date on invoice).
The warranty is subject to the following conditions:
1. This warranty applies if the defects are called to the attention of Heinz Walz GmbH, Germany, in writing within one year (1) of the shipping date of the product.
2. This warranty shall not apply to any defects or damage directly or indirectly caused by or resulting from the use of unauthorized replacement parts and/or service performed by unauthorized personnel.
3. This warranty shall not apply to any product supplied by the Heinz Walz GmbH, Germany which has been subjected to misuse, abuse, abnormal use, negligence, alteration or accident.
4. This warranty does not apply to damage caused from improper packaging during shipment or any natural acts of God.
5. This warranty does not apply to underwater cables, batteries, fiberoptic cables, lamps, gas filters, thermocouples, fuses or calibrations.
To obtain warranty service, please follow the instructions below:
1. The Warranty Registration form must be completed and returned to Heinz Walz GmbH, Germany.
2. The product must be returned to Heinz Walz GmbH, Germany, within 30 days after Heinz Walz GmbH, Germany has received written notice of the defect. Postage, insurance, custom duties,
105

CHAPTER 15 WARRANTY CONDITIONS
106
and/or shipping costs incurred in returning equipment for warranty service are at customer expense.
3. All products being returned for warranty service must be carefully packed and sent freight prepaid.
4. Heinz Walz GmbH, Germany is not responsible or liable, for missing components or damage to the unit caused by handling during shipping. All claims or damage should be directed to the shipping carrier.