Embed Size (px)
Citation preview

Journal of Ovonic Research Vol. 13, No. 5, September - October 2017, p. 271 - 281
PHOTOCATALYTIC DEGRADATION OF ORANGE II BY ACTIVE LAYERS
OF Cu-DOPED ZnO DEPOSITED ON POROUS CERAMIC SUBSTRATES
D. BOURASa, A. MECIF
a, A. MAHDJOUB
b*, A. HARABI
c, M. ZAABAT
a,
S. BENZITOUNIa, B. REGIS
d
a Laboratory of Active Components and Materials, Larbi Ben M'Hidi University,
Oum El Bouaghi 04000, Algeria. b Laboratoire des Matériaux et Structures des Systèmes Electromécaniques et leur
Fiabilité (LMSSEF) Université d’Oum El Bouaghi BP 358, Algérie. c Ceramics Laboratory, Mentouri University, Constantine 25000, Algeria.
d MOLTECH-Anjou, Université d’Angers/UMR CNRS 6200, 2 Bd Lavoisier,
49045 Angers, France.
Aiming at purifying water at low cost for our daily life, thin layers of zinc oxide and
copper doped ZnO are deposited on ceramic pellets based on cristobalite, mullite and
zircon. These substrates are made with local raw material to which zirconia is added so as
to create open porosity. The thin films are prepared by sol-gel method. The effect of
copper doping on their structural, morphological and photocatalytic properties has been
studied by different analytical techniques such as X-ray diffraction, atomic force
microscopy, scanning electron microscopy, energy-dispersive X-ray spectrometry and
UV-visible spectrophotometry. The photocatalytic activity has been carried out on an
aqueous solution of Orange II insolated with a UV lamp. The final results show that only
the porous substrates obtained with addition of zirconia and coated with active layers of
ZnO or Cu doped ZnO give an important photocatalytic activity. This important effect can
be related to the high rate of open porosity in the substrates caused by the consumption of
the vitreous phase by zirconia. The open pores allow having a wider surface covered with
the active film. The obtained maximum degradation rate of Orange II is 77.76% for an
exposition time of 6 hours with ZnO:Cu thin film deposited on porous substrates.
(Received July 26, 2017; Accepted October 2, 2017)
Keywords: Ceramic substrate; Zirconia; Sol-Gel; ZnO:Cu; Degradation rate
1. Introduction
Nowadays, pollution has become a major problem on a global scale. The remedy lies in a
preliminary treatment of industrial discharges before disembarking them in the wild.
Heterogeneous photocatalysis is a promising alternative for the treatment of organic pollutants in
water [1-4]. Orange II was chosen from other dyes because it is one of the most used pigments in
the industry. As belonging to chemical compounds and presenting carcinogenic effects for humans
and animals, the work on this type of dye is of great interest [5]. Since there is a phenomenon of
photocatalytic decomposition of water on ceramic samples [6- 8], mullite-cristobalite and mullite-
zircon pellets (with a suitable open porosity rate) [9] are used as substrates under UV irradiation.
These components are obtained from local kaolinite clay DD3 with or without addition of zirconia,
after adequate heat treatment. The choice of this raw material is motivated by the fact that
ceramics are significantly available in nature and in Algeria in particular. The area of Djebel
Debbagh, located in Guelma (with geographic coordinates (36° 31'52 N and 7° 16'03 E)) in the
east of Algeria, is among the richest zones in kaolinitic clay of different types [10-11]. The
majority of the catalysts used in photo-degradation are stable, non-toxic transition metal oxides
with high photosensitivity and high bandwidth [12-15]. Among the most commonly used oxides
* Coresponding author: [email protected]

272
are zinc oxide and copper oxide whose band gap energies are of 3.4 eV and 1.2 eV, respectively
[16-18]. Thus, they can be used in photo-degradation of organic compounds in aqueous medium
under UV irradiation [6, 19], and even under visible light [7, 20, 21]. However, they present
metastable phases which must be stabilized before any photocatalytic application. In addition, the
literature shows that oxides having large specific surfaces reveal better photocatalytic capacities.
For this, several deposition techniques are used to give a wide range of covered surfaces [22-23].
To achieve this objective, the sol-gel method [24-25] will be used in the synthesis of the thin films
deposited on the porous ceramic substrates indicated above. The advantage of depositing active
layers on porous substrates instead of directly using active nano-powders is that the latter can be
harmful and therefore require a delicate filtering step.
The doping effect of copper in ZnO thin films on their structural, morphological and
photocatalytic properties, as well as the effect of the presence of open porosity caused by the
addition of ZrO2 in the raw material of ceramic substrates, are studied in this work.
2. Experimental study
2.1 Materials
The primary material used in the production of the ceramic substrates is local clay of
Djebel Debbagh region (DD3). This raw material was chosen because of its availability in our
country, its ease of extraction and its good quality [10]. It consists mainly of SiO2 (51%), Al2O3
(47%) and 2% of other oxides. The zirconium oxide (ZrO2; 99.5% purity) added to these clays is
from Sigma-Aldrich.
For the preparation of the active layers, uses the following chemical compounds are used:
zinc acetate [(Zn(CH3COO)2 .2H2O); 99.5% purity], copper acetate [(Cu(CH3COO)2); 99.0%
purity], absolute ethanol [C2H5OH; 99.9% purity] and monoethanolamine [C2H7NO; 90.0% purity]
(MEA). The photocatalytic test was carried out on an aqueous solution of Orange II
(C16H11N2NaO4S; OII).
2.2 Preparation of substrates and thin films
After grinding and sieving, cylindrical pellets were prepared from 0.5g of clay DD3 or
0.31g of DD3 mixed to 0.19g of ZrO2 (38 wt % ZrO2) using a 13 mm matrix and a hydraulic press
(0.9 tons). These pellets are then treated at 1300°C for 2 hours in the abort to have thermal
transformations giving ceramics composed mainly of mullite-cristobalite or mullite-zircon. The
presence of zirconium oxide (ZrO2) leads to the formation of zircon (ZrSiO4) with a high rate of
open porosity after consumption of silica in the vitreous phase. It has been stated in a previous
work that the addition of 38 wt% ZrO2 to DD3 clay gives the highest rate of porosity (33%) on the
ceramics surface [9]. The two types of ceramics pellets obtained were used as substrates for thin
layer depositions. The active deposited layers are composed of ZnO (ZO) or Cu doped ZnO
(CZO). For these deposits, the dip coating sol-gel technique was followed [24].
The synthesis of ZnO is obtained from zinc acetate dihydrate of molar mass 219.49 g/mol
[26-27]. 3.51 g of the latter was dissolved in 40 ml of absolute ethanol to obtain a solution with a
molar concentration of 0.4 mol/l. For the Cu doping, 0.21g (corresponding to wt 6%) of copper
acetate (molar mass 181.63 g/mol) are added to the same solution prepared above. 2 ml of MEA
catalyst was added to each solution to stabilize it, and the resulting product was mixed with a
magnetic stirrer for 2 hours at a temperature of 60º.
2.3 Characterization techniques
The crystal structure of the samples was determined by X-ray diffraction (Bruker AXS-
D8) using a Cu K radiation (λ = 1.5406 Å). The surface morphology and the grains size were
visualized by an atomic force microscope (A100 model of APEResearch). A scanning electron
microscope (JSM-6301F) was used to explore the different regions of the samples and performing
an elemental chemical analysis using an energy-dispersive X-ray spectrometer (EDX- X-Max 20
mm2). The absorbance spectra of the OII solutions were measured by a UV-vis spectrophotometer
(V- 630, JASCO) in the wavelength range [250-650 nm].
273
2.4 Measurement of Photocatalytic Activity
The photocatalytic activity of the different samples was monitored by UV-visible
spectrophotometer using the absorbance mode. The ceramic substrates with or without active thin
layers are immersed in 25 ml of the OII dye solution (12.5 mg/l, pH = 7.86). So, they are in direct
contact with the latter. The obtained is placed in a black chamber, and a UV lamp (VL-4LC, 4W-
254 nm) is used to activate the reaction. The measurements of the absorbance spectra are carried
out every one hour on 2.2 ml of the solution using distilled water as a reference (the photocatalyst
remains in the reaction cell without interruption).
Based on the proportionality between the concentration and the absorbance of a solution
(Beer-Lambert law), the rate of degradation is calculated (from the maxima of absorbance spectra)
using the following relation [28-29]:
(%)100xraten Degradatio0
0
C
CC (1)
Where: C0 and C are the concentrations before and after illumination, respectively.
3. Results and discussion
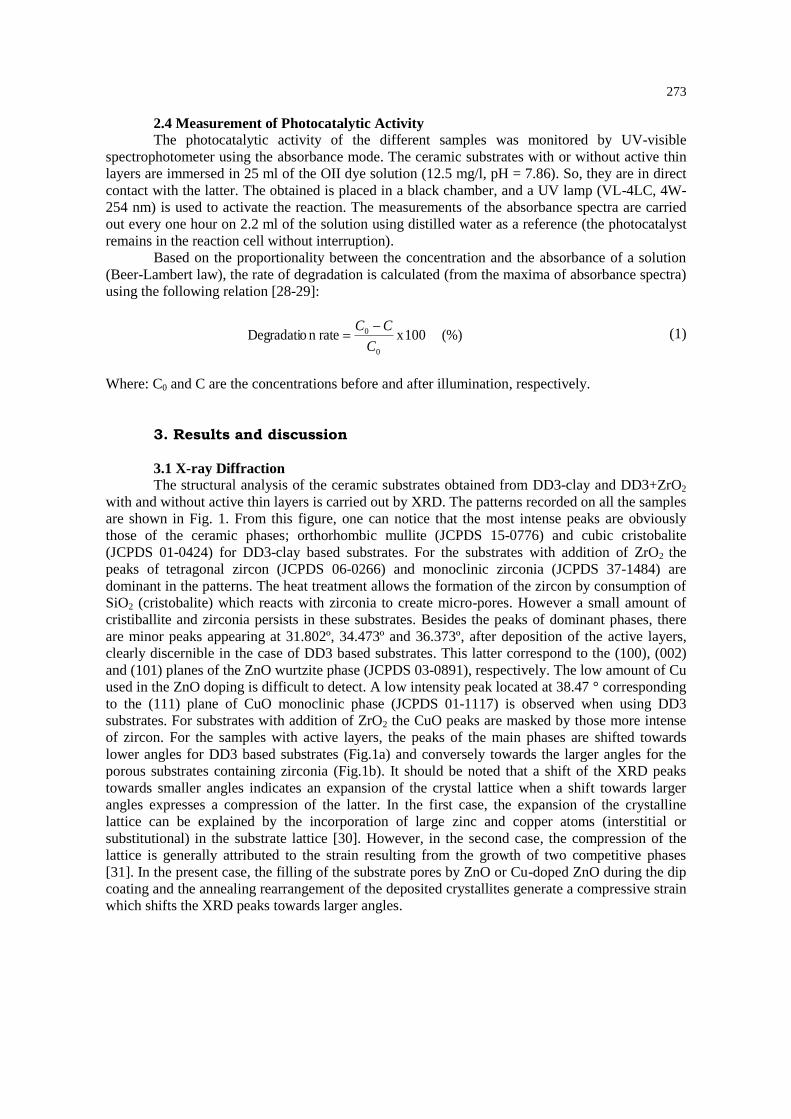
3.1 X-ray Diffraction
The structural analysis of the ceramic substrates obtained from DD3-clay and DD3+ZrO2
with and without active thin layers is carried out by XRD. The patterns recorded on all the samples
are shown in Fig. 1. From this figure, one can notice that the most intense peaks are obviously
those of the ceramic phases; orthorhombic mullite (JCPDS 15-0776) and cubic cristobalite
(JCPDS 01-0424) for DD3-clay based substrates. For the substrates with addition of ZrO2 the
peaks of tetragonal zircon (JCPDS 06-0266) and monoclinic zirconia (JCPDS 37-1484) are
dominant in the patterns. The heat treatment allows the formation of the zircon by consumption of
SiO2 (cristobalite) which reacts with zirconia to create micro-pores. However a small amount of
cristiballite and zirconia persists in these substrates. Besides the peaks of dominant phases, there
are minor peaks appearing at 31.802º, 34.473º and 36.373º, after deposition of the active layers,
clearly discernible in the case of DD3 based substrates. This latter correspond to the (100), (002)
and (101) planes of the ZnO wurtzite phase (JCPDS 03-0891), respectively. The low amount of Cu
used in the ZnO doping is difficult to detect. A low intensity peak located at 38.47 ° corresponding
to the (111) plane of CuO monoclinic phase (JCPDS 01-1117) is observed when using DD3
substrates. For substrates with addition of ZrO2 the CuO peaks are masked by those more intense
of zircon. For the samples with active layers, the peaks of the main phases are shifted towards
lower angles for DD3 based substrates (Fig.1a) and conversely towards the larger angles for the
porous substrates containing zirconia (Fig.1b). It should be noted that a shift of the XRD peaks
towards smaller angles indicates an expansion of the crystal lattice when a shift towards larger
angles expresses a compression of the latter. In the first case, the expansion of the crystalline
lattice can be explained by the incorporation of large zinc and copper atoms (interstitial or
substitutional) in the substrate lattice [30]. However, in the second case, the compression of the
lattice is generally attributed to the strain resulting from the growth of two competitive phases
[31]. In the present case, the filling of the substrate pores by ZnO or Cu-doped ZnO during the dip
coating and the annealing rearrangement of the deposited crystallites generate a compressive strain
which shifts the XRD peaks towards larger angles.

274
Fig. 1. XRD patterns of ZnO and Cu doped ZnO thin films deposited on different substrates.
ZrS: Zircon, Zr: Zirconia, C: Cristobalite, M: mullite, ZO: zinc oxide, CuO: copper oxide
3.2. Atomic Force Microscopy
The AFM technique makes it possible to visualize the surface of the prepared samples and
to analyze statistically the numerical data. That is, it is possible, among other things, to obtain the
value of the mean size of particles or pores. These values are calculated from AFM data using
adequate software (Gwyddion 2.34). The samples analyzed by AFM are based on ceramics pellets
with and without active thin films deposited by the sol-gel technique described above. First, the
AFM topography of the two types of ceramics substrates is shown in Fig. 2. This figure shows that
the distribution of the micropores in both pellets is non-uniform. However one can see clearly that
the incorporation of zirconia leads to a suitable increase of open porosity. The average pore
diameter can be determined statistically using Gwyddion software from the distribution shown in
Fig. 2. The obtained results indicate that the pores are more abundant and their mean diameter
increases from 2.57 μm to 3.93 μm when ZrO2 is added to the substrates. The effect of the zirconia
content on the open porosity of DD3 was detailed in a previous published work [9].
Fig. 2. AFM topography of the substrates a): DD3, b): DD3+ZrO2 and their corresponding
histograms used for calculating the average diameter of the pores
Fig. 3 shows the AFM topography of the substrates after coating with undoped and Cu
doped ZnO. It can be noticed that the surface structure of the prepared films consists of grains
extending upwards. These grains are managed by the growth directions of the ZnO (002)/(100)
15 20 25 30 35 40 45
(deg)
CZO/DD3
ZO/DD3
DD3
M
C
MM
M
ZO
M
ZO
M
C
ZO
Cu
O
M
M
MM
ZO
ZO ZO
(a)
Int. (
a.u
)
15 20 25 30 35 40 45
Int. (
a.u
)
ZrS
CZO/DD3+ZrO2
ZO/DD3+ZrO2
2deg)
DD3+ZrO2
M
Zr
C ZrZr
MM
Zr
ZrS M
Zr
M ZrS
ZO
M
ZrS
ZO
M
ZrS
MM
M
ZrS
ZO
ZO
(b)

275
planes previously mentioned in the XRD results (Fig. 1). This type of growth may lead to obtain
an inhomogeneous alignment of the grains in the thin layers.
For the samples with porous substrates (DD3+ZrO2), branched growth (flowers-like or
pins-like) appears from the pores. This type of growth, frequently observed in ZnO deposits [16],
makes it possible to increase the effective surface of the layers. This indicates that the micropores
have an important role in the process of crystallite growth when depositing the active layers by dip
coating. The grain sizes of all the samples are reported in Table 1.
Table. 1. Grain size of all samples calculated from AFM data
Substrates DD3 DD3+ZrO2
Samples DD3 ZO-DD3 CZO-DD3 DD3+ZrO2 ZO-DD3 +ZrO2 CZO-DD3 +ZrO2
Grain size (nm) 281 41 77 610 46 67
For DD3 substrates, the grain size decrease drastically from 281 nm to 41 nm if ZnO is
deposited and 77 nm for Cu doped ZnO layer. The same behavior is noticed on DD3+ZrO2: the
grain size decreases from 610 nm to 46 nm for ZnO coating and 67 nm when ZnO is Cu doped.
This decrease of the grain size can be linked to the filling of the surface open porosity by the
particles of the deposited phases during the dip coating. It can also be related to the homogeneity
of the deposited layer itself. It should be noticed that the porosity in the substrate favors the
incorporation of more active materials for better photocatalytic efficiency.
Fig. 3: AFM topography of undoped and Cu-doped ZnO thin films deposited on
DD3 and DD3+ZrO2 substrates, respectively. (a, c): ZnO, (b, d): Cu doped ZnO films
3.3. Scanning Electron Microscopy (SEM)
To confirm the results obtained previously by AFM (3.2) we carried out morphological
analyzes by scanning electron microscopy (SEM). Fig. 4 displays the SEM images of Cu doped
ZnO thin films grown on the DD3 and DD3+ZrO2 substrates. These images confirm the
morphology differences between the two types of substrates. The grains of the substrates
containing ZrO2 are larger with a rounded shape and the micropores appear clearly on all parts of
the surface. Unlike this, on the DD3 substrates the grains are smaller without significant porosity
on the surface.
After depositing the active layer, the difference between the two surfaces is more
pronounced. For the DD3 substrate the grains are fine and the surface is less rough, whereas for

276
the substrate with ZrO2 the flower-like growth dominates and the roughness is more important,
offering a wider active surface area.
Fig. 4. SEM images of DD3 (a, b) and DD3+ZrO2, (c, d) Cu doped ZnO.
To analyze the roughness from the SEM setting (Fig. 4) an appropriate approach based on
the Hurst height–height correlations was used. This technique is presented here briefly but a
complete explanation of the method may be found elsewhere [32]. The height-height correlation
function H(r) as a function of the position r, is expressed as follows [33]:
))(exp(12)( 22
rrH (2)
The Hurst exponent (α), the mean surface roughness (σ) and the correlation length (ξ), are
determined from the plots of Fig. 5 and are summarized in table 2.
Fig. 5. Height–height correlation functions for Cu doped ZnO thin films deposited on DD3
and DD3+ZrO2 substrates
0 50 100 150 200 250
r (nm)
H (
µm
)2
A
DD3+ZrO2
CZO/DD3+ZrO2
0 50 100 150 200 250
0,0
0,1
0,2
0,3
0,4
0,5
0,6
0,7
0,8
0,9
1,0
E
DD3
CZO/DD3
r (nm)
H (
µm
)2

277
Table. 2. Calculated surface roughness, correlation length and Hurst parameter
of ZnO:Cu thin films deposited on the different substrates
Substrates DD3 DD3+ZrO2
Samples DD3 CZO/DD3 DD3+ZrO2 CZO/DD3 +ZrO2
[nm] 164.7 187.4 150.8 213.3
[nm] 39.7 42.4 69.9 68.2
0.63 0.61 0.56 0.54
Even if the mean surface roughness is comparable for the two substrates (DD3 and
DD3+ZrO2) with 164.7 nm and 150.8 nm respectively, the decrease of the Hurst exponent (from
0.63 to 0.56) obtained when adding ZrO2, indicates a greater roughness at smaller scale, certainly
linked to the micropores. After the deposition of the active layer of ZnO:Cu, the difference in
roughness is more remarkable; 187.4 nm for DD3 substrates vs 213.3 nm for the substrate with
ZrO2. The correlation length which represents the typical distance between two similar features
is greater for the sample with ZrO2 addition. This is related to the larger grain size observed for
this type of sample in accordance with AFM results. When the active film is deposited, the Hurst
exponent decreases for two types of substrates (0.61 nm for DD3 and 0.54 when ZrO2 is added).
This indicates that the flower-like growth of the active layers is present in the two samples but it is
more pronounced when ZrO2 is added which gives a higher roughness and therefore a wider active
surface area. The addition of ZrO2 to the DD3 clays produces a microporosity which favors the
incorporation of the active materials into the substrates, allowing a flower-like growth offering a
wider active surface area beneficial to the photocatalysis.
3.4. Energy Dispersive X-ray Spectrometry The chemical composition of the different samples was examined by EDX analysis. The
atomic percentages of the main elements present (O, Al, Si, Zr, Zn and Cu) were deduced from the
EDX spectra. Several spectra were recorded on different areas of the samples to confirm the
homogeneity of the treatments applied to the various substrates. The average percentages of the
main chemical elements are listed in Table 3. It should be noted that the incident electron beam
used in EDX explores the deposited layer and a part of the substrate according to the deposited
thickness. Based on this principle, it can be deduced that the obtained chemical compositions of
the different samples corresponds well to the percentages of chemical elements introduced during
the preparation (see 2.1 and 2.2). The proportions of the most present elements representing the
substrate (Si, Al and Zr) are comparable, whereas those corresponding to the thin layer (Zn and
Cu) are much lower. Copper was detected in very low percentages. Nevertheless this confirms the
doping of the ZnO active layers by copper.
Table. 3. Quantitative analysis of the EDX spectra
Substrates DD3 DD3+ZrO2
Samples
Elements DD3 ZO-DD3 CZO-DD3 DD3+ZrO2 ZO-DD3 +ZrO2
CZO-DD3
+ZrO2
O (at. %) 72.79 79.14 79. 56 74.02 70.89 69.33
Al (at. %) 13.82 10.41 10.09 10.01 9.97 10.86
Si (at. %) 13.39 9.99 9.39 9.52 8.98 9.76
Zr (at. %) - - - 6.45 8.13 7.96
Zn (at. %) - 0.46 0.86 - 2.03 1.96
Cu (at. %) - - 0.11 - - 0.13
To highlight the important effect of the micropores on the deposition mechanism of the
active layers, EDX spectra recorded on the ZnO:Cu thin film deposited on a porous substrate

278
(DD3+ZrO2) inside and outside the pores were compared (see Fig. 6). It appears that zinc and
copper are more detected inside the pores (Table 4). The percentage of Zn outside the pores is 0.61
while Cu is not detected. Inside the pores the proportion of Zn increases to 3.32% and Cu reaches
0.26%.This means that the amount of material deposited by dip coating inside the micropores is
greater because of the capillarity effect. Therefore, when the microporosity increases the amount
of active materials deposited by dip coating is greater, which allows better photocatalytic activity.
Fig.6. EDX spectra of ZnO:Cu deposited on porous DD3+ZrO2 substrate.
(a) Area inside the pores, (b) area outside the pores
Table 4. Effect of the substrate porosity on the thin films chemical composition
Sample O (%) Al (%) Si (%) Zr (%) Zn (%) Cu (%)
CZO/D D3+ZrO2
Inside the pore 68.79 15.45 10.12 2.06 3.32 0.26
Outside the
pore 69.87 10.27 9.41 9.64 0.61 -
3.5. Photocatalytic Performance
In order to know the scalability of the practical applications for the prepared samples, the
effect of the ceramic substrates (DD3, DD3+ZrO2) with and without active thin layers of ZnO and
Cu doped ZnO were tested in the purification of a solution consisting of distilled water
intentionally contaminated by OII (see 2.3.4). This study is carried out by analyzing the
degradation of OII, obtained from the absorbance spectra evolution shown in Fig. 7. These spectra
are typical of those of aqueous solutions of OII, with a maximum absorbance at 484 nm as
reported in the literature [5, 6]. Fig.8 shows how the degradation rate of orange II (defined in
2.3.4) varies as a function of the time exposition to UV. For DD3-based substrates, it is noted that
the absorption spectra do not change substantially (Fig.7- a, b, c) and the degradation rate does not
exceed 10% regardless of the exposure time, even using active layers (Fig. 8-a). The same
behavior is observed for porous substrates based on DD3 and ZrO2 before deposition of the active
layers (Fig.7-d). When ZnO is deposited on the latter substrates, the photocatalytic effect appears
clearly (Fig.7- e). A linear variation of degradation rate as a function of exposure time is observed
without apparent saturation (Fig. 8-b). After 6 hours of UV exposure, 60.19% degradation of OII
was obtained. For the same substrates, if the ZnO thin films are doped with wt 6% Cu (see Fig.7-
f), the degradation rate increases to 77.76% for the same exposure time (Fig. 8-b). The linear
appearance of the curves (Fig 8-b) indicates that the photocatalytic activity of the latter samples
remains constant even after high exposure time. From the above, one can note that the DD3 and
ZrO2 based substrates coated with active layers of Cu doped ZnO have a great effect on the
degradation of OII, which allows the development of photocatalysts from a natural and neutral
local material.

279
Fig. 7. Absorbance spectra showing the effect of active layers of ZnO and Cu doped,
deposited on ceramics substrates, on the degradation of Orange II
Fig. 8. Degradation rate of Orange II versus UV exposure time for coated
and none coated ceramics substrates
Photocatalysis is based on the creation of electron-hole (e-/h
+)
pairs resulting in the
generation of (•OH, •O
2 ) radicals that degrade orange II. The substrates composed of wide band
gap materials (6.6 eV for SiO2 [34], 7.4 eV for Al2O3 [35], 6.5 eV for ZrSiO4 [36]) do not allow
band-to-band passage with the UV photons used in this work (254 nm, 4.8 eV). However, the
small remaining amount of zirconium oxide (3.6 eV [37]) can absorb the UV radiation and create
small amounts of e-/h
+ [38]. The deposition of the active layers based on low-gap materials (ZnO:
3.4eV, CuO: 1.2eV) increased the number of generated electrons implicated in the reduction of O2
to •O
2 , which gives the white color of solution [39, 40]. Sheini et al. demonstrate that the
photocatalysis process is significantly improved after copper doping of ZnO. They claim that Cu
allows playing a supporting role for zinc oxide by giving a largest number of electrons and
(e) R
1h
2h
3h
4h
5h
6h
ZO/ DD3+ ZrO2
250 300 350 400 450 500 550 600 6500,0
0,1
0,2
0,3
0,4
0,5
0,6
0,7
R
1h
2h
3h
4h
5h
6h
CZO/ DD3 (c)
0,0
0,1
0,2
0,3
0,4
0,5
0,6
0,7
(a)
R
1h
2h
3h
4h
5h
6h
DD3(d)
R
1h
2h
3h
4h
5h
6h
DD3+ ZrO2
250 300 350 400 450 500 550 600 650
(f)
Wavelenght (nm)
R
1h
2h
3h
4h
5h
6h
CZO/ DD3+ ZrO2
0,0
0,1
0,2
0,3
0,4
0,5
0,6
0,7
Ab
sorb
an
ce (
a.u
)
ZO/ DD3 R
1h
2h
3h
4h
5h
6h
(b)
0 1 2 3 4 5 6
(b)
Exposure time (Houres)
CZO/ DD3+ ZrO2
ZO/ DD3+ ZrO2
DD3+ ZrO2
0 1 2 3 4 5 60
10
20
30
40
50
60
70
80
90
100
CZO/ DD3
ZO/ DD3
DD3
Degrad
ati
on
rate
(%
)
(a)
280
therefore a greater potential to create more •O
2 radicals [41]. On the other hand, the generated
holes interact with H2O and OH- to create a larger number of •OH which is the main oxidant
leading to degradation of the dye in solution [40]. However, for weakly porous substrates, the
amount of active materials and the active surface area are insufficient, which gives a low
photocatalytic activity (less than 10% degradation). Finally, the deposition of the active layers of
ZnO and Cu-doped ZnO on the highly porous substrates based on DD3 and ZrO2 gives an
important photocatalytic effect by using active materials in greater quantity on a larger active
surface, making it possible to obtain a great degradation rate. The efficiency of the photocatalytic
process is therefore related to the porosity of the ceramic substrates as well as to ZnO, copper and
ZrO2 which play complementary roles in the generation of e-/h
+ pairs.
4. Conclusions
Thin active films of ZnO and Cu-doped ZnO were deposited by sol-gel method on ceramic
substrates based on DD3 with and without addition of ZrO2. The analysis of their topographies by
AFM and SEM shows that the substrates with addition of ZrO2 are more porous, have larger grains
and higher roughness. After depositing the active materials, which penetrate into the pores, the
grain size decreases but a flower-like growth increases the surface roughness offering a wider
active area.
The photocatalytic effect is appreciable only in the case of porous substrates based on
DD3 and ZrO2 coated with active layers. After deposition of ZnO on this type of substrate, the
photo-degradation rate is 60.19% after 6 hours of UV exposure, while under the same conditions it
reaches 77.76% for Cu-doped ZnO. The linear curves representing the degradation evolution as a
function of the exposure time indicates that the photocatalytic activity remains constant without
saturation. These results would allow the development of effective photocatalysts from natural and
neutral local materials.
Acknowledgment
This work has been supported by the Laboratory of Active Components and Materials
(LACM) of Larbi Ben M’hidi University - Oum El Bouaghi, Algeria and the laboratory of
Moltech-Anjou-Lunam, Angers University, France.
References
[1] S. Sakthivel, M.C. Hidalgo, D.W. Bahnemann, S.-U. Geissen, V. Murugesan, A. Vogelpohl,
Appl. Catal. B: Environ. 63, 31 (2006).
[2] D.W. Bahnemann, S.N. Kholuiskaya, R. Dillert, A.I. Kulak, A.I. Kokorin, Appl. Catal. B:
Environ. 36, 161 (2002).
[3] B. Neppolian, S. Sakthivel, M. Palanichamy, B. Arabindoo, V. Murugesan, Stud. Surf. Sci.
Catal. 113, 329 (1998).
[4] B. Neppolian, Q. Wang, H. Jung, H. Choi, V. Murugesan, Ultrason. Sonochem.
15, 649 (2008).
[5] R.D. Combes, R.B. Haveland-Smith, Mutation Research/Reviews in Genetic Toxicology
98, 101 (1982).
[6] J. Marto, P. São Marcos, T. Trindade, J.A. Labrincha, J. Hazard. Mater. 163, 36 (2009).
[7] E. Rego, J. Marto, P. S. Marcos, J.A. Labrincha, J. Appl. Catal. A: Gen. 355, 109 (2009).
[8] M. P. Seabra, R. R. Pires, J. A. Labrincha, Chem. Eng. J. 171, 692 (2011).
[9] A. Mecif, J. Soro, A. Harabi, J. P. Bonnet, J. Am. Ceram.Soc. 93(5), 1306 (2010).
[10] M. Kolli, M. Hamidouche, G. Fantozzi, J.Chevalier, Ceram.Inter. J. 33, 1435 (2007).
[11] A. Harabi, M. Heraiz, S. Achour, Br. Ceram. Proc. 60, 81 (1999).

281
[12] B. Neppolian, H.C. Choi, S. Sakthivel, B. Arabindoo, V. Murugesan, Chemosphere
46, 1173 (2002).
[13] D.W. Bahnemann, “Mechanisms of organic transformations on semiconductor particles, in: E.
Pelizzetti, M. Schiavello (Eds.), Photochemical Conversion and Storage of Solar Energy,”
Kluwer Academic Publishers, The Netherlands, 251–276 (1991).
[14] K.I. Okamoto, Y. Yamamoto, H. Tanaka, M. Tanaka, Bull. Chem. Soc. J. 58, 2015 (1985).
[15] A. Sharma, P. Rao, R.P. Mathur, S.C. Ametha J. Photochem. Photobiol. A. 86, 197 (1995).
[16] J. Huang, Y. Dai, C. Gu, Y. Sun, J. Liu, J. Alloys Comp. 575, 115 (2013).
[17] R. K. Sharma, R. Ghose, Ceram. Int. 40, 10919 (2014).
[18] S. Pukird, W. Song, S. Noothongkaew, S. K. Kim, B. K. Min, S. J. Kim, K. W. Kim,
S. Myung, K. S. An, Appl. Surf. Sci. 351, 546 (2015).
[19] B. Neppolian, H.C. Choi, S. Sakthivel, B. Arabindoo, V. Murugesan, J. Hazard. Mater.
B 89, 303 (2002).
[20] K.G. Kanade, B.B. Kale, J. O Baeg, S. M. Lee, C. W. Lee, S. J. Moon, H. Chang, Mater.
Chem. Phys. 102, 98 (2007).
[21] B. Dindar, S. Ic¸ li, J. Photochem. Photobiol. A 140, 263 (2001).
[22] T. Saidani, M. Zaabat, M.S. Aida, B. Boudine, Superlattices and Microstructures
88, 315 (2015).
[23] F. Bondioli, R. Taurino, A.M. FerrariJ. Colloid Interface Sci. 334, 195 (2009).
[24] S. Kim, H. Yoon, D. Y. Kim, S.O Kim, J. Y. Leem, J. Opt. Mater. 35, 2418 (2013).
[25] Y. Chen, D.D. Dionysiou, Appl. Catal. B- Environ. 62, 255 (2006).
[26] Q. A. Drmosh, S. G. Rao, Z. H. Yamani, M. A. Gondal, Appl. Surf. Sci. 270, 104 (2013).
[27] C. Oh Kim, S. Kim, H. T. Oh, Suk-Ho Choi, Y. Shon, S. Lee, H. N. Hwang, Chan-Cuk
Hwang, Physica B 405, 4678(2010).
[28] C. Wu, Appl. Surf. Sci. 319, 237 (2014).
[29] J. Ma, K. Wang, L. Li, T. Zhang, Y. Kong, S. Komarneni, Ceram. Int. 41, 2050 (2015).
[30] B. Shao, J. H. Qiu, K. J. Zhu, Y. Cao, H. L. Ji, J. Alloys Compd. 515, 128 (2012).
[31] A. Reyes-Rojasa, H. Esparza-Poncea, S.D. De la Torreb, E. Torres-Moyea, Materials
Chemistry and Physics 114, 756 (2009).
[32] Y. Zhao, C.C. Wang, T.M. Lu, “Characterization of Amorphousand Crystalline Rough
Surface: Principles and Applications,” (Academic Press, Elsevier, USA, 2001).
[33] N. Rahmani, R. S. Dariani, American Institute of Physics 5, 077112 (2015).
[34] M. Ribeiro, Jr, L. R. C. Fonseca, Physical Review B 79, 241312 (R) (2009).
[35] A. Maréchal, , M. Aoukar, C. Vallée, C. Rivière, D. Eon, J. Pernot, E. Gheeraert,
Appl. Phys. Lett. 107, 141601 (2015).
[36] R. Dutta, N. Mandal, Materials Chemistry and Physics 135, 322 (2012).
[37] J. Li, S. Meng, J. Niu, H. Lu, J. Adv. Ceram., ISSN 2226-4108 (2017).,
[38] S. Kumar, A. K. Ojha, J. Alloys . Compd. 644, 654 (2015).
[39] M.M. Ibrahim, J. Spectrochim. Acta Part A: Mol. Biomol. Spec. 145, 487 (2015).
[40] J. Ma, K. Wang, L. Li, T. Zhang, Y. Kong, S. Komarneni, Ceram. Int. 41, 2050 (2015).
[41] F. J. Sheini, J. Singh, O.N. Srivasatva, D. S. Joag, M. A. More, Appl. Surf. Sci.
256, 2110 (2010).


![Investigation of Photocatalytic Degradation of Methyl Orange by Using Nano-Sized ZnO … · 2017-08-28 · photo-degradation mechanism of ZnO being similar to that of TiO2 [3,14]](https://img.dokumen.tips/doc/110x75/5fb8941e7016c6512e43ed5b/investigation-of-photocatalytic-degradation-of-methyl-orange-by-using-nano-sized.jpg)