Embed Size (px)
Citation preview
Photoacoustic Spectroscopy (PAS) Technology Overview
Introduction:The unique aspect of PAS technology, direct detection oflight absorption by the sample, allows quick andnondestructive measurement of absorbance spectrawithout sample preparation or contact, and alsoadvanced measurements such as depth probing to reveallayered or gradient composition.
The basics of how PAS works and some of its applicationsare discussed in this overview.
1
Topics• Early History, pages 3-4.
• Direct measurement of Absorbance, page 5.
• The FTIR Connection, pages 6-7.
• PAS Signal Generation, pages 8-11.
• PAS Sampling Depth and Applications, pages 12-20.
• Spectral Subtraction of Depth Varying Spectra, pages 21-22.
• Phase Analysis with Depth Analysis Applications, pages 22-30.
• Chemometric Analysis of Photoacoustic Spectra
• Process Study Applications
• Reference Samples for PAS, page 56.
• Wood Chemistry, pages 31-36. • Polymer Chemistry, pages 37-39.
• Aging of Composites, pages 40-47. • Wood to Biochar Conversion, pages 48-55.
2
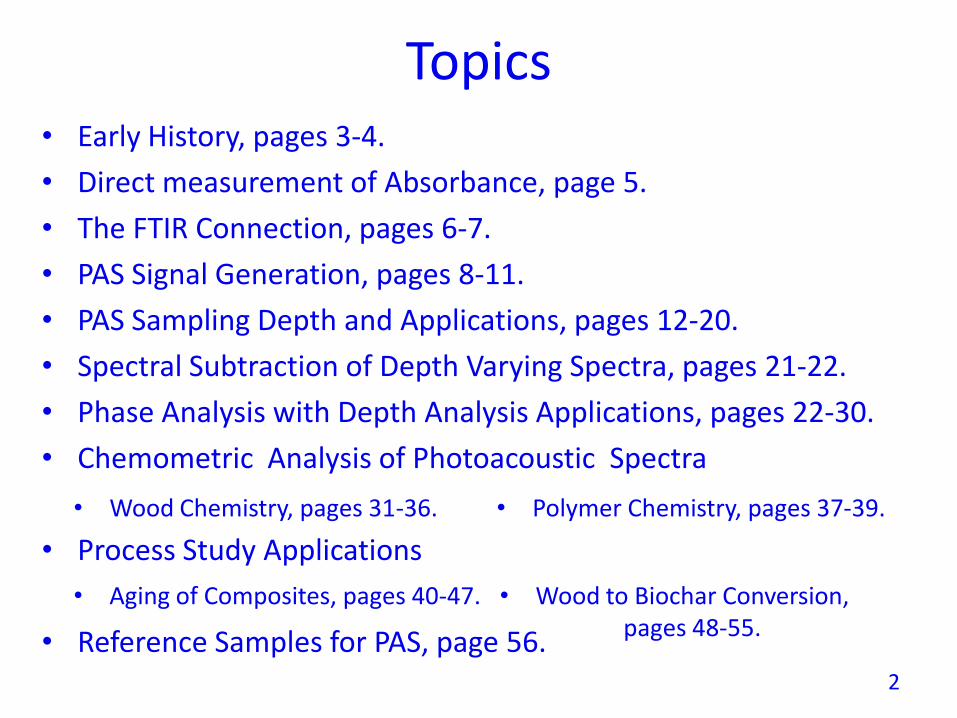
AG Bell’s Spectrophonefrom 1881 marks the beginning of photoacoustic spectroscopy
from A. G. Bell, Philosophical
Magazine, 1881, Ser. 5, 11, 510-528.
3
Bell also sponsored Michelson’s development of the
interferometer that lead to FTIR spectrometers which have
played a crucial role in PAS.
Heidelberg, Baden, Germany
April 17th, 1881
My dear Mr. Bell,
The experiments concerning the relative motion of the earth with respect to the ether have just been
brought to a successful termination. The result was however negative. . . .
At this season of the year the supposed motion of the solar system coincides approximately with the
motion of the earth around the sun, so that the effect to be observed was at its maximum, and accordingly if the
ether were at rest, the motion of the earth through it should produce a displacement of the interference fringes, of
at least one tenth the distance between the fringes; a quantity easily measurable. The actual displacement was
about one one hundredth, and this, assignable to the errors of experiment.
Thus the question is solved in the negative, showing that the ether in the vicinity of the earth is moving
with the earth; a result in direct variance with the generally received theory of aberration. . . .
N.B. Thanks for your pamphlet on the photophone,
Very truly yours,
Albert A. Michelson
Master, U.S. Navy
4
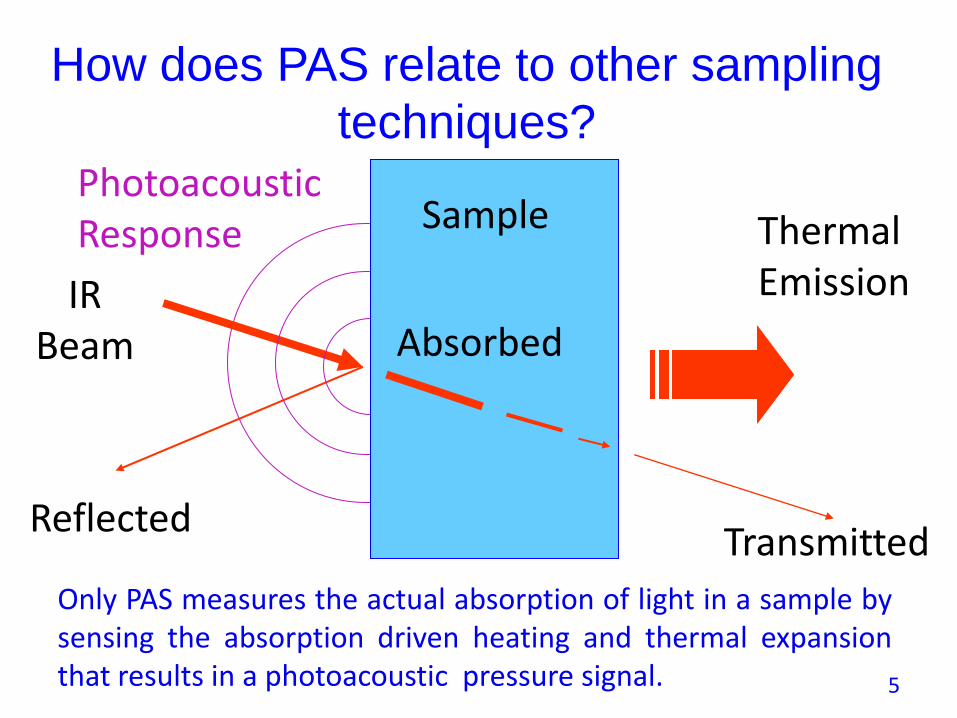
How does PAS relate to other sampling
techniques?
Thermal Emission
Sample
IRBeam
PhotoacousticResponse
ReflectedTransmitted
Absorbed
Only PAS measures the actual absorption of light in a sample bysensing the absorption driven heating and thermal expansionthat results in a photoacoustic pressure signal. 5
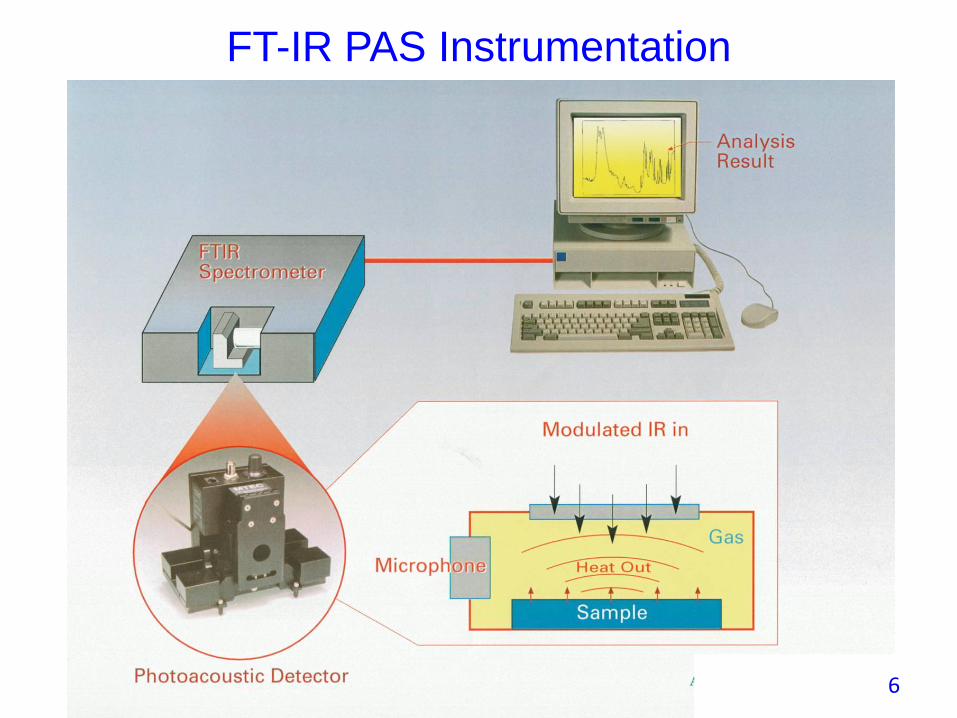
FT-IR PAS Instrumentation
6
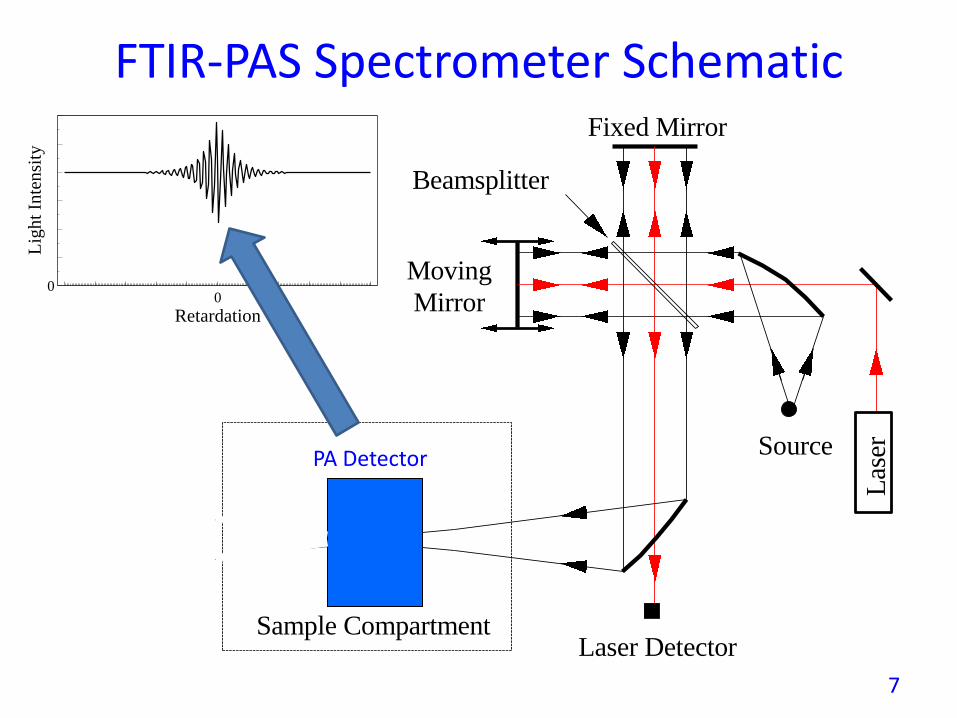
FTIR-PAS Spectrometer SchematicFixed Mirror
Source
Beamsplitter
Sample Compartment
Detector
Laser Detector
Las
er
Moving
Mirror
Infrared
00
Retardation
Lig
ht
Inte
nsi
ty
PA Detector
7
PAS Signal Generation
Heat Out
Mic
rop
ho
ne
Sample
L1/
Modulated Infrared In
Gas
= absorption coefficient L = thermal diffusion length
Sound Waves
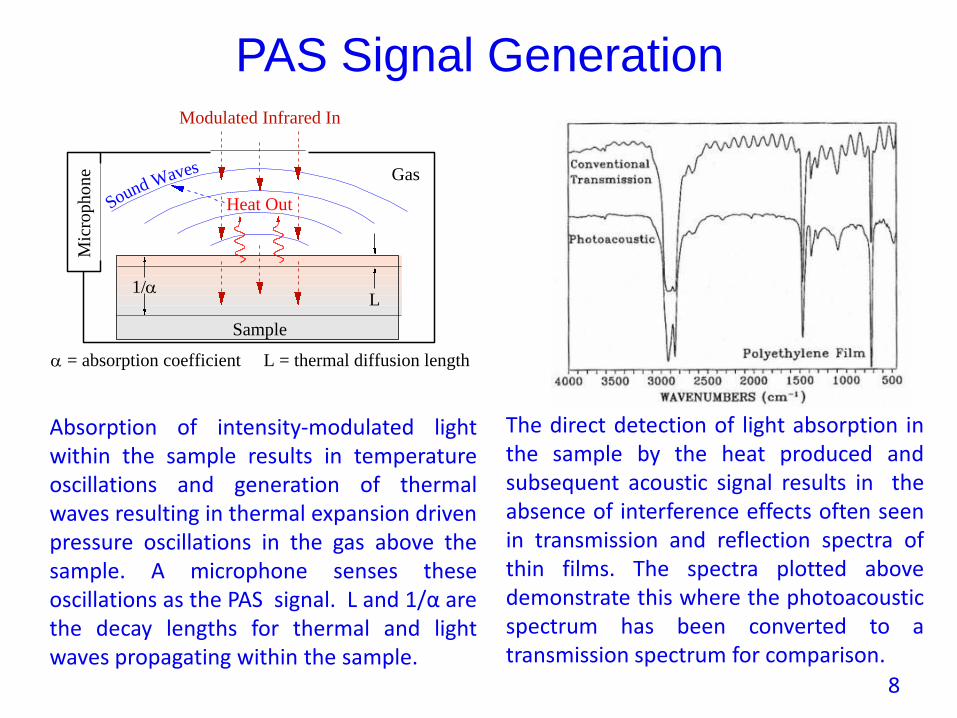
Absorption of intensity-modulated lightwithin the sample results in temperatureoscillations and generation of thermalwaves resulting in thermal expansion drivenpressure oscillations in the gas above thesample. A microphone senses theseoscillations as the PAS signal. L and 1/α arethe decay lengths for thermal and lightwaves propagating within the sample.
The direct detection of light absorption inthe sample by the heat produced andsubsequent acoustic signal results in theabsence of interference effects often seenin transmission and reflection spectra ofthin films. The spectra plotted abovedemonstrate this where the photoacousticspectrum has been converted to atransmission spectrum for comparison.
8
Thermal Only
Thermal and Acoustic
Thermal and Acoustic
with Background
Full
Saturation
Onset of
Saturation
0.0001 0.001 0.01 0.1 1 10 100
1E-8
1E-7
1E-6
1E-5
1E-4
1E-3
Absorption Coefficient (1/cm)
Thousands
Signal Magnitude
Absorption Coefficient (cm )-1
1000001000010001001010.1
Sig
nal
Mag
nit
ud
e
(lo
gar
ith
mic
sca
le)
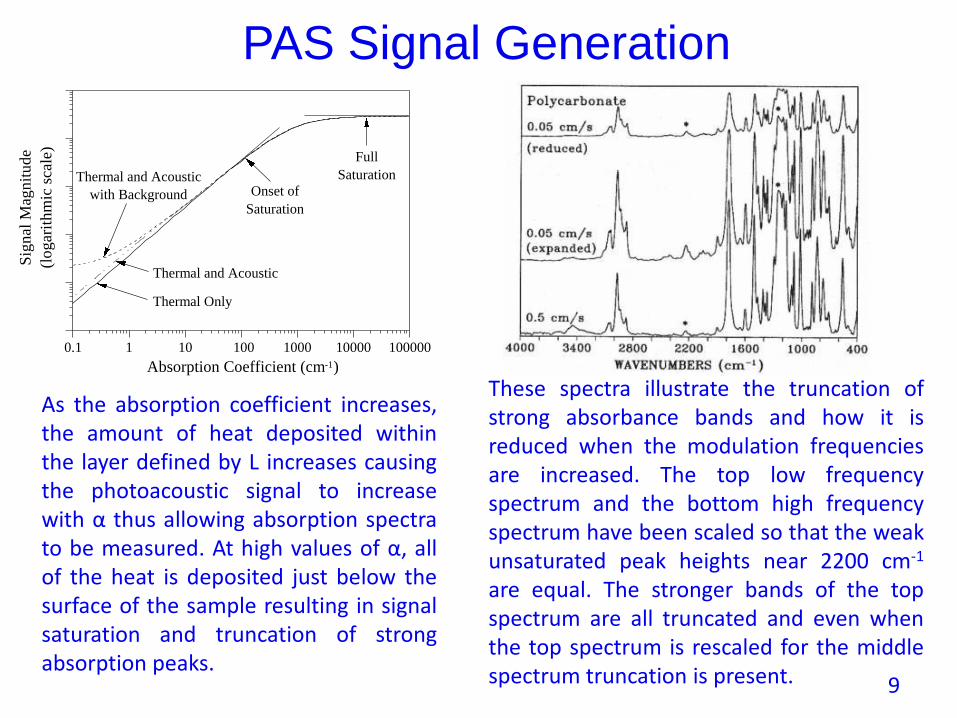
As the absorption coefficient increases,the amount of heat deposited withinthe layer defined by L increases causingthe photoacoustic signal to increasewith α thus allowing absorption spectrato be measured. At high values of α, allof the heat is deposited just below thesurface of the sample resulting in signalsaturation and truncation of strongabsorption peaks.
PAS Signal Generation
These spectra illustrate the truncation ofstrong absorbance bands and how it isreduced when the modulation frequenciesare increased. The top low frequencyspectrum and the bottom high frequencyspectrum have been scaled so that the weakunsaturated peak heights near 2200 cm-1
are equal. The stronger bands of the topspectrum are all truncated and even whenthe top spectrum is rescaled for the middlespectrum truncation is present. 9
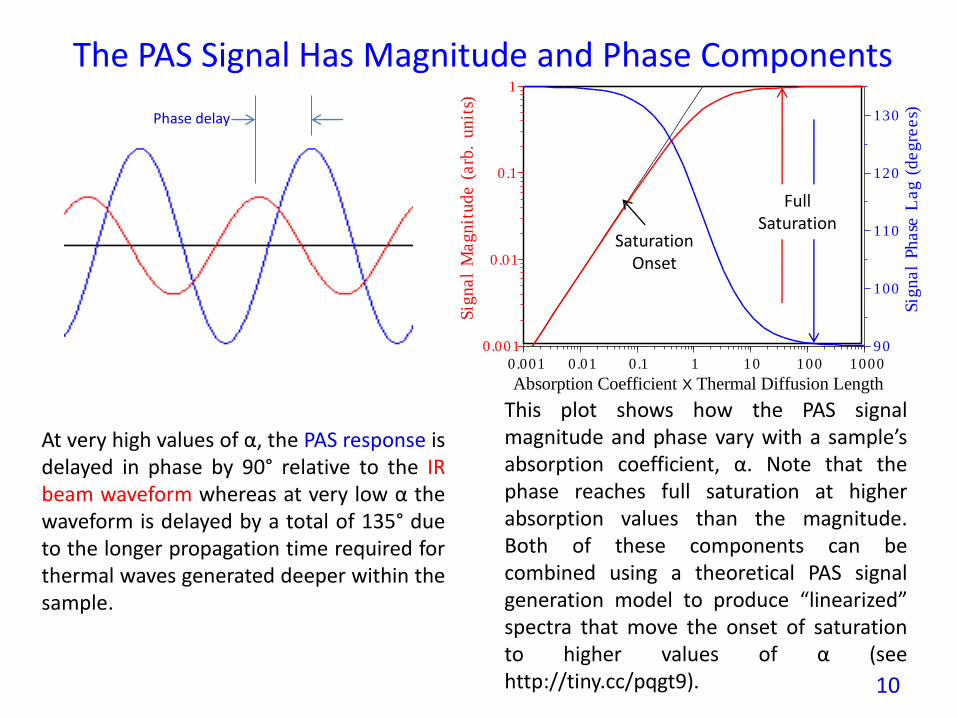
At very high values of α, the PAS response isdelayed in phase by 90° relative to the IRbeam waveform whereas at very low α thewaveform is delayed by a total of 135° dueto the longer propagation time required forthermal waves generated deeper within thesample.
The PAS Signal Has Magnitude and Phase Components
0.001 0.01 0.1 1 10 100 1000
0.001
0.01
0.1
1
Sig
na
l M
ag
nit
ud
e (
arb
. u
nit
s)
90
100
110
120
130
Sig
na
l P
ha
se L
ag
(d
eg
ree
s)
Absorption Coefficient X Thermal Diffusion Length
SaturationOnset
This plot shows how the PAS signalmagnitude and phase vary with a sample’sabsorption coefficient, α. Note that thephase reaches full saturation at higherabsorption values than the magnitude.Both of these components can becombined using a theoretical PAS signalgeneration model to produce “linearized”spectra that move the onset of saturationto higher values of α (seehttp://tiny.cc/pqgt9).
FullSaturation
10
Phase delay
Photoacoustic Signal Linearization
Sample Thermal Diffusivity = 0.001 cm2/s
(lo
gar
ith
mic
sca
le)
Sig
nal
Mag
nit
ud
e
1 10 100 1000 10 4 10 5 10 6
Absorption Coefficient (cm )-1
Linearized
Non-Linearized
Full Saturation
Linearization Range
10 Hz
100 Hz
10000 Hz
1000 Hz
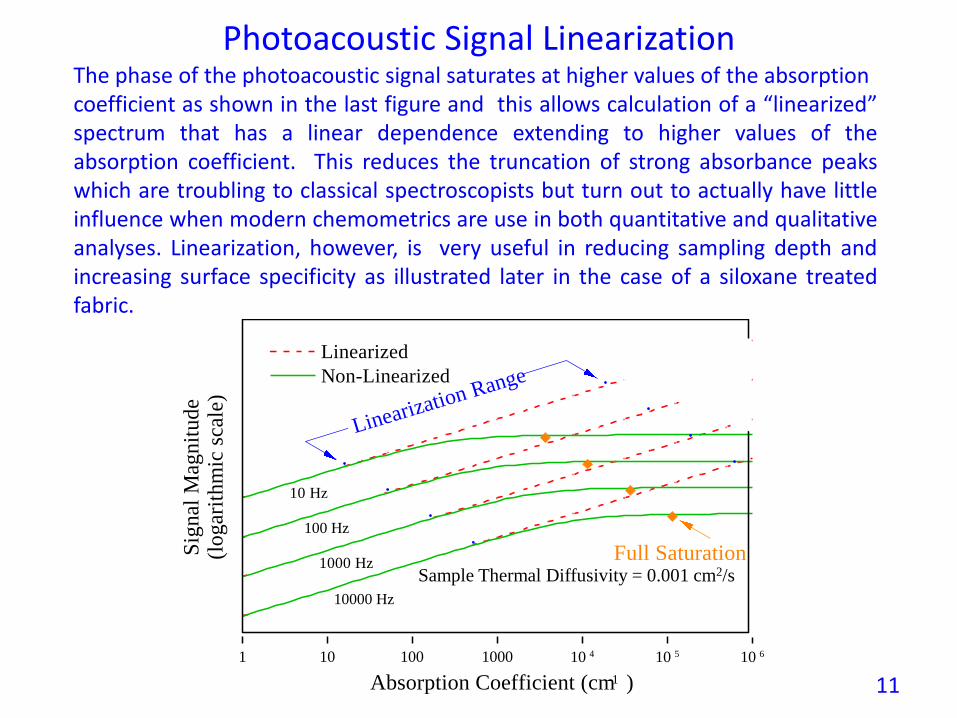
The phase of the photoacoustic signal saturates at higher values of the absorptioncoefficient as shown in the last figure and this allows calculation of a “linearized”spectrum that has a linear dependence extending to higher values of theabsorption coefficient. This reduces the truncation of strong absorbance peakswhich are troubling to classical spectroscopists but turn out to actually have littleinfluence when modern chemometrics are use in both quantitative and qualitativeanalyses. Linearization, however, is very useful in reducing sampling depth andincreasing surface specificity as illustrated later in the case of a siloxane treatedfabric.
11
PAS Sampling Depth
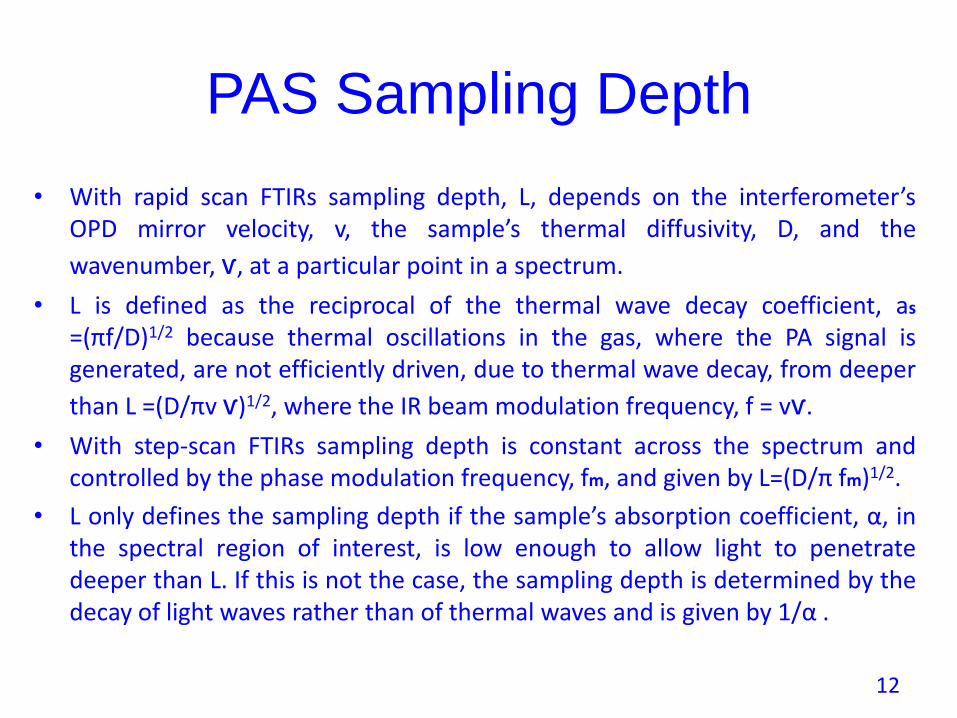
• With rapid scan FTIRs sampling depth, L, depends on the interferometer’sOPD mirror velocity, v, the sample’s thermal diffusivity, D, and the
wavenumber, ѵ, at a particular point in a spectrum.
• L is defined as the reciprocal of the thermal wave decay coefficient, as=(πf/D)1/2 because thermal oscillations in the gas, where the PA signal isgenerated, are not efficiently driven, due to thermal wave decay, from deeper
than L =(D/πv ѵ)1/2, where the IR beam modulation frequency, f = vѵ.
• With step-scan FTIRs sampling depth is constant across the spectrum andcontrolled by the phase modulation frequency, fm, and given by L=(D/π fm)1/2.
• L only defines the sampling depth if the sample’s absorption coefficient, α, inthe spectral region of interest, is low enough to allow light to penetratedeeper than L. If this is not the case, the sampling depth is determined by thedecay of light waves rather than of thermal waves and is given by 1/α .
12
0.1 3001 10 100
0.001
25
0.01
0.1
1
10
Re
tard
ati
on
Ve
loc
ity
(c
m/s
)
15.8
400000
25
50
100
200
400
800
2500
5000
10000
20000
40000
80000
200000
La
ser-
Fri
ng
e F
req
ue
nc
y (
Hz
)
Thermal Diffusion Length (µm)
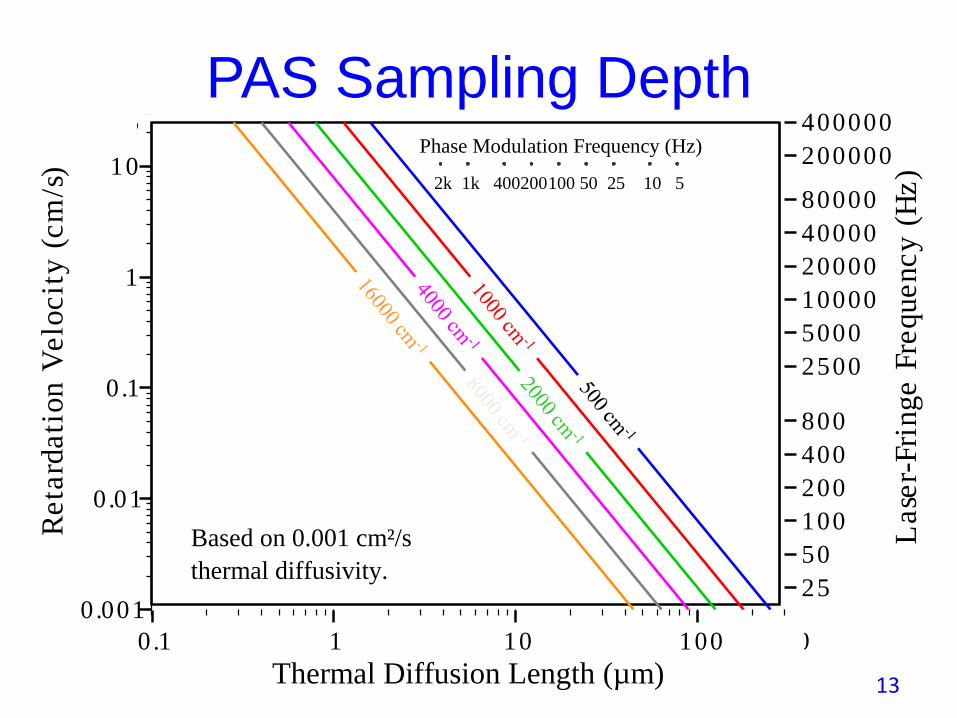
Based on 0.001 cm²/s
thermal diffusivity.
Phase Modulation Frequency (Hz)
400200100 50 25 10 51k2k
PAS Sampling Depth
13
An example of the importance PAS sampling
depth in the case of a 0.57 mm thick
polypropylene sample
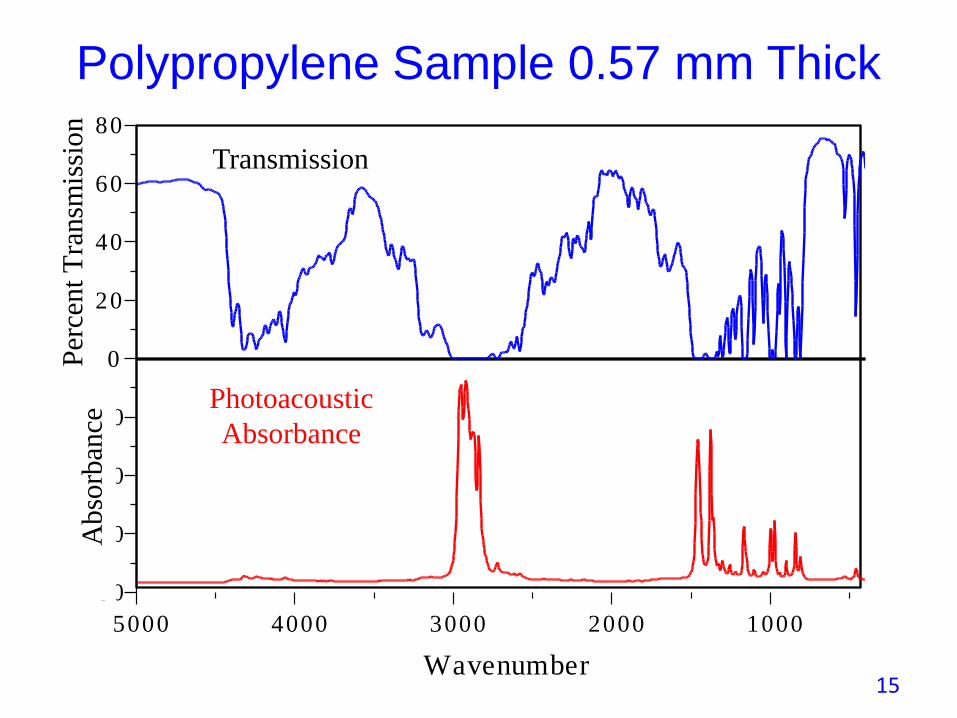
• A 0.57 mm sample is too thick for a transmission measurement.
• PAS samples a thickness less than the sample’s physical thickness and produces excellent spectra without sample preparation.
• This is the a key advantage of PAS over transmission spectroscopy.
14
Polypropylene Sample 0.57 mm Thick
Transmission
Photoacoustic
Absorbance
10002000300040005000
Wavenumber
-80
-60
-40
-20
0
20
40
60
80
Abso
rban
ceP
erce
nt
Tra
nsm
issi
on
15
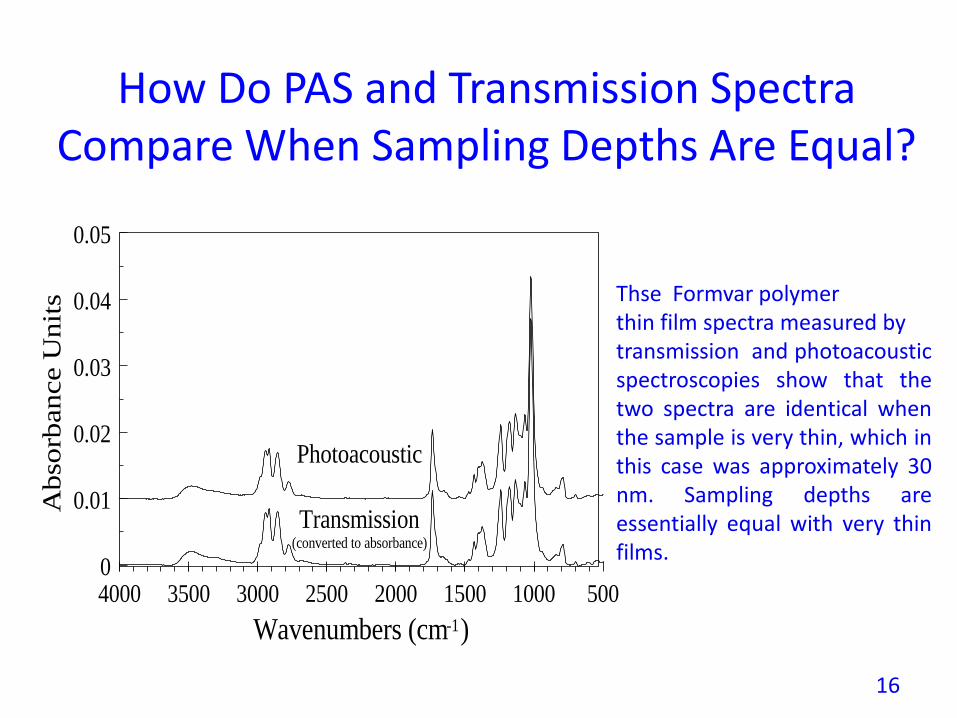
How Do PAS and Transmission Spectra Compare When Sampling Depths Are Equal?Photoacoustic versus Transmission Acquisition
Formvar Membrane (approximately 50 nm)
50010001500200025003000350040000
0.01
0.02
0.03
0.04
0.05
Wavenumbers (cm )
Abso
rbance U
nit
s
Photoacoustic
Transmission(converted to absorbance)
-1
Thse Formvar polymerthin film spectra measured bytransmission and photoacousticspectroscopies show that thetwo spectra are identical whenthe sample is very thin, which inthis case was approximately 30nm. Sampling depths areessentially equal with very thinfilms.
16
Varying Sampling Depth
to Observe Surface Layers
• Example of surface treatment of a fabric with Siloxane.
• At what concentration does a layer form on the fabric surface?
• Varying the sampling depth of the PAS spectra allows the layer and its depth variation to be observed.
• Note how linearization enhances surface specificity.
17
750800850900950
Wavenumber
Pho
toac
oust
ic S
igna
l 40 kHz Linearized
40 kHz
5 kHz
400 Hz
2%
2%
2%
2%
0%
0%
0%
0%
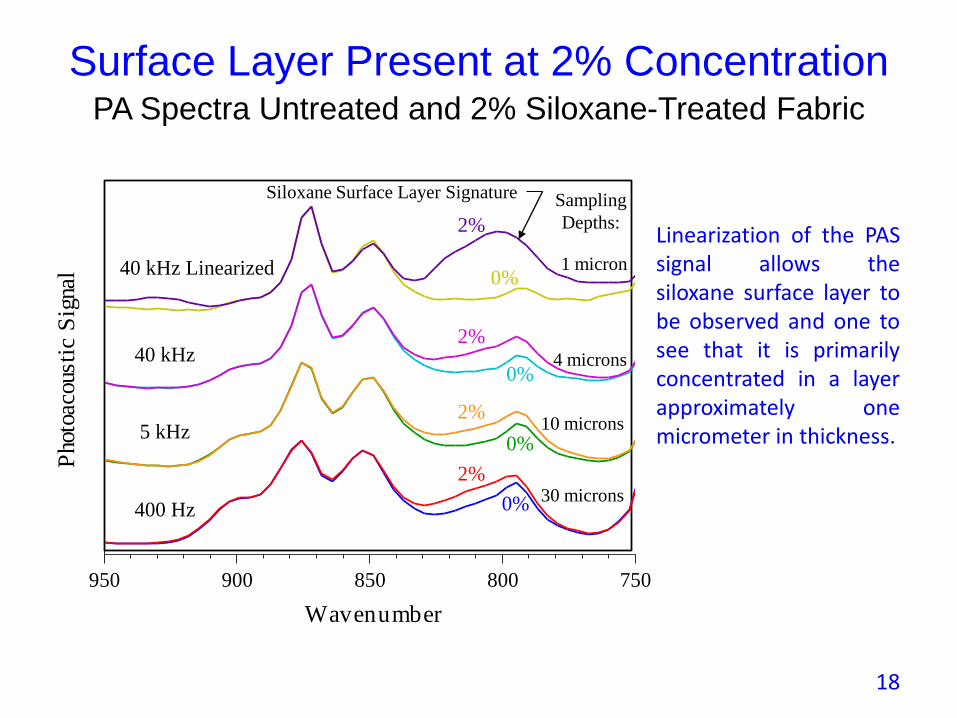
Surface Layer Present at 2% ConcentrationPA Spectra Untreated and 2% Siloxane-Treated Fabric
Sampling
Depths:
1 micron
4 microns
10 microns
30 microns
Siloxane Surface Layer Signature
Linearization of the PASsignal allows thesiloxane surface layer tobe observed and one tosee that it is primarilyconcentrated in a layerapproximately onemicrometer in thickness.
18
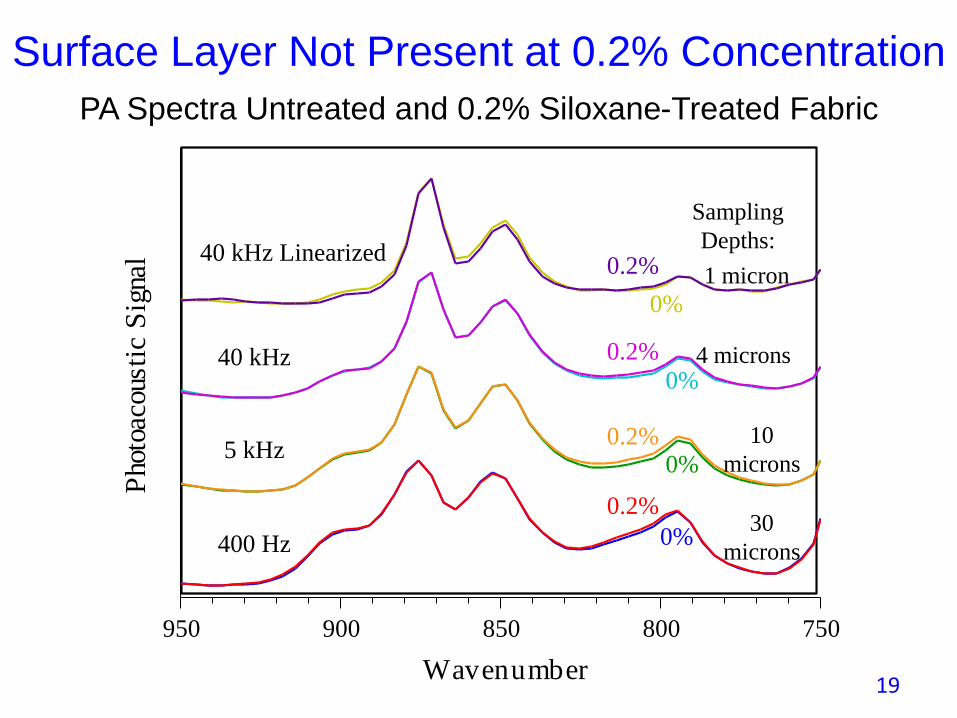
Surface Layer Not Present at 0.2% Concentration
750800850900950
Wavenumber
Pho
toac
oust
ic S
igna
l 40 kHz Linearized
40 kHz
5 kHz
400 Hz
0.2%
0.2%
0.2%
0.2%
0%
0%
0%
0%
PA Spectra Untreated and 0.2% Siloxane-Treated Fabric
1 micron
Sampling
Depths:
4 microns
10
microns
30
microns
19
Polyethylene Pellets with a Surface Additive
500100015002000250030003500
Wavenumber
Linearized
Standard
Surface segregatingadditive peak
20
Bulk additivepeak
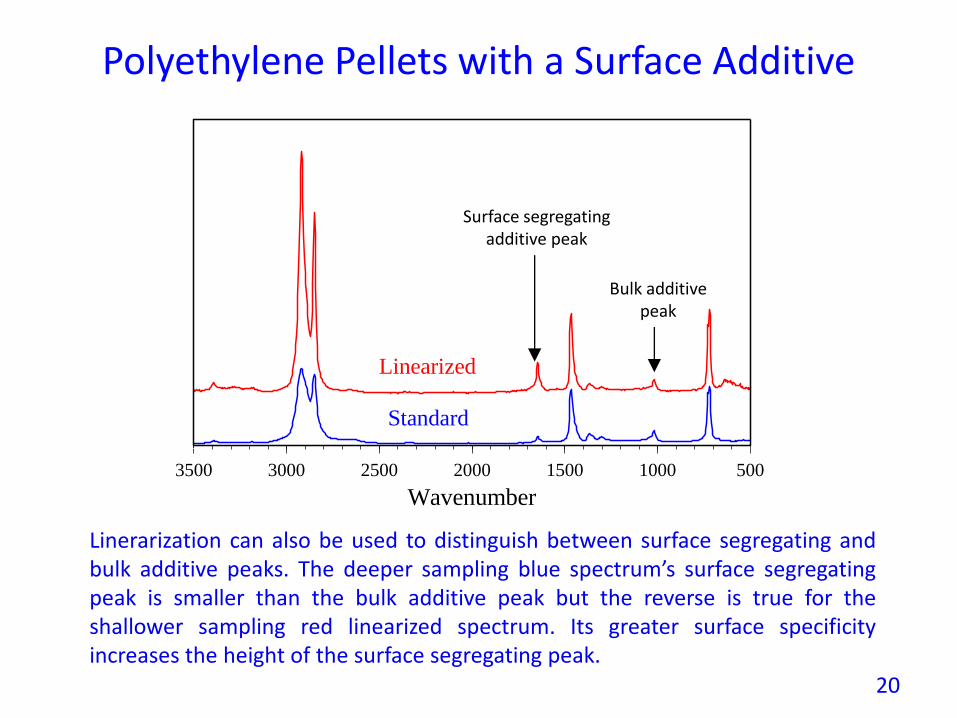
Linerarization can also be used to distinguish between surface segregating andbulk additive peaks. The deeper sampling blue spectrum’s surface segregatingpeak is smaller than the bulk additive peak but the reverse is true for theshallower sampling red linearized spectrum. Its greater surface specificityincreases the height of the surface segregating peak.
Spectral Subtraction of Depth Varying Spectra
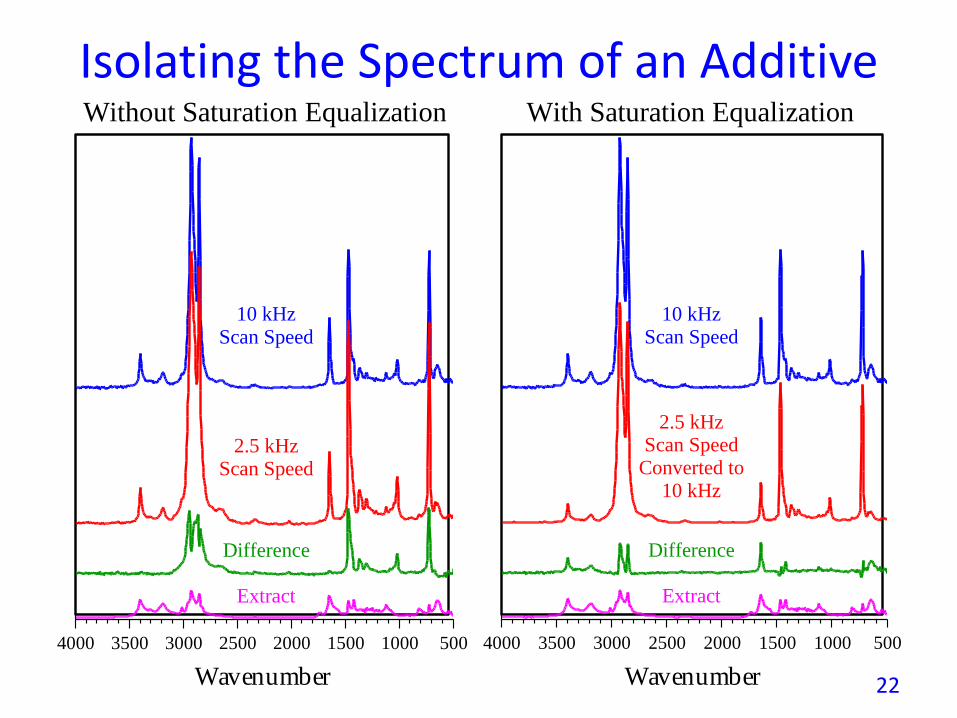
• Spectra of thin surface layers of samples can be obtained byspectral subtraction of a deeper (lower mirror velocity) from ashallower (higher mirror velocity) spectrum.
• Before subtracting, however, it is necessary to mathematicallyreduce the degree of saturation in the low frequencyspectrum so that is equal to that in the higher frequencyspectrum (see: http://tinyurl.com/3vm7plo).
• The next figure illustrates how the spectrum of a surfacesegregating polymer additive on polyethylene pellets can beisolated by this method. Note that the saturation equalizationdifference spectrum agrees well with the extracted surfaceadditive spectrum while the bulk additive peak near 1000cm-1 appears in neither the extract nor the differencespectrum plotted above.
21
Isolating the Spectrum of an Additive
5001000150020002500300035004000
Wavenumber
Without Saturation Equalization
5001000150020002500300035004000
Wavenumber
With Saturation Equalization
10 kHzScan Speed
2.5 kHzScan Speed
Difference
Extract
10 kHzScan Speed
2.5 kHzScan Speed
Converted to10 kHz
Difference
Extract
22
Phase Analysis
23
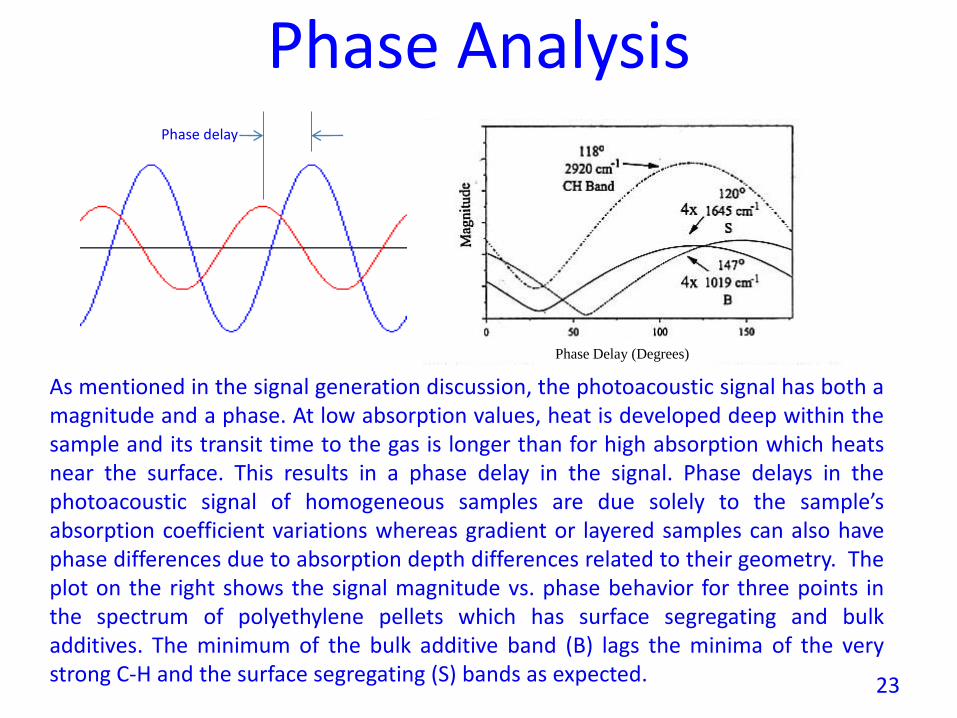
As mentioned in the signal generation discussion, the photoacoustic signal has both amagnitude and a phase. At low absorption values, heat is developed deep within thesample and its transit time to the gas is longer than for high absorption which heatsnear the surface. This results in a phase delay in the signal. Phase delays in thephotoacoustic signal of homogeneous samples are due solely to the sample’sabsorption coefficient variations whereas gradient or layered samples can also havephase differences due to absorption depth differences related to their geometry. Theplot on the right shows the signal magnitude vs. phase behavior for three points inthe spectrum of polyethylene pellets which has surface segregating and bulkadditives. The minimum of the bulk additive band (B) lags the minima of the verystrong C-H and the surface segregating (S) bands as expected.
Phase delay
Phase Delay (Degrees)
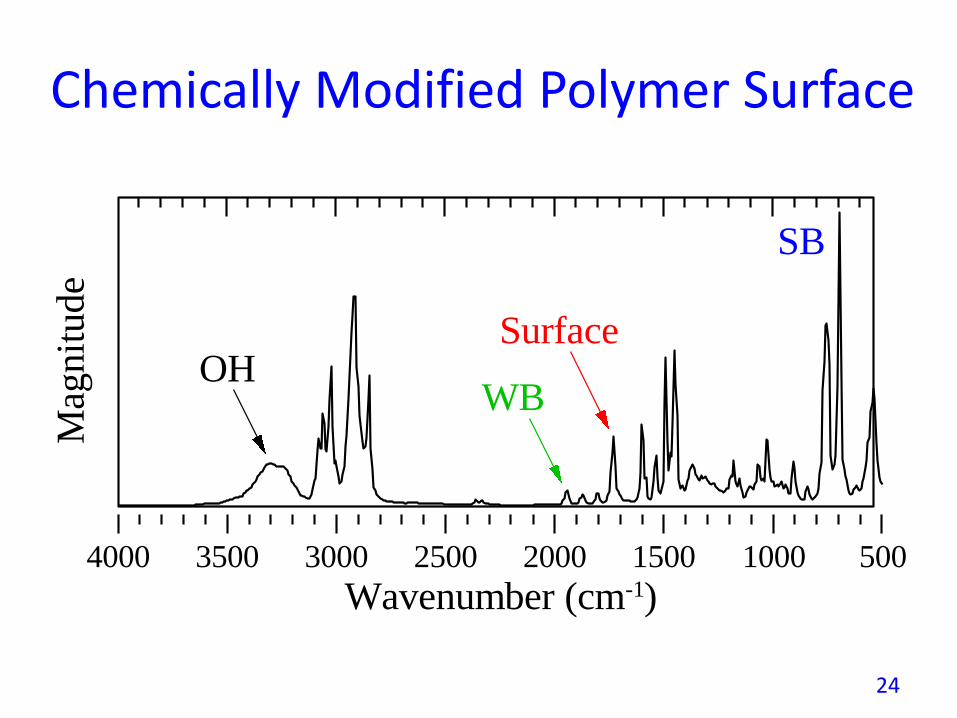
Chemically Modified Polymer Surface
Wavenumber (cm )-1
50020003000 2500 15003500 10004000
SB
Surface
WBOH
Mag
nit
ude
24
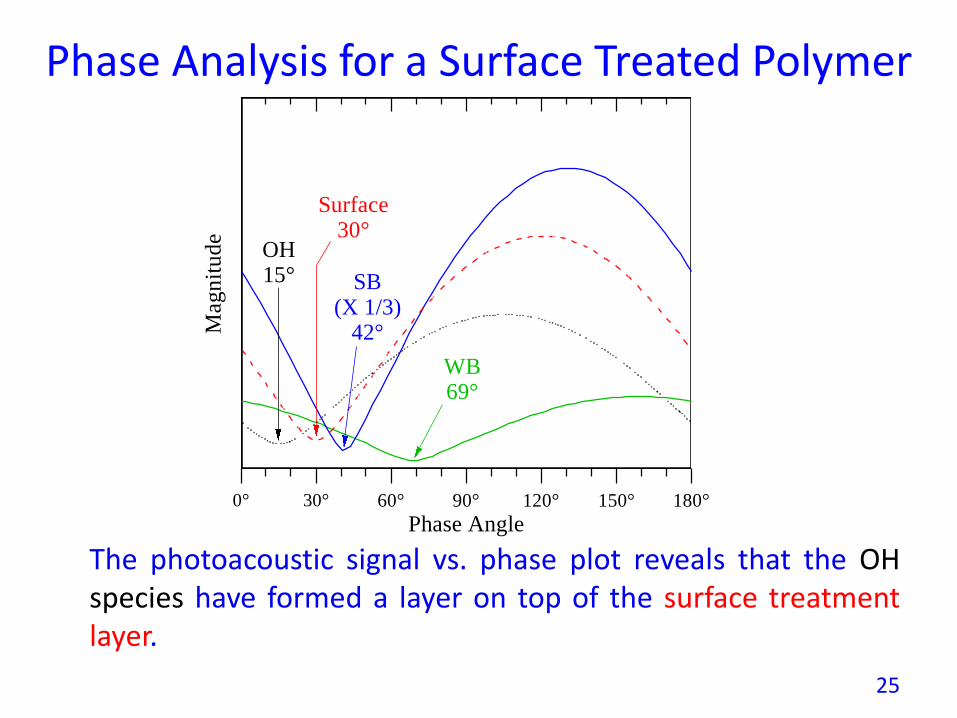
Phase Analysis for a Surface Treated Polymer
Phase Angle0° 30° 60° 90° 120° 150° 180°
Mag
nit
ud
e
SB(X 1/3)
42°
Surface30°
OH15°
WB69°
25
The photoacoustic signal vs. phase plot reveals that the OHspecies have formed a layer on top of the surface treatmentlayer.
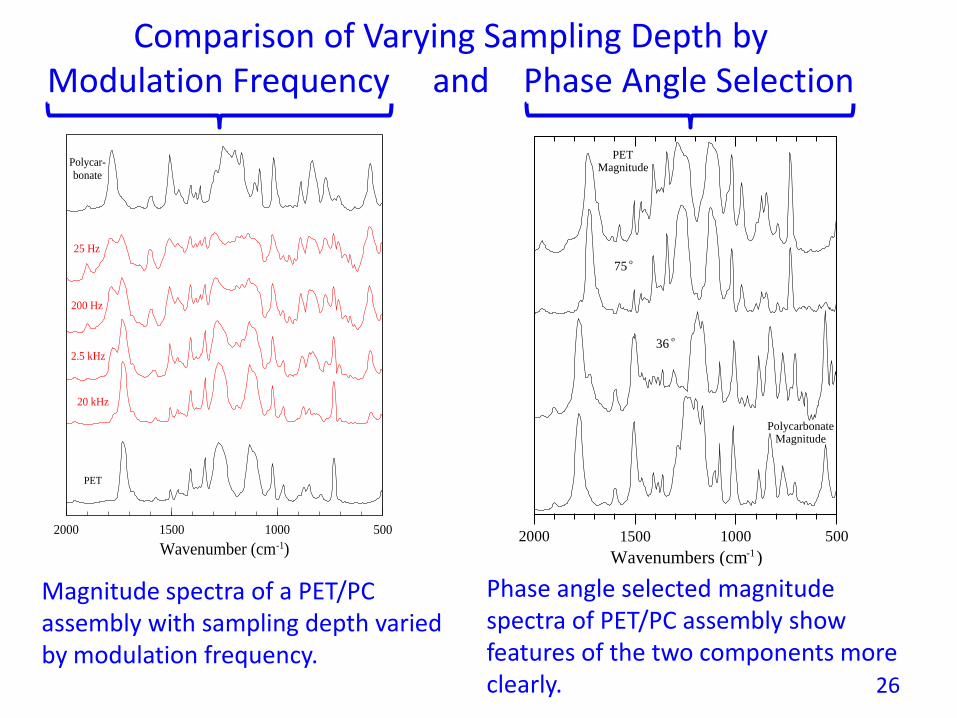
Phase angle selected magnitude spectra of PET/PC assembly show features of the two components more clearly.
2000 1500 1000 500
Wavenumbers (cm )-1
PETMagnitude
PolycarbonateMagnitude
36o
75o
26
Magnitude spectra of a PET/PC assembly with sampling depth varied by modulation frequency.
5001000150020000
1,000
2,000
3,000
Wavenumber (cm )
Polycar-bonate
25 Hz
200 Hz
2.5 kHz
20 kHz
PET
-1
Comparison of Varying Sampling Depth by Modulation Frequency and Phase Angle Selection
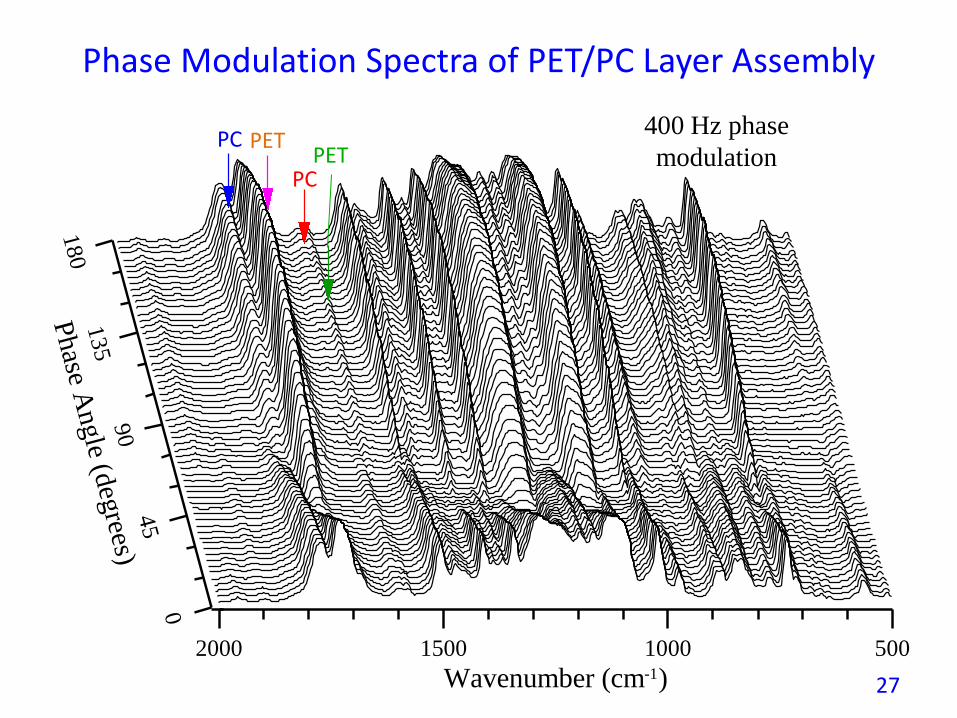
Phase Modulation Spectra of PET/PC Layer Assembly
180
135
90
45
0
Phase A
ngle (d
egrees)
2000 1500 1000 500
Wavenumber (cm )-1
400 Hz phase
modulation
27
PC PET
PCPET
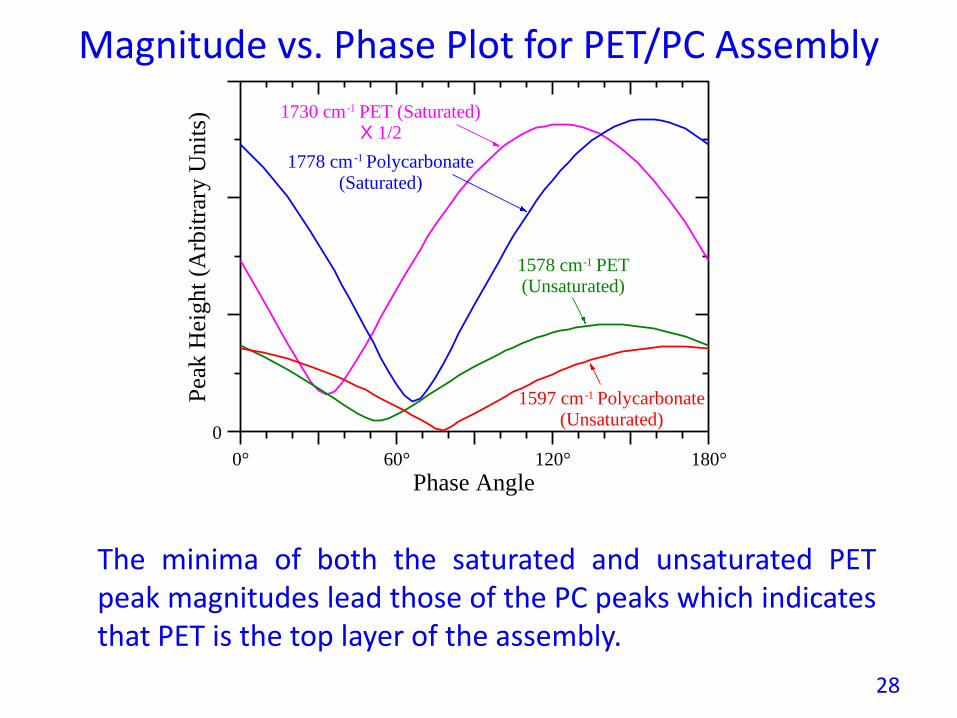
Magnitude vs. Phase Plot for PET/PC Assembly
0° 60° 120° 180°
Phase Angle
Pea
k H
eig
ht
(Arb
itra
ry U
nit
s)
0
1597 cm Polycarbonate(Unsaturated)
-1
1578 cm PET(Unsaturated)
-1
1778 cm Polycarbonate(Saturated)
-1
1730 cm PET (Saturated)X 1/2
-1
28
The minima of both the saturated and unsaturated PETpeak magnitudes lead those of the PC peaks which indicatesthat PET is the top layer of the assembly.
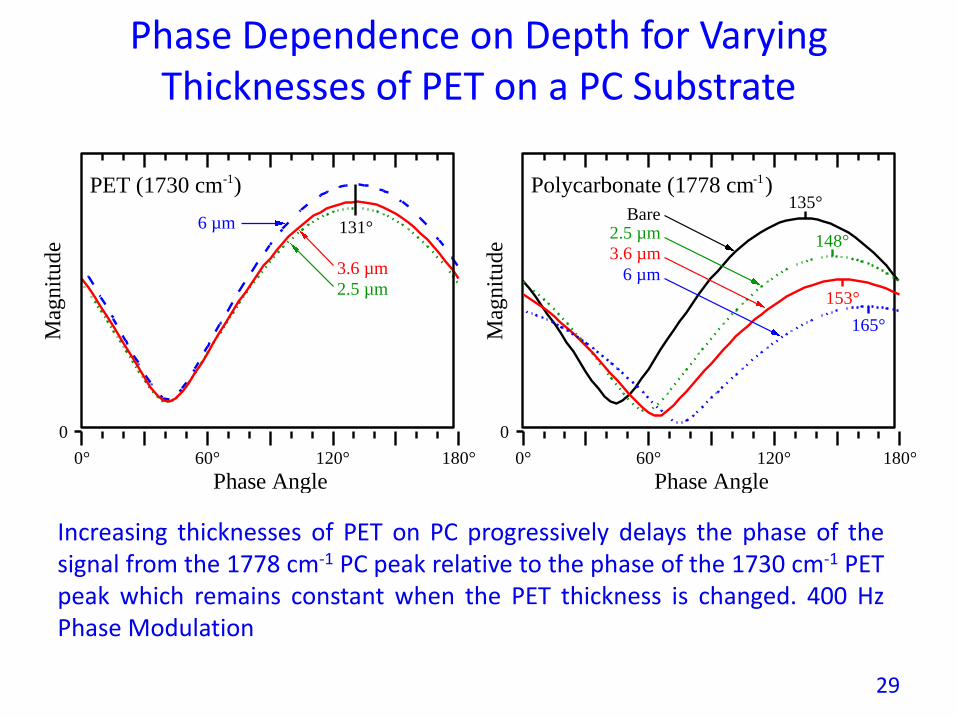
Phase Dependence on Depth for Varying Thicknesses of PET on a PC Substrate
Increasing thicknesses of PET on PC progressively delays the phase of thesignal from the 1778 cm-1 PC peak relative to the phase of the 1730 cm-1 PETpeak which remains constant when the PET thickness is changed. 400 HzPhase Modulation
2.5 µm
3.6 µm
6 µm
0
Mag
nit
ude
131°
PET (1730 cm )
0
148°
153°
165°
135°
Phase Angle180°120°60°0°
Polycarbonate (1778 cm )
Bare2.5 µm
3.6 µm
6 µm
Phase Angle180°120°60°0°
-1-1
Mag
nit
ude
29
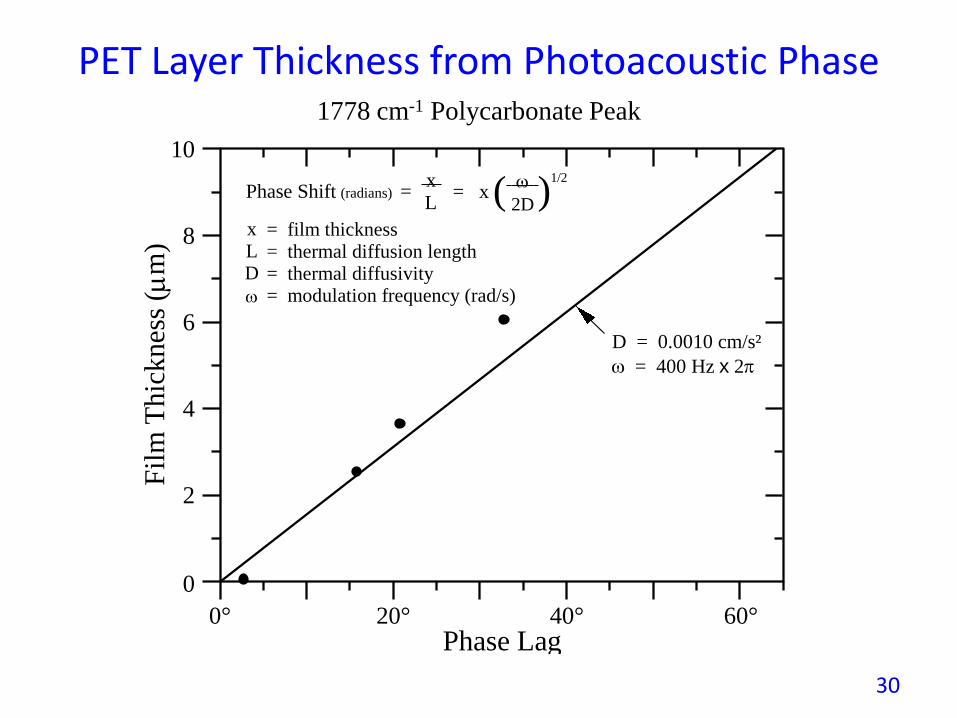
PET Layer Thickness from Photoacoustic Phase
D = 0.0010 cm/s²
= 400 Hz x 2
0
2
4
6
8
10
Phase Lag
Fil
m T
hic
knes
s (
m)
60°40°20°0°
( )Phase Shift (radians) =
2D
1/2 x L
= x
= film thickness
= thermal diffusion length
= thermal diffusivity= modulation frequency (rad/s)
x
LD
1778 cm-1 Polycarbonate Peak
30
340029001730166016001505146014251370132512751230116011101050
895870830810680
123456789
1011121314151617181920
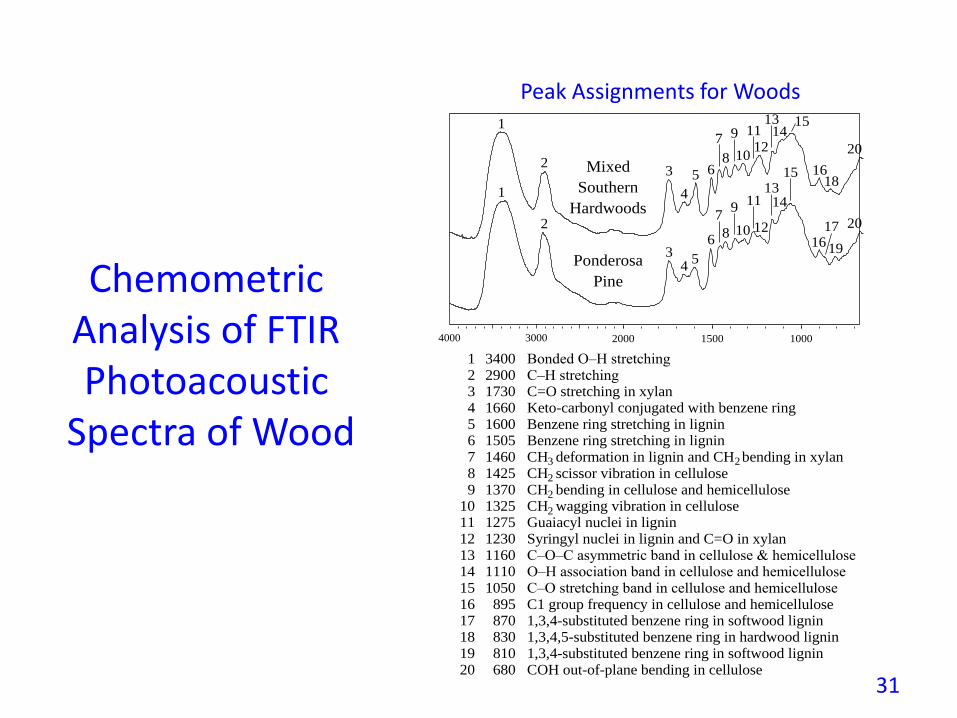
Bonded O–H stretchingC–H stretchingC=O stretching in xylanKeto-carbonyl conjugated with benzene ringBenzene ring stretching in ligninBenzene ring stretching in ligninCH deformation in lignin and CH bending in xylanCH scissor vibration in celluloseCH bending in cellulose and hemicelluloseCH wagging vibration in celluloseGuaiacyl nuclei in ligninSyringyl nuclei in lignin and C=O in xylanC–O–C asymmetric band in cellulose & hemicelluloseO–H association band in cellulose and hemicelluloseC–O stretching band in cellulose and hemicelluloseC1 group frequency in cellulose and hemicellulose1,3,4-substituted benzene ring in softwood lignin1,3,4,5-substituted benzene ring in hardwood lignin1,3,4-substituted benzene ring in softwood ligninCOH out-of-plane bending in cellulose
3
2
2
2
2
1000150020000
5
10
15
20
25
30
300040000
5
10
15
20
25
30
1
1
2
2
3
3
5
5
4
4
6
6
8
8
7
7
10
10
9
9
11
12
11
12
14
14
13
1315
15
16
16 19
17
18
20
20
Mixed
Southern
Hardwoods
Ponderosa
PineChemometricAnalysis of FTIR Photoacoustic
Spectra of Wood
31
Peak Assignments for Woods
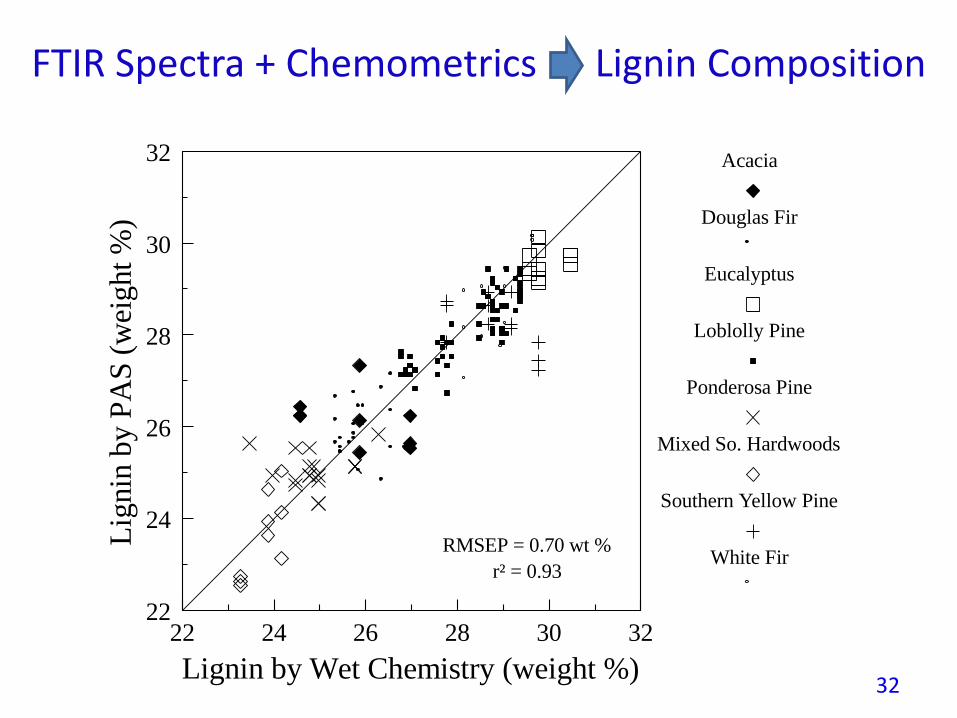
22 24 26 28 30 3222
24
26
28
30
32
Lignin by Wet Chemistry (weight %)
Lig
nin
by P
AS
(w
eight
%)
Acacia
Douglas Fir
Eucalyptus
Loblolly Pine
Ponderosa Pine
Mixed So. Hardwoods
Southern Yellow Pine
White FirRMSEP = 0.70 wt %
r² = 0.93
FTIR Spectra + Chemometrics Lignin Composition
32
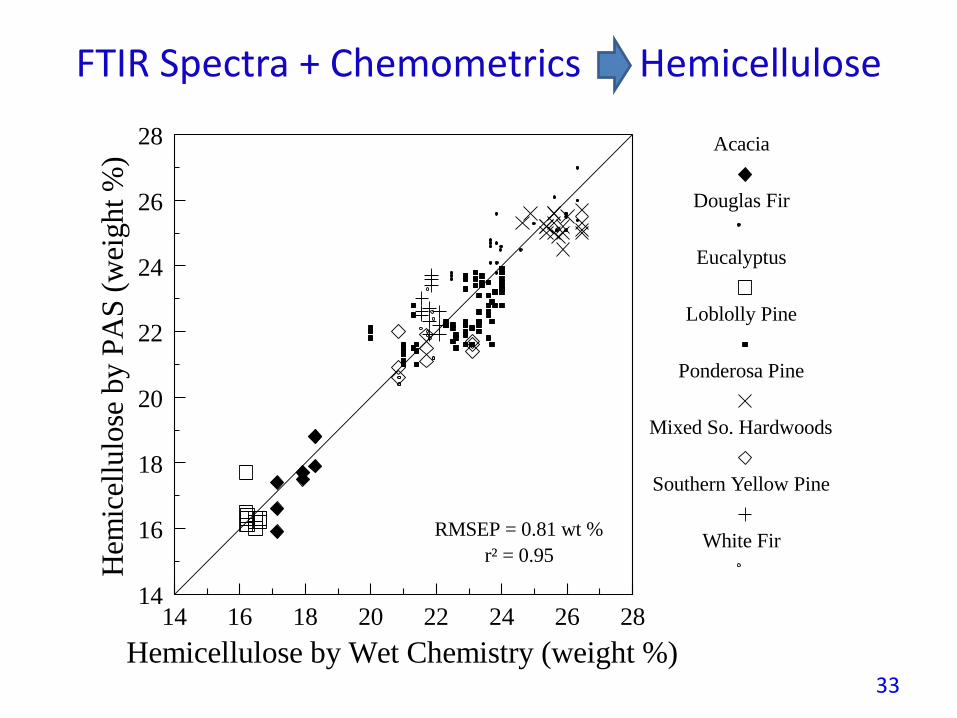
14 16 18 20 22 24 26 2814
16
18
20
22
24
26
28
Hemicellulose by Wet Chemistry (weight %)
Hem
icel
lulo
se b
y P
AS
(w
eight
%)
Acacia
Douglas Fir
Eucalyptus
Loblolly Pine
Ponderosa Pine
Mixed So. Hardwoods
Southern Yellow Pine
White FirRMSEP = 0.81 wt %
r² = 0.95
FTIR Spectra + Chemometrics Hemicellulose
33
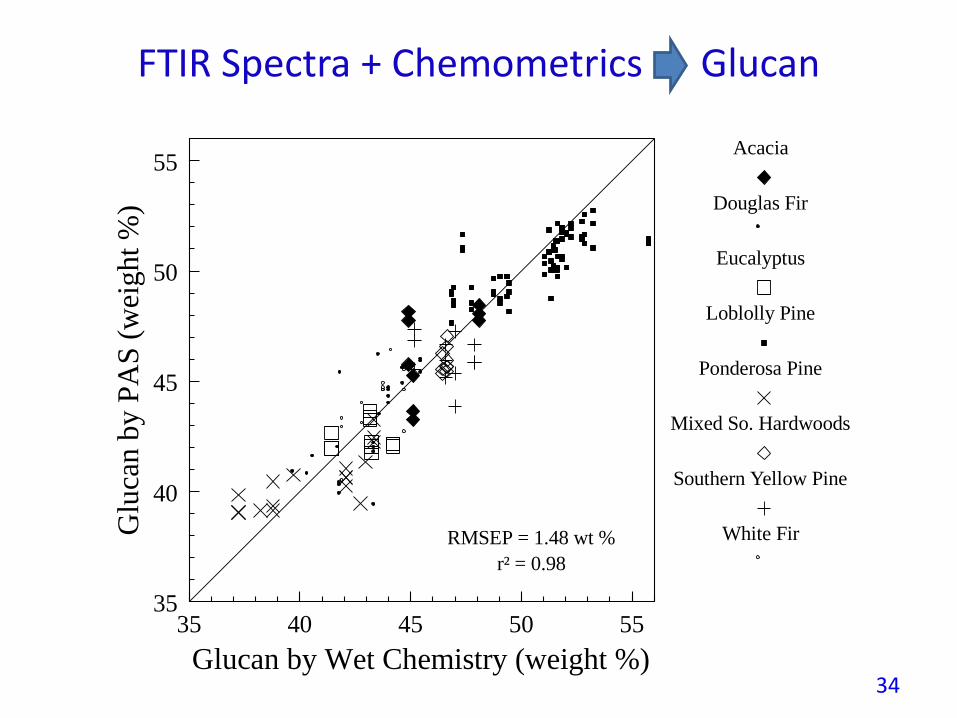
35 40 45 50 5535
40
45
50
55
Glucan by Wet Chemistry (weight %)
Glu
can b
y P
AS
(w
eight
%)
Acacia
Douglas Fir
Eucalyptus
Loblolly Pine
Ponderosa Pine
Mixed So. Hardwoods
Southern Yellow Pine
White FirRMSEP = 1.48 wt %
r² = 0.98
FTIR Spectra + Chemometrics Glucan
34
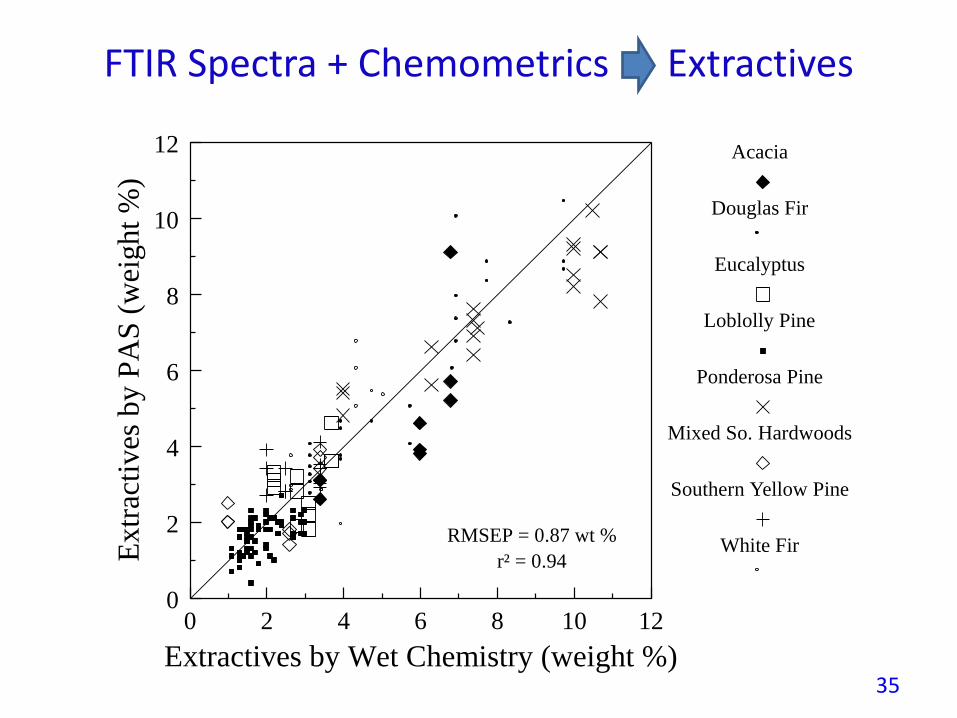
RMSEP = 0.87 wt %
r² = 0.94
0 2 4 6 8 10 120
2
4
6
8
10
12
Extractives by Wet Chemistry (weight %)
Ex
trac
tiv
es b
y P
AS
(w
eig
ht
%)
Acacia
Douglas Fir
Eucalyptus
Loblolly Pine
Ponderosa Pine
Mixed So. Hardwoods
Southern Yellow Pine
White Fir
FTIR Spectra + Chemometrics Extractives
35
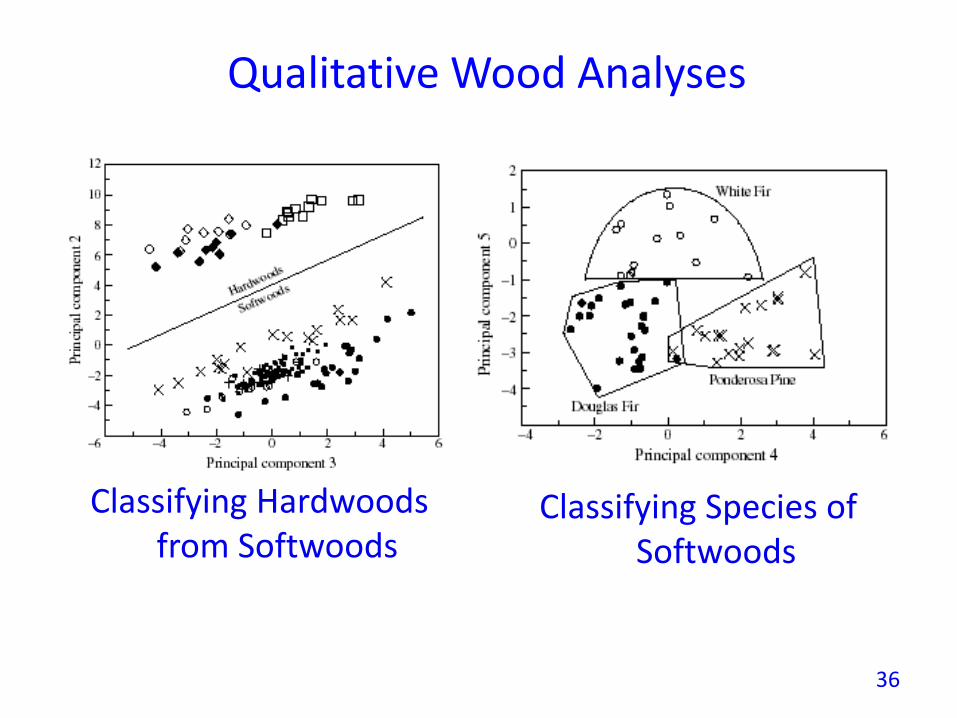
Qualitative Wood Analyses
Classifying Hardwoods from Softwoods
Classifying Species of Softwoods
36
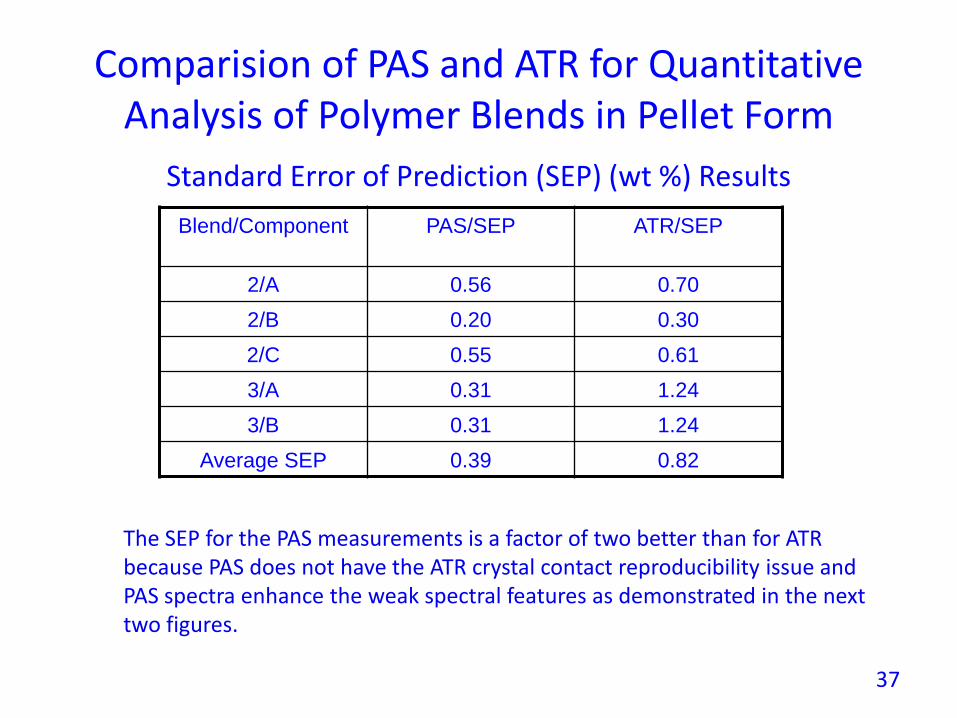
Comparision of PAS and ATR for Quantitative Analysis of Polymer Blends in Pellet Form
Blend/Component PAS/SEP ATR/SEP
2/A 0.56 0.70
2/B 0.20 0.30
2/C 0.55 0.61
3/A 0.31 1.24
3/B 0.31 1.24
Average SEP 0.39 0.82
Standard Error of Prediction (SEP) (wt %) Results
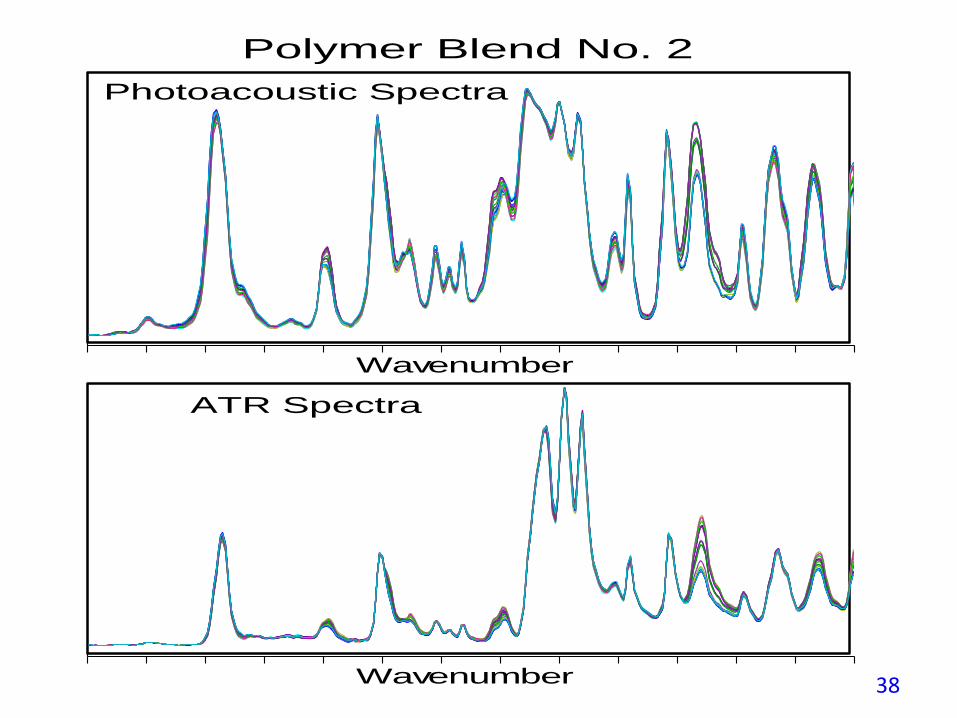
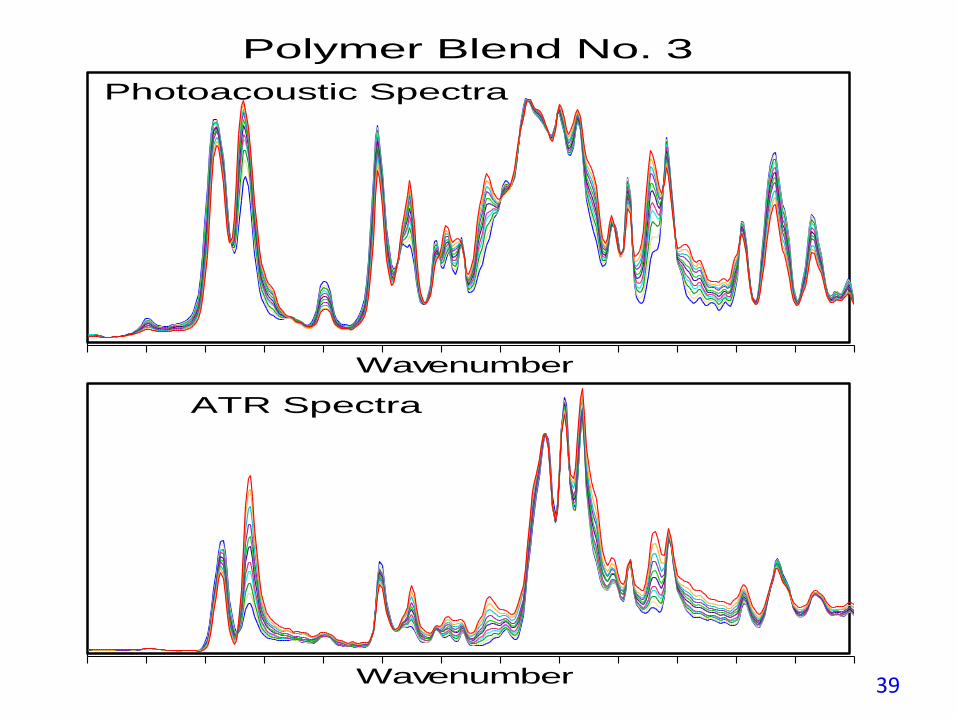
The SEP for the PAS measurements is a factor of two better than for ATRbecause PAS does not have the ATR crystal contact reproducibility issue andPAS spectra enhance the weak spectral features as demonstrated in the nexttwo figures.
37
Wavenumber
Wavenumber
Polymer Blend No. 2
Photoacoustic Spectra
ATR Spectra
38
Wavenumber
Wavenumber
Polymer Blend No. 3
Photoacoustic Spectra
ATR Spectra
39
FTIR-PAS Analysis of Aging Processes in
Carbon Fiber/Epoxy Composites
• Increasing use of composites in aircraft make characterizing the aging of prepregs and finished parts important.
• Aging changes in epoxy chemistry causes degradation of mechanical properties.
• FTIR-PAS detected changes in chemistry near the surface can predict degradation of bulkmechanical properties.
40
• 25-ply composite panel
• Aging: Baked in air for 4 hours at 11 equally spaced temperatures from 149 to 288 °C (300 to 550 °F). Ten samples at each temperature.
• Interlaminar Shear Strength (ILSS) Test of Mechanical Property Degradation
• Chemometrics relate spectra to ILSS
Artificial Aging of IM7/977-3 Carbon
Fiber/Epoxy Composite
41
PAS Spectra of Thermally Degraded Composites
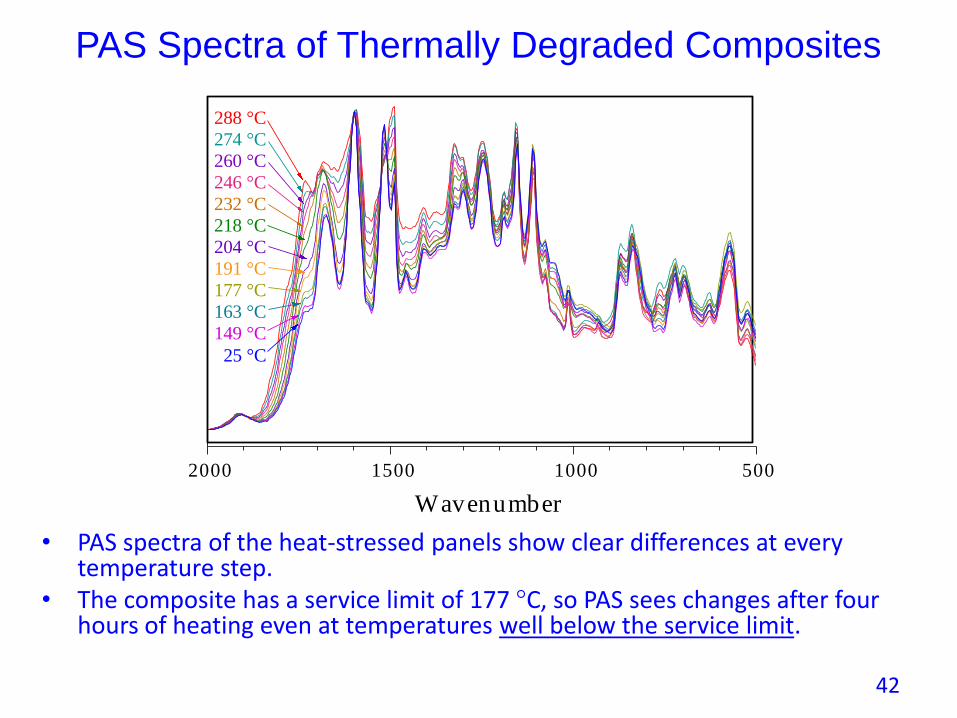
• PAS spectra of the heat-stressed panels show clear differences at every temperature step.
• The composite has a service limit of 177 °C, so PAS sees changes after four hours of heating even at temperatures well below the service limit.
500100015002000
Wavenumber
288 °C
260 °C
232 °C
204 °C
177 °C
149 °C
274 °C
218 °C
246 °C
191 °C
163 °C
25 °C
42
PAS/PLS Model Predicting Laminate Degradation
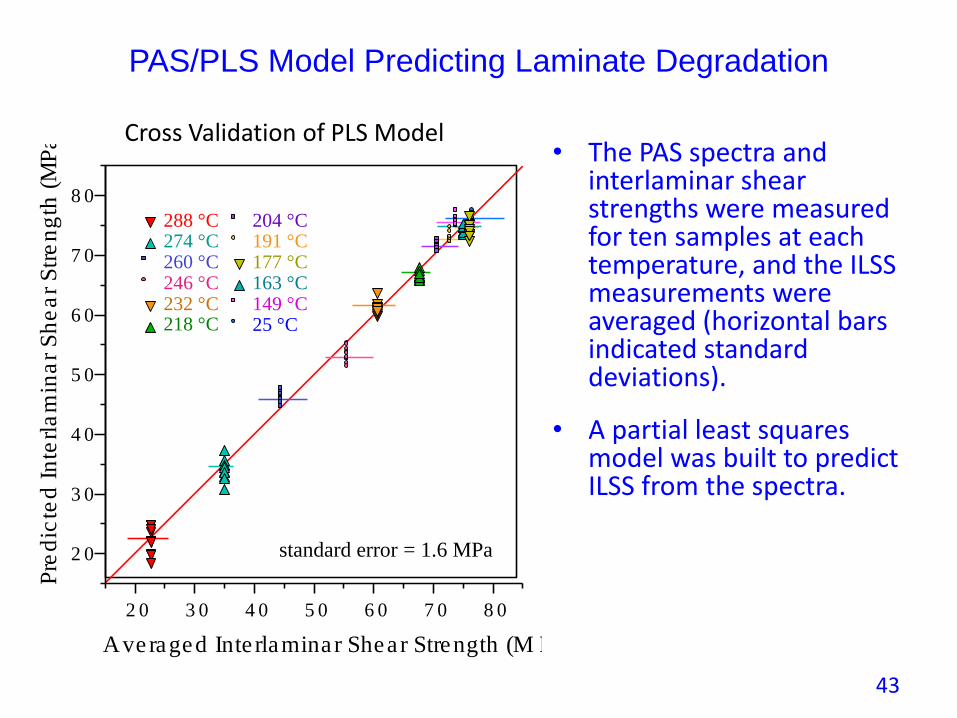
• The PAS spectra and interlaminar shear strengths were measured for ten samples at each temperature, and the ILSS measurements were averaged (horizontal bars indicated standard deviations).
• A partial least squares model was built to predict ILSS from the spectra.
2 0 3 0 4 0 5 0 6 0 7 0 8 0
Averaged Inte rlaminar Shear Strength (M Pa)
2 0
3 0
4 0
5 0
6 0
7 0
8 0
Pre
dic
ted
In
terl
am
ina
r S
he
ar
Str
en
gth
(M
Pa
)
204 °C
177 °C
149 °C
191 °C
163 °C
25 °C
288 °C
260 °C
232 °C
274 °C
218 °C
246 °C
standard error = 1.6 MPa
Cross Validation of PLS Model
43
Analysis of Ambient Temperature Aging of
Prepreg Sheets to Determine if
Out Lifetime Has Expired
• Carbon fiber/epoxy prepreg sheets are kept in a freezer prior to laying up of sheets to form a part.
• Lay up process can take days, meanwhile cure advances at room temperature.
• In this experiment, prepregs kept at room temperature in dry air up to 60 days.
• PA spectra and other properties measured every few days. On each occasion; 1 sample spectrum acquired for PLS training set and 2 samples as unknowns.
• Laminates made and tested for ILSS on half of the testing occasions.
44
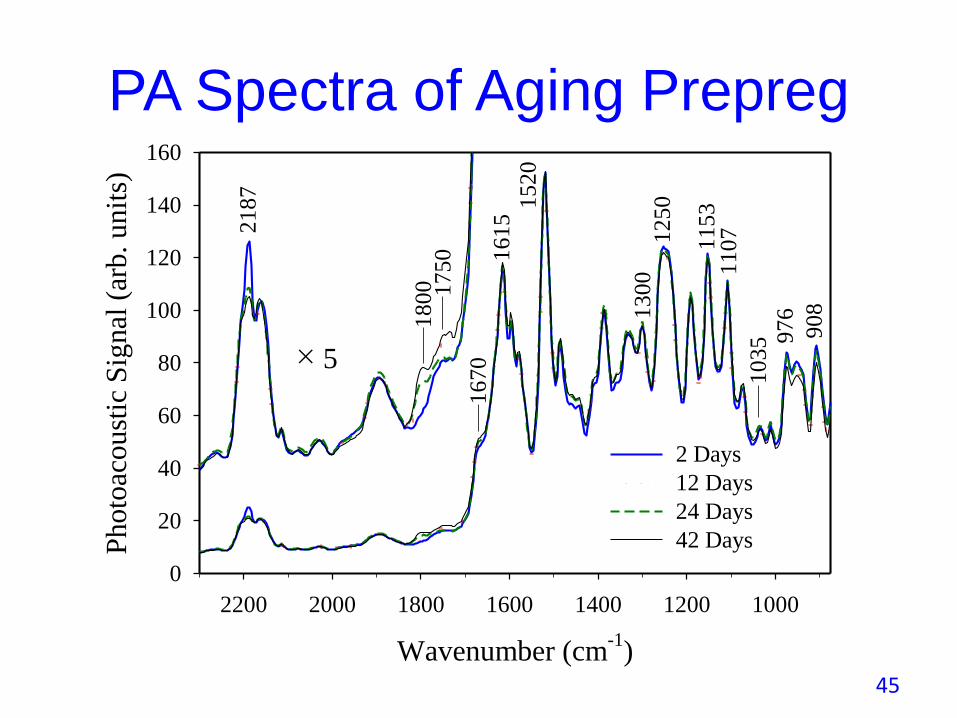
PA Spectra of Aging Prepreg
Wavenumber (cm-1
)
1000120014001600180020002200
Photo
acou
stic
Sig
nal
(ar
b.
unit
s)
0
20
40
60
80
100
120
140
160
2 Days
12 Days
24 Days
42 Days
21
87
18
00
16
70
15
20
× 5
17
50
90
8
97
6
10
35
11
07
11
53
12
50
13
00
16
15
45
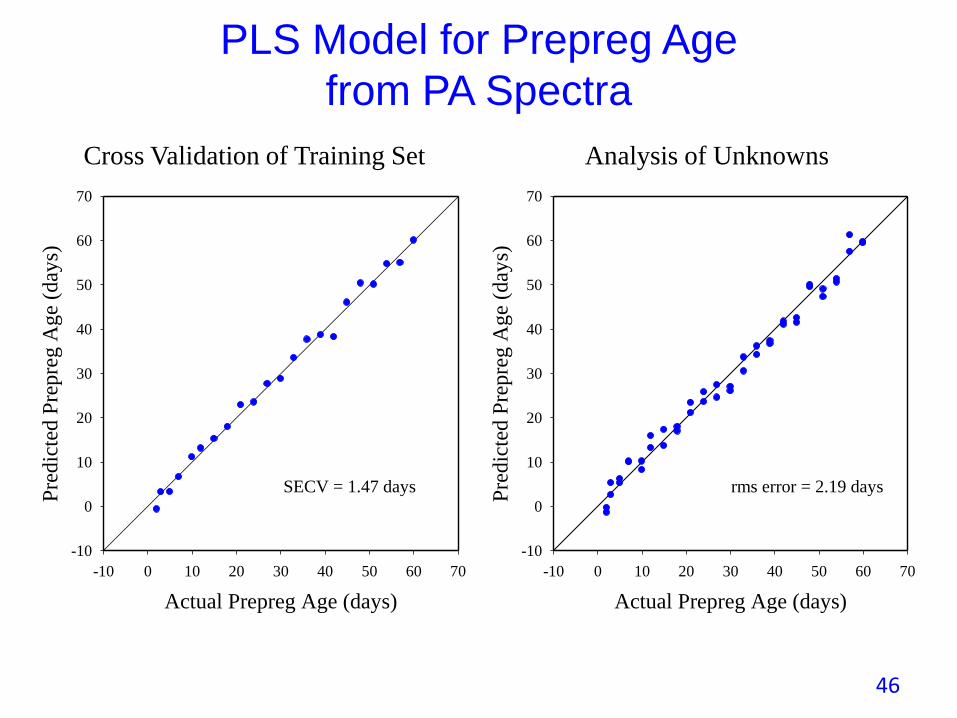
PLS Model for Prepreg Age
from PA Spectra
Actual Prepreg Age (days)
-10 0 10 20 30 40 50 60 70
Pre
dic
ted P
repre
g A
ge
(day
s)
-10
0
10
20
30
40
50
60
70
SECV = 1.47 days
Actual Prepreg Age (days)
-10 0 10 20 30 40 50 60 70
Pre
dic
ted P
repre
g A
ge
(day
s)
-10
0
10
20
30
40
50
60
70
rms error = 2.19 days
Cross Validation of Training Set Analysis of Unknowns
46
Actual ILSS (ksi)
9.0 9.5 10.0 10.5 11.0
Pre
dic
ted I
LS
S (
ksi
)
9.0
9.5
10.0
10.5
11.0
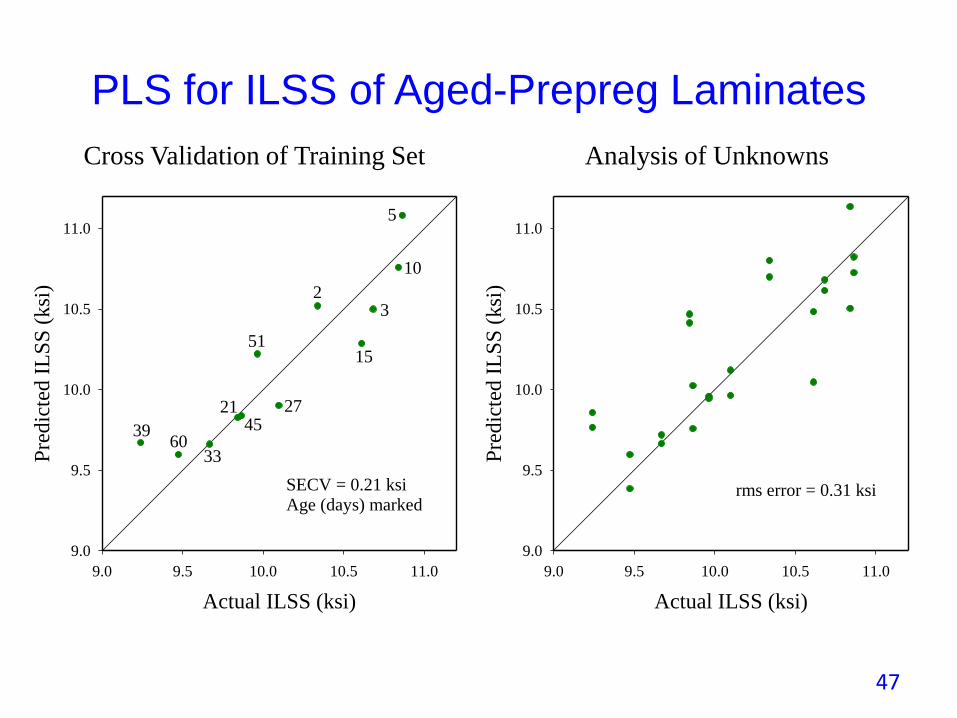
rms error = 0.31 ksi
PLS for ILSS of Aged-Prepreg Laminates
Actual ILSS (ksi)
9.0 9.5 10.0 10.5 11.0
Pre
dic
ted I
LS
S (
ksi
)
9.0
9.5
10.0
10.5
11.0
SECV = 0.21 ksiAge (days) marked
3960
2145
51
27
2
15
3
10
5
33
Cross Validation of Training Set Analysis of Unknowns
47
Processing Wood into Biochar
• FTIR Photoacoustic Spectroscopy allows thedepletion and generation of chemicalcompounds to be observed during thepyrolysis and charring of biomass.
• This capability can be used to characterize therole of biochar chemistry, due to differentcharring conditions and biomass feedstocktypes, in soil fertility, water quality, andcarbon sequestration studies.
48
Charring Apparatus
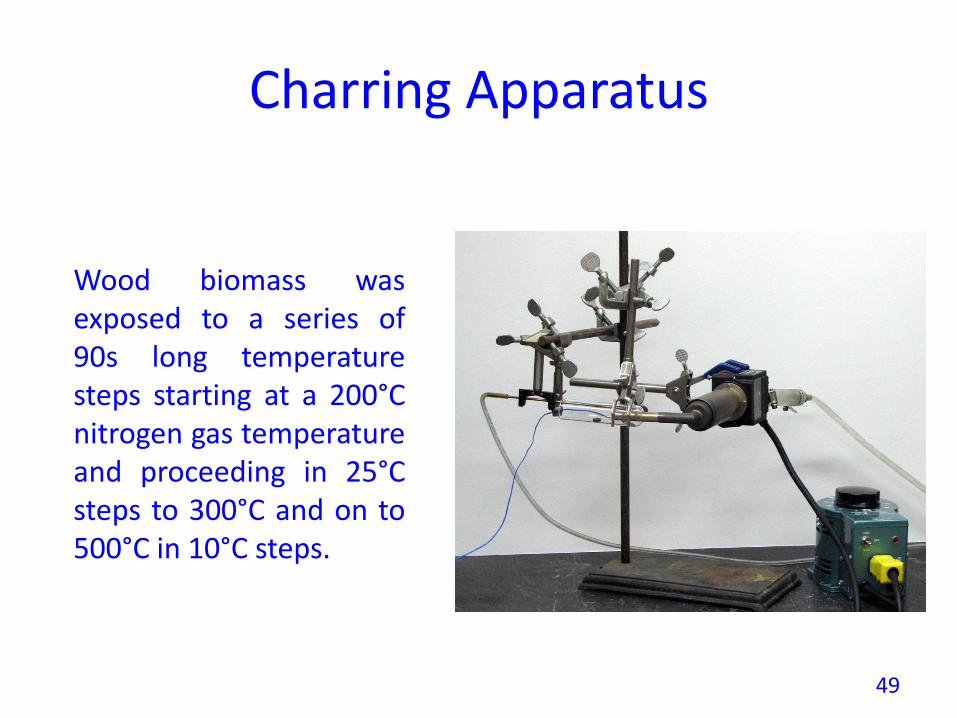
Wood biomass wasexposed to a series of90s long temperaturesteps starting at a 200°Cnitrogen gas temperatureand proceeding in 25°Csteps to 300°C and on to500°C in 10°C steps.
49
Wavenumber (cm-1
)
1000200030004000
Sig
nal (a
ll sp
ectr
a o
n s
am
e s
ca
le)
0
50
100
150
200
Fresh
200 oC
300 oC
320 oC
340 oC
360 oC
380 oC
400 oC
450 oC
500 oC
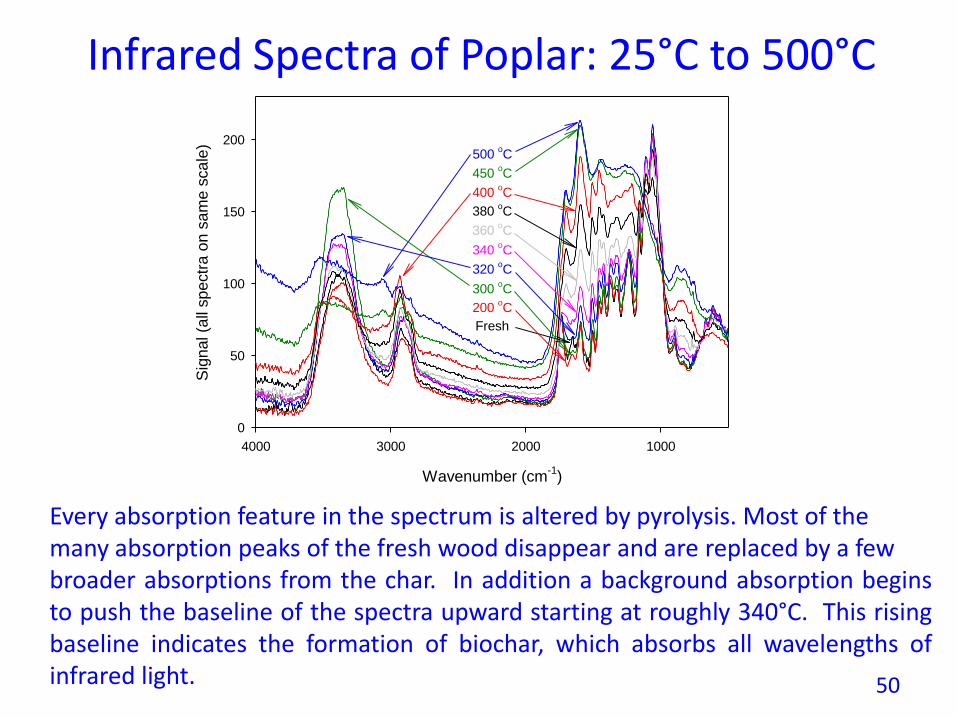
Infrared Spectra of Poplar: 25°C to 500°C
Every absorption feature in the spectrum is altered by pyrolysis. Most of themany absorption peaks of the fresh wood disappear and are replaced by a fewbroader absorptions from the char. In addition a background absorption beginsto push the baseline of the spectra upward starting at roughly 340°C. This risingbaseline indicates the formation of biochar, which absorbs all wavelengths ofinfrared light. 50
Pyrolysis Temperature (oC)
200 250 300 350 400 450 500
Heig
ht (s
cale
d s
o m
ax =
100)
0
20
40
60
80
100
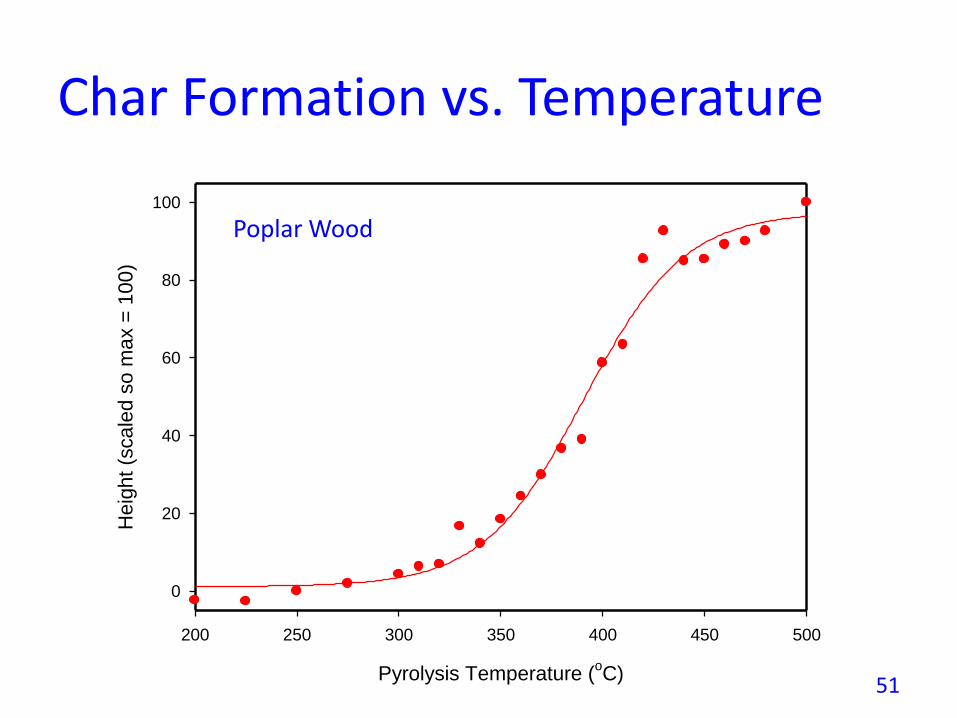
Char Formation vs. Temperature
Poplar Wood
51
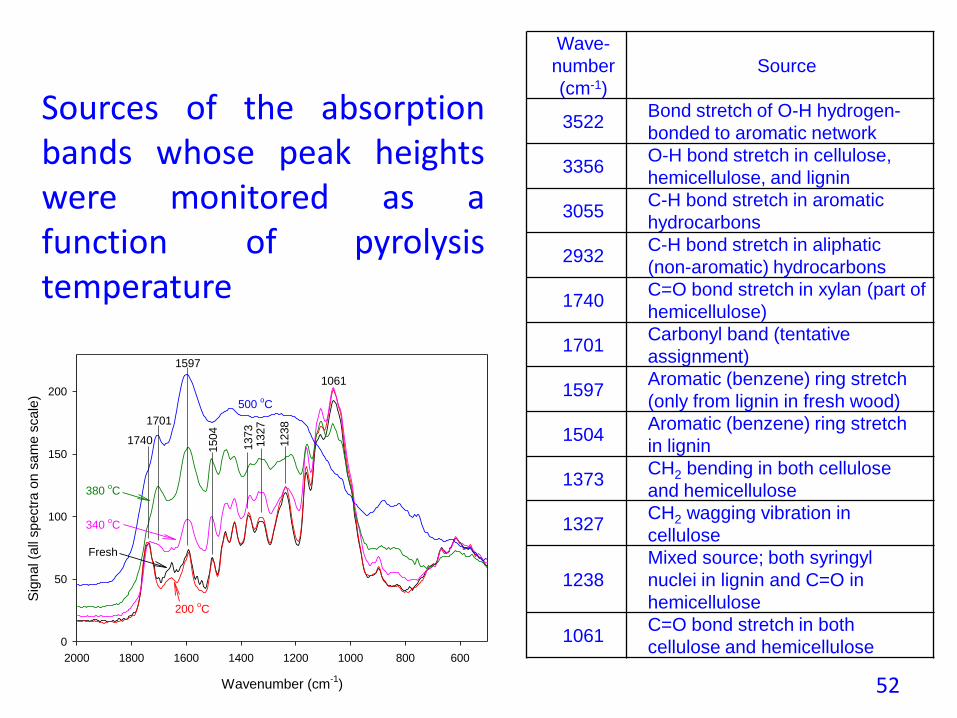
Wavenumber (cm-1
)
600800100012001400160018002000
Sig
nal (a
ll sp
ectr
a o
n s
am
e s
ca
le)
0
50
100
150
200
Fresh
200 oC
340 oC
380 oC
500 oC
1740
1504
1373
1327
1238
1061
1701
1597
Wave-
number
(cm-1)
Source
3522Bond stretch of O-H hydrogen-
bonded to aromatic network
3356O-H bond stretch in cellulose,
hemicellulose, and lignin
3055C-H bond stretch in aromatic
hydrocarbons
2932C-H bond stretch in aliphatic
(non-aromatic) hydrocarbons
1740C=O bond stretch in xylan (part of
hemicellulose)
1701Carbonyl band (tentative
assignment)
1597Aromatic (benzene) ring stretch
(only from lignin in fresh wood)
1504Aromatic (benzene) ring stretch
in lignin
1373CH2 bending in both cellulose
and hemicellulose
1327CH2 wagging vibration in
cellulose
1238
Mixed source; both syringyl
nuclei in lignin and C=O in
hemicellulose
1061C=O bond stretch in both
cellulose and hemicellulose
Sources of the absorptionbands whose peak heightswere monitored as afunction of pyrolysistemperature
52
Pyrolysis Temperature (oC)
200 250 300 350 400 450 500
He
igh
t (s
ca
led s
o m
ax =
10
0)
0
20
40
60
80
100
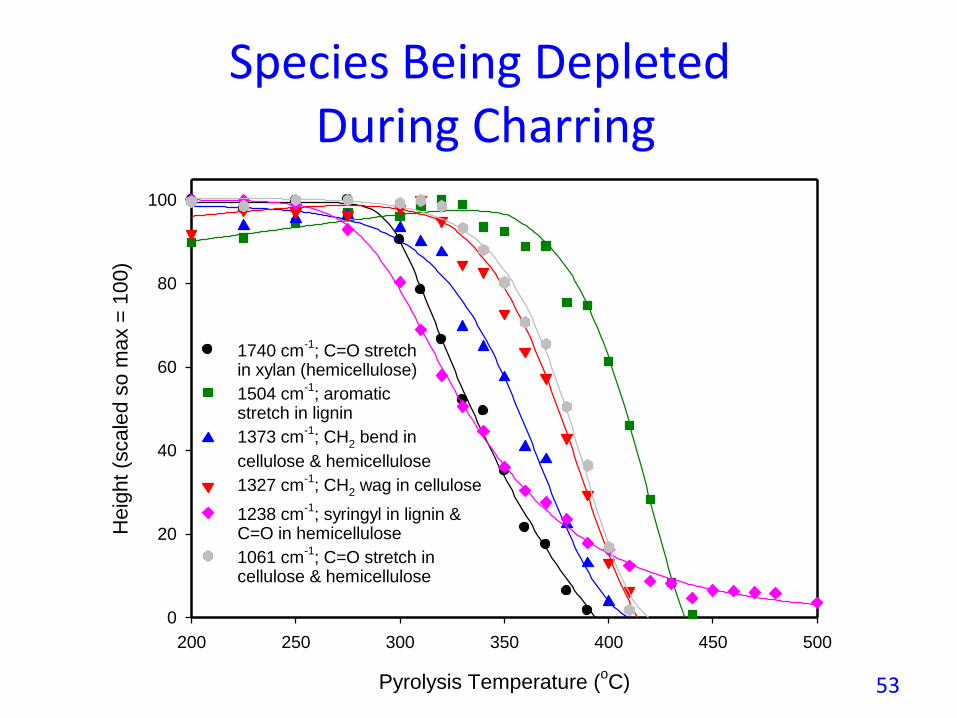
1740 cm-1
; C=O stretchin xylan (hemicellulose)
1504 cm-1
; aromaticstretch in lignin
1373 cm-1
; CH2 bend in
cellulose & hemicellulose
1327 cm-1
; CH2 wag in cellulose
1238 cm-1
; syringyl in lignin &C=O in hemicellulose
1061 cm-1
; C=O stretch incellulose & hemicellulose
Species Being DepletedDuring Charring
53
Pyrolysis Temperature (oC)
200 250 300 350 400 450 500
He
igh
t (s
ca
led s
o m
ax =
10
0)
0
20
40
60
80
100
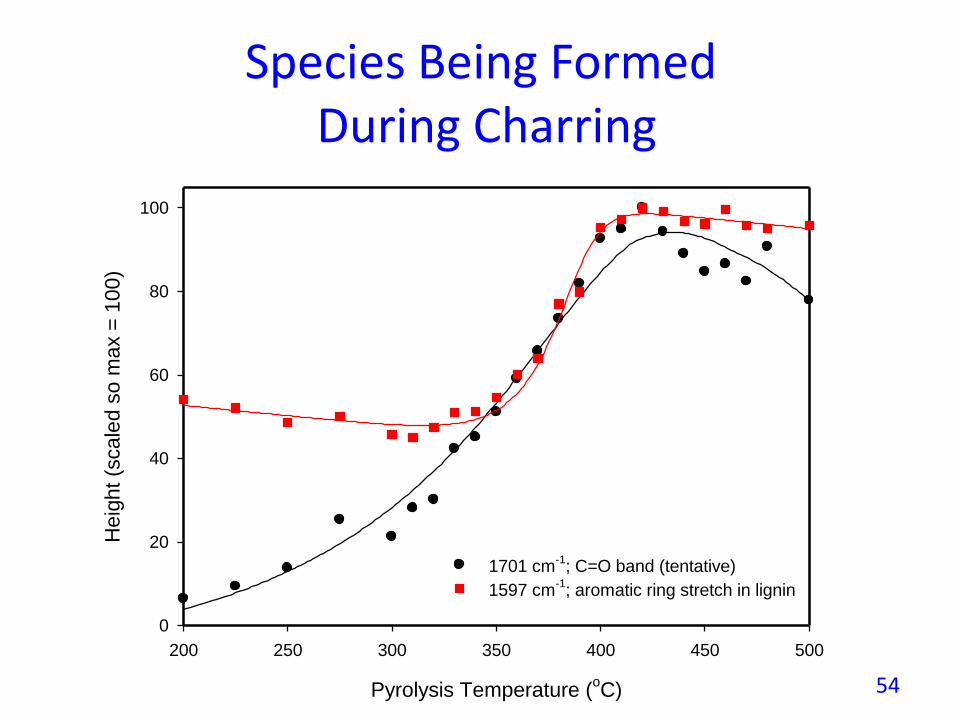
1701 cm-1
; C=O band (tentative)
1597 cm-1
; aromatic ring stretch in lignin
Species Being FormedDuring Charring
54
Pyrolysis Temperature (oC)
200 250 300 350 400 450 500
He
igh
t (s
ca
led t
o m
ax =
10
0)
0
20
40
60
80
100
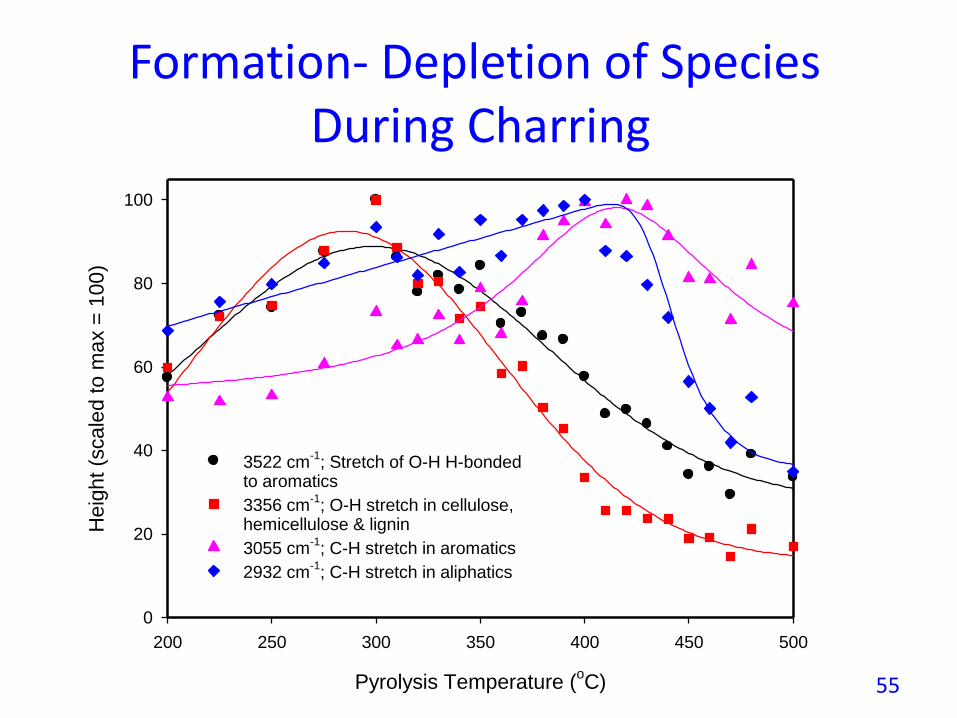
3522 cm-1
; Stretch of O-H H-bondedto aromatics
3356 cm-1
; O-H stretch in cellulose,hemicellulose & lignin
3055 cm-1
; C-H stretch in aromatics
2932 cm-1
; C-H stretch in aliphatics
Formation- Depletion of Species During Charring
55
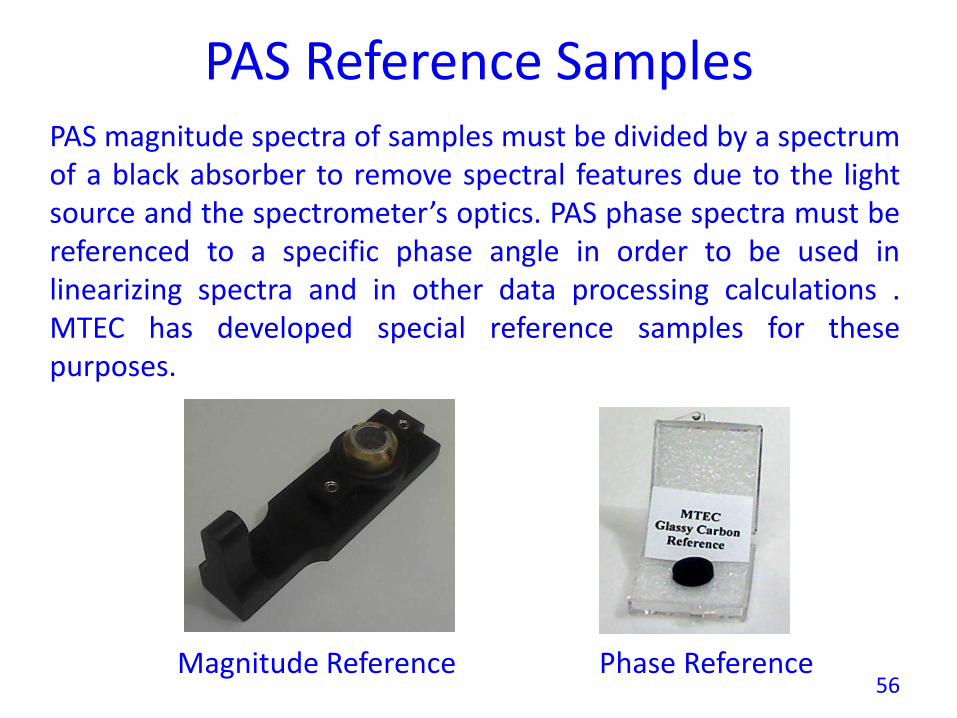
PAS Reference SamplesPAS magnitude spectra of samples must be divided by a spectrumof a black absorber to remove spectral features due to the lightsource and the spectrometer’s optics. PAS phase spectra must bereferenced to a specific phase angle in order to be used inlinearizing spectra and in other data processing calculations .MTEC has developed special reference samples for thesepurposes.
Magnitude Reference Phase Reference56