Embed Size (px)
Citation preview

Phosphorylation of Dentin Matrix Protein 1 and Phosphophoryn
by
Yuanyuan Duan
Submitted to the Graduate Faculty of
University of Pittsburgh in partial fulfillment
of the requirements for the degree of
Master of Science
University of Pittsburgh
2009

ii
UNIVERSITY OF PITTSBURGH
School of Medicine
This thesis was presented
by
Yuanyuan Duan
It was defended on
[Jun 23rd, 2009]
and approved by
[Charles Sfeir, Assoc. Professor, Dept. of Oral Biology]
[Michael Cascio, Assoc. Professor, Dept. of Molecular Genetics and Biochemistry]
[Peijun Zhang, Assis. Professor, Dept. of Structural biology]
[Thesis Director]: [Billy W Day, Professor, Dept.of Pharmaceutical Sciences]

iii
Copyright © by Yuanyuan Duan
2009

iv
ABSTRACT
Yuanyuan Duan
University of Pittsburgh, 2009
Biomineralization, one of the most widespread processes in nature, uses polyanionic proteins to
direct oriented crystal growth. In bone and dentin, this process is under precise control of the
collagen template and the noncollagenous acidic phosphoproteins. These phosphoproteins
function differently depending on their sizes and level of phosphorylation.
The goal of this research is to investigate the in vitro phosphorylation as well as the
phosphorylation in mammalian cells of two highly phosphorylated bone/dentin extracellular
matrix proteins: dentin phosphophoryn (DPP) and dentin matrix protein 1 (DMP1). This data
will be important to the general hypothesis, that the phosphorylation of non-collagenous proteins
play a significant role in matrix mediated mineralization.
Our data shows that the in vitro phosphorylation of DPP and DMP1 could be optimized
by adjusting the phosphorylation reaction time, calcium concentration, and protein modification
by assessing various forms (with or without the C or N terminal end). Following the in vitro
phosphorylation, mass spectrometry analysis was used to identify the sites of phoshorylation. In
addition, to identify the kinases involved in phosphorylating DMP1, cell lysates from cells that
Phosphorylation of Dentin Matrix Protein 1 and Phosphophoryn
Yuanyuan Duan
University of Pittsburgh, 2009

v
have (MC3T3) and do not have (NIH3T3) the ability to mineralize their matrix and were isolated
and analyzed by zymogram. Casein kinase II catalytic subunit was identified in addition to
potential novel kinases responsible for DMP1 phosphorylation, some possible novel kinases for
DMP1 were discovered by mass spectrometry.
The second goal of this research is to assess if cells that have the ability to form a
mineralized matrix will possess specialized kinases that can phosporylate these highly
phosphorylated and acidic proteins. To achieve this goal we over-expressed and purified DMP1
from two cell types: 1) cells that have the ability to mineralize their matrix and 2) cells that do
not possess the ability to mineralize their matrix. The purified proteins were then analyzed by
SDS-PAGE and mass spectrometry to quantify and determine the sites of phoshorylation.
This study has expanded our knowledge on the mechanisms involved in the
phosphorylation of DPP and DMP1 and provided the parameters to start assessing the role of
phosphorylation on tissue mineralization.

vi
TABLE OF CONTENTS
ACKNOWLEDGEMENTS .................................................................................................. XII
NOMENCLATURE ............................................................................................................ XIII
1.0 INTRODUCTION.....................................................................................................1
1.1 OVERVIEW .....................................................................................................1
1.2 MINERAL FORMATION AND EXTRACELLULAR MATRIX .................3
1.3 EXTRACELLULAR MATRIX COLLAGEN ................................................4
1.4 NON-COLLAGENOUS PROTEINS ...............................................................4
1.5 SIBLING PROTEINS .......................................................................................6
1.5.1 Dentin Phosphophoryn (DPP) ......................................................................7
1.5.2 Dentin Matrix Protein 1 (DMP1) .................................................................9
1.6 PHOSPHORYLATION BY EUKARYOTIC PROTEIN KINASES ............ 12
2.0 HYPOTHESIS ........................................................................................................ 14
3.0 MATERIAL AND METHODS .............................................................................. 15
3.1 REAGENTS AND MATERIALS................................................................... 15
3.2 RECOMBINANT PROTEIN PURIFICATION ........................................... 15
3.2.1 Constructs and mutation ............................................................................ 15
3.2.2 Recombinant protein purification .............................................................. 17
3.3 TISSUE CLUTURE OF CELLS .................................................................... 17

vii
3.4 DMP1 PURIFICATION FROM CELLS ....................................................... 18
3.5 CELL CYTOSOLIC AND MEMBRANOUS FRACTIONS
PREPARATION ............................................................................................................. 19
3.6 IN VITRO PHOSPHORYLATION ................................................................ 20
3.6.1 In vitro phosphorylation by CKI and CKII ............................................... 20
3.6.2 In vitro phosphorylation by cell fractions .................................................. 21
3.6.3 Phosphorylation quantification by scintillation counter ........................... 21
3.6.4 Phosphorylation detection by SDS-Gel ...................................................... 22
3.7 MASS SPECTROMETRY ............................................................................. 23
3.7.1 In gel digestion ............................................................................................ 23
3.7.2 In solution digestion .................................................................................... 24
3.7.3 MALDI-TOF MS ........................................................................................ 24
3.7.4 LC-ESI MS .................................................................................................. 25
3.8 ZYMOGRAM ................................................................................................. 25
3.8.1 Detection of the kinase activity after 1-Dimension SDS-PAGE ................ 25
3.8.2 Kinase identification using mass spectrometry .......................................... 26
4.0 RESULTS AND DISCUSSION .............................................................................. 27
4.1 MASS SPECTROMETRY OF PP ................................................................. 27
4.2 MASS SPECTROMETRY OF DMP1 ........................................................... 30
4.3 IN VITRO PHOSPHORYLATION OF PP ................................................... 33
4.4 IN VITRO PHOSPHORYLATION OF DMP1 ............................................. 37
4.5 ZYMOGRAM ................................................................................................. 45
4.6 MAMMALIAN CELL DERIVED DMP1 ..................................................... 53

viii
4.7 DISSCUSSION ................................................................................................ 59
4.8 SUMMARY AND FUTURE RESEARCH .................................................... 61
BIBLIOGRAPHY ................................................................................................................... 63

ix
LIST OF TABLES
Table 1 Major non-collagenous proteins in bone and dentin ........................................................5
Table 2 Post-translational modifications of Sibling Proteins [18] .................................................7
Table 3 Cycles of PCR .............................................................................................................. 16
Table 4 List of enzymes and chemicals that might cleave rPP.................................................... 28
Table 5 Phospho-peptide of in vitro phosphorylated cDMP1 detected by MS ............................ 43
Table 6 List of kinases found in MC3T3 cell lysis’ zymogram bands (37 and 40KD) ................ 49
Table 7 List of kinases found in MDPC23 cell lysis’ zymogram bands(37 and 40KD) .............. 52

x
LIST OF FIGURES
Figure 1. Osteogenesis(left) and odontogenesis(right) .................................................................2
Figure 2. Genomic organization of the mouse DSPP gene ...........................................................8
Figure 3 Scheme of different forms of DPP .................................................................................8
Figure 4 DMP1 is required for both osteogenesis and odontogenesis ......................................... 10
Figure 5 DMP1 is cleaved into 2 fragments ............................................................................... 11
Figure 6 Scheme of different forms of DMP1 ............................................................................ 11
Figure 7 Strategy for subcellular fraction................................................................................... 20
Figure 8 rPP cleaved by enzymes and chemicals ....................................................................... 29
Figure 9 cDMP1 digested by trypsin ......................................................................................... 31
Figure 10 cDMP1 digested by AspN ......................................................................................... 32
Figure 11 Comparison of in vitro phosphorylation of different PP forms ................................... 34
Figure 12 In vitro phosphorylation of different PP forms by CKI .............................................. 35
Figure 13 Quantified comparison of in vitro phosphorylation of different PP forms by CKI ...... 35
Figure 14 Comparison of rPP phosphorylated by different enzymes .......................................... 36
Figure 15 In vitro phosphorylation of rPP by different time scale .............................................. 36
Figure 16 In vitro phosphorylation of cDMP1 at different temperatures .................................... 38
Figure 17 In vitro phosphorylation of cDMP1 by CKI and CKII ............................................... 39

xi
Figure 18 In vitro phosphorylation of cDMP1 at different time points ....................................... 39
Figure 19 In vitro phosphorylation of cDMP1 with different Ca2+ (upper) or Mg2+ concentration
................................................................................................................................................. 40
Figure 20 MS of phosphorylated cDMP1 (phospho-peptides circled) ........................................ 42
Figure 21 Phosphor-peptide 3071(1023.85*3) by LTQ-ESI MSn ............................................... 44
Figure 22 Phospho-peptide 2510(838.32*3) by LCQ-ESI MS2 .................................................. 45
Figure 23 cDMP1 phosphorylated by cellular fractions ............................................................. 47
Figure 24 fDMP1 zymogram bands .......................................................................................... 48
Figure 25 MS/MS spectrum of peptide from CKII subunit alpha: VYAEVNSLR. ..................... 50
Figure 26 MS/MS spectrum of peptide from CKII subunit alpha: HLVSPEALDLLDK ............ 51
Figure 27 U2OS derived fDMP1 purified by ion exchange. ....................................................... 54
Figure 28 MC3T3/ HEK293 derived DMP1 purified by ion exchange column .......................... 54
Figure 29 293 derived fDMP1 digested by trypsin. Coverage:31% ............................................ 55
Figure 30 U2OS derived fDMP1 digested by trypsin. Coverage:30% ........................................ 56
Figure 31 U2OS derived fDMP1 digested by AspN. Coverage: 36% ......................................... 57
Figure 32 MC3T3derived fDMP1 digested by Trypsin. Coverage:22% ..................................... 58
Figure 33 MC3T3derived fDMP1 digested by AspN. Coverage: 19% ....................................... 59

xii
ACKNOWLEDGEMENTS
I extend my very deepest and sincere gratitude to Dr. Charles Sfeir and Dr. Billy Day, my
advisors. Thanks for giving me an opportunity to work on this project. The experiences that I
have had while working with them were invaluable. Their scientific guidance, patience, support,
willingness to share and help have led me complete my graduate studies.
I express my appreciation to Dr. Michael Cascio and Dr. Peijun Zhang for their advice
and for being on my committee.
I am thankful to all the people from whom I have learned techniques and procedures over
the years: Jinhua Li, Dr. Guy Uechi, and Linda Zhang.
Thanks to Dr. Brian Hood and Dr. Emanuel Schreiber for their help on LC-MS.
Thanks to Diane Turner and Michele Leahy for always being helpful.
Finally, I would like to express my gratitude to my family, for being there every time I
needed them.

xiii
NOMENCLATURE
CID: Collision-induced dissociation
CKI: Casein Kinase I
CKII: Casein Kinase II
DSPP: Dentin sialophosphoprotein
DPP: Dentin phosphophoryn
DSP: Dentin sialoprotein
DGP: Dentin glycoprotein
DMP1: Dentin matrix protein 1
ESI: Electro spray ionization
ETD: Electron transfer dissociation
MALDI: Matrix-assisted laser desorption/ionization
MS: Mass spectrometry
NCP: non-collagenous proteins
TCEP: Tris (2-carboxyethyl) phosphine
TOF: Time of Flight
IAA: Iodoacetamide

1
1.0 INTRODUCTION
1.1 OVERVIEW
Osteogenesis (the process of bone formation) and Odontogenesis (the formation and
development of teeth) are very similar. During osteogenesis, the osteoblasts arise from the
osteoprogenitor cells in the bone marrow; mature osteoblasts produce a layer of nonmineralized
collagenous matrix, which is called osteoid layer. Odontoblasts arise from the dental
mesenchymal cells and secret nonmineralized collagenous pre-dentin layer. Osteoid layer and
pre-dentin layer mineralize leading to formation of bone and dentin tissues, respectively (Figure
1). Mature bone and dentin are composed of 60% mineral, 30% organic matrix and 10% water
(by weight); this organic matrix consists of 90% type I collagen and 10% non-collagenous
proteins[1] . Formation of pre-dentin and osteoid and their transformation process to dentin and
bone are highly controlled by the cells.

2
Figure 1. Osteogenesis(left) and odontogenesis(right)
During osteogenesis, the osteoblasts arise from the dental mesenchymal cells and secret the osteoid layer. During
odontogenesis, odontoblasts arise from the dental mesenchymal cells and secret pre-dentin layer.
(from: http://www.biyolojiegitim.yyu.edu.tr/k/ostblstm/pages/osteoblast_jpg.htm. and
http://education.vetmed.vt.edu/Curriculum/VM8054/Labs/Lab17/Images/DIGL14.JPG)
The biological control of mineralization requires regulation in time and space. This
regulation involves extracellular organic matrices molecules which provide organized nucleation
sites and entropic factors that control the nucleation and growth kinetics of crystal growth. Our
knowledge of how the mineralization process is initiated and regulated is limited. However, the
non-collagenous proteins (NCP) of bone/dentin are believed to play an important role in
mineralization.

3
1.2 MINERAL FORMATION AND EXTRACELLULAR MATRIX
Bone, dentin and cartilage are all calcified tissues, they function both structurally and
physiologically. Structurally, calcified tissues provide the rigid elements of bone and tooth.
Physiologically, calcified tissues play an essential role in the regulation of ion’ levels in body
fluid by acting as storage for ions. The major ions that are primarily regulated by bone are
calcium and phosphate. One of the areas of high interest in calcified tissue research is the
biomineralization process in these hard tissues.
The major mineral in vertebrates hard tissues is calcium phosphate , in the form of
calcium hydroxyapatite (Ca10 (PO4)6OH2) and amorphous calcium phosphate [2]. The body
fluids are super-saturated in respect to calcium and phosphate, hence prone to spontaneous
hydroxyapatite precipitation. Calcium phosphate precipitation is highly regulated by the cells,
which prevent spontaneous precipitation in soft tissues and induce controlled mineral formation
in bone and dentin; if the process is not properly regulated, the result could be too little or too
much mineral-either of which can compromise health[3] .
The mineralization process in bone and dentin is regulated by cells. The cells produce
an organic matrix rich in acidic macromolecules. This matrix controls all aspects of mineral
formation, including crystal nucleation growth kinetics, crystal size, morphology and
organization of the crystals in the tissue. There are two mechanism of nucleation: homogeneous
and heterogeneous. Homogeneous nucleation is a process that involves only precursor solutions
without any foreign material (such as proteins) while heterogeneous nucleation is a process with
foreign material. For bone and dentin formation, it is believed that the mineralization occurs via
heterogeneous nucleation process[4]. Many macromolecules (e.g. collagen, non-collagen
proteins) play an essential role in the mineralization process. Collagen works as a structural

4
template whereas non-collagen proteins, acidic in nature and highly phosphorylated, strongly
bind calcium[4] .
1.3 EXTRACELLULAR MATRIX COLLAGEN
Calcification of bone and dentin requires an extracellular matrix (ECM). Type I collagen is the
major extracellular matrix protein, providing structural template for bone/dentin formation.
ECM of bone and dentin contain mainly type I collagen and very limited other fibrillar collagens.
Type I collagen, the most abundant collagen in the human body, is the major matrix protein in
both bone and dentin. It is packed as a 2-D quarter-staggered arrangement and a 3-D quasi-
hexagonal assembly to construct the fibrillar matrix, providing structural scaffold [5]. Analysis
suggests that the type I collagen and non-collagenous matrix provides a template of charged
amino acids such as glutamic acid, aspartic acid, lysine, arginine, hydroxylysine and histidine.
This template dictates mineral formation in verterbrate tissues[6]. As a scaffold and deposition
space, type I collagen plays an essential role in nucleation for mineralization.
1.4 NON-COLLAGENOUS PROTEINS
Up to this point little is known about how mineralization is initiated and regulated. However,
several macromolecules (Table 1) in the extracellular matrix are known to play a major role in

5
the initialization and regulation of mineral deposit. These macromolecules such as
Osteonectin[7], Osteopontin[8], Dentin matrix protein 1[9], and Phosphophoryn[10] control the
nucleation and crystal growth. These proteins are extremely negatively charged, rich in aspartic
and glutamic acids, and serines which are often phosphorylated. The most studied family of non-
collagen proteins is the SIBLING protein family[11] .
Table 1 Major non-collagenous proteins in bone and dentin
Proteins originating in bone Proteins originating in dentin
Bone Acidic Glycoprotein 75 (Bag 75)
Bone Sialoprotein (BSP)
Osteopontin (OPN, SPPI, 2ar,
uropontin, Eta-1, 44 kDa phosphoprotein,
66 kDa phosphoprotein, 69 kDa
phosphoprotein [pp69])
Osteonectin (SPARC, ON)
Bone Gla Protein (BGP, Osteocalcin)
Matrix Gla Protein (MGP)
Decorin (PG II)
Biglycan (PG I)
DMP1
DSPP (low levels)
Dentin matrix protein 1 (DMP1)
Dentin sialophosphoprotein (Dentin matrix
DSPP)
Dentin proteoglycans (D-PG I, D-PG II)
Matrix Gla Protein (MGP)
Bone Gla Protein (BGP, Osteocalcin)
Osteopontin (OPN)
Osteonectin (SPARC, ON)

6
1.5 SIBLING PROTEINS
A family of non-collagenous proteins contains an RGD motif which can interact with cell-
surface integrins, and is termed Small Integrin-Binding Ligand, N-linked Glycoprotein
(SIBLING). The proteins that belong to the SIBLING family are: osteopontin (OPN), bone
sialoprotein (BSP), dentin matrix protein 1 (DMP1), dentin sialophosphoprotein (DSPP) which
gives rise to dentin phosphophoryn (DPP) and dentin sialoprotein (DSP), and matrix
extracellular phosphoglycoprotein (MEPE) [12]. These proteins, expressed in both bone and
dentin, are secreted into the extracellular matrix during bone/dentin’s formation and play a role
in matrix mineralization. They interact with integrin receptors and mediate cell attachment and
signaling. Their genes all are located in human chromosome 4q 21-23.
SIBLINGs are usually post-translationally modified by phosphorylation, glycosylation,
sulphation, and proteolytic processing. Such post-translational modifications and the high levels
of anionic amino acids make these proteins highly negatively charged; they can bind Ca2+ in
solution or calcium hydroxyapatite[13], and were shown to have the ability to specifically bind
collagen fibrils[14, 15]. Thus, these proteins may act as a linkage between the collagen fibril and
mineral crystal. Some studies suggest that SIBLINGs undergo conformational changes from
random coil to beta-pleated sheet and beta-turns in the presence of calcium [16, 17] .

7
Table 2 Post-translational modifications of Sibling Proteins [18]
Phosphate
(Pi/mol)
CHO
contents
N-Gly O-Gly SA TGCH Sulphation
OPN 13 16.6% detected detected 7.3% detected detected
BSP 5.85 50% detected detected 12% detected detected
DSP 6 29.5% detected detected 9% unknown unknown
HMW-DSP 10 detected detected detected detected unknown unknown
DPP 209 unknown unknown unknown unknown unknown unknown
DMP1-37K 12 unknown unknown unknown unknown unknown unknown
DMP1-57K 41 unknown unknown unknown unknown unknown unknown
1.5.1 Dentin Phosphophoryn (DPP)
The most abundant (>60% weight) non-collagenous protein produced by odontoblasts is dentin
phosphophoryn. Dentin sialophosphoprotein (DSPP) is a precursor protein and has been never
isolated from dentin extract. It is rapidly proteolytically processed to 3 proteins right after
synthesis: dentin sialoprotein (DSP), dentin glycoprotein (DGP) and dentin phosphophoryn (DPP)
which is rich in DSS repeat units, possibly by MMP-2 and MMP-20 [19]. (Figure 2)

8
Figure 2. Genomic organization of the mouse DSPP gene
Dentin sialophosphoprotein is a precursor protein. The whole mouse DSPP gene contains 5 exons, 4 introns,
promoter and untraslated region. Exons 2, 3 and 4 code for DSP and exon 5 codes for phosphophoryn
Figure 3 Scheme of different forms of DPP
The full sequence is full PP (exon 5). The black and red sequence is recombinant PP, the black sequence only we
named it C-stop PP
DPP is the most acidic protein known. It contains 143 aspartic acid, 20 glutamic acid and
291 serine in the mouse sequence, account for greater than 80% of total 557 amino acids,
recombinant DPP has a PI about 2.9 (non-phosphorylated form). Most of the serine residues can
be phosphorylated (highly 400res/1000 or moderately 250res/1000 of all amino acids in rat

9
DPP)[20]. DPP has the highest affinity for Ca2+ among all the matrix proteins studied. DPP was
shown to bind to the collagen fibrils at the mineralization front while binding to calcium[15].
Thus, the phosphate groups on DPP may play an essential role in mineralization formation by
providing the interface linkage of collagen and crystals.
1.5.2 Dentin Matrix Protein 1 (DMP1)
DMP1 is another acidic extracellular matrix protein containing 64 aspartic acid, 77 glutamic acid
and 115 serines out of total 503 amino acids. In comparison to DPP, DMP1 has a PI of 3.9.
Sequence analysis shows that about 66 serines could be phosphorylated by casein kinase II and
29 serines could be phosphorylated by casein kinase I. DMP1 gene is also located on 4q21.
Unlike DPP, DMP1 is found in both mineralizing (dentin, skeleton)[8] and non-mineralizing
tissues (brain, kidney and salivary gland)[21].
DMP1 is required for both odontogensis and osteogensis (Figure 4). DMP1 was firstly
shown to participate in biomineralization in MC3T3 cells, overexpression of DMP1 accelerated
cell differentiation to odontoblast and initiated mineralization[22]. DMP1 was also found closely
associated with the formation of bone nodule[23]. In proliferating preosteoblasts, DMP1 is
predominately unphosphorylated in the nucleus [9]. During osteoblast maturation it becomes
phosphorylated, and then secreted to the cytosol and extracellular matrix, where it orchestrates
mineralization. This phosphorylation is believed to be catalyzed by a nuclear isoform of Casein
Kinase II when Ca2+ surges into the nucleus [9]. Thus phosphorylation seems to play an essential
regulatory role in DMP1 function. Besides mineralization regulator, DMP1 also act as a
transcription regulator that initiates osteoblast differentiation [9].

10
Figure 4 DMP1 is required for both osteogenesis and odontogenesis
DMP1 is required for both osteogenesis and odontogenesis by controlling cell differentiation and maturation, as well as mineralization. Schematic from Qin et al. [24]
Similar to DSPP, full length DMP1 is cleaved to 2 functional fragments: 37kDa and 57kDa
(Figure 5, 6). The uniformity cleavages at X-Asp bonds suggest a single responsible proteinase
or a single proteinase group, which is still not known. Possible candidate include PHEX
(phosphate-regulating gene with homologies to endopeptidases on X chromosome) proteinase
[25], and BMP-1 (bone morphogenetic protein 1)/tolloid-like metalloproteinases [24]. These
enzyme(s) are widely expressed and are not tissue specific.

11
Figure 5 DMP1 is cleaved into 2 fragments
Full length DMP1 is cleaved at X-Asp bonds to 2 functional fragments: 37kDa (N-terminal) and 57kDa (C-terminal)
fragments
Figure 6 Scheme of different forms of DMP1
Total AA: 503. Signal peptide: 1-16aa. The whole sequence is called full DMP1; the c-terminal part with signal
peptide is c-DMP1. Signal peptide is required for in vivo study.
12
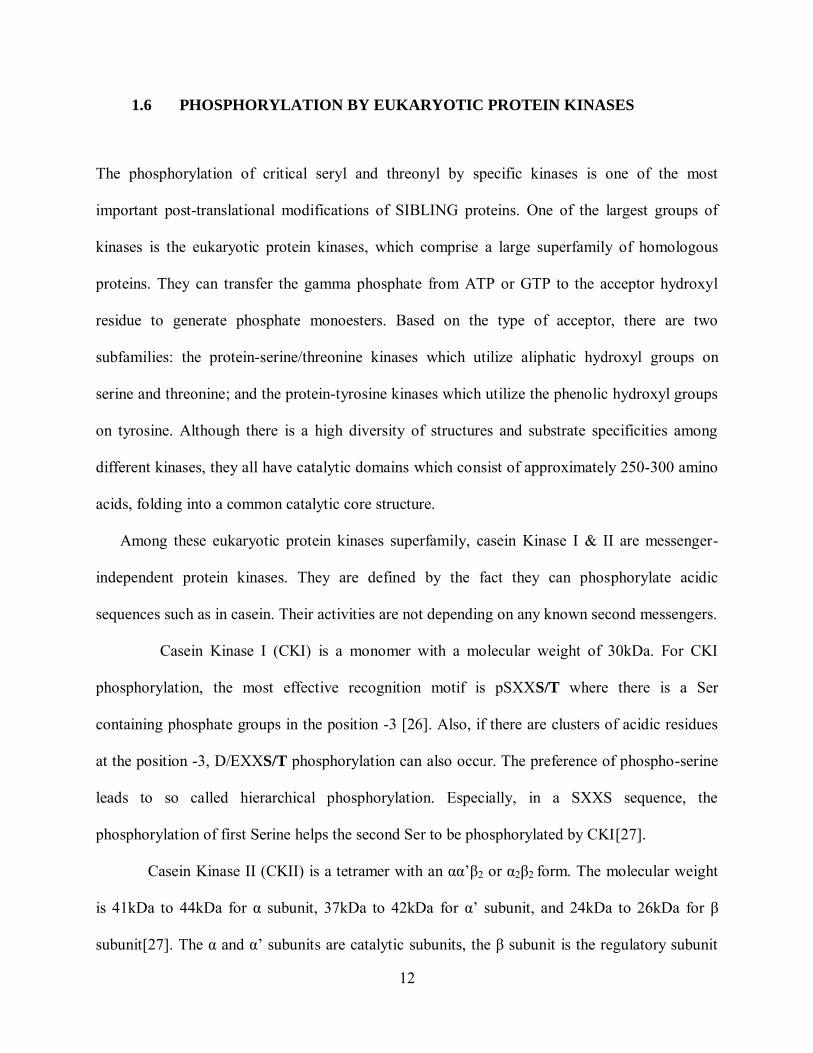
1.6 PHOSPHORYLATION BY EUKARYOTIC PROTEIN KINASES
The phosphorylation of critical seryl and threonyl by specific kinases is one of the most
important post-translational modifications of SIBLING proteins. One of the largest groups of
kinases is the eukaryotic protein kinases, which comprise a large superfamily of homologous
proteins. They can transfer the gamma phosphate from ATP or GTP to the acceptor hydroxyl
residue to generate phosphate monoesters. Based on the type of acceptor, there are two
subfamilies: the protein-serine/threonine kinases which utilize aliphatic hydroxyl groups on
serine and threonine; and the protein-tyrosine kinases which utilize the phenolic hydroxyl groups
on tyrosine. Although there is a high diversity of structures and substrate specificities among
different kinases, they all have catalytic domains which consist of approximately 250-300 amino
acids, folding into a common catalytic core structure.
Among these eukaryotic protein kinases superfamily, casein Kinase I & II are messenger-
independent protein kinases. They are defined by the fact they can phosphorylate acidic
sequences such as in casein. Their activities are not depending on any known second messengers.
Casein Kinase I (CKI) is a monomer with a molecular weight of 30kDa. For CKI
phosphorylation, the most effective recognition motif is pSXXS/T where there is a Ser
containing phosphate groups in the position -3 [26]. Also, if there are clusters of acidic residues
at the position -3, D/EXXS/T phosphorylation can also occur. The preference of phospho-serine
leads to so called hierarchical phosphorylation. Especially, in a SXXS sequence, the
phosphorylation of first Serine helps the second Ser to be phosphorylated by CKI[27].
Casein Kinase II (CKII) is a tetramer with an αα’β2 or α2β2 form. The molecular weight
is 41kDa to 44kDa for α subunit, 37kDa to 42kDa for α’ subunit, and 24kDa to 26kDa for β
subunit[27]. The α and α’ subunits are catalytic subunits, the β subunit is the regulatory subunit

13
with a potential metal-binding motif and can undergo N-terminal autophosphorylation. CKII can
phosphorylate serine and threonine when there is a cluster of acidic amino acids or
phosphoserine at position +3, S/TXXD/E or S/TXXpS[27]. As CKI, CKII also participates in
hierarchal phosphorylation schemes.

14
2.0 HYPOTHESIS
Non-collagenous proteins (NCP) of bone/dentin are rich in phospho-proteins that do appear to
play a major role in initiation and regulation of the mineralization process. These phospho-
proteins possess a sequence rich in D and S which has the potential to be phosphorylated.
Attention has been focused on studying the role of these proteins in mineralization, but the role
of phosphorylation of these proteins and corresponding effects in mineralization is not
understood.
The goal of this research is to elucidate the mechanisms involved in phosphorylating the
highly phosphorylated proteins of bone and dentin, Emphasis will be placed to phosphorylation
of DPP and DMP1 since they are the most phosphorylated proteins in the bone/dentin
extracellular matrix. These data will be critical to prove the general hypothesis of our research
that the phosphorylation level of non-collagenous proteins play a significant role in matrix-
mediated mineralization.

15
3.0 MATERIAL AND METHODS
3.1 REAGENTS AND MATERIALS
[γ- 32P] ATP of specific activity was purchased from ICN Biomedical Inc. Reagents for SDS-
polyacrylamide gel electrophoresis was obtained from Bio-Rad. Casein Kinases’ assay kit was
obtained from Millipore. All other chemicals for phosphorylation assays, subcellular fractions
and zymogram were purchased from Sigma. All medium for cell culturing are from GIBCO.
3.2 RECOMBINANT PROTEIN PURIFICATION
3.2.1 Constructs and mutation
Several forms of DPP were used for in vitro phosphorylation as shown in figure 3,
- Original recombinant PP (rPP) plasmid PGEX-4T-3-pp was cloned by Dr. Sfeir. This
clone was designed to include the [DSS] repeats, but it lacked the N-terminal end of the
protein.
- C-stop rPP is made by inserting a stop codon to PGEX-4T-3-pp using Quikchange XL
site-Directed Mutagenesis Kit (STRATAGENE Catalog # 200517) using the following

16
primers: Primer 1 (5' gttctgacagcagt tag ggtgacagcaagtctg 3’) and primer 2 (5'
cagacttgctgtcacc cta actgctgtcagaac 3') (Table 3).
Table 3 Cycles of PCR
Segment Temperature Time cycles
1 95°C 1 minute 1
2
95°C 50 seconds
18 60°C 50 seconds
68°C 8 minutes (1 min / Kb of plamid)
3 68°C 7minutes 1
4°C
- Full length DPP (fPP) was generating by cloning the full length of exon 5 which includes
the N-terminal end. (Figure 3).C-stop fPP is made using the same methods as C-stop rPP
The C-terminal and full length DMP1 clones were obtained from Dr. Jian Feng’s Laboratory at
Baylor school of Dental Medicine.
All mutations (Figure 3) were confirmed by Sequencing in Proteomics & Genomics Core Lab,
University of Pittsburgh.

17
3.2.2 Recombinant protein purification
All clones were transformed into BL21 bacteria, and were cultured in autoclaved Luria Broth
with 50ug/ml ampicillin, 37°C. Protein expression was induced by adding 0.1mM IPTG to
cultured BL21 with an OD 0.8, then culture for another 4 hours. After 10,000 RPM
centrifugation for 45min at 4°C in JA-12 rotor, bacteria (pellets) were collected and sonicated,
treated with 1% Triton X-100, 0.06% beta-mercaptoethanol and 10mM MgCl2. GST sepharose
4B beads. GST-tag protein was eluted in 10mM Glutathione, 1M Tris pH8.0 or further cleaved
by biotinylated-thrombin.
Purified proteins were dialyzed in ddH2O using Amicon Ultra-15 Ultracel-10K (Millipore)
and centrifuged at 5000g, 30min, 3 times. Protein concentrations were measured using a BCA kit.
3.3 TISSUE CLUTURE OF CELLS
MC3T3 were cultured in Minimum Essential Medium-alpha Medium. MDPC23 were cultured in
alpha-modified medium. NIH3T3, Hela, 293 were cultured in DMEM. All media were
supplemented with 10% fetal bovine serum, 10% L-Glutamine and 10% Penicillin-streptomycin.

18
3.4 DMP1 PURIFICATION FROM CELLS
Cells were grown to 80% confluence in normal media, then serum free media was used, and 10ul
of adenovirus-CMV-DMP1 (2x10¹² pt/ml) per 150mm plate was added. The cells were
maintained in culture for 48 to 96 hours, the cell media was collected, concentrated and buffer
exchanged in 6M urea in 20mM Tris-HCl, using Amicon Ultra-15 Ultracel-10K (Millipore).
Cells were trypsinized with 0.05% trypsin, 0.53mM EDTA (Gibco-BRL), then washed and
collected in lysis buffer containing phosphatase inhibitor cocktail (50mM NH4HCO3, 5mM
TCEP, 1mM EDTA, 1mM PMSF and protease inhibitor cocktail (5mM Sodium Orthovanadate,
10mM NAF, 25mM beta-Glycerophosphate). Homogenization was carried out on ice in a glass
homogenizer at low speed 333 rpm (Glas-Col, LLC) for about 30 strokes. The cell lysate was
then subjected to a exchange buffer to 6M urea in 20mM Tris-HCl.
The cell media or cell lysate in 6M urea, 20mM Tris-HCl were loaded onto ion-exchange
column (HiTrapTM Q FF 5ml column from GE Healthcare) using an FPLC(AKTA primer plus
from GE Healthcare). The gradient used to elute the proteins was 0.1M NaCl (Buffer A) to 1M
NaCl (Buffer B) in 80min. Fractions corresponding to each peak were collected and analyzed by
SDS-PAGE and stains-all stain.
Buffer A: 6MUrea in 20mM Tris-HCl+0.1M NaCl (pH=7.2)
Buffer B: 6MUrea in 20mM Tris-HCl+1M NaCl (pH=7.2)

19
3.5 CELL CYTOSOLIC AND MEMBRANOUS FRACTIONS PREPARATION
The MC3T3 /MDPC23 cells were collected (4X10⁶ cells/flask), trypsinized with 0.05% trypsin,
0.53mM EDTA(Gibco-BRL), washed and homogenized in a solution of 50mM Tris-Hepes
pH7.4, 1mM EDTA, 10mM Manitol, 1mM Dithiothreitol, 1 pill of Complete Protease inhibitor
cocktail tablets(Roche Applied Science). Homogenization was carried out on ice in a glass
homogenizer at low speed 333 rpm (Glas-Col, LLC) for about 30 strokes. The homogenate were
centrifuged at 1,000g for 20min to sediment the nuclei and cell debris. The low speed pellet
(nuclei and cell debris) and supernatant were collected separately. The supernatant was further
centrifuged at 100,000g for 30min to obtain the cytosolic and membranous fractions. All these
fractions were stored at -80°C and thawed before their use for zymogram analysis or in vitro
phosphorylation assays. Figure 7 shows the cell fractionation scheme. We used supernant 2 for
zymogram analysis and used pellet 1, pellet 2 and supernant 2 for in vitro phosphorylation
assays.

20
Figure 7 Strategy for subcellular fraction
The cells were collected and homogenized and centrifuged. The low speed pellet (nuclei and cell debris) and
supernatant were collected separately. The supernatant was further centrifuged at 100,000g for 30min to obtain the
cytosolic and membranous fractions.
3.6 IN VITRO PHOSPHORYLATION
3.6.1 In vitro phosphorylation by CKI and CKII
The in vitro phosphorylation reaction was carried out in 40ul total volume, containing 10ul
assay dilution buffer I (20mM MOPS, pH7.2, 25mM beta-glycerol phosphate, 5mM EGTA,
1mM sodium orthovanadate, 1mM dithiothreitol), 100ng Casein Kinase I or Casein Kinase II,
dialysed protein substrate, ddH2O, 10µl 1µCi/µl Mg/ATP and [-32P] mixture. The reaction
solution was incubated for a range of time (30min to overnight) in a shaker incubator at 30°C or
37°C. The controls consisted of carrying out the phosphorylation reaction with the enzyme only

21
(sample with enzyme but no protein substrate) and a protein only control (sample with protein
substrate but no enzyme).
3.6.2 In vitro phosphorylation by cell fractions
Cell fractions were prepared as described in section 3.5. Insoluble fractions such as pellet 1,
pellet 2 were treated with Triton X-100 at 4°C for 1hour, then the sample was centrifuged at
1000g for 5min and then the supernatant was collected. The soluble fractions were added to the
reaction solution directly. Each reaction tube contains 10ul ADBI buffer (Assay Dilution Buffer I
as suggested by company), cell fractions, 10µl 1µCi/µl Mg/ATP and [γ-32P] mixture. The
reaction solution was incubated for a range of time (30min to overnight) in a shaker incubator for
30°C or 37°C.
3.6.3 Phosphorylation quantification by scintillation counter
3.6.3.1 Measurement on P81 paper square
Upon completion of the phosphorylation reaction, 25 µl were transferred onto the center of a
2cmx2cm P81 paper square. The radiolabeled solution was allowed to bind to the filter paper.
The P81 paper square was washed 3 times with 40ml 0.75% phosphoric acid in a 50ml conical
tube. The P81 paper was gently shaken for 5 minutes per wash on a rotator. Then the P81 paper
was washed with 20ml acetone and shaken for 5 minutes. All washes were discarded in a liquid
radioisotope waste container. The P81 paper square was then allowed to drain for 5 min and then
transferred to a scintillation vial where 5ml scintillation cocktail was added and the radioactivity
was quantified using a scintillation counter.

22
3.6.3.2 Measurement using centrifugal filter devices
Upon completion of the phosphorylation reaction, the total volume was transferred to a 10kD
microcon centrifugal filter devices (Millipore), ddH2O was added to a final volume of 200µl,
then centrifuged at 14,000xg for 30min. The filter was washed again in 200µl ddH2O,
centrifuged at 14,000 x g for another 30min. The filter device was removed from the eppendorf
tube and placed directly into the scintillation vial. 5ml scintillation cocktail was added, and
radioactivity was quantified in a scintillation counter.
3.6.4 Phosphorylation detection by SDS-Gel
Upon completion of the phosphorylation reaction, 8 µl of 6x Loading buffer (0.35M Tris-HCl
PH6.8, 10.28% SDS, 36% glycerol, 0.6 MDTT, 0.012% Bromophenol blue) was added to the
each 40 µl reaction sample and then boiled for 5min at 95°C. The samples were loaded on an 8%
SDS-PAGE and run for 2hour at 100V. The gel was then dried on filter paper (Bio-rad) using
Model 583 Gel Dryer (Bio-Rad) and exposed to Kodak X-Omat Blue XB-1 film to detect labeled
bands.

23
3.7 MASS SPECTROMETRY
3.7.1 In gel digestion
Typically, samples were run in an 8% SDS-gel at 90V for 30 minutes and then 120V for 90
minutes. Following the staining and destaining procedures, gel bands of interest were excised
and collected pieces in a 600 µl tube. 100 µl of 50% Acetonitrile, 50mM Ammonium
bicarbonate were added, we made sure the gel were well soaked, shook at room temperature for
30 minutes, the washing step was repeated twice. Finally, we added 50 µl of 100% Acetonitrile,
then shook the sample for 5min, and dry the gel in Speed Vac.
The dried gel pieces were reduced in 100 µl of 2mM Tris (2-carboxyethyl) phosphine
(TCEP), 25mM Ammonium biocarbonate (pH 8.0), and incubated for 15 minutes at 37°C. The
gel pieces were then alkylated in 100 µL of 20 mM iodoacetamide, 25 mM ammonium
bicarbonate (pH 8.0) and incubate for 30 minutes at 37°C in the dark. After reduction and
alkylation, the supernatant was discarded, the gel band was washed three times with 200 µL of
25 mM ammonium bicarbonate, and each time the sample was shaken for 30 minutes. Then 50
µL of acetonitrile was added, shaken for 5 minutes and dried in a Speed Vac.
The gel slice was digested with trypsin. To allow the concentrated trypsin to diffuse into
the gel slice, the gel was rehydrated in 10 µl from a stock solution of 0.02 µg/µl of Promega
Sequencing grade modified trypsin in 10% Acetonitril, 40 mM NH4HCO3 pH 8 for 1 h on ice.
The excess of trypsin that hasn't been absorbed into the gel slice was removed, the gel slice was
then covered with 50 µl of 10% Acetonitril, 40 mM NH4HCO3 pH 8.0, and was placed in a
shaker incubator at 37°C overnight.

24
The peptides generated from the trypsin digestion were extracted by transferring the
supernatant to a fresh tube, adding 50µl of 50% Acetonitril, 5% Fomic acid to gel slice and
shaking the samples for 30minutes at 37°C. This step was repeated twice to extract more
digested material. The extracted samples were then dried in Speed Vac, then resuspended in 200
µl H2O, to be dried a second time in the Speedvac to remove all ammonium biocarbonate and
Acetonitrile. The digestion was finally cleaned by ziptipC18 if necessary.
3.7.2 In solution digestion
Protein samples were desalted using desalting column (Pierce), concentrated using a speedvac,
add 25 mM ammonium bicarbonate to 40µl, sample is reduced by adding 1.2 µl of 100 mM
TCEP (tris-2-carboxyethyl-phosphine) to 5mM final, shake for 15 minutes at 37°C. 0.88 µl of
500 mM IAA (Iodoacetamide) was added to 10 mM final concentration and was shaken in the
dark for 30 minutes. The remaining IAA was neutralized by adding 20 ul of TCEP stock,
vortexed, spun, and incubated at room temp for 45 min. Then added trypsin to sample ratio
should be between 1:50 to1:20. Digestion was allowed to incubate at 37°C overnight. Digestion
was acidified by adding formic acid to stop the reaction and then dried in Speed Vac and cleaned
by ziptipC18 if necessary.
3.7.3 MALDI-TOF MS
For MALDI-TOF-MS analysis, the peptides and CHCA matrix (a-Cyano-4-hydroxycinnamic
acid, about 10 µg/ µl, in 50%ACN and 0.1% TFA) solutions were premixed in a small
Eppendorf tube, spun down and mixed 3 times, and applied directly to the sample plate. Once the

25
sample is applied to the sample support, the sample was allowed to air dry. Other matrix such as
Trihydroxyacetophenone (THAP), 3, 5-Dimethoxy-4-hydroxycinnamic acid (sinapinic acid)
prepared according to Voyager instruction were also used in this study. The samples were all
analyzed using the Voyager DE Pro (ABI) or 4700 TOF TOF (ABI) instruments.
3.7.4 LC-ESI MS
For LC-ESI MS analysis, samples were dissolved in 0.1% formic acid, run through a C18
column. The buffer A contained 0.1% formic acid in water while buffer B contains 0.1% formic
acid in acetonitrile. Experiments were conducted on LCQ-DECA-XP (ThermoFinnigan) and
LTQ-XL (ThermoElectron) instruments.
3.8 ZYMOGRAM
3.8.1 Detection of the kinase activity after 1-Dimension SDS-PAGE
The cell fractions were prepared as described in section 2.5, and mixed with 6X loading buffer
(0.35M Tris-HCl PH6.8, 10.28% SDS, 36% glycerol, 0.6 MDTT, 0.012% Bromophenol blue).
The mixture was electrophoresed on an 8% SDS-pollyacrylamide gel containing 60 µg/ml of
DMP1. The DMP1 protein was added to the SDS-PAGE prior to polymerization. Following the
sample electrophoresis at 100V for 2 hours in an 8x8 cm gel, the SDS was removed first by
washing the gel in 100 ml 20% iso-propanol in 50mM Tris-HCl, pH8.0 for 1 hour, this step was
repeated once. Then the gel was washed with 250ml of 50mM Tris-HCl, pH 8.0 containing 5mM
26
2-beta mercaptoethanol for 1 hour at room temperature. The enzyme within the gel was
denatured by treating the gel with 100ml 6M HCl-Guanidine for 1 hour at room temperature, and
this denaturing wash was repeated a second time. Following the denaturation of, the enzyme, the
enzyme was renatured by five washes of 250ml 50mM Tris-HCl, pH 8.0 containing 5mM 2-β
mercaptoethanol and 0.04% Tween 40 at 4°C for total 16 hours.
To detect the enzyme activity in the cell fractions, the gel was incubated overnight in
60ml phosphate buffer solution, which contains 50mM Tris-HCl, pH7.4, 5mM MgCl, 10mM
beta-glycerophosphate, 50µM ATP and 300µCi [-32P] ATP.
After incubation, the gel was washed in a buffer containing 5% trichloroacetic acid
solution and 1% sodium pyrophosphate 7 times, until the radioactivity of the solution became
negligible. The gel was then dried on filter paper (Bio-Rad) using Model 583 Gel Dryer (Bio-
Rad) and exposed to Kodak X-Omat Blue XB-1 film to detect labeled bands. Usually 3 hours or
longer (overnight) exposure was required for detection.
3.8.2 Kinase identification using mass spectrometry
The radioactive gel was stored in -80°C for one month for the radioactivity to decay. The gel
bands corresponding to labeled bands were excised, and then treated as described in section 2.7.1.

27
4.0 RESULTS AND DISCUSSION
In order to study the level of phosphorylation of PP and DMP1, we generated different forms
(Figure 3, Figure 6) of these two proteins as described in section 3.2.
Full length DPP (fPP)
Recombinant PP (rPP): the N-terminal sequence was deleted from the fPP. This protein is
primarily made of the [DSS] repeats
C-stop PP (cPP): the C-terminal sequence was deleted from rPP by inserting a stop codon
following the DSS repeat sequence.
In regards to DMP1, we studied the two different forms of DMP1 based on the identified
cleavage site. [23]. The full length DMP1 is called fDMP1, and the c-terminal region with signal
peptide is called cDMP1 which is where the phosphorylation sites are located.
4.1 MASS SPECTROMETRY OF PP
In order to study the phosphorylation of PP by mass spectrometry, we digested the
unphosphorylated rPP first. For rPP, which has extensive DSS repeat, we used EXPASY to
identify the enzyme lists which might be able to cleave rPP. (Table 4)

28
Table 4 List of enzymes and chemicals that might cleave rPP
Enzymes can cleave rPP #. of Cleavages Positions Cleavage sites
Arg-C proteinase 1 5 Arg-C
Chymotrypsin Y, F, W (preferred)
/L, M, H/A, D, E –C
Clostripain 1 5 Arg-C
Asp-N endopeptidase ALL D N - Asp
Lys-N/Lys-C 4 53 70 415 427/5
4 71 416 428
N-Lys/Lys-C
Proteinase K 7 8 10 11 26 132
250 457
Y, F, W-C
Hydroxylamine 2 44 431 Asn-Gly
Trypsin 4 5 71 416 428 K,R-C
Endo Glu-c 9 1 14 28 50 52
56 69 283 449
Glu-C
NTCB (2-nitro-5-
thiocyanobenzoic acid)
2 132 179 N-Cys
Thermolysin 2 25 249 N-A,I,L,V,M,F
D,E-Xcan’t be cleaved
Formic acid ALL D D-C (preferred) /N-D

29
Based on the data shown in Table 4, we concluded that PP would be hard to digest/cleave,
the numbers of enzymes/chemicals that can cleave PP were limited, and most of them can only
cut very few sites. We tried all enzymes and chemicals listed in this table except the ones that
display only one cleavage site (Thermolysin, Arg-C proteinase, Clostripain, Hydroxylamine) , or
LysN/C which would produce peptide either too small or too large for mass spectrometry
analysis. Figure 8 shows the SDS gel of fPP after digestion by proteinase K, chymotrypsin, asp-
N, Endo-GluC and Trypsin. The disappearance of protein band and appearance of some smaller
bands suggest that the protein was digested. From this gel, we observed that AspN, proteinase K
and formic acid (data not shown) completely cleaved fPP, while trypsin, chymotrypsin and endo-
GluC cleaved fPP to a certain extent. fPP was not cleaved at all by NTCB(data not shown)
Figure 8 fPP cleaved by enzymes and chemicals
AspN and proteinase K completely cleaved fPP, while trypsin, chymotrypsin and endo-GluC cleaved fPP to a
certain extent.

30
Based on the SDS gel result, we digested rPP using trypsin, chymotrypsin, Endo-GluC
separately or together. We also used asp-N, formic acid digestion at different time points, from 1
hour to 18 hour. The digested protein was then analyzed by mass spectrometry using different
matrices such as CHCA, THAP and SA, however, we couldn’t obtain any peptide signal from
rPP. This might be due to the acidic nature of rPP which makes the peptide highly negative
charged. Another possibility could be due to the improper peptide size following digestion, e.g,
peptides produced by Asp-N are too small, and peptides produced by trypsin are too large.
4.2 MASS SPECTROMETRY OF DMP1
cDMP1, which is less acidic than rPP and contains more amino acids other than “DSS” repeat,
have been successfully digested and analyzed. Theoretically, the combination of 2 enzymes
(Trypsin and AspN) can digest 95% of DMP1. Figure 9 and Figure 10 show cDMP1 digested by
Trypsin/AspN and analyzed on ABI 4700 MALDI-TOF-MS. Peptides signal identified are
labeled.

31
Figure 9 cDMP1 digested by trypsin
Green labels represent numbers of DMP1 amino acids in identified fragments。Coverage: 31%
Identified peptide Expected ms Observed ms Amino acid position
GELTDSNSR 978.4 978.4 87-95
SQESQSEQDSR 1280.5 1280.5 241-251
SEEDSDSQDSSR 1341.5 1341.6 252-263
ETQSDSTEDTASKEESR 1899.8 1899.8 96-112
EPTSTQDSDDSQSVEFSSR 2101.8 2101.8 54-72
SKEESNSTGSASSSEEDIRPK 2225.0 2225.1 264-284
GDREPTSTQDSDDSQSVEFSSR 2430.0 2430.0 51-72
SEESKGDREPTSTQDSDDSQSVEFSSR 2990.3 2990.1 46-72

32
Figure 10 cDMP1 digested by AspN
Green labels represent numbers of DMP1 amino acids in identified fragments.Coverage:48%
Identified peptide Expected ms Observed ms Amino acid position
DSRKLIV 830.5 830.6 289-295
DYRGELT 853.4 853.5 84-90
DDPESTRS 906.4 906.4 25-32
DIRPKNMEA 1089.5 1089.6 280-288
DAYHNKPIG 1014.5 1014.5 296-304
DTASKEESRSESQE 1582.7 1582.8 104-117
DSSRSKEESNSTGSASSSEE 2060.8 2060.9 260-279
DSQSVEFSSRKSFRRSHVSE E 2484.2 2483.0 63-83
DSSSQEGLQSQSASTESRSQ ESQSEQ 2787.2 2787.2 223-248
DGDSSSQEGLQSQSASTESRSQESQSEQ 2959.1 2959.3 221-248
DPSSESSEEAGEPSQESSSESQEGVTSESRG 3172.3 3172.3 133-163
DSPEGQDPSSESSEEAGEPSQESSSESQEGVTSESRG 3785.5 3785.6 127-163

33
4.3 IN VITRO PHOSPHORYLATION OF PP
When we performed the in vitro phosphorylation of PP by CKI, we determined that the
phosphorylation level detected using the scintillation counter technique is very low, e.g, only
about 4 phosphates per molecule. When we determined the in vitro phosphorylation of both cPP
and fPP using the scintillation counter, we obtained much higher phosphorylation levels than rPP
(Figure 11) However, when we loaded the radio-labeled proteins on an SDS-PAGE, fPP showed
less phosphorylation level than rPP while cPP still has higher levels of phosphorylation. These
results suggest that PP might be too acidic to bind the negative charged P81 paper, the reason
why fPP has higher level might due to stronger binding ability to P81 paper. The low binding
might also be the reason of low phosphorylation level detected using scintillation counter. The
low binding scenario was confirmed when we synthesized peptides based on the PP sequence
that we then phosphorylated in vitro. The acidic peptide with only DSS repeat couldn’t be
detected by scintillation counter, whereas, the phosphorylation of the modified peptide with a
basic N-terminus could be detected and quantified.
Since using the scintillation counter method to quantify the level of phosphorylation did
not seem to be adequate we then decided to use a Microcon centrifugal filter device instead.
Following three washes of the sample, the excess 32P[ATP] could not be removed which yielded
a very high background. So far to determine the phosphorylation of PP is still unresolved.
Although we couldn’t quantify the total amount of phosphate or the number of
phosphorylation sites using mass spectrometry, we used radioactive 32P[ [ATP] in combination
with an SDS-PAGE to quantify the amount of phosphate using densitometry. The radioactive
SDS-PAGE gel (Figure 12) shows that the cPP phosphorylation was enhanced compared to rPP

34
phosphorylation. Quantification by densitometry using Kodak 1D software (Figure 13) shows
that the deletion of the c-terminus could enhance the phosphorylation level to about 1.5 times of
rPP.
The phosphorylation reaction was carried out by different enzymes kinases (Figure 14)
shows that CKI could phosphorylate rPP much more than CKII, although sequence analysis
suggest CKII is preferred than CKI; the combination of CKI+CKII did not show much
phosphorylation enhancement. We also tested different time scales to phosphorylate rPP by CKI
(Figure 15), the data shows that the phosphorylation level increases with longer incubation time.
Based on these assay results, we used CKI to phosphorylate the c-stop PP and incubated
it for 23 hour or longer to get higher phosphorylation levels in our related mineralization study.
Figure 11 Comparison of in vitro phosphorylation of different PP forms
Same mole amount rPP /fPP /c-stop PP are compared by scintillation counter.These differences might come from
the different ability of different PP forms to bind to the P81 paper; it couldn’t represent the different phosphorylation
level. The comparisons by SDS-gel below are more accurate.

35
Figure 12 In vitro phosphorylation of different PP forms by CKI
Same mole amount rPP /fPP /c-stop PP phosphorylation level are compared by radioactive SDS-Gel. This method of
relative comparison of PP phosphorylation might be more accurate than the scintillation counter method. As the
SDS-PAGE analysis circumvents the possible lack of PP binding to P81 paper needed for scintillation counter
analysis. The phosphorylation level of cpp is higher compared to rpp and fpp. Fpp is the lowest.
Figure 13 Quantified comparison of in vitro phosphorylation of different PP forms by CKI
Same mole amount rPP /fPP /c-stop PP phosphorylation level are compared by radioactive SDS-Gel as in figure 12;
these experiments are repeated 3 times and quantified by Kodak 1D software.

36
Figure 14 Comparison of rPP phosphorylated by different enzymes
This data shows that CKI has the ability to phosphorylate rPP much more than CKII, although sequence analysis
suggest CKII is preferred than CKI; the combination of CKI+CKII did not show a strong phosphorylation synergy
between both enzymes.
Figure 15 In vitro phosphorylation of rPP by different time scale
In vitro phosphorylation of rPP by CKI yielded higher 32P incorporation onto rPP at longer incubation time when
assessed by radiolabelled SDS-PAGE. Compared to 30min (normailized as 1), the phosphorylation level at 1h is
1.69, 2h is 1.82, 3h is 1.94, 23h is 2.05.
Since PP was proved difficult to analyze by mass spectrometry, we shifted our attention
to DMP1 to study its phosphorylation and ultimately the effect of phosphorylation on
mineralization.

37
4.4 IN VITRO PHOSPHORYLATION OF DMP1
Our goal is to phosphorylate DMP1 and identify the phosphorylation sites in DMP1 with various
levels of phosphorylation. We first study in vitro phosphorylation of fDMP1 and cDMP1 which
both showed similar level of phosphorylation. We then decided to focus only cDMP1
phosphorylation since it contains most of the phosphorylation sites. To optimize the in vitro
phosphorylation of cDMP1, we assessed the phosphorylation level by using different conditions
including temperature, type of enzyme, time, and Ca2+ concentration.
The phosphorylation reaction was carried out at 30ºC (the recommended temperature by
the enzyme manufacturer) and 37ºC (body temperature of mice). The level of phosphorylation of
cDMP1 at 30ºC and 37ºC remains the same when assessed by scintillation counter (Figure 16).
The phosphorylation reaction was also carried out using different enzymes, although
sequence analysis shows that CKII would phosphorylate more sites than CKI (Figure 17), our
data shows that CKI phosphorylated cDMP1 about 5 folds more than CKII.
The phosphorylation reaction was carried out at different time scales; Figure 18 shows
that the phosphorylation level of cDMP1 increases with longer incubation time.
The phosphorylation reaction was assessed at different calcium concentration, the
increase of calcium, up to 2mM Ca++ seems to enhance the phosphorylation activity of CKI; if
the calcium phosphorylation is >2mM then the phosphorylation activity was reduced as shown
in Figure 19. This enhancement under 2mM of Ca++ might be due to the confirmation change of
DMP1 and the formation of DMP1-Ca complex[16, 17]. However, when higher calcium
concentration were used (>2mM), this might trigger DMP1 polymerization, which might explain
the decrease in the ability of the kinase to phosphorylate the protein.

38
The phosphorylation reaction was also assessed at different magnesium concentration;
the phosphorylation level increase between 1mM to 10mM, higher (>30mM) Mg++
concentration inhibit the phosphorylation ability of the protein kinase, which might be due to the
polymerization of the protein similar to the high Ca++ concentration (Figure 19).
Figure 16 In vitro phosphorylation of cDMP1 at different temperatures
The level of phosphorylation of cDMP1 at 30ºC and 37ºC (1 hour incubation) remains the same when assessed by
scintillation counter

39
Figure 17 In vitro phosphorylation of cDMP1 by CKI and CKII
CKI phosphorylated cDMP1 about 5 folds more than CKII when assessed by scintillation counter.
Figure 18 In vitro phosphorylation of cDMP1 at different time points
In vitro phosphorylation of cDMP1 by CKI shows higher phosphorylation level with longer incubation time
assessed by radiolabelled SDS-PAGE. Compared to 30min (normailized as 1), the phosphorylation level at 1h is
1.50, 2h is 1.51, 3h is 1.68, 23h is 1.85.

40
Figure 19 In vitro phosphorylation of cDMP1 with different Ca2+ (upper) or Mg2+ concentration
The phosphorylation reaction was assessed at different calcium concentration, the increase of calcium, up to 2mM
Ca++ enhances the phosphorylation activity of CKI; if the calcium phosphorylation is >2mM then the
phosphorylation activity was reduced. One way ANOVA suggests the phosphorylation level with 2mM Ca++ is
significantly higher (P= 0.08) compared to the group without Ca++.(Assessed by radiolabelled SDS-PAGE); At
different magnesium concentration; the phosphorylation level increase between 1mM to 10mM, higher (>30mM)
Mg++ concentration inhibit the phosphorylation ability of the protein kinase. (Assessed by pro-Q stained SDS-
PAGE)

41
Determination of protein phosphorylation by Mass spectrometry is a challenging technique.
ESI (Electro spray ionization) is usually a more sensitive method than MALDI (Matrix-assisted
laser desorption/ionization). This is due to the weak signal from phospho-peptides; it is difficult
to obtain good ms/ms spectra using MALDI. On the other hand one advantage of the ESI
method is that the phospho-peptides are separated from other peptides by using Liquid
Chromatography prior to detection, which reduce the interference from the large excess of other
peptides and enrich for the phospho-peptides. ESI has also some shortcomings, 1) large
phospho-peptides are not easily eluted from the LC column 2) small phospho-peptides are
eluted very early with salt which largely compromised the quality of MS spectra 3)
H3PO4 is easily lost in ion trap of any MS machine, which makes it more difficult to identify the
phospho-sites. In our experiment, we combined both MALDI and ESI to obtain more phospho-peptide
information. Data from 4700(MALDI, CID) mass spectrometry analysis of cDMP1
phosphorylated by CKI show 6 phospho-peptides (Figure 20, Table 5); data from LTQ-XL (ESI,
ETD) (Figure 21) and LCQ-Deca-xp (ESI, CID) (Figure 22) confirmed some of these phospho-
peptides and also identified Ser66 as phospho-serine (Figure 22).

42
Figure 20 MS of phosphorylated cDMP1 (phospho-peptides circled)
4700 mass spectrometry analysis detected 6 phospho-peptied (circled in Figure 20 and listed in Table 5) from
cDMP1 phosphorylated by CKI.

43
Table 5 Phospho-peptide of in vitro phosphorylated cDMP1 detected by MS
(M-MALDI, E-ESI)
Sequence mass position Method Missed
cleavage
SEEDSDSQDSSR 1341.5037 252-263 M 0
SKEESNSTGSASSSEEDIRPK 2225.0164 264-284 M 1
GDREPTSTQDSDDSQSVEFSSR 2430.0287 51-72 M,E 1
SQESQSEQDSRSEEDSDSQDSSR 2603.0208 241-263 M,E 1
SEESKGDREPTSTQDSDDSQ
SVEFSSR
2990.2729 46-72 M,E 2
SESQEDTAESQSQEDSPEGQ
DPSSESSEEAGEPSQESSSE
SQEGVTSESR
5264.0780 113-162 M 0

44
Figure 21 Phosphor-peptide 3071(1023.85*3) by LTQ-ESI MSn
(Upper right) MS2 of a peptide ion at m/z 1023.85 – little in terms of fragmentation information due to the
predominant neutral loss of H3PO4.Neutral Loss Dependent MS3 – 991.8 is “re-selected” for fragmentation (i.e.
MS/MS/MS) producing significant sequence information to identify: SEESKGDREPTSTQDSDDSQSVEFSSR.

45
Figure 22 Phospho-peptide 2510(838.32*3) by LCQ-ESI MS2
Sequence identified: GDREPTSTQDSDDSQSVEFSSR, y7(891.4) is a phospho-fragment while y6(724.3) is a non-
phospho-fragment. 891.4 to 792 show a neutral loss of H3PO4.
4.5 ZYMOGRAM
Sequence analysis and previous studies have showed that CKII-like enzyme from the nucleus
can phosphorylate DMP1; however, no direct identification of CKII was reported to date. Since
we couldn’t fully phosphorylate DMP1 using CKII in vitro, and considering the hierarchal

46
property of CKII, we hypothesized that CKII or other enzymes could phosphorylate DMP1 in
vivo.
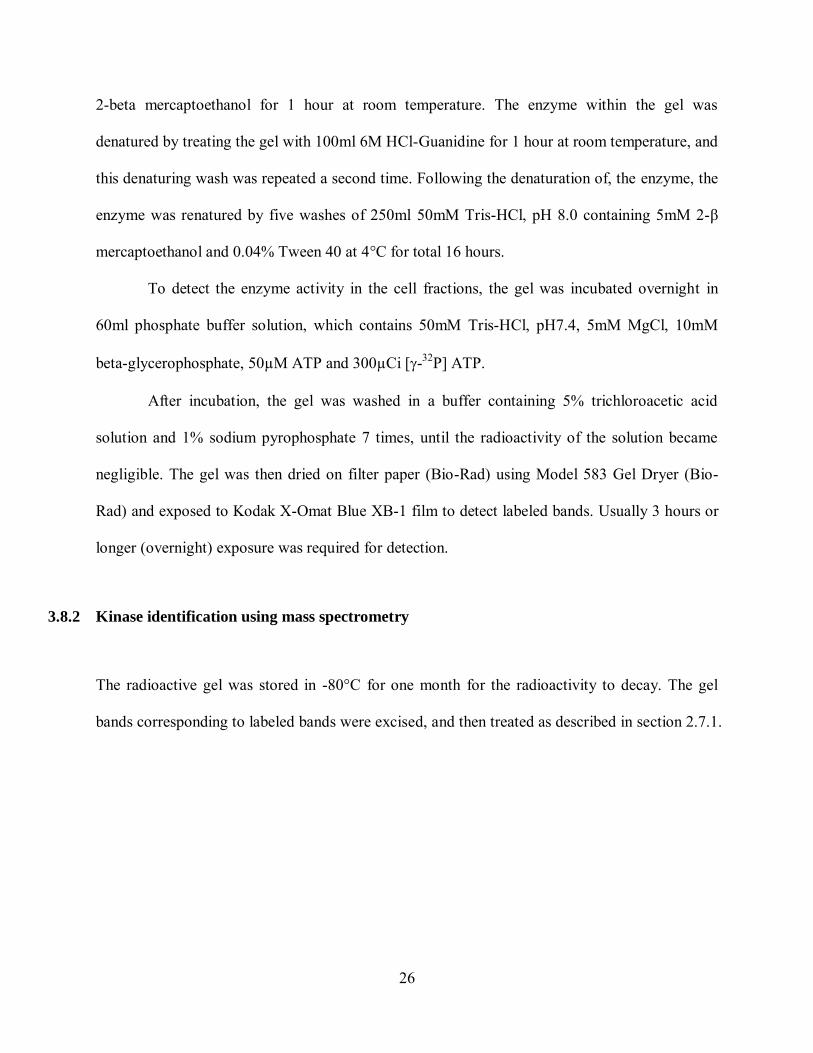
Firstly, we performed in vitro phosphorylation and confirmed that cellular fractions
could phosphorylate cDMP1 (Figure 23).We collected cell lysates from MC3T3 (osteoblast),
MDPC23 (odentoblast), NIH3T3 (fibroblast) and performed zymograms to find the
corresponding enzyme band(s) that can phosphorylate DMP1. All 3 samples showed 3 bands
exactly at the same positions (Figure 24). This zymogram experiment was repeated once. We
concluded that there is no significant difference of kinases responsible for fDMP1 in
mineralizing tissues versus non mineralizing tissues. At least 3 enzymes could phosphorylate
fDMP1 in these cell lines, with molecular weight around 37, 40, and 60kDa, respectively. The
radioactive bands were excised and analyzed by mass spectrometry; the lists of identified
proteins included many protein kinases. DMP1 was also identified during the mass spectrometry
analysis confirming that our digestion worked well. The 37kDa and 40kDa bands (because the
gel is dried for imaging, it is hard to cut these two bands separately) have been analyzed by both
4700 MALDI-TOF and LTQ, while the 60kDa band was analyzed only by 4700.The total list of
enzymes will be identified once we obtain the result of 60kDa band from LTQ.
CKII catalytic subunit alpha was identified in MC3T3 cell lysis corresponding to 5
peptides found, Figure 25, 26 show 2 ms/ms spectra of CKII subunit alpha peptides with high
confidence. Although previous study[28] and sequence analysis suggested that CKII is the kinase
that phosphorylate DMP1 in vivo, our research is the first direct evidence of CKII’s involvement.
We tested the following kinases: Cell division protein kinase 6 and cAMP-dependent protein
kinase (only part of the sequence is available) for their ability to phosphorylate DMP1 but none
of them showed this ability. The other kinases in the list were not commercially available.

47
Figure 23 cDMP1 phosphorylated by cellular fractions
In vitro phosphorylation confirmed that cellular fractions could phosphorylate cDMP1, the level is very low
compared to CKI, the difference didn’t mean the difference of phosphorylation level, but might only be
experiments’ error.
48
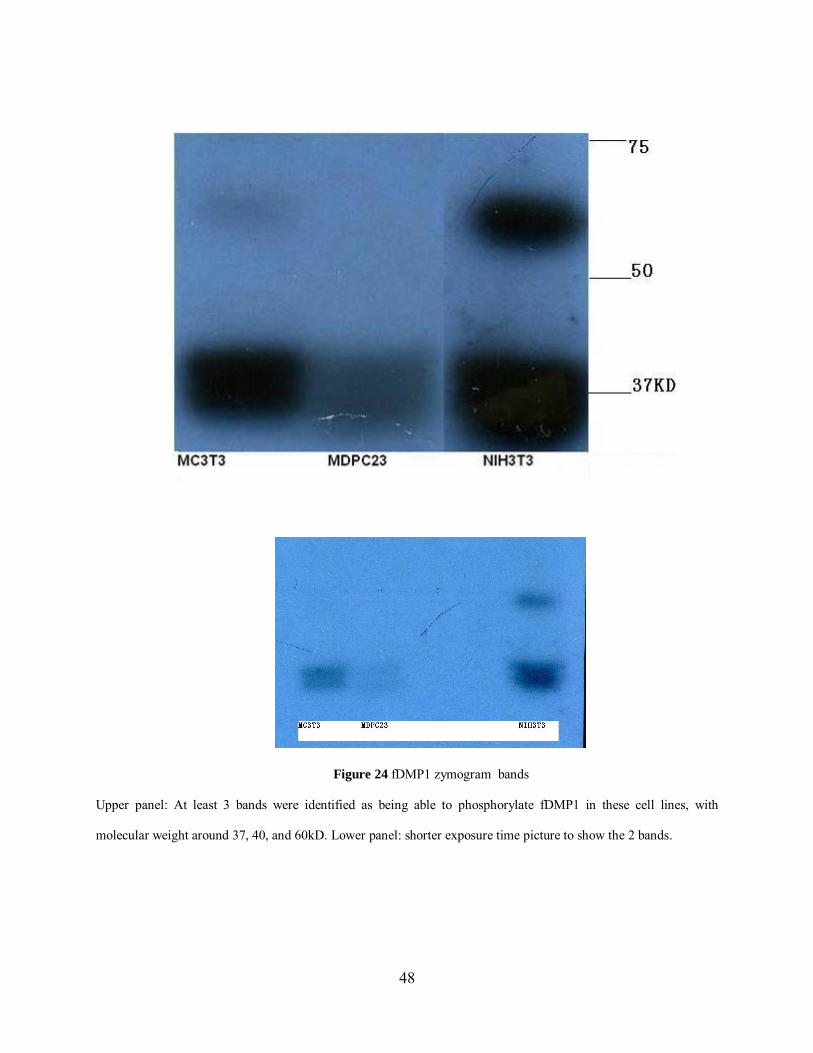
Figure 24 fDMP1 zymogram bands
Upper panel: At least 3 bands were identified as being able to phosphorylate fDMP1 in these cell lines, with
molecular weight around 37, 40, and 60kD. Lower panel: shorter exposure time picture to show the 2 bands.

49
Table 6 List of kinases found in MC3T3 cell lysis’ zymogram bands (37 and 40KD)
UniProt Acc # of peptides Protein
Q9Z1Z2 23 Serine-threonine kinase receptor-associated protein
Q9QZ08 17 N-acetyl-D-glucosamine kinase OS=Mus musculus
Q64261 6 Cell division protein kinase 6 OS=Mus musculus
Q80UL3 5 Galactokinase 1 OS=Mus musculus
O54833 5 Casein kinase II subunit alpha' OS=Mus musculus
Q8K183 4 Pyridoxal kinase OS=Mus musculus
P52332 3 Tyrosine-protein kinase JAK1 OS=Mus musculus
Q61846 2 Maternal embryonic leucine zipper kinase, OS=Mus musculus
Q61526 2 Receptor tyrosine-protein kinase erbB-3 OS=Mus musculus
P52480-1 2 Isoform M2 of Pyruvate kinase isozymes M1/M2
P05132-1 2 Isoform 1 of cAMP-dependent protein kinase catalytic subunit
alpha OS=Mus musculus
O09110-1 2 Isoform 2 of Dual specificity mitogen-activated protein kinase
kinase 3 OS=Mus musculus
The analysis is using Sequest, whose algorithm is matching experimental peptide to known fragmentation patterns
of theoretical peptides. The protein abundances or presence were determined by # of peptide identified (as in column
2). All proteins listed in this table have been confirmed by looking into their peptides’ spectra (as in Figure 25, 26)

50
#3756-3756 RT:33.53-33.53 NL: 1.39E4
0 200 400 600 800 1000 1200 1400
m/z
0
5
10
15
20
25
30
35
40
45
50
55
60
65
70
75
80
85
90
95
100
Re
lative
Ab
un
da
nce
yy7
+1
788.4
bb 2
+1
263.1 yy4
+1
489.2yy5
+1
588.4yy6
+1
717.4
bb 4
+1
463.1bb 3
+1
334.1
yy2
+1
288.3bb 6
+1
676.2
yy8
+1
951.5yy1
+1
175.1
bb 8
+1
876.5
Figure 25 MS/MS spectrum of peptide from CKII subunit alpha: VYAEVNSLR.
Ions series matched are labeled in red (b ions) or blue(y ions).

51
#5675-5675 RT:43.55-43.55 NL: 4.49E3
0 200 400 600 800 1000 1200 1400
m/z
0
5
10
15
20
25
30
35
40
45
50
55
60
65
70
75
80
85
90
95
100
Re
lative
Ab
un
da
nce
yy11
+1
1199.5
yy10
+1
1100.5
yy6
+1
716.6
bb 2
+1
251.2
bb 6
+2
332.2
yy9
+1
1013.5
bb 9
+1
962.5yy4
+1
488.4bb 3
+1
350.2 yy12
+1
1312.6
bb 4
+1
437.2
bb 12
+1
1303.7bb 6
+1
663.4yy7
+1
787.4yy5
+1
603.3bb 8
+1
847.5
bb 7
+1
734.5
Figure 26 MS/MS spectrum of peptide from CKII subunit alpha: HLVSPEALDLLDK
Ions series matched are labeled in red (b ions) or blue(y ions).

52
Table 7 List of kinases found in MDPC23 cell lysis’ zymogram bands(37 and 40KD)
UniProt Acc # of peptides Protein
P52480-1 49 Isoform M2 of Pyruvate kinase isozymes
M1/M2 OS=Mus musculus GN=Pkm2
P09411 18 Phosphoglycerate kinase 1 OS=Mus musculus
GN=Pgk1
P05132-1 4 Isoform 1 of cAMP-dependent protein kinase catalytic
subunit alpha OS=Mus musculus
Q7TNL3-1 2 Isoform 1 of Serine/threonine-protein
kinase 40 OS=Mus musculus
Q80UL3 2 Galactokinase 1 OS=Mus musculus
P20444 2 Protein kinase C alpha type OS=Mus musculus
P12382 2 6-phosphofructokinase, liver type OS=Mus musculus
Q61846 2 Maternal embryonic leucine zipper kinase
Q99N57-1 2 Isoform 1 of RAF proto-oncogene serine/threonine-
protein kinase OS=Mus musculus
Q924C5 2 Alpha-protein kinase 3 OS=Mus musculus
The analysis is using Sequest, whose algorithm is matching experimental peptide to known fragmentation patterns
of theoretical peptides. The protein abundances or presence were determined by # of peptide identified (as in column
2). All proteins listed in this table have been confirmed by looking into their peptides’ spectra (as in Figure 25, 26)

53
4.6 MAMMALIAN CELL DERIVED DMP1
Due to the high level of phosphorylation of DPP and DMP1, we hypothesized that the kinases
present in mineralizing tissues such as bone and dentin would be different than the kinases
present in non-mineralizing tissues. In order to compare the level of phosphorylation of DMP1 in
mineralizing versus non mineralizing tissues, we over-expressed fDMP1 into cells that originated
from mineralized tissues such as MC3T3 or U2OS cells or from connective tissue cells such as
NIH3T3 or HEK-293 using an adenovirus that bare mouse fDMP1. We couldn’t over-express
DMP1 gene from NIH3T3 cells after trying several different conditions, which might indicate
some degradation mechanism in fibroblast cells. MC3T3, U2OS, HEK-293 all are originated
from tissues where DMP1 was found. The secreted DMP1 was purified by ion exchange (Figure
27) and confirmed by western blot (antibody from Dr. Qin). The comparison of DMP1 from
MC3T3 versus HEK293 shows mostly similar but a little bit different cleavage and
phosphorylation patterns (Figure 28). More 57kD and 37kD functional fragments were found in
MC3T3 derived DMP1. DMP1 from U2OS, another bone derived cell was also phosphorylated.
Our mass spectrum data (Figure 29-33) confirmed that we did purify DMP1 but did not provide
phospho-peptide information from the cell derived fDMP1. This might be due to difficulty to
detect phospho-peptide, or due to the possibility that phosphorylated amino acids are located in
clusters which also occurs in OPN [29] and are hard to analyze by mass spectrometry.

54
Figure 27 U2OS derived fDMP1 purified by ion exchange.
U2OS derived fDMP1 was purified by ion exchange, the largest peak is FBS; the small peak circled is DMP1.
Fractions 19-22 were collected.
Figure 28 MC3T3/ HEK293 derived DMP1 purified by ion exchange column
DMP1 purified from MC3T3 (left) and HEK293 (right) cell medium. The blue bands (stains-all) and bright bands
(pro-Q stain) are DMP1. DMP1 from these two cell lines have mostly similar but a little bit different cleavage and
phosphorylation patterns.

55
1000.0 1602.6 2205.2 2807.8 3410.4 4013.0
Mass (m /z)
3038.5
0
10
20
30
40
50
60
70
80
90
100
% Inte
nsity
4700 Reflector Spec #1 MC=>BC=>AdvBC(32,0.5,0.1)=>BC[BP = 1838.0, 3039]
80-90
429-439
284-296
223-238
452-472239-260
239-261
234-260
189-219
1-33
1133.6
436
1836.9
908
1446.7
404
1703.8
833
1049.6
301
1359.8
047
1735.9
402
1424.7
103
2185.1
025
1764.9
392
1203.6
952
2430.1
174
3173.3
098
2990.3
799
1676.8
820
1883.0
248
2200.0
957
2808.3
562
1355.7
612
1280.5
820
1462.7
452
1045.5
947
1670.9
388
1739.9
751
1996.0
376
1590.7
585
3840.9
084
1805.9
480
3158.2
742
2119.8
101
1526.8
911
2680.2
253
1942.0
258
2982.2
461
2284.1
963
2916.5
874
1179.6
533
2413.1
262
2796.4
116
2863.4
229
3660.7
229
3296.5
681
3780.8
093
Figure 29 293 derived fDMP1 digested by trypsin. Coverage:31%
Identified peptide Expected
ms
Observed ms Amino acid
position
GQYRPAGGLSK 1133.6 1133.6 80-90
ETQSDSTEDTASK 1398.6 1398.7 429-439
ETQSDSTEDTASK 1398.6 1398.7 284-296
GHARMSSAGIRSEESK 1702.8 1703.8 223-238
SKEESNSTGSASSSEEDIRP K 2225.0 2225.1 452-472
GDREPTSTQDSDDSQSVEFS SR 2430.0 2430.1 239-260
SEESKGDREPTSTQDSDDSQ SVEFSSR 2990.3 2990.4 234-260
VGGGSEGESSHGDGSEFDDE
GM(O)QSDDPESTR
3173.2 3173.3 189-219
MKTVILLVFLWGLSCALPVA
RYHNTESESSEER
3778.9 3777.8 1-33

56
Figure 30 U2OS derived fDMP1 digested by trypsin. Coverage:30%
Identified peptide Expected
ms
Observed ms Amino acid
position
GELTDSNSR 978.4 978.5 275-283
GQYRPAGGLSK 1133.6 1133.6 80-90
SQESQSEQDSR 1280.5 1280.5 429-439
YHNTESESSEER 1467.6 1467.6 22-33
ETQSDSTEDTASKEESR 1899.8 1899.8 284-300
SKEESNSTGSASSSEEDIRP K 2225.0 2225.2 452-472
GDREPTSTQDSDDSQSVEFS SR 2430.0 2430.1 239-260
SQESQSEQDSRSEEDSDSQD SSR 2603.0 2603.0 429-451
SEESKGDREPTSTQDSDDSQ SVEFSSR 2990.2 2990.3 234-260
VGGGSEGESSHGDGSEFDDE
GMQSDDPESTR
3157.2 3157.2 189-219

57
Figure 31 U2OS derived fDMP1 digested by AspN. Coverage: 36%
Identified peptide Expected ms Observed ms Aa position
DSNSRETQS 1023.4 1022.6 279-287
DIRPKNMEA 1073.5 1073.6 468-476
DTASKEESRSESQE 1582.7 1582.8 292-305
DYRGELTDSNSRETQS 1857.8 1857.0 272-287
DRGQYRPAGGLSKSTGTGA 1878.9 1879.1 78-96
DSESEEQRVGGGSEGESSHG 2019.8 2020.0 181-200
DSSRSKEESNSTGSASSSEE 2060.8 2061.0 448-467
DSRKLIVDAYHNKPIGDQ 2069.1 2069.2 477-494
DSSSQEGLQSQSASTESRSQ ESQSEQ 2787.2 2787.4 411-436
DGDSSSQEGLQSQSASTESR SQESQSEQ 2959.2 2959.4 409-436
DPSSESSEEAGEPSQESSSE
SQEGVTSESRG
3172.3 3172.5 321-351
DSPEGQDPSSESSEEAGEPS
QESSSESQEGVTSESRG
3785.5 3785.7 315-351

58
1000.0 1602.6 2205.2 2807.8 3410.4 4013.0
Mass (m /z)
8594.1
0
10
20
30
40
50
60
70
80
90
100
% Inte
nsity
4700 Reflector Spec #1 MC[BP = 1133.6, 8594]
80-90
429-439
452-472
239-260
429-451
234-260
189-219
1133.6
365
2211.1
567
2990.3
442
3173.2
698
2225.1
531
2430.0
835
2302.2
209
1045.5
846
1496.1
882
1179.6
305
1280.5
830
3110.0
667
2972.3
416
1838.9
823
1940.9
736
1707.8
461
1383.7
162
1587.6
633
2807.3
250
2706.2
380
2574.2
041
1995.0
399
1639.9
246
2098.0
081
1434.7
538
2247.2
317
2915.5
750
3206.2
534
1106.5
470
1332.6
364
3355.8
872
2170.1
292
2651.4
258
3045.2
991
2368.3
633
3265.5
735
3533.4
194
3764.7
803
3821.7
954
3958.7
896
3706.4
805
Figure 32 MC3T3derived fDMP1 digested by Trypsin. Coverage:22%
Identified peptide Expected
ms
Observed ms Amino acid
position
GQYRPAGGLSK 1133.6 1133.6 80-90
SQESQSEQDSR 1280.5 1280.6 429-439
SKEESNSTGSASSSEEDIRP K 2225.0 2225.2 452-472
GDREPTSTQDSDDSQSVEFS SR 2430.0 2430.1 239-260
SQESQSEQDSRSEEDSDSQD SSR 2603.0 2603.1 429-451
SEESKGDREPTSTQDSDDSQ SVEFSSR 2990.3 2990.3 234-260
VGGGSEGESSHGDGSEFDDE
GM(O)QSDDPESTR
3173.2 3173.3 189-219

59
Figure 33 MC3T3derived fDMP1 digested by AspN. Coverage: 19%
Identified peptide Expected
ms
Observed ms Amino acid
position
DSTSQENSAQ 1066.4 1066.1 145-154
DSESEEQRVGGGSEGESSHG 2019.8 2019.9 181-200
DSSSQEGLQSQSASTESRSQ ESQSEQ 2787.2 2787.3 411-436
DGDSSSQEGLQSQSASTESR SQESQSEQ 2959.2 2959.4 409-436
DPSSESSEEAGEPSQESSSE
SQEGVTSESRG
3172.3 3172.5 321-351
DSPEGQDPSSESSEEAGEPS
QESSSESQEGVTSESRG
3785.5 3785.8 315-351
4.7 DISSCUSSION
Osteoblast cells are a rich source of CKI and CKII activity[30], CKII was thought to be
responsible for the phosphorylation of DPP[31] and DMP1 [28] from assays using CKII inhibitor,

60
however, no direct evidence has shown CKII’s involvement. Our zymogram data identified CKII
subunit from cell lysates and confirms CKII’s role. Our data also shows that CKI can in vitro
phosphorylate DDP and DMP1 much better than CKII. More attention should be dedicated to
CKI’s role in mineralized tissues. Unphosphorylated DMP1 was shown to first localize in the
nucleus, works as regulator of osteoblast-specific genes [32], during maturation transition of the
osteoblast, DMP1 was shown to get phosphorylated and migrate to the extracellular matrix [28],
correspondingly, our data shows nuclei fraction from MC3T3 cell lysates do have the ability to
phosphoryalte DMP1. Under maturation transition conditions, the cells release calcium from
their intracellular stores[33], and the export of DMP1 was found to be in response to the stimulus
from Ca++, which might be transported through IP3/ryanodine receptors[34]. Our results further
confirm the role of Ca++ by showing different phosphorylation levels corresponding to different
Ca++ concentration.
Phosphorylation level of DMP1 is important for its function. The 57kD fragments of highly
phosphorylated DMP1 works as a hydroxyapatite nucleator, while low level of phosphorylation
of DMP1 has no effect on either hydroxyapatite proliferation or growth[35] . Although published
data suggest CKII was the enzyme responsible for DMP1[28] , CKII could only phosphorylate
DMP1 to a very low level (5 phosphate per DMP1) in vitro which couldn’t function as mineral
nucleator[35]. Despite the difference in the in vitro vs. the cell phosphorylation, we hypothesized
that there might be other kinases participating in DMP1 phosphorylation. Our zymogram data
not only provided the list of possible novel kinases, but also showed similar kinases pattern of
both MC3T3 and NIH3T3 cells, which emphasized that it is might not the kinase specificity but
the regulation mechanism (e.g, Calcium flux[28]) which differ the DMP1’s phosphorylation and
function.

61
4.8 SUMMARY AND FUTURE RESEARCH
We successfully phosphorylated DMP1 and DPP in vitro. When DMP1was phosphorylated with
CKI at 30oC for 1hour, we were able to quantify approximately 13 phosphates per molecule. It
was difficult to quantify DPP’s phosphorylation due to the low binding of DPP to P81 paper.
However, DPP’s phosphorylation level was higher compared to DMP1 when assessed by loading
the phosphorylation reaction mix using radioactive 32[ATP] onto an SDS-PAGE gel . Different
conditions (temperature, time points, Ca2+/Mg2+ ion concentration, enzymes) were assayed and
we could obtain different phosphorylation level of DPP/DMP1by adjusting these conditions.
When DMP1 was in vitro phosphorylated by CKI at 30oC for 1hour, we detected 6 phospho-
peptides and identified Ser66 as a phosphorylation site by mass spectrometry.
We found there is no kinase specificity for DMP1 phosphorylation in mineralizing or
non-mineralizing tissues, at least 3 different (forms) enzymes from cell lysate were responsible
for DMP1 phosphorylation, with molecular weights of 37kD, 40kD and 60kD, respectively.
CKII catalytic subunit alpha was identified, which is the first direct evidence of CKII’s
involvement in DMP1 phosphorylation. Some other possible novel kinases were identified from
zymogram analysis, but most of them are not commercially available. Further research may be
focus on purifying and confirming these kinases.
Cell derived phosphorylation were compared by over-expressing and purifying DMP1
from mineralized and connective tissue cells. We couldn’t over-express DMP1 gene from
NIH3T3 cells after trying several different conditions, perhaps in fibroblast cells there might be
some degradation mechanism to eliminate proteins that can initiate mineralization. We were able
to purify DMP1 from MC3T3, U2OS, HEK-293 cells, which are originated from tissues where
DMP1 was found. Comparison of MC3T3 and HEK293 derived DMP1 show similar cleavage

62
and phosphorylation pattern; however, there seems to be more 37kD and 57kD fragments in
MC3T3 derived DMP1 compared with HEK293; these fragments were functionally active while
the whole DMP1 is inactive. [25] This might indicate the difference of corresponding proteinase
activity regulated by mineralized and connective tissue cells. Due to the limitation of mass
spectrometry to analyze phospho-clusters, the phosphate analysis and localization remain a
challenge from cell derived DMP1; we will use Inductively Coupled Plasma (ICP) to quantify
the phosphate of these cell derived DMP1 and further analyze their role in mineralization.
Finally, we believe that the outcomes of this research will provide the basis to further
assess the role of phosphorylation in mineralization.

63
BIBLIOGRAPHY
1. Boivin, G. and P.J. Meunier, Effects of bisphosphonates on matrix mineralization. J Musculoskelet Neuronal Interact, 2002. 2(6): p. 538-43.
2. Lowenstam, H.A., Minerals formed by organisms. Science, 1981. 211(4487): p. 1126-31. 3. NIAMS, Scientists Gain New Clues to Bone Mineralization, in Spot light on research.
2006. 4. Satoyoshi, M., et al., Extracellular processing of dentin matrix protein in the
mineralizing odontoblast culture. Calcif Tissue Int, 1995. 57(3): p. 237-41. 5. Kadler, collagen fibril formation. Biochemical Journal, 1996. 316. 6. Landis, Mineral Deposition in the Extracellular Matrices of Vertebrate Tissues:
Identification of Possible Apatite Nucleation Sites on Type I Collagen. cells tissues organs, 2009. 189: p. 20-24.
7. Termine, Osteonectin, a bone-pecific protein linking mineral to collagen. Cell, 1981. 8. Prince, Isolation, characterization and biosynthesis of a phosphorylated glycoprotein
from rate bone. J Bio Chem, 1987. 262. 9. George, Characterization of a novel dentin matrix acidic phosphoprotein. J Bio Chem,
1993. 268. 10. Veis, The biosynthesis of phosphophoryns and dentin collagen in the continuously
erupting rat incisor. J Bio Chem, 1978. 253: p. 6845-6852. 11. Fisher, L.W. and N.S. Fedarko, Six genes expressed in bones and teeth encode the
current members of the SIBLING family of proteins. Connect Tissue Res, 2003. 44 Suppl
1: p. 33-40. 12. Rowe, P.S., et al., MEPE, a new gene expressed in bone marrow and tumors causing
osteomalacia. Genomics, 2000. 67(1): p. 54-68. 13. Pinto, M.R., et al., Age-related changes in composition and Ca2+-binding capacity of
canine cortical bone extracts. Am J Physiol, 1988. 255(1 Pt 2): p. H101-10. 14. Veis, Non-collagenous proteins of bone and dentin Extracellular matrix. Chap. in
Calcium Binding proteins and Calcium functions. 1977: North Holland:Elsvier. 15. George, Role of phosphophoryn in Dentin Mineralization. cells tissues organs, 2005.
181(No. 3-4). 16. Evans, J.S., T. Chiu, and S.I. Chan, Phosphophoryn, an "acidic" biomineralization
regulatory protein: conformational folding in the presence of Cd(II). Biopolymers, 1994. 34(10): p. 1359-75.
17. Lee, S.L., T. Glonek, and M.J. Glimcher, 31P nuclear magnetic resonance spectroscopic
evidence for ternary complex formation of fetal dentin phosphoprotein with calcium and
inorganic orthophosphate ions. Calcif Tissue Int, 1983. 35(6): p. 815-8. 18. Qin, C., O. Baba, and W.T. Butler, Post-translational modifications of sibling proteins
and their roles in osteogenesis and dentinogenesis. Crit Rev Oral Biol Med, 2004. 15(3): p. 126-36.
19. Yamakoshi, Y., et al., Dentin sialophosphoprotein is processed by MMP-2 and MMP-20
in vitro and in vivo. J Biol Chem, 2006. 281(50): p. 38235-43.

64
20. Yamakoshi, Y., Dentin Sialophosphoprotein and Dentin. J. Oral Biosci, 2008. 50: p. 33-44.
21. Feng, J.Q., et al., Generation of a conditional null allele for Dmp1 in mouse. Genesis, 2008. 46(2): p. 87-91.
22. Narayanan, K., et al., Differentiation of embryonic mesenchymal cells to odontoblast-like
cells by overexpression of dentin matrix protein 1. Proc Natl Acad Sci U S A, 2001. 98(8): p. 4516-21.
23. Feng, J.Q., Dentin matrix protein 1, a target molecule for Cbfa1 in bone, is a unique bone
marker gene. J Bone Miner Res, 2002. 17: p. 1822-1831. 24. Qin, C., R. D'Souza, and J.Q. Feng, Dentin matrix protein 1 (DMP1): new and important
roles for biomineralization and phosphate homeostasis. J Dent Res, 2007. 86(12): p. 1134-41.
25. Qin, C., et al., Evidence for the proteolytic processing of dentin matrix protein 1.
Identification and characterization of processed fragments and cleavage sites. J Biol Chem, 2003. 278(36): p. 34700-8.
26. Graves, P.R.a.R., P.J, Role of COOH-terminal Phosphorylation in the Regulation of
Casein Kinase I. J. Biol. Chem, 1995. 270: p. 21689-21694. 27. technical reference for products, New England Biolab. 28. Narayanan, K., et al., Dual functional roles of dentin matrix protein 1. Implications in
biomineralization and gene transcription by activation of intracellular Ca2+ store. J Biol Chem, 2003. 278(19): p. 17500-8.
29. Christensen, B., et al., Post-translationally modified residues of native human
osteopontin are located in clusters: identification of 36 phosphorylation and five O-
glycosylation sites and their biological implications. Biochem J, 2005. 390(Pt 1): p. 285-92.
30. Wu, C.B., S.L. Pelech, and A. Veis, The in vitro phosphorylation of the native rat incisor
dentin phosphophoryns. J Biol Chem, 1992. 267(23): p. 16588-94. 31. Sfeir, C. and A. Veis, The membrane associated kinases which phosphorylate bone and
dentin extracellular matrix phosphoproteins are isoforms of cytosolic CKII. Connect Tissue Res, 1996. 35(1-4): p. 215-22.
32. Narayanan, K., et al., Dentin matrix protein 1 regulates dentin sialophosphoprotein gene
transcription during early odontoblast differentiation. J Biol Chem, 2006. 281(28): p. 19064-71.
33. Lundgren, T., et al., Junctional proteins and Ca2+ transport in the rat odontoblast-like
cell line MRPC-1. Calcif Tissue Int, 2001. 68(3): p. 192-201. 34. Adebanjo, O.A., et al., Novel biochemical and functional insights into nuclear Ca(2+)
transport through IP(3)Rs and RyRs in osteoblasts. Am J Physiol Renal Physiol, 2000. 278(5): p. F784-91.
35. Tartaix, P.H., et al., In vitro effects of dentin matrix protein-1 on hydroxyapatite
formation provide insights into in vivo functions. J Biol Chem, 2004. 279(18): p. 18115-20.

65