Embed Size (px)
Citation preview
Aalto University
School of Science and Technology
Department of Civil and Environmental Engineering
Jenni Nieminen
PHOSPHORUS RECOVERY AND RECYCLING
FROM MUNICIPAL WASTEWATER SLUDGE
A Master of Science thesis
Submitted for inspection in
Espoo, 7 May 2010
Supervisor: Professor Riku Vahala
Instructor: M.Sc. (Tech.) Pirjo Rantanen

ii
ABSTRACT OF THE MASTER’S THESIS
Author and the name of the thesis: Jenni Nieminen
Phosphorus recovery and recycling from municipal wastewater sludge
Date: 7 May 2010 Number of pages: 96
Department: Civil and EnvironmentalEngineering
Professorship: Water and WastewaterEngineering
Supervisor: Professor Riku Vahala
Instructor: M.Sc. (Tech.) Pirjo Rantanen
Keywords : Phosphorus recovery, phosphorus recycling, municipal wastewater sludge,sewage sludge, crystallization, struvite
The past decades have witnessed a rising awareness of the finite phosphorus resources and theimportance of phosphorus recovery. The world phosphorus resources are estimated to deplete in60 to 240 years and the world phosphorus production to peak in 2033, creating a need todiscover alternative materials to replace phosphate ore. Municipal wastewater sludge is aphosphorus source worth considering, since modern technologies can transfer over 90% of thephosphorus from the wastewater to the sludge fraction.
The aim of this thesis is to discuss and overview the current methods for phosphorus recoveryfrom municipal wastewater sludge, ash from sludge incineration, and the liquid phase afteranaerobic treatment containing phosphorus in soluble form. The methods for recovery includecrystallization and precipitation, wet chemical methods, and thermochemical methods. Thecrystallization and precipitation methods convert phosphorus into solid form with a chemicaldosage and pH adjustment. The wet chemical methods recover the phosphorus bound in sludgeor ash by leaching it with acid or base, and recovering the resulting dissolved phosphorus withvarious methods, the most common being the precipitation. The ash fraction after incinerationcan be treated with thermochemical methods by adding chloride chemical and bringing the ashto temperature higher than the boiling point of the resulted heavy metal chlorides, leading totheir evaporation.
This study surveys processes based on these methods, both the operational fullscaleapplications and the pilotscale and laboratoryscale processes. Most of the operationalprocesses are based on crystallization or precipitation. Precipitation is a widely studied methodthat has proved to be economical compared to the wet chemical methods. The wet chemicalmethods require chemicals and offer limited amount of experiences from fullscale. Thermochemical methods do not yet have fullscale implementations.

iii
DIPLOMITYÖN TIIVISTELMÄ
Tekijä ja työn nimi: Jenni Nieminen
Fosforin kierrätys ja talteenotto yhdyskuntien jätevesilietteestä
Päivämäärä: 7.5.2010 Sivumäärä: 96
Tiedekunta: Insinööritieteiden jaarkkitehtuurin tiedekunta
Laitos: Yhdyskunta jaympäristötekniikan laitos
Työn valvoja: Professori Riku Vahala
Työn ohjaaja: Diplomiinsinööri Pirjo Rantanen
Avainsanat: Fosforin talteenotto, fosforin kierrätys, yhdyskuntien jätevesiliete, struviitti
Viime vuosikymmeninä on alettu kiinnittää entistä enemmän huomiota maailman fosforivarojenriittävyyteen ja fosforin kierrätykseen. Arviot taloudellisesti hyödynnettävien fosforiesiintymienriittävyydestä vaihtelevat 60 ja 240 vuoden välillä ja maailman fosforin tuotannon arvioidaansaavuttavan huippunsa vuonna 2033. Tämän jälkeen fosforin tuotannossa on siirryttävähyödyntämään vaikeammin saavutettavissa olevia ja heikkolaatuisempia malmivaroja. Vaikeansaavutettavuuden vuoksi tuotanto hidastuu, ja heikompi laatu hankaloittaa malmin prosessointia.Tuotannon epävarmuus saattaa aiheuttaa nopeitakin heilahteluita fosforin hinnassa. Hupeneviafosforivaroja korvaamaan tarvitaan tulevaisuudessa vaihtoehtoisia fosforinlähteitä.Harkitsemisen arvoinen vaihtoehto on jäteveden puhdistusprosesseissa syntyvä liete, johonprosessin tehokkuudesta riippuen voi päätyä yli 90 % puhdistamolle tulevan jätevedenfosforista.
Tämän diplomityön tarkoituksena on tarkastella menetelmiä, jotka on kehitetty fosforintalteenottoon yhdyskuntien jätevesilietteestä, lietteen polton seurauksena syntyvästä tuhkastasekä nestefaasista, johon fosfori on anaerobisessa käsittelyssä vapautunut. Talteenottonestefaasista tapahtuu saostus ja kiteytysmenetelmillä, joissa kemikaaliannostuksen ja pH:nsäädön seurauksena liukoinen fosfori saostuu. Tuhkaan ja lietteeseen sitoutuneen fosforintalteenottamiseksi fosfori liuotetaan happo tai emäskäsittelyllä. Liuenneen fosforin erottamiseenvoidaan käyttää esimerkiksi saostusta, ioninvaihtohartseja tai nanosuodatusta. Tuhkankäsittelyyn voidaan soveltaa myös termokemiallisia menetelmiä, joissa tuhkaan lisätäänklooriyhdisteitä ja seos kuumennetaan yli raskasmetallikloridien kiehumispisteen, jolloinsyntyneet yhdisteet poistuvat kaasuna.
Työssä tarkastellaan menetelmiin perustuvia prosesseja: sekä toiminnassa olevia täydenmittakaavan laitoksia että kokeilu tai laboratoriomittakaavassa olevia prosesseja. Suurin osatäyden mittakaavan sovelluksista perustuu kiteytykseen tai saostukseen. Näitä menetelmiä onkehitetty ja tutkittu eniten ja ne ovat taloudellisempia kuin märkäkemialliset menetelmät, jotkavaativat runsaasti kemikaaleja. Märkäkemiallisiin menetelmiin perustuvista täyden mittakaavanlaitoksista on rajallisesti käyttökokemuksia. Termokemiallisia menetelmiä ei ole vielä toteutettutäydessä mittakaavassa.

iv
ACKNOWLEDGEMENTS
This thesis was written at Aalto University between October 2009 and May 2010, and itwas funded by Kemira Oyj. Therefore, I want to show my gratitude to Kemira, and thankespecially Pentti Pekonen and Timo Härmä for their guidance and providing me with suchan interesting topic.
From Aalto University, I would like to thank my supervisor professor Riku Vahala for hisunderstanding attitude towards the tight schedule, my instructor Pirjo Rantanen for hersupport and guiding me into the right direction, and Michela Mulas for her help with thefinal touch.
I would also like to thank my mother for supporting me during the thesis process and mystudies.

v
TABLE OF CONTENTS1 INTRODUCTION......................................................................................................................................... 1
2 PHOSPHORUS.............................................................................................................................................. 3
2.1 NATURAL PHOSPHORUS CYCLE.............................................................................................................. 3
2.2 WORLD PHOSPHATE ROCK RESOURCES ................................................................................................. 5
2.3 BASIC CHEMISTRY .................................................................................................................................. 8
2.4 APPLICATIONS ...................................................................................................................................... 10
2.4.1 Fertilizers ........................................................................................................................................ 10
2.4.2 Detergents ....................................................................................................................................... 10
2.4.3 Other................................................................................................................................................ 11
2.5 PRODUCTION ........................................................................................................................................ 11
2.5.1 Wet chemical process ..................................................................................................................... 11
2.5.2 Electrothermal process ................................................................................................................. 12
3 PHOSPHORUS REMOVAL..................................................................................................................... 15
3.1 PHOSPHORUS IN WASTEWATER TREATMENT PLANT ........................................................................... 15
3.2 CHEMICAL PHOSPHORUS REMOVAL..................................................................................................... 16
3.3 BIOLOGICAL PHOSPHORUS REMOVAL.................................................................................................. 18
3.4 SLUDGE TREATMENT ............................................................................................................................ 20
3.4.1 Anaerobic digestion........................................................................................................................ 20
3.4.2 Monoincineration.......................................................................................................................... 21
3.5 PHOSPHORUS RECYCLING .................................................................................................................... 22
3.5.1 Agricultural use .............................................................................................................................. 22
3.5.2 Recycling in phosphate industry.................................................................................................... 23
4 PHOSPHORUS RECOVERY................................................................................................................... 26
4.1 NATIONAL POLICIES ............................................................................................................................. 26
4.2 LOCATIONS FOR PHOSPHORUS RECOVERY .......................................................................................... 27
4.3 FINAL PRODUCTS ................................................................................................................................. 29
4.3.1 Calcium phosphate......................................................................................................................... 29
4.3.2 Struvite ............................................................................................................................................ 30
4.3.3 Ash ................................................................................................................................................... 32
4.4 THE MAIN PHOSPHORUS RECOVERY TECHNOLOGIES .......................................................................... 34
4.4.1 Crystallization and precipitation................................................................................................... 34
4.4.2 Wet Chemical technologies............................................................................................................ 35
4.4.3 Thermochemical treatment........................................................................................................... 37

vi
5 INDUSTRIALSCALE PROCESSES ......................................................................................................39
5.1 CRYSTALLIZATION OF CALCIUM PHOSPHATE ......................................................................................39
5.1.1 Crystalactor®..................................................................................................................................39
5.2 CRYSTALLIZATION / PRECIPITATION OF STRUVITE ..............................................................................42
5.2.1 AirPrex procedure...........................................................................................................................42
5.2.2 The Ostara Pearl® process............................................................................................................50
5.2.3 The PHOSNIX process....................................................................................................................51
5.3 WET CHEMICAL PROCESS .....................................................................................................................53
5.3.1 The Seaborne process .....................................................................................................................53
5.4 SUMMARY OF THE FULLSCALE PROCESSES.........................................................................................60
6 PILOT AND LABORATORY SCALE PROCESSES...........................................................................65
6.1 CRYSTALLIZATION / PRECIPITATION ....................................................................................................65
6.1.1 PRoC...............................................................................................................................................65
6.1.2 PRISA process .................................................................................................................................67
6.1.3 The Rem Nut® ion exchange process ............................................................................................68
6.2 WET CHEMICAL.....................................................................................................................................71
6.2.1 The SEPHOS and the Advanced SEPHOS process ......................................................................71
6.2.2 The PASH process...........................................................................................................................73
6.2.3 The BioCon® Process.....................................................................................................................75
6.2.4 The Aqua Reci Process ...................................................................................................................76
6.2.5 Nanofiltration ..................................................................................................................................77
6.3 THERMOCHEMICAL..............................................................................................................................78
6.3.1 The ASH DEC Process ...................................................................................................................78
6.3.2 The Mephrec process ......................................................................................................................81
6.4 SUMMARY OF THE PILOT AND LABORATORY SCALE PROCESSES ........................................................82
7 POTENTIAL AND COSTS........................................................................................................................86
8 CONCLUSION.............................................................................................................................................90
9 REFERENCES.............................................................................................................................................92

vii
LIST OF FIGURES
FIGURE 1: INORGANIC AND ORGANIC PHOSPHORUS CYCLE ON LAND WITH HUMAN IMPACT (CORNEL AND
SCHAUM 2009). ................................................................................................................................................ 3
FIGURE 2: TOTAL PHOSPHORUS BY SOURCE INTO SURFACE WATERS IN FINLAND IN 2008 (SYKE 2009) AND
WITHIN THE CATCHMENT AREA OF THE BALTIC SEA IN 2000 (HELCOM 2009).......................................... 4
FIGURE 3: THE WORLD PHOSPHORUS PRODUCTION (ADAM 2009).......................................................................... 6
FIGURE 4: PRICE DEVELOPMENT OF PHOSPHATE ROCK IN THE U.S. (USD/T) (MONGABAY 2010). ...................... 6
FIGURE 5: PEAK PHOSPHORUS (CORDELL ET AL. 2009)............................................................................................ 7
FIGURE 6. RELATIVE PROPORTIONS OF ORTHOPHOSPHORUS SPECIES (LANNING 2008). ........................................ 9
FIGURE 7: ELECTROTHERMAL PRODUCTION OF ELEMENTAL PHOSPHORUS (SCHIPPER ET AL. 2001).................. 13
FIGURE 8: THE PHOSPHATE PRECIPITANTS AND PH (MONTAG 2008). ................................................................... 17
FIGURE 9: THE PRINCIPLE OF THE CELL OPERATIONS FOR BIOLOGICAL PHOSPHORUS REMOVAL (SYKE 2010). 18
FIGURE 10: THE CONCENTRATIONS OF PO4P, VFA, PHB AND POLYPHOSPHATES IN AEROBIC AND ANAEROBIC
STAGE IN WATER PHASE AND IN BIOMASS (JANSSEN ET AL. 2002). .............................................................. 19
FIGURE 11: THE A/O PROCESS (SYKE 2010)......................................................................................................... 19
FIGURE 12: FE/P IN SEWAGE SLUDGE ASH (SCHIPPER AND KORVING 2009)......................................................... 25
FIGURE 13: POSSIBLE LOCATIONS FOR PHOSPHORUS RECOVERY (MODIFIED FROM ADAM 2009 AND CORNEL AND
SCHAUM 2009). .............................................................................................................................................. 27
FIGURE 14: CALCIUM PHOSPHATE PELLETS (GIESEN 2009A). ............................................................................... 29
FIGURE 15: STRUVITE CRYSTALS (HEINZMANN 2009)........................................................................................... 30
FIGURE 16: STRUVITE SOLUBILITY VS. PH (KOCH ET AL. 2009)............................................................................. 31
FIGURE 17: AVERAGE CHEMICAL COMPOSITION OF ASHES FROM EU BIOCRETE PROJECT (2007). ..................... 33
FIGURE 18: PRINCIPLE OF CRYSTALLIZATION AND PRECIPITATION PROCESS (CORNEL AND SCHAUM 2009)..... 35
FIGURE 19: PRINCIPLE OF WET CHEMICAL PROCESS (CORNEL AND SCHAUM 2009)............................................. 36
FIGURE 20: DISSOLVED COMPONENTS IN SLUDGE IN RESPECT TO PH VALUE (BAYERLE 2009)........................... 37
FIGURE 21: THERMOCHEMICAL PROCESS PRINCIPLE (HERMANN 2009B) ............................................................ 38
FIGURE 22: THE CRYSTALACTOR® FLUIDIZED BED REACTOR (MODIFIED FROM GIESEN 2009A) AND THE
CRYSTALACTOR® REACTORS AT THE GEESTMERAMBACHT WWTP.......................................................... 40
FIGURE 23: A PUMP AND APERTURE WITH STRUVITE INCRUSTATIONS (HEINZMANN 2009)................................ 44
FIGURE 24: THE OLD METHOD FOR STRUVITE PRECIPITATION (HEINZMANN 2009) AND THE OLD PRECIPITATION
TANKS (PICTURE: P. RANTANEN) AT WAßMANNSDORF WWTP.................................................................. 44
FIGURE 25: THE DAILY PHOSPHORUS BALANCE (KG/D) AT WWTP WAßMANNSDORF WITH THE “OLD METHOD”
(MODIFIED FROM LENGEMANN 2010A). ........................................................................................................ 45
FIGURE 26: THE AIRPREX PROCEDURE (HEINZMANN 2009) AND REACTOR (PICTURE: J. NIEMINEN). ............... 46
FIGURE 27: THE AIRPREX PROCEDURE (LENGEMANN 2010A). ............................................................................. 46
viii
FIGURE 28: THE AIRPREX REACTOR FROM ABOVE (LENGEMANN 2010A) AND SIDE (HANNEMANN ET AL. 2009).
.........................................................................................................................................................................47
FIGURE 29: THE DISCHARGE SHAFT (LENGEMANN 2010A) AND THE CROSSSECTIONAL VIEW OF THE REACTOR
(HANNEMANN ET AL. 2009). ...........................................................................................................................48
FIGURE 30: THE BOTTOM OF THE AIRPREX REACTOR. ...........................................................................................49
FIGURE 31: THE OSTARA STRUVITE PRECIPITATION REACTOR PEARL® (MODIFIED FROM OSTARA 2010)..........50
FIGURE 32: THE PHOSNIX PROCESS AT THE LAKE SHINJI EASTERN CLARIFICATION CENTER OF SHIMANE
PREFECTURE (SECC), JAPAN (NAWA 2009). ................................................................................................52
FIGURE 33: THE PHOSNIX PROCESS (NAWA 2009)..................................................................................................52
FIGURE 34: PARTIAL VIEW OF THE SEABORNE PROCESS AT GIFHORN WWTP. ....................................................55
FIGURE 35: THE PATENTED VERSION OF THE SEABORNE PROCESS (MODIFIED FROM VESTERAGER 2009). .........56
FIGURE 36: FLOWCHART OF THE SEABORNE PROCESS AT GIFHORN (BAYERLE 2010). ........................................57
FIGURE 37: AMORPHOUS STRUVITE FROM SEABORNE PROCESS AFTER ATMOSPHERIC DRYING AND AFTER
CENTRIFUGE SEPARATION, AS WELL AS THE LIQUID PHASE FROM THE CENTRIFUGE. ..................................59
FIGURE 38: THE PROC PROCESS FLOW CHART (BERG AND SCHAUM 2005). .......................................................65
FIGURE 39: CSH GRANULES (PETZET AND CORNEL 2009).....................................................................................66
FIGURE 40: SIMPLIFIED FLOW CHART OF THE PRISA PROCESS (MONTAG ET AL. 2007). .....................................67
FIGURE 41: THE “PDRIVEN”REM NUT® ION EXCHANGER PROCESS FLOWCHART (LIBERTI ET AL. 2001)..........69
FIGURE 42: THE SEPHOS PROCESS AND THE ADVANCED SEPHOS PROCESS (MODIFIED FROM SCHAUM ET AL.
2005). ..............................................................................................................................................................72
FIGURE 43: MASS FLOW IN THE SEPHOS PROCESS (MODIFIED FROM SCHAUM 2007).........................................73
FIGURE 44: THE PASH PROCESS FLOW CHART (MODIFIED FROM MONTAG 2009)................................................74
FIGURE 45: THE RECOVERY UNIT OF BIOCON® PROCESS WITH MASS FLOW INFORMATION FROM THE PILOT
PLANT AT BRØNDERSLEV WWTP (MODIFIED FROM LEVLIN 2002 AND HULTMAN ET AL. 2001). ..............75
FIGURE 46: THE RECYCLING STEP AFTER SCWO IN THE AQUA RECI PROCESS (STENDAHL AND JÄFVERSTRÖM
2004). ..............................................................................................................................................................77
FIGURE 47: THE FLOWCHART OF THE ASH DEC PROCESS (MODIFIED FROM ASH DEC 2010)...........................79
FIGURE 48: THE ASH DEC PROCESS AND ESTIMATED MATERIAL FLOW OF A FULLSCALE PLANT WITH FEED OF
2000 KG/H OF ASH (ASH DEC 2010). ...........................................................................................................80
FIGURE 49: THE MEPHREC PROCESS (MODIFIED FROM IGNITEC 2010)..................................................................81

ix
LIST OF TABLES
TABLE 1: PHOSPHORUS PRODUCTION IN THE WORLD (U.S. GEOLOGICAL SURVEY 2009 AND 2010)..................... 7
TABLE 2: SEWAGE SLUDGE PRODUCTION AND MONOINCINERATION FACILITIES IN SELECTED COUNTRIES (ASH
DEC 2009). .................................................................................................................................................... 21
TABLE 3: LIMIT VALUES FOR HEAVY METAL CONCENTRATIONS IN AGRICULTURAL USE. .................................... 23
TABLE 4: REQUIREMENTS FOR SECONDARY RAW MATERIAL COMPARED TO ASH FROM CHEMICAL AND
BIOLOGICAL PHOSPHORUS REMOVAL PROCESS, AND CALCIUM PHOSPHATE (SCHIPPER ET AL. 2001). ....... 24
TABLE 5: IMPURITIES IN SECONDARY RAW MATERIAL AND THE WAYS AND REASONS OF THE INTERFERENCE OF
THE PROCESS (SCHIPPER ET AL. 2001) ........................................................................................................... 25
TABLE 6: THE PROJECTS OF THE FUNDING PROGRAM "RECYCLING MANAGEMENT OF PLANT NUTRIENTS,
ESPECIALLY PHOSPHORUS" (BMBF/BMU 2010). ........................................................................................ 27
TABLE 7: PHOSPHORUS FLOW AND CONCENTRATIONS (L/D PER CAPITA (MODIFIED FROM MONTAG 2008). ...... 28
TABLE 8: CALCIUM PHOSPHATE COMPOUNDS (CEEP 2001). ................................................................................ 30
TABLE 9: CONCENTRATION BY MASS OF MG, N AND P IN STRUVITE..................................................................... 31
TABLE 10: CONCENTRATIONS IN ASH FROM SEVERAL INCINERATION PLANTS (BOUTOUSSOV 2009). ................ 33
TABLE 11: ASH PARTICLE CHARACTERISTICS (BOUTOUSSOV 2009). .................................................................... 34
TABLE 12: CONCENTRATIONS (MG/L) OF THE INFLUENT AND EFFLUENT AT WWTP WAßMANNSDORF IN 2006
(BERLINER WASSERBETRIEBE 2007). ........................................................................................................... 43
TABLE 13: OSTARA PEARL® INFORMATION (OSTARA 2010). ............................................................................... 51
TABLE 14: SUMMARY OF THE MODIFICATIONS AT GIFHORN PLANT...................................................................... 55
TABLE 15. COSTS AND CHEMICAL CONSUMPTION OF THE SEABORNE PROCESS WITH SEVERAL PH VALUES
(BAYERLE 2009). ........................................................................................................................................... 60
TABLE 16: INVESTMENT COSTS OF THE SEABORNE PROCESS IN GIFHORN (BAYERLE 2010). .............................. 60
TABLE 17: THE INDUSTRIALSCALE PROCESSES. .................................................................................................... 62
TABLE 18: THE FLOW OF THE PROCESSES. .............................................................................................................. 63
TABLE 19: CHEMICALS USED IN THE PROCESSES.................................................................................................... 64
TABLE 20: COST EVALUATION FOR THE PROC PROCESS WITH REACTOR OPTIONS (BERG ET AL. 2006B). ......... 67
TABLE 21: THE COST EVALUATION OF THE PASH PROCESS (MONTAG AND PINNEKAMP 2009). ........................ 75
TABLE 22: COST EVALUATION FOR AQUA RECI INVESTMENT (STENDAHL AND JÄFVERSTRÖM 2004). .............. 77
TABLE 23: THE SUMMARY OF THE PILOTSCALE PROCESSES. ................................................................................ 84
TABLE 24: THE LABORATORYSCALE PROCESSES. ................................................................................................. 85
TABLE 25: TOTAL COSTS OF DISPOSAL OF SEWAGE SLUDGE (SALADO ET AL. 2009)............................................. 86
TABLE 26: PHOSPHORUS RECOVERY POTENTIAL FROM MUNICIPAL WASTEWATER SLUDGE. ............................... 87
TABLE 27: ESTIMATED COSTS OF THE FOUR OPTIONS PRESENTED IN THE CONSULTATION REPORT ON OPTIONS
AND IMPACTS (SALADO ET AL. 2008). ........................................................................................................... 88
TABLE 28: THE PRICE OF RECOVERED PHOSPHORUS (€/T). .................................................................................... 89

x
LIST OF TERMS AND ABBREVIATIONS
AFBNRSCP Anaerobic Fermentation Biological Nutrient Removal Struvite CrystallizationProcess, a phosphorus recovery process
Aqua Reci Phosphorus recovery process
ASH DEC Phosphorus recovery process
B.V. Limited liability company, Ltd.(Dutch)
BAM The Federal Institute for Materials Research and Testing, Germany
BioCon Phosphorus recovery process
BMBF Bundesministerium für Bildung und Forschung, The German Federal Ministry ofEducation and Research
BMU Bundesministerium für Umwelt, Naturschutz und Reaktorsicherheit, GermanFederal Ministry for the Environment, Nature Conservation and Nuclear Safety
bsCOD Dissolved organic matter
BWB Berliner Wasserbetriebe
BOOM Besluit Overige Organische Meststoffen, Other organic fertilizers decision
CSH Calcium Silicate Hydrate
CSIR Council for Scientific and Industrial Research
DAP Diammonium Phosphate
DS Dry solids
DüMV Düngemittelverordnung, German fertilizer ordinance
EDX Energy Dispersive XRay fluorescence
EPA Environmental Protection Agency
EU15 Austria, Belgium, Denmark, Finland, France, Germany, Greece, Ireland, Italy,Luxembourg, the Netherlands, Portugal, Spain, Sweden, and the United Kingdom
EU25 EU15 and Cyprus, Czech Republic, Estonia, Hungary, Latvia, Lithuania, Malta,Poland, Slovakia, and Slovenia
EU27 EU25 and Bulgaria and Romania
GmbH Limited liability company, Ltd. (German)
HAP Hydroxyapatite

xi
HRT Hydraulic Retention Time
IAP Institute of Applied Polymer science
ISA Institute for Environmental Engineering of Aachen University
ITCWGT The Institute of Technical Chemistry – Water and Geotechnology Division
Kurita Phosphorus recovery process
Ksp Solubility product
MAP Magnesium Ammonium Phosphate
p.e. Population Equivalent
PAO Phosphorus accumulating bacteria
PASH Phosphorus recovery from Ash
PHB Polyhydroxybutyrate
PRISA Phosphorus Recovery by ISA
PRoC Phosphorus Recovery from wastewater by Crystallization of calcium phosphatecompounds
Rem Nut Removal of Nutrients. A phosphorus recovery process
RoHM Removal of Heavy Metals
RTWH Technical University of Aachen
SCWO Supercritical Water Oxidation
SEM Scanning Electron Microscopy
SEPHOS Sequential Precipitation of Phosphorus
SNB Slibverwerking NoordBrabant
SSR Supersaturation ratio
SUSAN Sustainable and Safe reuse of Municipal Sewage Sludge for Nutrient Recovery
VFA Volatile Fatty Acids
WAS Waste Activated Sludge
WWTP Wastewater Treatment Plant


1
1 INTRODUCTION
The past decades have witnessed a rising awareness of the finite phosphorus resources
and the importance of phosphorus recovery. Phosphorus is a limiting factor in plant
growth, making it an important part of fertilizers. Fertilizer industry processes the major
part of the mined phosphate rock. In the US, the share is over 95% (U.S. Geological
Survey 2010). Fertilizers are crucial for the modern efficient plant production and their
lack can result in large crop failure.
The estimates of the phosphorus resources sufficiency vary between 60 to 240 years
(Cornel and Schaum 2009) denoting that scarce phosphorus resources do not pose a
shortterm threat. However, the year 2008 saw a quick rise in the world market value of
phosphorus resulting from the increased agricultural demand and tightened supplies
(U.S. Geological Survey 2010), showing that temporary supply shortages can occur at
any time. The depletion of good quality phosphate rock will conclude in uncertainty in
the markets and rising costs in fertilizer production. Moreover, phosphorus cannot be
synthetically produced, creating a need to discover substitutive sources for the
phosphate rock.
One possible source of recycling phosphorus is municipal wastewater sludge. The past
decades’ problems with eutrophication in the surface waters have resulted in the
presentday strict limit values for the effluent from sewage treatment plant. A modern
wastewater treatment process removes phosphorus from sewage using an activated
sludge process or a chemical precipitation process, transferring over 90% of the
incoming phosphorus to the sludge fraction (Cornel and Schaum 2009).
A number of methods has been developed to recover phosphorus from the sludge and to
convert it to a reusable form. Most implementation cases in fullscale are based on the
largely researched technologies: the crystallization or precipitation of phosphorus as
calcium phosphate (Giesen and van der Molen 1996, Berg et al. 2006a) or struvite
(Ueno and Fuji 2001, Ostara 2010, Lengemann 2010a). However, these technologies
can only reach the recovery efficiency of 50 to 60% of total phosphorus (Montag 2008)
and are often implemented as a solution for the problems caused by the spontaneous
precipitation of struvite.

2
Methods with higher recovery potential are typically wetchemical. These methods aim
at maximum phosphorus recovery, requiring a chemical consuming, thus expensive,
leaching step with acid or base (Stark et al. 2006). The only fullscale application found
in this study, the Seaborne process (Vesterager 2009), is currently neither feasible nor
fully operational (Bayerle 2010).
Contributions to recover phosphorus from incinerated sewage sludge ash have lead to
the development of the ASH DEC process (Boutoussov 2009), studied in the EU Project
SUSAN (Sustainable and safe reuse of municipal sewage sludge for nutrient recovery)
(2008). Incinerated ash can also be used as secondary material in phosphate industry
(Schipper et al. 2001).
Although several researchers (Morse et al. 1997, Stratful et al. 1999, Cornel and
Schaum 2009) have reviewed the existing technologies, these studies provide little
information of the technical details and the problems occurring in the processes. The
aim of this study was to gather more detailed information for assess the feasibility of
future research projects. Information was assembled from literature, patents, and
excursions to operational plants selected as the most representative in March 2010. The
visited plants included two municipal WWTPs in Germany: Berlin and Gifhorn; and
two other plants in the Netherlands: the sludge incineration plant Slibverwerking
NoordBrabant in Moerdijk and the chemical company Thermphos International B.V. in
Vlissingen. The WWTP in Berlin has a recently started facility for struvite precipitation,
and the only fullscale wet chemical process found within the limits of this study is
located in Gifhorn. The Dutch plants show an interesting cooperation recycling the ash
as secondary raw material in phosphorus chemicals producing process.
This thesis is structured as follows. Chapter 2 provides general information about
phosphorus and phosphate rock, including the applications and processing of the ore to
usable form. Chapter 3 discusses phosphorus flow in wastewater treatment process,
chemical and biological phosphorus removal processes, means for sludge treatment, and
phosphorus recycling. Chapter 4 introduces the locations, material flows, final products,
and methods for phosphorus recovery. Chapters 5 and 6 describe the processes utilizing
these methods and finally, Chapter 7 deals with the potentials and costs of phosphorus
recovery.
3
2 PHOSPHORUS
2.1 Natural phosphorus cycle
Phosphorus is the eleventh abundant element in the Earth’s crust and an essential
element in DNA, RNA lipids, proteins, enzymes, energy carrier ATP, as well as an
important factor in development of teeth and bones. Phosphorus has no gaseous form in
the nature but in water environment it occurs in small amounts limiting the metabolic
activity. In water environment, other nutrients and energy, needed for the growth of
biomass, are plentiful, therefore an increased level of limiting phosphorus can lead to
eutrophication (Vesilind 1998). The past decades’ problems with eutrophication in the
surface waters have resulted in the presentday strict limit values for the effluent from
wastewater treatment plants (WWTPs). As a result, a major share of the incoming
phosphorus is transferred into the sludge phase. Previously, organic waste was used in
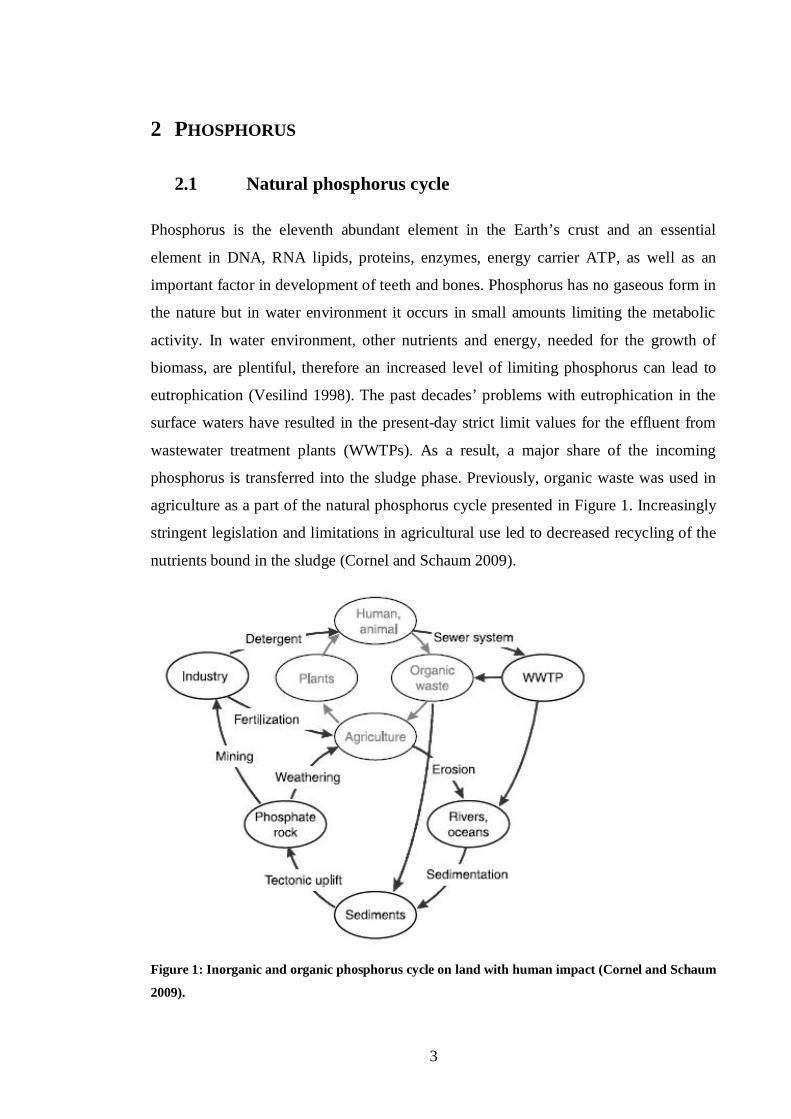
agriculture as a part of the natural phosphorus cycle presented in Figure 1. Increasingly
stringent legislation and limitations in agricultural use led to decreased recycling of the
nutrients bound in the sludge (Cornel and Schaum 2009).
Figure 1: Inorganic and organic phosphorus cycle on land with human impact (Cornel and Schaum
2009).

4
Phosphorus has an inorganic geological cycle and two organic cycles occurring on land
and in water. The geological cycle lasts several million years. It starts from the soil
erosion transferring phosphorus to sea bottom. The phosphorus containing material
sedimentates, finally slowly rising back to the upper soil by tectonic uplift. The organic
cycle on land, starts from the plant uptake. The plants are utilized by humans and
animals that later produce organic waste. The phosphorus in the organic waste can be
used in agriculture or, as can be seen in Figure 1, join the geological cycle.
In Finland, the main source of phosphorus emissions to water environment from human
actions is agriculture. In 2008 (Figure 2), about 67% (2600 t/a) of the whole phosphorus
load to water environment (4105 t/a) originated from agriculture, while the fraction of
municipal wastewater was only 4.8% (197 t/a). However, according to HELCOM
(2009), emissions from municipal WWTPs to the Baltic Sea constituted 50% of total
phosphorus load (37 000 t) in the whole catchment area.
Figure 2: Total phosphorus by source into surface waters in Finland in 2008 (SYKE 2009) and
within the catchment area of the Baltic Sea in 2000 (HELCOM 2009).
As Finland produces 10% of the phosphorus emissions to Baltic Sea, that is 3700 t/a,
(HELCOM 2009) the phosphorus flow from Finnish WWTPs is considerable smaller
compared to other countries in Baltic Sea area. The difference may be due to the
untreated wastewater emissions to the sea from several countries.
5
2.2 World phosphate rock resources
The most important phosphate mineral, referred to as phosphate rock, is
Ca5(PO4)3(F,Cl,OH) (Salminen 2006). It has three forms of calcium phosphate
depending on the element of greatest share: hydroxyapatite, fluor apatite, and
chloroapatite (Laitinen and Toivonen 1982). In addition to apatite, phosphate rock
contains impurities such as arsenic, humic substances, and heavy metals, especially
cadmium, uranium and zinc. Typically, phosphate rock contains 30 40% P2O5
(Schipper et al. 2001). The phosphorus content of ore or fertilizer is often expressed as
oxide form due to earlier means to determine phosphorus content with gravimetric
methods giving the result as %P2O5 (Lippert 2010). The amount of the element
phosphorus in P2O5 is 43.6% by weight.
The largest reserves of phosphate rock occur in USA, China, and Morocco. In addition,
large deposits have been detected in the continental shelves in the Atlantic Ocean and
the Pacific Ocean. Recovering these deposits, however, is expensive. As for alternative
sources, the phosphorus deposits on the ocean floor are considered when a profitable
method of deep ocean mining is developed (U.S. Geological Survey 2010).
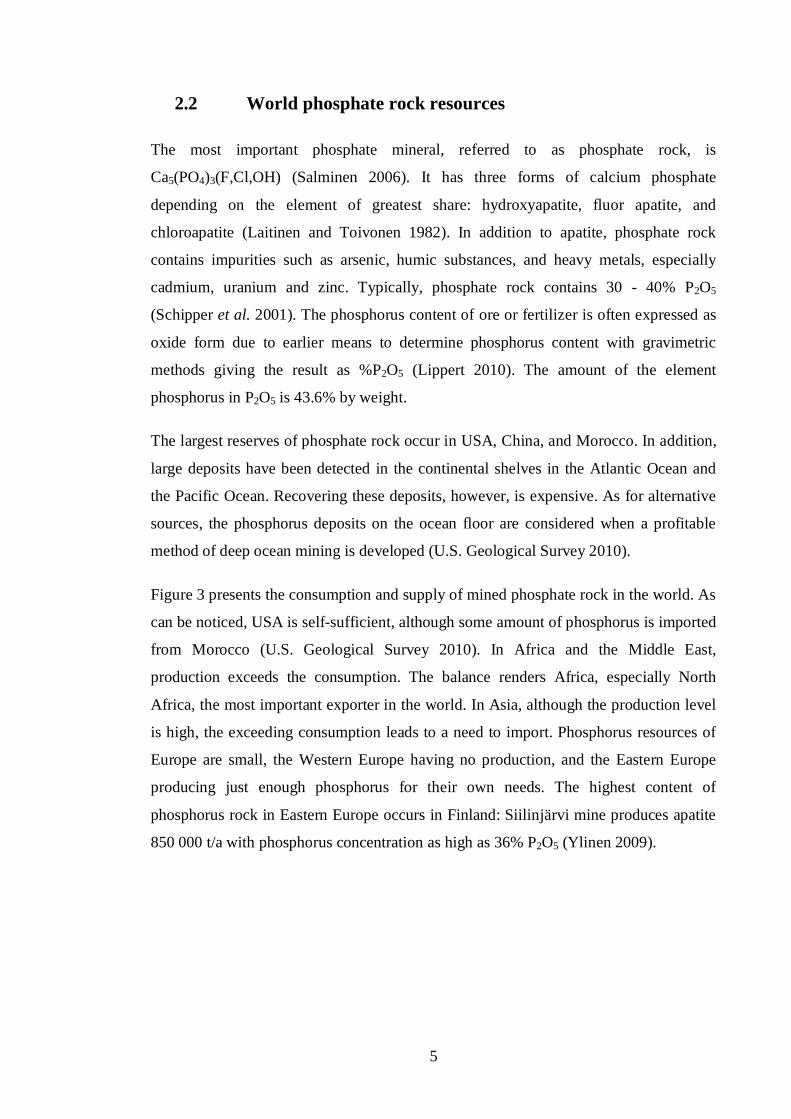
Figure 3 presents the consumption and supply of mined phosphate rock in the world. As
can be noticed, USA is selfsufficient, although some amount of phosphorus is imported
from Morocco (U.S. Geological Survey 2010). In Africa and the Middle East,
production exceeds the consumption. The balance renders Africa, especially North
Africa, the most important exporter in the world. In Asia, although the production level
is high, the exceeding consumption leads to a need to import. Phosphorus resources of
Europe are small, the Western Europe having no production, and the Eastern Europe
producing just enough phosphorus for their own needs. The highest content of
phosphorus rock in Eastern Europe occurs in Finland: Siilinjärvi mine produces apatite
850 000 t/a with phosphorus concentration as high as 36% P2O5 (Ylinen 2009).
6
Figure 3: The World phosphorus production (Adam 2009).
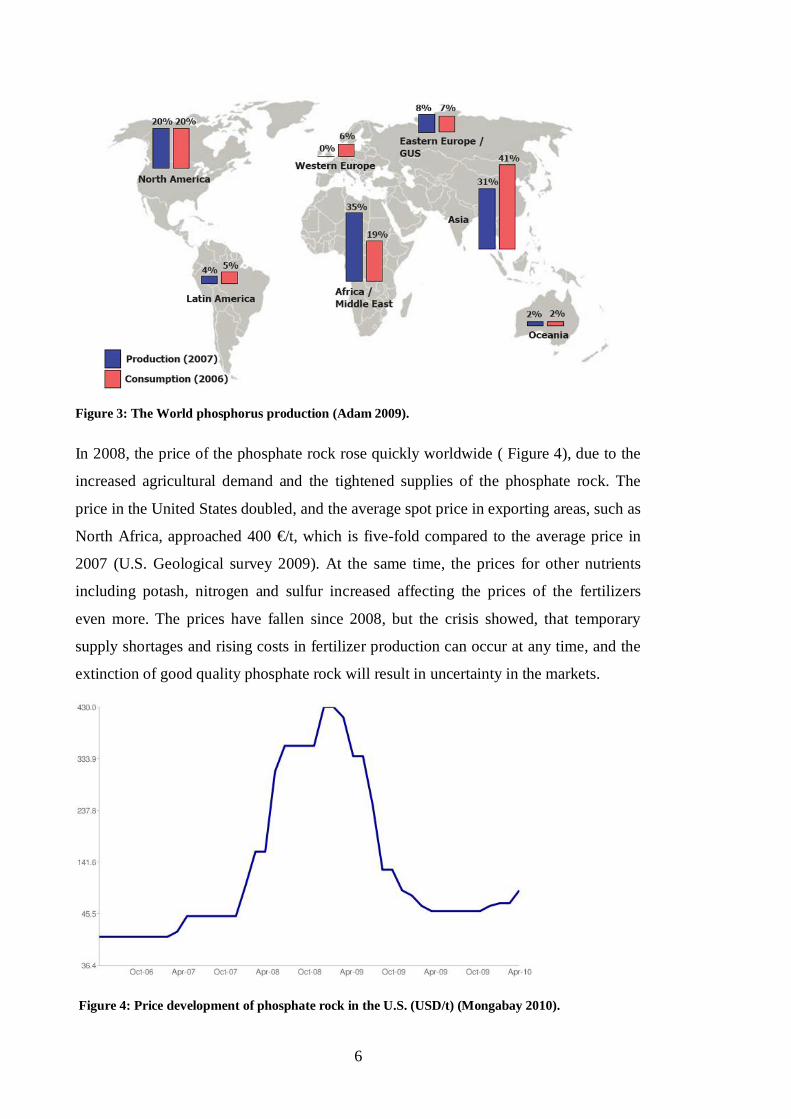
In 2008, the price of the phosphate rock rose quickly worldwide ( Figure 4), due to the
increased agricultural demand and the tightened supplies of the phosphate rock. The
price in the United States doubled, and the average spot price in exporting areas, such as
North Africa, approached 400 €/t, which is fivefold compared to the average price in
2007 (U.S. Geological survey 2009). At the same time, the prices for other nutrients
including potash, nitrogen and sulfur increased affecting the prices of the fertilizers
even more. The prices have fallen since 2008, but the crisis showed, that temporary
supply shortages and rising costs in fertilizer production can occur at any time, and the
extinction of good quality phosphate rock will result in uncertainty in the markets.
Figure 4: Price development of phosphate rock in the U.S. (USD/t) (Mongabay 2010).

7
According to the U.S. Geological survey, the phosphorus mine production in the world
has risen every year (Table 1). Due to the crisis in 2008 that decreased the production in
the US, the production estimate for 2009 is a little lower than for 2008.
Table 1: Phosphorus production in the world (U.S. Geological survey 2009 and 2010).
2006 2007 2008 2009 estimateMine production (Mt) 142 156 161 158
The estimates of the phosphorus resources sufficiency vary between 60 and 240 years
(Cornel and Schaum 2009), the most common estimate being 100 years (Driver 1999,
Balmér 2004). Another way to express the resources is the peak phosphorus indicating
the time, when easily accessible high quality phosphate rock resources deplete. Thus,
the production starts to diminish and the consumption will overrun the supply. Figure 5
shows that the estimated time for peak phosphorus is around 2033 (Cordel et al. 2009).
U.S. Geological survey (2010) estimates the economically feasible resources 16 000 Mt.
The reserve base is 47 000 Mt, containing the reserves with specified minimum physical
and chemical criteria related to current mining and production practices (U.S.
Geological Survey 2009).
Figure 5: Peak phosphorus (Cordell et al. 2009).

8
2.3 Basic chemistry
Phosphorus has the atomic number 15, atomic mass 30.974 g/mol, and one naturally
occurring isotope (31P). The main oxidation states are III, +III, and +V.
Phosphorus has three allotropes: white, red and black phosphorus. The most common
form is white phosphorus, or tetraphosphorus P4, also known as yellow phosphorus.
Tetraphosphorus has an atomic mass of 30.97 g/mol, melting point at 44 oC, boiling
point at 280 oC, and density 1.82 g/cm3 (Laitinen and Toivonen 1982). Tetraphosphorus
is highly poisonous, white, and waxylooking. The main use is as starting point in
production of other phosphorus chemicals. Having a strained bond structure it is
extremely reactive. On skin contact, it causes serious burns, which is why it is used in
military industry (RaynerCanham and Overton 2006).
Other two allotropes are red and black phosphorus. Red phosphorus is not very reactive
and is used in matches. White phosphorus transforms to red phosphorus in room
temperature, or by heating it in airless conditions to 400 oC. The third allotrope, black
phosphorus, has no significant commercial uses (Laitinen and Toivonen 1982).
As P4 is extremely reactive, it has to be stored underwater, because when exposed to air
it burns to tetraphosphorus decaoxide as in the Equation 1.
P4 (s) + 5 O2 (g)à P4O10 (s) (1)
During this reaction, electrons fall to the lowest energy state causing a visible light. This
glow in the dark has given the element its name, the bringer of light. P4O10 is used as
dehydrating agent because it reacts with water, and after several steps transforms to
phosphoric acid. Phosphorus has another oxide, tetraphosphorus hexaoxide, formed
when white P burns in shortage of oxygen as in Equation 2 (RaynerCanham and
Overton 2006).
P4 (s) + 3 O2 (g)à P4O6 (s) (2)
Phosphoric acid is colorless and transparent viscous liquid with density of 1.885 g/ml
and melting point at 42 oC. Typically, it is used as 85% water solution (Laitinen and
Toivonen 1982). Phosphorus acid decomposes in water as shown in Equations 3 5.

9
H3PO4 + H2Oà H3O+ + H2PO4 pKa = 2.12 (3)
H2PO4 + H2Oà H3O+ + HPO4
2 pKa = 7.21 (4)
HPO42 + H2Oà H3O+ + PO4
3 pKa = 12.67 (5)
Phosphates occur in three different forms depending on the pH (Figure 6). Between pH
4 and pH 6, the most common form is dihydrogen phosphate H2PO4. In neutral pH area,
hydrogen phosphate HPO42 is the predominant form, and above pH 12.5,
orthophosphorus PO43 (RaynerCanham and Overton 2006).
Figure 6. Relative proportions of orthophosphorus species (Lanning 2008).
Phosphates are, except for the monopositive alkali metals and ammonium phosphates,
insoluble. Heavy metal phosphates are sparingly soluble. Water solutions of phosphates
are alkaline as shown in Equation 6 (Laitinen and Toivonen 1982).
PO43+ H2O HPO4
2 + OH (6)
Typically, in natural environment, phosphorus occurs as the fully oxidized form
orthophosphate PO43. Natural phosphorus levels in fresh water are low, 10 25 µg/l
because Al, Fe, Mn and Ca bind PO4–P by forming poorly soluble salts. Other forms of
dissolved phosphate include inorganic polyphosphate and organic phosphorus
compounds, mainly in complexes with organic acids (Salminen 2006).

10
2.4 Applications
2.4.1 FERTILIZERS
According to the U.S. Geological Survey (2010), the major part, about 80 to 90% of the
mined phosphate rock is used in fertilizer industry. For example, the Unites States
processed about 95% of all mined phosphate rock to phosphoric acid or
superphosphoric acid. Both of the chemicals are needed in fertilizer production and in
animal fodder supplements. About 45% of the phosphorus acid produced in the United
States was exported as upgraded granular fertilizers MAP (magnesium ammonium
phosphate) or DAP (diammomium phosphate).
Phosphorus together with nitrogen and potassium are the three primary nutrients. In
addition, fertilizers can contain secondary nutrients (Ca, Mg, S) and micronutrients such
as Mn, B, Zn, and Fe. Fertilizers need to have a suitable structure for easy apply to
fields, nutrients in plant available form, and low concentrations of harmful substances
(Ylinen 2009). The most beneficial fertilizer is DAP, containing both nitrogen and
phosphorus in soluble form. Phosphorus solubility in citric acid is used as an indicator
of bioavailability. Another indicator is the solubility in water. However, compounds
with high water solubility can be easily washed away from soil to water system
(SUSAN 2008). Another way to measure plant availability is the pot test, where certain
plants are grown and fertilized in pots, and the phosphorus uptake is measured as
mg/P/pot.
2.4.2 DETERGENTS
Phosphates are used in household cleaners for softening the water in order to enhance
the washing process, for removal and prevention of encrustation on fibers, and as
carriers of other detergent ingredients. Annually, the EU25 countries, with total
population of 456 million people, consume about 110 000 t of phosphorus as detergents.
For comparison, the use of phosphates in fertilizers is equivalent to approximately 1.25
million t/a of phosphorus (EU Commission 2007).
The type of phosphate most commonly used in detergents is sodium tripolyphosphate
(STPP). Concern over eutrophication has resulted in decreased use of phosphate
containing detergents in many countries, and replacing phosphates with other chemicals.

11
The main alternative to STTP in laundry detergents is zeolite. However, dishwashing
detergents are still mainly phosphatebased (EU Commission 2007).
2.4.3 OTHER
In addition to household cleaners, phosphorus compounds are used in other daily
products such as toothpastes and shampoos. In food industry, they are part of baking
powders, and are present in bottled soft drinks as phosphoric acid, preventing bacterial
growth and buffering the pH. Metallic manganese, iron and zinc containers, especially
those for food, are typically “phosphatised” to provide an inert and insoluble coating to
prevent metal release to food and thus, metal poisonings (RaynerCanham and Overton
2006).
Phosphate compounds (e.g. phosphoryl trichloride) are used in textiles and other
flammable materials such as synthetic polymers, paints and protective coatings for
wood. These materials are treated with phosphorus compounds to reduce the risk of fire.
In electric devices, phosphorus oxychloride is used simultaneously as plasticizer and
flame retardant to decrease the risks caused by the electricity and heat in the machines.
High temperature lubricants contain phosphorus pentasulphide to reach a good
lubrication, thermal stability and fireresistant properties. Phosphoryl chloride can also
be used in separation uranium and plutonium compounds (RaynerCanham and Overton
2006).
In potable water treatment, phosphorus is used for iron, magnesium, and corrosion
control, lead and copper removal, and scale inhibition. These ions occur in bivalent
form in ground water and need to be removed for softening the water (Phosphate Forum
of the Americas 2010).
2.5 Production
2.5.1 WET CHEMICAL PROCESS
As stated earlier in 2.4.1, most of the mined phosphate rock processed to phosphoric
acid for fertilizer production. Typically, high quality phosphoric acid is not necessary in
fertilizer industry. Thus, it can be produced straight from phosphate rock in wet
12
chemical process that is more energy efficient than the electrochemical process
producing elemental P4.
In the wet process, phosphorus rock reacts with sulfuric acid producing phosphoric acid
and calcium sulfate (Equation 7) (Schipper et al. 2001).
Ca3(PO4)2 (s) + 3 H2SO4 (aq)à 3 CaSO4 (s) + 2 H3PO4 (aq) (7)
Calcium sulfate is separated by filtration and can be used in building industry. However,
a part of it must be landfilled since the demand of calcium sulfate is not high. Another
waste stream occurs, as the acid is concentrated in the end of the process. Impurities
precipitate and the resulting slime need to be disposed of in environmentally safe
manner (RaynerCanham and Overton 2006).
2.5.2 ELECTROTHERMAL PROCESS
Electrothermal process is a method for producing elemental phosphorus P4 that can
further be processed to high quality phosphoric acid or other phosphorus compounds.
Production is expensive, but high purity level is needed in applications such as chemical
and food industry, requiring the removal of more than 99% of the impurities in the raw
material (Morse et al. 1998). The United States processes approximately 5% of mined
phosphate rock in electrothermal process (U.S. Geological survey 2010).
P4 is very reactive and produced with extreme methods. Production requires great
amount of electricity. For example, a phosphorus producing company Thermphos
International B.V. uses 12 TJ annually (Thermphos 2010). It would be economical to
locate the production plants in countries where electrical energy is available with low
costs (RaynerCanham and Overton 2006). Figure 7 presents an example of an electro
thermal process.

13
Figure 7: Electrothermal production of elemental phosphorus (Schipper et al. 2001).
The first step prepares the raw material, calcium phosphate rich phosphate rock, for the
actual electro chemical process. The phosphate rock is milled and ground to the particle
size 1 to 2 cm, and dried and sintered to form pellets. In the second step, the pellets are
mixed with sand (SiO2) and coke before feeding them to the electric furnace. An electric
current create a temperature of 1500°C in the furnace, producing elemental phosphorus,
CO2, CaO, as shown in the Equation 8. In addition, the furnace produces an amount of
dust collected by electrostatic precipitators and recycled back to the pelletizing stage.
2 Ca3(PO4)2 (s) + 10 CO (g)à 6 CaO (s) + 10 CO2 (g) + P4 (g) (8)
14
The gaseous P4 is condensed by spraying it with water. Average production in
electrochemical process using 180 000 A (500 V) current by 60ton carbon electrodes is
5 t/h of tetraphosphorus (RaynerCanham and Overton 2006). Further processing to
phosphoric acid occurs by burning the white phosphorus, and adding water to the oxide,
according to the Equation 9.
P4O10 (s) + 6 H2O (l)à 4 H3PO4 (l) (9)
In the process, coke is used as a reducing agent in the reaction with CO2 (Equation 10).
The CO gas can be used as fuel in sintering step and furnace.
CO2 (s) + C (s)à 2 CO (g) (10)
Calcium oxide reacts with sand forming calcium silicate slag as in the Equation 10. The
slag needs to be tapped, cooled, and crushed, and is used in road constructions.
CaO (s) + SiO2 (s)à CaSiO3 (slag) (11)
Another byproduct is ferrophosphorus Fe2P, a dense liquid that is tapped from the
bottom of the furnace. The ferrophosphorus containing about 75% of iron and 25% of
phosphorus can be used as steel additive in specialty steel products (Schipper et al.
2001).

15
3 PHOSPHORUS REMOVAL
3.1 Phosphorus in wastewater treatment plant
Phosphorus content in the sewage systems derives from industrial and domestic sources.
Main domestic sources are human metabolic waste, detergents and cleaning products.
Human waste load to sewage is approximately 0.6 kg/a and load from detergents 0.3
kg/a per capita (Parsons and Smith 2008, Cornel and Schaum 2009).
An average phosphorus concentration in sewage is 4 to 16 mg/l (Metcalf & Eddy 2003).
Approximately 50% is in soluble inorganic orthophosphate form, 35% are complex
inorganic phosphates (polyphosphates) such as those from detergents phosphates, and
15% are organic phosphates found in organic matter and cell protoplasm (Vesilind
1998, Parsons and Smith 2008).
Phosphorus bound in the solid particles comprises about 11% of total phosphorus load
to WWTPs and is removed in the primary treatment (Cornel and Schaum 2009). In the
secondary treatment, phosphorus is needed in the activated sludge process as the
substrate for microorganisms. Activated sludge requires the BOD5/P ratio of 1:100 that
equals the requirements of any other biological process (Vesilind 1998). Therefore,
biological treatment can remove 20 to 30% of phosphorus even without specific
phosphorus removal process (Metcalf & Eddy 2003, Parsons and Smith 2008). The
remaining phosphorus that is not bound in the activated sludge process, is removed with
chemical precipitation or with biological phosphorus removal. These methods can be
combined and used simultaneously, or, to have the chemical precipitation as back up to
ensure the quality of effluent in varying conditions. Overall, with modern technology it
is possible to remove over 95% of the incoming phosphorus (Metcalf & Eddy 2003).
The EU Directive 91/271/EEC defines the discharge limits for total phosphorus
concentrations in WWTP effluent. In sensitive areas subject to eutrophication, the
concentrations measured with molecular absorption spectrophotometer should be:
2 mg/l total phosphorus, when p.e. 10 000 – 100 000
1 mg/l total phosphorus, when p.e. > 100 000.

16
The minimum reduction in relation to the load of the influent is 80%. Depending on the
local circumstances, it is possible to apply only one or both of the limit values. In
Finland, the current requirement for large and medium sized WWTPs is 0.3 mg/l total
phosphorus and at least 95% reduction. These requirements are met with chemical
precipitation because the biological phosphorus removal process alone cannot ensure
the required efficiency (Mäkelä 2004).
3.2 Chemical phosphorus removal
Phosphorus removal by chemical precipitation is a relatively simple and effective
method, removing dissolved phosphorus from wastewater. The wastewater phosphorus
is bound with coagulants containing two or three valent metal salt such as iron and
aluminum chloride or sulfate, or calcium hydroxide. The coagulants react with
phosphorus and other impurities in wastewater. The reactions are affected by side
reactions that are dependent on alkalinity, pH, trace elements, and ligands. Thus, the
chemical consumption can only be estimated from the stoichiometric molar ratios. The
precipitation can occur in several steps in the wastewater treatment process, the most
feasible step being the secondary treatment (Metcalf & Eddy 2003).
The most commonly used phosphorus removal chemical is iron coagulant containing
Fe2+ and Fe3+ ions. The reaction between iron and water forms also ferric hydroxide. As
can be seen in the Equation 12, the molar ratio Fe:PO4 for phosphorus removal is 1:1.
However, the ferric hydroxide formation creates a need for additional 10 mg/l of Fe
(Vesilind 1998).
Fe3+ + y H2O + x PO43à Fe(OH)y(PO4)x + y H+ (12)
Vesilind (1998) estimates a dosage of 15 to 30 mg/l to precipitate 85 – 90% of the
municipal wastewater phosphorus. Optimum pH range is 4.5 to 5 (Figure 7) but
significant phosphorus removal can be obtained above pH 7.

17
Figure 8: The phosphate precipitants and pH (Montag 2008).
Another common coagulant is aluminum that has the minimum solubility between pH
5.5 and 6.5. Aluminum sulfate results in a small depression in pH, so it can be operated
in neutral area (Vesilind 1998). Aluminum reacts as in Equation 13.
PO43 + Al3+à AlPO4 (13)
Calcium is typically added to the water as Ca(OH)2. The amount of calcium needed to
precipitate phosphorus is dependent on the total alkalinity, because calcium reacts first
with bicarbonates in water, forming calcium carbonate. Only above pH 10, the excess
calcium reacts with phosphorus precipitating hydroxyapatite (HAP) as in the Equation
14 (Metcalf & Eddy 2003). The molar ratio Ca:PO4 may vary between 1.3 and 2.0
because of the changes in the composition of the precipitated HAP. This is because the
product calcium phosphate can precipitate in different forms as discussed later in
Chapter 4 (Vesilind 1998).
5 Ca2+ + 3 PO43 + OH Ca5(PO4)3OH (14)
The flocks contain calcium carbonate formed in calcium reaction with bicarbonates.
CaCO3 is dense, and enhances the settling of the flock. Low alkalinity in wastewater
results in small amount of calcium carbonate, thus decreasing the settleability of the
flock. If alkalinity is high, excellent rates of phosphorus removal can be achieved in pH
9.5 to 10 (Vesilind 1998).
18
Phosphorus removal with calcium is typically not feasible due to the adjustment of pH
before and after the precipitation, and the operational problems such as the handling,
storage and feed of the chemical. Moreover, calcium precipitation produces larger
amount of sludge compared to the iron and aluminum salts (Metcalf & Eddy 2003).
Although being an efficient way to remove phosphorus from wastewater, the chemical
precipitation has negative effects downstream. In fact, a large amount of sludge is
formed, requiring appropriate treatment. In digestion, especially iron result in lower
biogas consumption (Parsons and Smith 2008). In addition, chemical phosphorus
removal can rule out some of the phosphorus recovery possibilities.
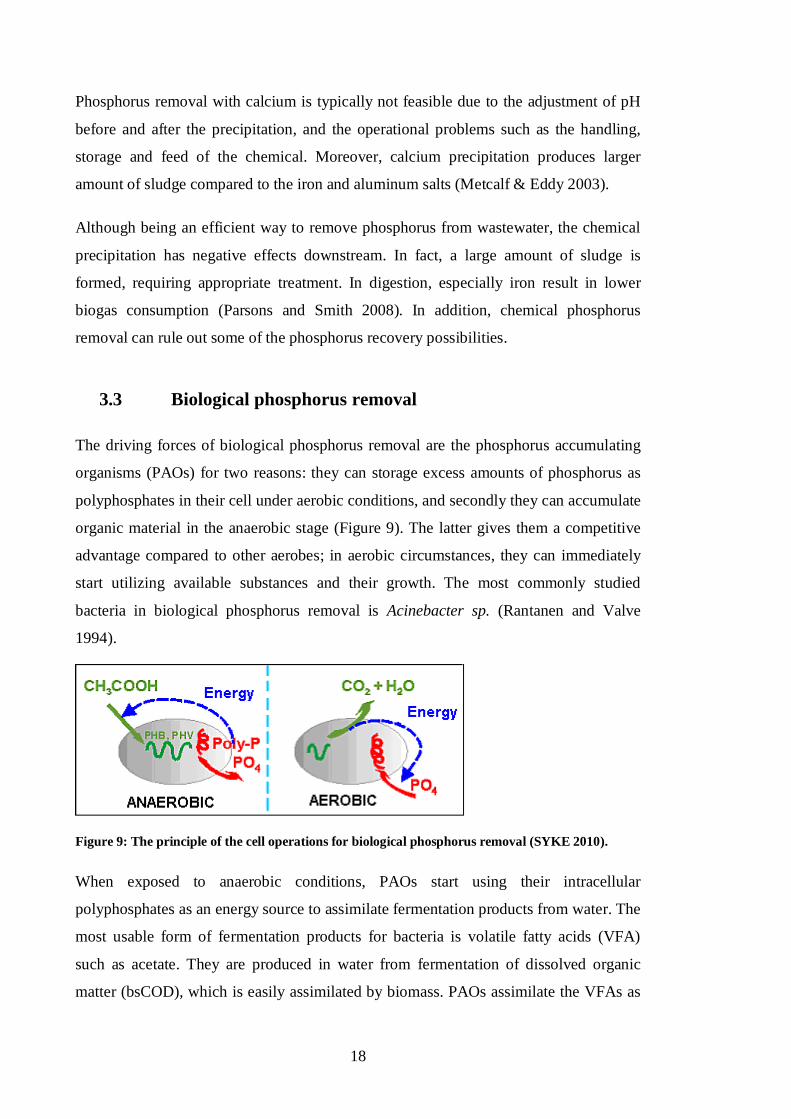
3.3 Biological phosphorus removal
The driving forces of biological phosphorus removal are the phosphorus accumulating
organisms (PAOs) for two reasons: they can storage excess amounts of phosphorus as
polyphosphates in their cell under aerobic conditions, and secondly they can accumulate
organic material in the anaerobic stage (Figure 9). The latter gives them a competitive
advantage compared to other aerobes; in aerobic circumstances, they can immediately
start utilizing available substances and their growth. The most commonly studied
bacteria in biological phosphorus removal is Acinebacter sp. (Rantanen and Valve
1994).
Figure 9: The principle of the cell operations for biological phosphorus removal (SYKE 2010).
When exposed to anaerobic conditions, PAOs start using their intracellular
polyphosphates as an energy source to assimilate fermentation products from water. The
most usable form of fermentation products for bacteria is volatile fatty acids (VFA)
such as acetate. They are produced in water from fermentation of dissolved organic
matter (bsCOD), which is easily assimilated by biomass. PAOs assimilate the VFAs as
19
organic carbon polymers. For example, acetate is assimilated as polyhydroxybutyrates
(PHB). At the same time, PAOs release phosphorus as orthophosphates (PO4P) with
some amounts of magnesium, potassium and calcium. When PAOs are taken to aerobic
conditions, they start to utilize the organic matter and phosphorus in water immediately,
thanks to the energy from stored PHBs. As well as energy, oxidation of PHBs provides
carbon for new cell growth, giving more space for polyphosphates assimilated from
previously released orthophosphates and stored into the bacteria cells (Metcalf & Eddy
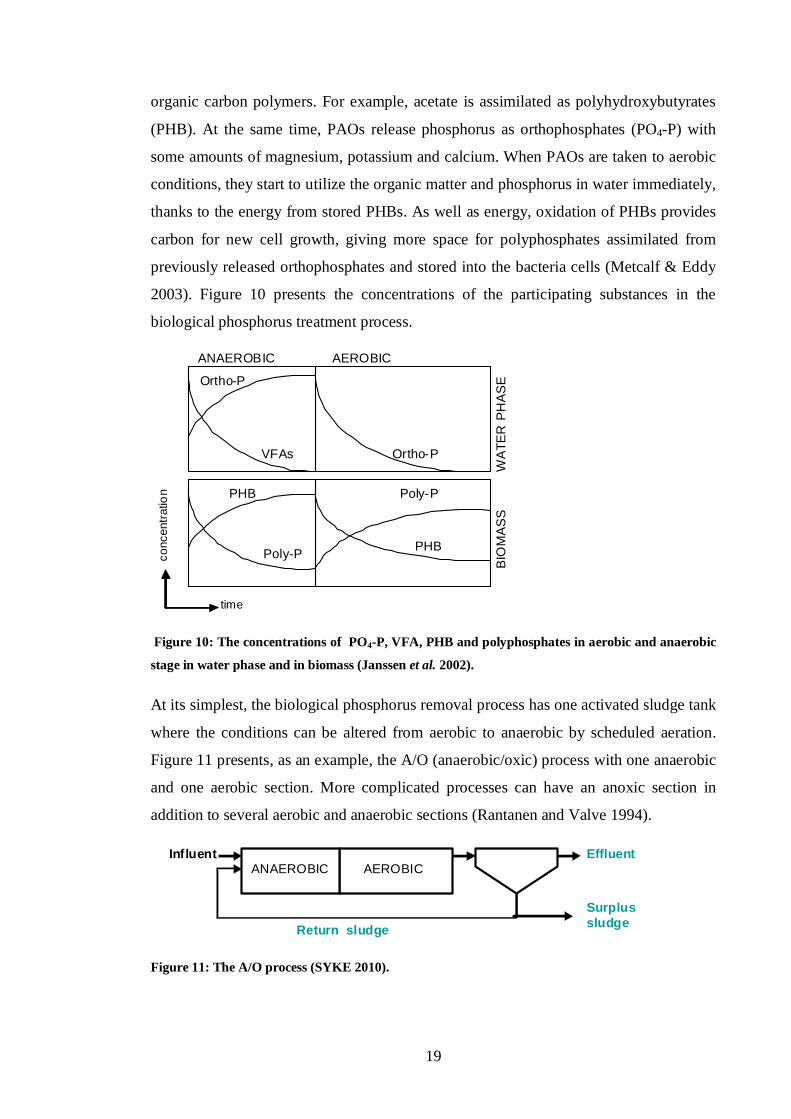
2003). Figure 10 presents the concentrations of the participating substances in the
biological phosphorus treatment process.
Figure 10: The concentrations of PO4P, VFA, PHB and polyphosphates in aerobic and anaerobic
stage in water phase and in biomass (Janssen et al. 2002).
At its simplest, the biological phosphorus removal process has one activated sludge tank
where the conditions can be altered from aerobic to anaerobic by scheduled aeration.
Figure 11 presents, as an example, the A/O (anaerobic/oxic) process with one anaerobic
and one aerobic section. More complicated processes can have an anoxic section in
addition to several aerobic and anaerobic sections (Rantanen and Valve 1994).
Figure 11: The A/O process (SYKE 2010).
VFAs
OrthoP
PHB
PolyP PHB
OrthoP
PolyPW
ATE
R P
HA
SE
BIO
MA
SS
time
conc
entra
tion
ANAEROBIC AEROBIC
AEROBICANAEROBICInfluent Effluent
SurplussludgeReturn sludge

20
Anaerobic stage of the process is very sensitive to molecular oxygen. Even a small
amount of oxygen can prevent the phosphorus release, which is a condition to phosphate
bonding. This problem may occur in the anaerobic stage when oxygen or nitrogen are
present in the inflow. On the other hand, this property is beneficial, because in order to
keep phosphorus bound in the sludge, aerobic conditions must remain. After aeration,
the oxygen concentration in the sludge should be 2 mg/l to prevent the release of
phosphorus (Rantanen and Valve 1994).
Biological phosphorus removal has several benefits compared to chemical phosphorus
removal. The sludge from biological process has better value in agricultural use due to
the higher content of plant available phosphorus and the lack of the chemicals used in
precipitation process. In addition, biological phosphorus removal created a possibility
for a side stream phosphorus recovery process. The operating costs of chemical process
are subject to change due to varying price of flocculants (Stratful et al. 1999). However,
the biological process needs the addition of bsCOD, that can be costly. In addition it is
not as flexible as the chemical process (Metcalf & Eddy 2003). The limit values for
phosphorus concentration in WWTP effluent are strict. Thus, it may be necessary to use
chemical phosphorus removal instead, or in addition to biological process.
3.4 Sludge treatment
3.4.1 ANAEROBIC DIGESTION
Anaerobic digestion is one of the most widely used methods for sludge stabilization at
WWTPs. From the phosphorus recovery point of view, it creates a phosphate rich side
stream that can be utilized in recovery processes. Anaerobic digestion reduces the
amount of pathogens as well as the quantity of biomass by destructing volatile solids.
The destruction level of volatile solids is 40 to 65% depending on the content of the
easily degradable solids such as simple carbohydrates, cellulose, proteins and grease in
the sludge. The solids affect the gas formation level and gas quality. Building the
facility requires careful planning and the machinery increasing the investment cost
(Vesilind 1998).
Anaerobic digestion is a result of complicated chemical and bacterial reactions. The
process includes three steps: hydrolysis, formation of soluble organic compounds and

21
shortchained organic acids, and methane formation. In the hydrolysis stage, the
facultative anaerobic bacteria convert the volatile organic substances such as proteins,
cellulose and lipids producing soluble compounds to soluble form. Hydrolysis is slow
and often the limiting step in anaerobic digestion. In the second stage, the acid forming
bacteria dissolve the compounds from the hydrolysis to soluble organic compounds
such as longchained fatty acids, and further to shortchained organic acids, such as
acetate. The last stage, called methanogenesis, produces final products: methane gas,
CO2, H2S, and mineral salts, such as Mg and K. The typical value of digested substrate
is pH 7.5 – 8.5 (Vesilind 1998, Vesterager 2009).
3.4.2 MONOINCINERATION
In order to use sewage sludge ash for phosphorus recovery, the sludge must be mono
incinerated without bark, solid waste or any other added material. Incineration is
relatively popular method for sludge disposal: 20% of Europe is disposed of by
incineration (Table 2).
Table 2: Sewage sludge production and monoincineration facilities in selected countries (ASH
DEC 2009).
Sewage sludge(t/a DS)
Share of monoincineration (%)
Operationalplants
USA 8 200 000 22 170Europe 8 330 000 20 ~80Austria 245 000 31 3Germany 2 450 000 28 23Switzerland 203 000 47 14Japan 3 000 000 50 100
Sludge incineration has advantages such as energy integration and high mercury
removal. In incineration process, phosphorus concentrates and absorbs in the ash.
Organic pollutants including PCB’s, dioxins, hormones and POPs, are destroyed. The
modern technology is reliable and the emissions controlled with specific flue gas
cleaning system.
An example of a sewage sludge incineration plant is N.V. Slibverwerking Noord
Brabant (SNB), the largest sludge incineration plant in Europe, located in Moerdijk, the
southern part of the Netherlands.

22
SNB processes more than 410 000 t/a of sludge. The sludge holding a 23% dry solid
content is transported to SNB with trucks. The plant has storage facilities to buffer the
seasonal changes of the incoming sludge: during winter and spring the amount of sludge
is larger than in the summer. The trucks are unloaded in sludge bunker and the sludge is
predried. The sludge leaves the predryer with dry solids content of 35 40% and
enters the fluidizedbed furnace. The temperature in the furnace is 850 900 oC.
Production of ash in SNB is 36 000 t/a containing approximately 10% of phosphorus
(Korving 2010).
The process consists of four incineration lines one of which incinerates ironpoor sludge
from biological phosphorus removal processes and processes using aluminum as
precipitation chemical. The iron poor ashes can be recycled in the process of
phosphorus chemical producer Thermphos as discussed later in the Section 3.5.2. SNB
has tried to increase the amount of iron poor sludge by recommending WWTPs to
change from the iron precipitants to aluminum precipitants, or to implement biological
phosphorus removal.
Although the precipitation chemical is the main reason for iron concentrations in the
sludge, relatively high iron concentrations occur in WWTP using biological phosphorus
removal or aluminum precipitant. In these cases, the iron sources need to be searched
upstream. Several reasons have been detected including iron dosage to digesters to
prevent the formation of H2S; discharge of ironcontaining sludge to sewer by potable
water treatment plants; and the leakage of ironcontaining groundwater to the sewage
system (Korving 2010).
Korving (2010) estimated that in the future, the amount of monoincinerated sludge ash
recycled in phosphorus production in Thermphos could be maximally 50% of the
incinerated sludge. However, a realistic estimate is 40%.
3.5 Phosphorus recycling
3.5.1 AGRICULTURAL USE
Municipal wastewater sludge contains nutrients and organic material that are needed in
the agriculture as fertilizers. Spreading sewage sludge on the fields is the most

23
economical route for disposal of biosolids (Andersen and Sede 2002), and
simultaneously recycling the nutrients. However, unlike in the commercial fertilizers
described in Section 2.4.1, the nutrients in the sludge may not be in the optimal form or
quantity for plant production. In addition, the sludge contains micropollutants,
pathogens and heavy metals that are subject to transmit to humans. Thus, the
agricultural use of sludge has decreased, mainly because of the public opinion
(Rantanen et al. 2008). For example, the agricultural use of sludge in Finland decreased
from 33% in 1995 to 17% in 2003, reaching 3% in 2007 (Salado et al. 2009). Other
reasons include high concentrations of heavy metals and organic substances. In
addition, the use as a fertilizer is seasonal, creating a need to storage the material during
the wintertime (Rantanen et al. 2008).
Table 3: Limit values for heavy metal concentrations in agricultural use.
EU(mg/kg DS)
Finland(mg/kg DS)
Germany(mg/kg DS)
Holland(mg/kg DS)
Directive86/278 MMM 2007 DüMV 2008 BOOM
As 25 40 15Cd 20 40 1.5 1.5 1.25Cr 300 75Cu 1000 1750 600 75Hg 16 25 1 1 0.75Ni 300 400 100 80 30Pb 750 1200 100 150 100Zn 2500 4000 1500 300
In the German fertilizer ordinance (DümV 2008), copper and zinc are considered
micronutrients in concentrations 200 700 mg/kg and 200 – 5000 mg/kg, respectively
(Petzet and Cornel 2009). In Finland, the spreading of phosphorus is limited by Ministry
of Agriculture and Forestry (MMM 2007) to prevent the possible leaking of phosphorus
containing water to the surface water and groundwater. The permitted amount of soluble
phosphorus used in five year period in landscaping and agriculture is < 750 kg/ha and <
400 kg P/ha, respectively.
3.5.2 RECYCLING IN PHOSPHATE INDUSTRY
An example of recycling phosphorus in other than fertilizer industry is the cooperation
between the chemical company Thermphos International B.V. and SNB. The former

24
produces high quality phosphate chemicals for markets including pharmaceuticals, food
and feed additives, beverages, flameretardants and crop protection.
The company replaces the phosphate rock in the electrothermal process (Section 2.5.2)
with the monoincinerated sewage sludge ash from the SNB incineration plant. This
section discusses the quality requirements for the secondary material used in replacing
phosphate rock in the process. Table 4 presents the requirements for phosphorus content
as well as the most important substances disturbing the electrothermal process: copper,
zinc and iron. These values are compared to the ash from chemical and biological
phosphorus removal process, and calcium phosphate from Geestmerambacht, the
Netherlands, where phosphorus is recovered from sewage. As can be seen, the most
beneficial secondary raw material would be calcium phosphate corresponding with
phosphate rock (Morse et al. 1998, Schipper 2010). Thermphos used to receive 150 t/a
calcium phosphate from Geestmerambacht, but high operational costs have restricted
the plants phosphorus recovery and Thermphos utilizes only ash from SNB as
secondary raw material in the phosphorus production process.
Table 4: Requirements for secondary raw material compared to ash from chemical and biological
phosphorus removal process, and calcium phosphate (Schipper et al. 2001).
P2O5(g/kg)
Cu(g/kg ash)
Zn(g/kg ash)
Fe(g/kg ash)
Requirements for raw material > 250 < 0.500 < 0.100 < 10
Sewage sludge ash from primaryand secondary sludge 190 1600 3500 16
Ash from biological phosphorusremoval process 360 1500 3100 < 10
Geestmerambacht Ca3(PO4)2 260 1.6 35
Typically, P2O5 content of phosphate rock is 30 40%, which equals 13 17.5% of
phosphorus (Schipper et al. 2001). Iron is the most harmful impurity in the raw material
since it causes capacity problems by binding phosphorus, thus increasing the amount of
produced ferrophosphate slag that has no commercial value and limited ways of use.
Moreover, the slag requires a special cooling process increasing the energy
consumption. Aluminum, on the other hand, replaces the SiO2 needed in the process,
thus not affecting the energy balance (Schipper et al. 2001).
Another problem is the volatile metals such as zinc, cadmium and lead. They are
recycled in the process with the furnace dust, thus accumulating in the system and
25
creating a need for purges. Due to isotopes, such as 210Pb, the recycled material is
slightly radioactive, increasing the disposal costs (Schipper et al. 2001).
Table 5 presents other substances with negative impact on the electrothermal process.
Table 5: Impurities in secondary raw material and the ways and reasons of the interference of the
process (Schipper et al. 2001)
Chloride Causes corrosion in the sintering and granulationstep.
Copper Ends up in the ferrophosphorus slag, decreasingit's value as steel additive.
Cu < 500 mg/kgash
Moisture Technical limitations, since the process isdesigned for dry material .
Low moisturecontent
Organic material, Alkalimetal salts
Decreases the pellet strength after sintering, thuslimiting the plant capacity C < 5%
Ammonium Volatilizes in the sintering step causing emissionsor problems in gas scrubbing.
Struvite can notbe used
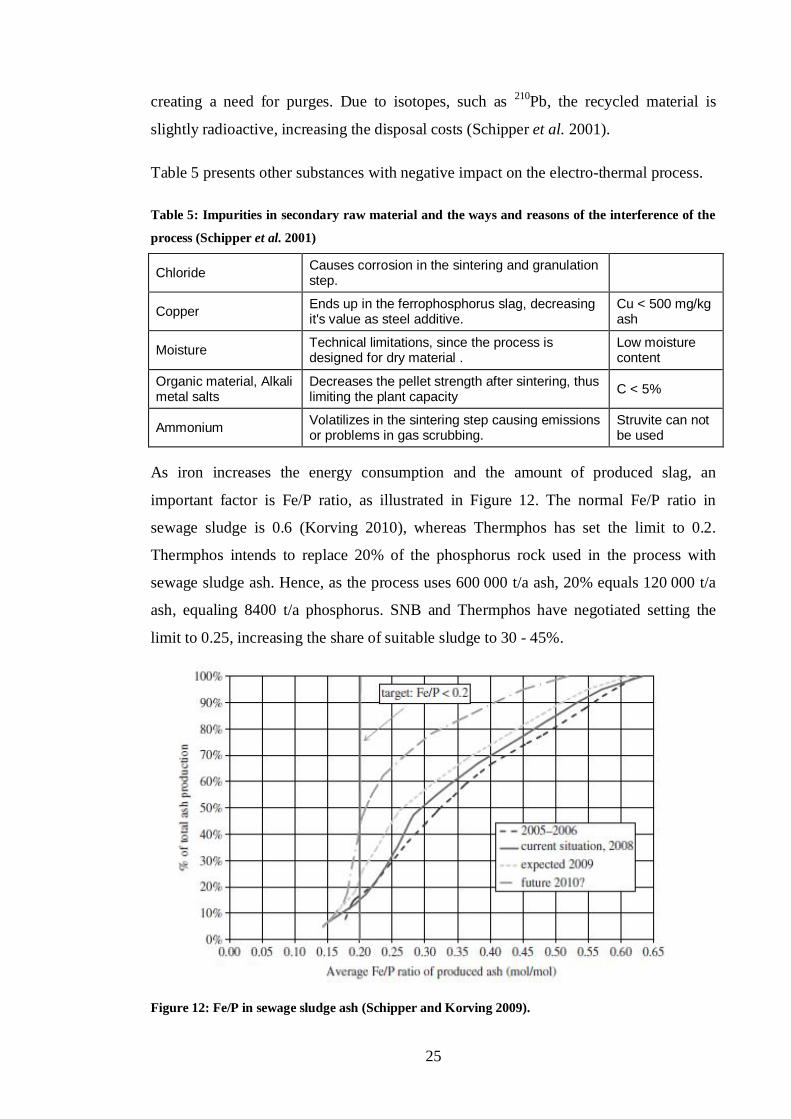
As iron increases the energy consumption and the amount of produced slag, an
important factor is Fe/P ratio, as illustrated in Figure 12. The normal Fe/P ratio in
sewage sludge is 0.6 (Korving 2010), whereas Thermphos has set the limit to 0.2.
Thermphos intends to replace 20% of the phosphorus rock used in the process with
sewage sludge ash. Hence, as the process uses 600 000 t/a ash, 20% equals 120 000 t/a
ash, equaling 8400 t/a phosphorus. SNB and Thermphos have negotiated setting the
limit to 0.25, increasing the share of suitable sludge to 30 45%.
Figure 12: Fe/P in sewage sludge ash (Schipper and Korving 2009).

26
4 PHOSPHORUS RECOVERY
4.1 National policies
In Finland, phosphorus recovery has received little attention. Approximately 80% of the
phosphorus is used in landscaping (Rantanen et al. 2008) and the only approach to
nutrient recycling is a minor fraction of 3% through agriculture. However, the common
interest towards the phosphorus recovery in Europe has arisen, and some countries have
launched national goals to promote the matter.
In December 2002, the Swedish Environmental Protection Agency (SEPA) announced a
longterm objective to recycle 60% of phosphorus from sewage by the year 2015 (SEPA
2002). The wastewater fraction should be returned to natural cycle or if not possible, be
utilized as energy. The aim was to increase the fraction of biosolids in agricultural use
to recycle the nutrients.
In March 2003, Germany announced the objective to develop new technologies in the
branch of phosphorus recovery (CEEP 2003). In 2004, German Federal Ministry of
Education and Research (BMBF) and German Federal Ministry for the Environment,
Nature Conservation and Nuclear Safety (BMU) launched the funding program
"Recycling management of plant nutrients, especially phosphorus" consisting of seven
projects, as listed in Table 6 (BMBF/BMU 2010). The program aims at activating new
processes for industry producing fertilizers, fertilizer components, or ingredients for the
fertilizer industry using recycled products. In addition to phosphorus, the program wants
the processes to recover other plant nutrients, such as nitrogen and potassium, present in
the materials used for recovery, including sewage (water, sludge, ash) and byproducts
from food industry and agriculture, such as meat bone meal and manure. The recovered
products should be usable as fertilizers or in fertilizer industry without further treatment,
containing phosphorus and other nutrients in a plant available form, and having heavy
metal and organic pollutant levels under limit values. The program has spawn at least
one new process, the PASH (Phosphorus recovery from ash), described later in Chapter
6.

27
Table 6: The projects of the funding program "Recycling management of plant nutrients, especially
phosphorus" (BMBF/BMU 2010).
Accompanying projects:
PhoBeRecycling of Phosphorus Ecological and Economic Evaluation ofDifferent Processes and Development of a Strategical RecyclingConcept for Germany
Göttingen Phosphorus recycling Characterization of the effect of recycledphosphate fertilizers by field and pot experiments
Technical projects:
PASCH Recovery of plant nutrients, especially phosphorus from ash ofsewage sludge as well as meat and bone meal
Phoxnan Optimized phosphorus recycling from waste water sludges by thecombination of low pressure wet oxidation and nanofiltration
ProPhos Phosphorus recovery from wastewater, sewage sludge and sewagesludge ashes
RECYPHOS Phosphorus recycling Sustainability contribution at the decentralwastewater treatment
PHOSIEDI Phosphorus Recovery using IonExchange and Electrodialysis
4.2 Locations for phosphorus recovery
A wastewater treatment process offers several locations for phosphorus recovery,
presented in Figure 13. Raw material options for phosphorus recovery processes
presented in this section include liquid phase (1), sludge (2), and monoincinerated
sludge ash (3).
Figure 13: Possible locations for phosphorus recovery (modified from Adam 2009 and Cornel and
Schaum 2009).
INCINERATION1c
32a
1a
1b
DEWATERING
SECONDARYSEDIMENTATION
PRIMARYSEDIMENTATION ACTIVATED SLUDGE
ANAEROBIC
ANAEROBICDIGESTION
2b
ANOXIC AEROBICANAEROBIC
INCINERATION1c
32a
1a
1b
DEWATERING
SECONDARYSEDIMENTATION
PRIMARYSEDIMENTATION ACTIVATED SLUDGE
ANAEROBIC
ANAEROBICDIGESTION
2b
ANOXIC AEROBICANAEROBIC
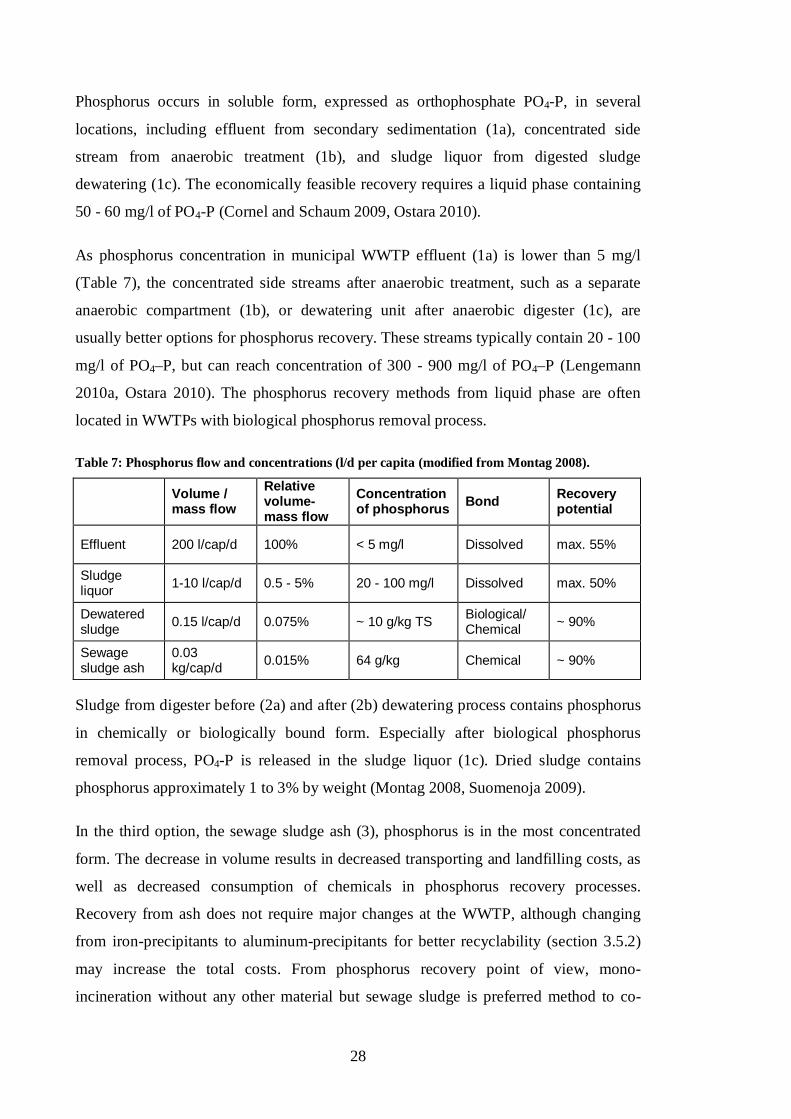
28
Phosphorus occurs in soluble form, expressed as orthophosphate PO4P, in several
locations, including effluent from secondary sedimentation (1a), concentrated side
stream from anaerobic treatment (1b), and sludge liquor from digested sludge
dewatering (1c). The economically feasible recovery requires a liquid phase containing
50 60 mg/l of PO4P (Cornel and Schaum 2009, Ostara 2010).
As phosphorus concentration in municipal WWTP effluent (1a) is lower than 5 mg/l
(Table 7), the concentrated side streams after anaerobic treatment, such as a separate
anaerobic compartment (1b), or dewatering unit after anaerobic digester (1c), are
usually better options for phosphorus recovery. These streams typically contain 20 100
mg/l of PO4–P, but can reach concentration of 300 900 mg/l of PO4–P (Lengemann
2010a, Ostara 2010). The phosphorus recovery methods from liquid phase are often
located in WWTPs with biological phosphorus removal process.
Table 7: Phosphorus flow and concentrations (l/d per capita (modified from Montag 2008).
Volume /mass flow
Relativevolumemass flow
Concentrationof phosphorus Bond Recovery
potential
Effluent 200 l/cap/d 100% < 5 mg/l Dissolved max. 55%
Sludgeliquor 110 l/cap/d 0.5 5% 20 100 mg/l Dissolved max. 50%
Dewateredsludge 0.15 l/cap/d 0.075% ~ 10 g/kg TS Biological/
Chemical ~ 90%
Sewagesludge ash
0.03kg/cap/d 0.015% 64 g/kg Chemical ~ 90%
Sludge from digester before (2a) and after (2b) dewatering process contains phosphorus
in chemically or biologically bound form. Especially after biological phosphorus
removal process, PO4P is released in the sludge liquor (1c). Dried sludge contains
phosphorus approximately 1 to 3% by weight (Montag 2008, Suomenoja 2009).
In the third option, the sewage sludge ash (3), phosphorus is in the most concentrated
form. The decrease in volume results in decreased transporting and landfilling costs, as
well as decreased consumption of chemicals in phosphorus recovery processes.
Recovery from ash does not require major changes at the WWTP, although changing
from ironprecipitants to aluminumprecipitants for better recyclability (section 3.5.2)
may increase the total costs. From phosphorus recovery point of view, mono
incineration without any other material but sewage sludge is preferred method to co

29
incineration, as discussed earlier in section 3.4.2. Ash is discussed in detail in section
4.3.3.
4.3 Final Products
4.3.1 CALCIUM PHOSPHATE
Calcium phosphate is an attractive form of recovered phosphorus because it is directly
comparable to phosphate rock. Thus, utilization as secondary material is possible in
both phosphate and fertilizer industry (Schipper et al. 2001, Roeleveld et al. 2004).
Calcium phosphate crystals (Figure 14) form in phosphorus rich liquid as in Equation
15, when calcium is added and pH is in suitable range, typically above pH 8.
2 PO43 + 3 Ca2+à Ca3(PO4)2 (15)
Figure 14: Calcium phosphate pellets (Giesen 2009a).
Calcium phosphate does not precipitate spontaneously in low concentrations. In
wastewater, there is a selection of ions, so precipitation of calcium phosphate requires a
very high oversaturation of component ions. For this reason, calcium phosphate
precipitation requires seed material in the reactor. Seed material can be sand or calcium
silicate crystals (Cornel and Schaum 2009).
Depending on the solution composition and pH, calcium phosphate crystallizes several
forms presented in Table 8. The table shows the names of different calcium phosphates,
chemical formulas, and thermodynamic solubility product.

30
Table 8: Calcium phosphate compounds (CEEP 2001).
Name of calcium phosphate Formula Thermodynamicsolubility product
Brushite, dicalcium phosphate dihydrate CaHPO4 ⋅ 2H2O 2.49 ⋅ 107
Monetite CaHPO4 ⋅ 2H2O 1.26 ⋅ 107
Octacalcium phosphate Ca4H(PO4)3 ⋅ 2.5 H2O 1.25 ⋅ 1047
Amorphous calcium phosphate Ca3(PO4)2 1.20 ⋅ 1029
Hydroxyapatite Ca5H(PO4)3O 4.7 ⋅ 1059
Tricalcium phosphate Ca3H(PO4)2 variable
Thermodynamically the most stable form is hydroxyapatite (HAP). Other calcium
phosphates that may form faster are eventually likely to turn into HAP (CEEP 2001).
4.3.2 STRUVITE
Struvite, or magnesium ammonium phosphate hexahydrate (MgNH4PO4 ⋅ 6 H2O).
consists of Mg2+, NH4+ and PO4
3 ions in molar ratio 1:1:1. The compound is referred to
as MAP and it forms as given in Equation 16. The struvite crystals have an
orthorhombic shape as in Figure 15.
HPO42 + NH4
+ + Mg2+ + OH + 6H2Oà MgNH4PO4⋅6H2O + H2O (16)
Figure 15: Struvite crystals (Heinzmann 2009).
Typically, the options for magnesium source are MgCl2 and Mg(OH)2. MgCl2 is more
common, because it is easier to handle and it disassociates faster, leading to shorter
retention time. Mg(OH)2 can be simultaneously used for pH adjustment and as
magnesium source. However, the simultaneous use complicates optimization, and
additional pH adjustment is needed (Jaffer et al. 2001). The minimum solubility of
struvite, indicating the optimal circumstances for precipitation, occurs above pH 8.5
(Figure 16).

31
Figure 16: Struvite solubility vs. pH (Koch et al. 2009).
Since struvite contains two primary nutrients, phosphorus and nitrogen, and secondary
nutrient magnesium, it would be beneficial to recover phosphorus as struvite for
fertilizer industry. Unlike calcium phosphate, struvite is not suitable for replacing raw
material in electrothermal process due to the ammonia content (Schipper et al. 2001).
Experiences (e.g. Battistoni 2000, Nawa 2009, Kern et al. 2008) have shown that
struvite is low in heavy metals and other pollutants, and that the nutrients are in plant
available form, making struvite suitable for agricultural use as a slow release fertilizer.
In their paper, Kern et al. (2008) conclude the share of watersoluble struvite
approximately 3.6%, and citric acid soluble struvite 98.8%. The phosphorus uptake of
examined plants, maize and wheat, was 66.7% and 85.9%, respectively.
As can be seen in Table 9, composition of struvite produced in the pilot plant at the
Oxley Creek WWTP, Australia, and from Phosnix reactor in Japan, is comparable to the
theoretical values calculated from the chemical formula of struvite. These processes are
discussed in Section 5.2.3 and Section 6.4.
Table 9: Concentration by mass of Mg, N and P in struvite.
Theoretical value fromchemical formula
Struvite from Oxley Creek(Münch and Barr 2001)
Struvite from Phosnix(Nava 2009)
Mg 9.9% 9.1% 9.9%N (NH4) 5.7% (7.4%) 5.1% 5.9%P (PO4) 12.6% (38.7%) 12.4% 12.6%6 H2O 44 % 39 %

32
The solubility product (Ksp) and the supersaturation ratio (SSR) (Equations 17 and 18)
have an effect on the formation of struvite crystals. The ideal value of SSR is between 2
and 5. Higher values above 4 and 5 decreases the crystal size hindering the formation of
desired large crystals (Koch et al. 2009).
Ksp = [Mg 2+]eq [NH4+]eq [PO4
3]eq (17)
SSR = [Mg 2+] [NH4+] [PO4
3] / Ksp (18)
Anaerobic digestion creates favorable conditions for struvite precipitation releasing
PO4P and Mg2+ from the biomass and forming NH4+ from other ammonium
compounds (Metcalf & Eddy 2003). Typically, municipal wastewater contains 3 – 20
mg/l of magnesium (Ostara 2010). Simultaneous change in pH leads to problems at
WWTPs in form of spontaneous struvite precipitation into pipelines, valves and other
sludge treatment equipment (Jeanmaire and Evans 2001). A practical example is given
in Section 5.2.1.
4.3.3 ASH
Incineration concentrates the phosphorus contents of the sewage sludge to the resulted
ash fraction. Incineration of sewage sludge decomposes the organic compounds
including potentially toxic organics. Although the decomposing of the organic material
is a benefit regarding to the hygiene and the processing with wet chemical methods, it
increases the soil enrichment properties of the ash. In addition, the phosphorus bound in
the ash is not in plant available form (SUSAN 2008). Since sewage sludge ash has little
applications, it is typically landfilled, used in cement concrete industry or for road
constructions.
Sewage sludge ash contains approximately 17% P2O5. The main chemical constituents
of ash are SiO2, CaO, Al2O3, Fe2O3, and P2O5. Figure 17 presents the average
composition of ash in 16 European incineration plants that participated in the EU
Project BioCrete (2007). The composition of ash varies depending on the type of the
incinerated sludge. The precipitation chemical used in chemical phosphorus removal
process plays an important role. The values can vary greatly; for example, the content of
Fe2O3 in ash from different incineration facilities, varied between 3 and 27%, and the
Al2O3 content between 6.5 and 34%. On the other hand, the P2O5 concentrations showed
less variation with values between 9 and 27%.

33
Figure 17: Average chemical composition of ashes from EU BioCrete project (2007).
As well as phosphorus, heavy metals concentrate in the ash. Table 10 shows heavy
metal concentration of ash from several incineration facilities.
Table 10: Concentrations in ash from several incineration plants (Boutoussov 2009).
Source P2O5% Fe2O3%Zn
(mg/kg)Pb
(mg/kg)Cu
(mg/kg)Cd
(mg/kg)Cr
(mg/kg)Vienna (CH) 20.8 23.2 2 575 284 635 5.1 104Vienna (CH) 20.1 18.6 1 978 220 543 3.4 92St. Petersburg(RUS) 2 200 400 730 2.7 400
Berlin (D) 15.5 22.6 2 680 190 1 560 3.4 129Wilhelmsheim (D) 18.1 19.6 2 030 156 552 2.7 150NoordBraband(SNB) (NL) 12.6 11 2 240 340 970 4.1 205
Average 17.4 19 2 284 265 832 3.6 180
The values show that heavy metal concentrations meet the values stated in Sewage
Sludge Directive 86/278/EEC. However, the national restrictions can rule out the
possibility of fertilizer use.
The ashes contain two fractions: the aerosol particles (flue ash) and the coarse particles
(Table 11). The aerosol particles are finer and shaped differently than the coarse
particles. The aerosol particles contain most of the heavy metals. Thus, separating them
before further treatment can help in increasing the heavy metal concentration of the
final product.

34
Table 11: Ash particle characteristics (Boutoussov 2009).
Aerosol particles Coarse particles
Diameter 0.5 µm 30 50 µm
Shape Regular (rectangular orrodshape) irregular
Chemical composition Heavy metal salts andoxides
Complex compoundssuch as aluminosilicates
Zn concentration 40 000 mg/kg 550 mg/kg
Cd concentration 100 mg/kg 30 mg/kg
Formed by Volatile elementscontaining heavy metals
Partial melting of dustfrom the incineratedwaste
4.4 The main phosphorus recovery technologies
4.4.1 CRYSTALLIZATION AND PRECIPITATION
In the 1970s, the phosphorus concentrations in the effluent became more strictly
regulated leading to improvements in crystallization processes (Morse et al. 1998).
Crystallization and precipitation technologies transform soluble PO4P from process
liquid to solid form. As described in Sections 4.3.1 and 4.3.2, the main products are
struvite and calcium phosphate.
The main difference between crystallization and precipitation methods is the reaction
speed: precipitation is faster, often producing amorphous product, whereas
crystallization takes more time producing crystalloid product. Both methods require
supersaturation of the reacting ions. Formation of solid particles requires two steps:
nucleation and crystal growth. Nucleation can occur spontaneously when the size of an
individual nucleus exceed a critical size. The growth of the crystals transports the ions
onto the crystal surface and into the lattice. Nucleation step can be avoided by
increasing the crystal concentration in the solution with seed material. Thus, less energy
is needed and the particle growth occurs on existing surfaces. The seed material is
useful especially in wastewater environment, where impurities are present, offering a
wide range of surfaces for the particle growth (CEEP 2001). Seed material can be for
example sand or small struvite particles.

35
As the process requires a phosphate rich flow, it should be located after anaerobic
compartment such as digester or the biological phosphorus removal process.
Precipitation or crystallization occurs as the phosphorus ions in the flow and ions from
added chemical react (Figure 18). In addition, pH adjustment with NaOH or CO2
stripping can be necessary (Cornel and Schaum 2009).
Figure 18: Principle of crystallization and precipitation process (Cornel and Schaum 2009).
The chemicals used in phosphorus removal: iron, aluminum and calcium, bind the
phosphate ions, thus having a negative influence on the production (Güney et al. 2008).
The suspended solids content below 150 200 mg/l in the liquid prevents problems such
as impurities in recovered phosphorus, clogging of nozzles in the reactors and struvite
crystallization onto anywhere else but the reactor seed material (Jeanmaire and Evans
2001). However, Ostara (2010) can operate with intermitted solids levels up to 3000
4000 mg/l, yet preferring levels below 1000 mg/l of TSS.
The treated flow from the precipitation reactor typically returns to the process. The
decrease in the return phosphorus load decreases the load in phosphorus removal
process, improves the dewaterability of sludge, thus decreasing the operational costs.
4.4.2 WET CHEMICAL TECHNOLOGIES
Wet chemical process releases chemically or biologically bound phosphorus from
sludge or sludge ash with acid or base. As presented in Figure 19, nonsoluble residue is
separated and the remaining liquid phase treated for separating dissolved phosphorus.
Methods include precipitation, ion exchange, nanofiltration and reactive liquidliquid
extraction (Cornel and Schaum 2009).

36
Figure 19: Principle of wet chemical process (Cornel and Schaum 2009).
Typically, leaching with acid releases more phosphorus compared to the leaching with
base. Furthermore, the type of the feed material does not influence the result of acid
leaching. With base, the release rate is higher from ash than from dried sludge (Stark et
al. 2006). Schaum et al. (2005) studied the elution of phosphorus and heavy metals with
different eluents. It was found that water caused no significant release of phosphorus
and sodium hydroxide resulted in maximum 30% elution of phosphorus depending on
the origin and formation of the ash. Sulfuric acid resulted in the release of over 90% of
total phosphorus and part of heavy metals below pH 1.5. Montag (2008) performed
experiments for phosphorus release from ashes with NaOH, H3PO3, H2SO4 and HCl
discovering leaching of 25%, 50%, 80% and 90% of total phosphorus, respectively.
Typically, wet chemical processes use sulfuric acid for phosphorus leaching (Bayerle
2009, Schaum et al. 2005). Figure 20 presents phosphorus and heavy metal solubility in
sulfuric acid in respect of pH. It can be seen, that neutral pH 7 dissolves 10% of total
phosphorus. The share of dissolved phosphorus increases linearly as pH decreases, the
pH value 2 eluting 90% of total phosphorus.

37
Figure 20: Dissolved components in sludge in respect to pH value (Bayerle 2009).
Nitrogen level stays at approximately 50% in solution regardless to the pH. Most heavy
metals dissolve on pH below 3.5. However, lead, cadmium, copper and mercury stay in
soluble form even at pH 2. Over 80% of iron and aluminum dissolve at pH 2 creating a
possibility to recover precipitating chemicals simultaneously with phosphorus.
4.4.3 THERMOCHEMICAL TREATMENT
Thermochemical technologies are used for removing heavy metals from sewage sludge
ash. As stated in Section 4.3.3, ashes are hygienic, as the high temperatures in
incineration process decompose the organic material. However, heavy metals
concentrate in the ash together with phosphorus and can limit the utilization as fertilizer
(Petzet and Cornel 2009).
An EU Project SUSAN (Sustainable and safe reuse of municipal sewage sludge for
nutrient recovery) studied the possibility and technologies for removing heavy metals
from sewage sludge ash with the method shown in Figure 21.
% d
isso
lved

38
Figure 21: Thermochemical process principle (Hermann 2009b)
The process uses chloride additives such as earth alkaline salts, magnesium chloride and
calcium chloride that react with heavy metals in the ash. The heavy metal chlorides
evaporate as process temperatures rise over the boiling point of them. Typical
temperatures are between 850 and 1000 oC. The results from the SUSAN project show
removal rates of over 90% of Cd, Cu, Hg, Pb and Zn. In addition, thermal treatment
increases the bioavailability of phosphorus in ash from 30 50% before incineration up
to 100%. Thus, the product is suitable for fertilizer production (SUSAN 2008).
Other means of thermal treatment are based on metallurgy, treating dried sludge or ash
in temperatures of 1500 2000 oC. These methods produce three material streams: a
gaseous phase of volatile heavy metals and dust, a liquid metal phase, and a phosphorus
rich slag. The slag is a typical byproduct in steel industry and is comparable to Thomas
phosphate, used as fertilizer in Germany (Hermann 2009).

39
5 INDUSTRIALSCALE PROCESSES
5.1 Crystallization of calcium phosphate
5.1.1 CRYSTALACTOR®
The Crystalactor® was developed in the 1970’s by the Dutch company DHV Water
B.V. Starting from the 1980’s the process was applied in water treatment for potable
water softening by limestone (CaCO3) production, and for phosphorus recovery in
wastewater treatment. Before the applications in water treatment, the process has been
in use in other industrial branches such as chemical industry for zinc, nickel and
aluminum recovery; and food industry for phosphate and ammonium recovery, where
the process is still more popular than water treatment. (Giesen and van der Molen 1996).
Process description
The Crystalactor® is a crystallization process recovering phosphorus as calcium
phosphate Ca3(PO4)2 from concentrated side stream. Crystallization of other
compounds, such as zinc phosphate or struvite, is possible by changing the type of
added chemical (Giesen 2009a). The process consists of a cylindrical fluidized bed
reactor (Figure 22) with seed material, which can be sand or minerals. The
Crystalactor® reactor is relatively small, making the retrofitting it to most WWTPs
possible.
The feed material is phosphate rich flow from the separation tank after biological
treatment process and having a concentration of 60 80 mg/l PO4P. The recovery rate
can reach 70 80% of PO4P (Cornel and Schaum 2009). The feed enters the reactor
from the bottom and flows upwards with velocity of 40 – 100 m/h, keeping the reactor
bed in fluidized stage.
The reaction surface is large, approximately 5000 – 10 000 m2/m3, making the
crystallization efficient. The reaction starts after adjustment of pH with a NaOH dosage,
and the calcium phosphate crystallizes on the surface of the seed material. As the pellets
grow in size and mass, they sink to the bottom of the reactor from where they are

40
periodically removed, typically once a day. The removed grains are replaced with
smaller grains to keep their number constant (Giesen and van der Molen 1996).
Figure 22: The Crystalactor® fluidized bed reactor (modified from Giesen 2009a) and the
Crystalactor® reactors at the Geestmerambacht WWTP.
The reactor has a possibility to circulate the flow, thus making the reactor more flexible
as wastewater with high concentration can be diluted by adapting the circulation ratio.
The range of inflow concentration is wide: the treated water can contain 10 to 100 000
mg/l of the substance to be removed (Giesen and van der Molen 1996). The effluent,
having a concentration of 15 – 20 mg/l, leaves the reactor from the top through an
overflow gutter (Giesen 2009a).
Calcium reacts with carbonate ions in wastewater, causing unstable pellets that are
problematic for recycling. To avoid the increased contents of calcium carbonate in the
final product, the feed is first degassed from CO2 by decreasing pH with 96% sulfuric
acid (Stratful et al. 1999).
Information about the contents of the final product vary: according to Stratful (1999),
the pellets contain calcium phosphates (CaxPO4y) 40 50%, seed material (sand) 30
40%, CaCO3 10% and organic material 10%, whereas Gaanstra et al. (1998) report
concentrations of 11% phosphorus (equaling 25% P2O5), and Schipper et al. (2001)
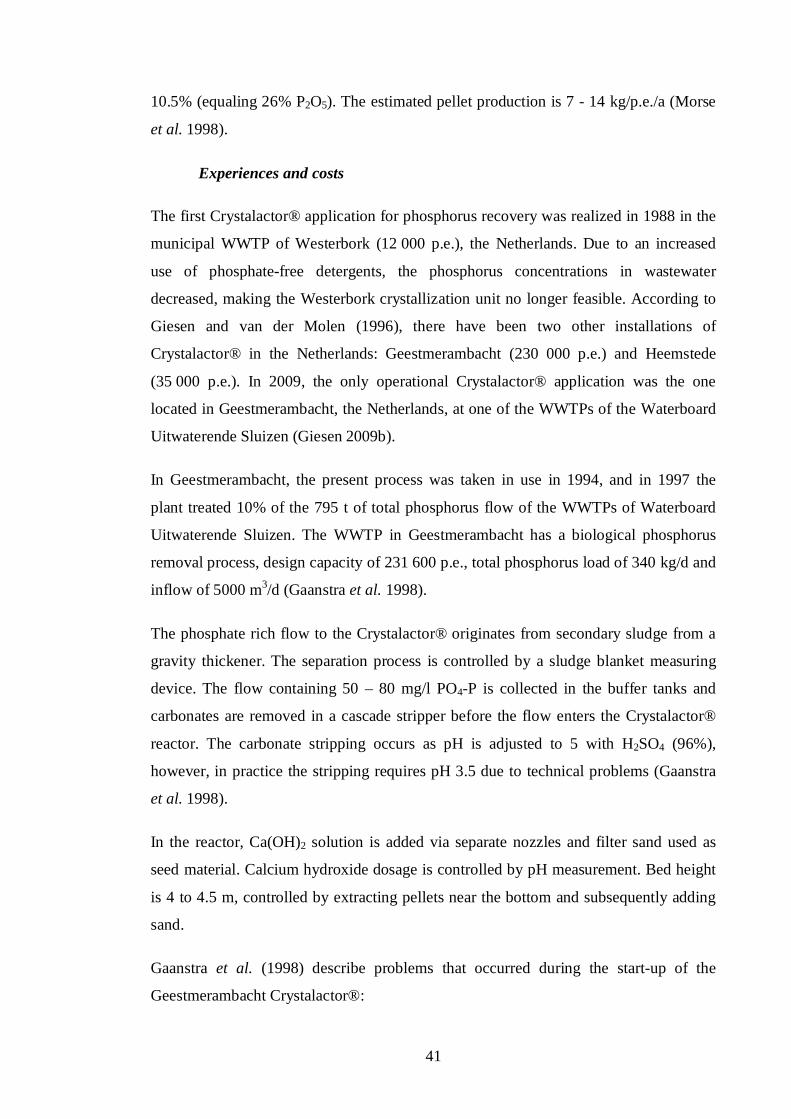
41
10.5% (equaling 26% P2O5). The estimated pellet production is 7 14 kg/p.e./a (Morse
et al. 1998).
Experiences and costs
The first Crystalactor® application for phosphorus recovery was realized in 1988 in the
municipal WWTP of Westerbork (12 000 p.e.), the Netherlands. Due to an increased
use of phosphatefree detergents, the phosphorus concentrations in wastewater
decreased, making the Westerbork crystallization unit no longer feasible. According to
Giesen and van der Molen (1996), there have been two other installations of
Crystalactor® in the Netherlands: Geestmerambacht (230 000 p.e.) and Heemstede
(35 000 p.e.). In 2009, the only operational Crystalactor® application was the one
located in Geestmerambacht, the Netherlands, at one of the WWTPs of the Waterboard
Uitwaterende Sluizen (Giesen 2009b).
In Geestmerambacht, the present process was taken in use in 1994, and in 1997 the
plant treated 10% of the 795 t of total phosphorus flow of the WWTPs of Waterboard
Uitwaterende Sluizen. The WWTP in Geestmerambacht has a biological phosphorus
removal process, design capacity of 231 600 p.e., total phosphorus load of 340 kg/d and
inflow of 5000 m3/d (Gaanstra et al. 1998).
The phosphate rich flow to the Crystalactor® originates from secondary sludge from a
gravity thickener. The separation process is controlled by a sludge blanket measuring
device. The flow containing 50 – 80 mg/l PO4P is collected in the buffer tanks and
carbonates are removed in a cascade stripper before the flow enters the Crystalactor®
reactor. The carbonate stripping occurs as pH is adjusted to 5 with H2SO4 (96%),
however, in practice the stripping requires pH 3.5 due to technical problems (Gaanstra
et al. 1998).
In the reactor, Ca(OH)2 solution is added via separate nozzles and filter sand used as
seed material. Calcium hydroxide dosage is controlled by pH measurement. Bed height
is 4 to 4.5 m, controlled by extracting pellets near the bottom and subsequently adding
sand.
Gaanstra et al. (1998) describe problems that occurred during the startup of the
Geestmerambacht Crystalactor®:

42
∗ Heavy abrasion occurred in the water nozzles. They were replaced by new
nozzles of another material with 12 borings instead of 3.
∗ Feeding pumps were shut down by a clogging problems in return sludge
pumps. The problem was solved as the control system was changed.
∗ Columns of “glued” pellets were formed in the reactor. For this reason, the
reactors had to be emptied and started again. Problem was solved as new
nozzles were installed and control system was fixed.
Investment for the side stream phosphorus recovery process was 4.2 M€ with the share
of capital costs of 55%, and variable costs of 45%. Due to the applied new crystallation
technology, the plant received 0.9 M€ governmental funding. The pellet production
reached 180 240 t in 1998, with costs of 7.3 €/kg removed phosphorus. The produced
pellets were used in the production of chicken fodder (Gaanstra et al. 1998) and later as
secondary raw material at Thermphos (Giesen 2009b). Controlling the plant required no
extra personnel.
Gaanstra et al. (1998) evaluate, that the investment and capital costs could be reduced to
5.9 – 6.8 €/kg removed phosphorus. The main problem is the high consumption of acid
and base, forming 13% of the variable costs. Another problem is that the
Geestmerambacht WWTP is underloaded: in 1998 the plant used only 60 – 65% of the
designed capacity. Thus, the other crystallization reactor was shut down and used only
as a reserve. In 2010 the situation has not improved: the other Crystalactor® reactor is
about to be shut down due to the high operational costs and the age of the installation
(Kaper 2010).
5.2 Crystallization / precipitation of struvite
5.2.1 AIRPREX PROCEDURE
The AirPrex procedure was developed by Berliner Wasserbetriebe (BWB), the company
attending to the water treatment in Berlin (Germany) and is utilized at the WWTP
Waßmannsdorf near the Schönefeld airport. The German company P.C.S. GmbH has a
license to market the procedure under the name AirPrex and test runs for building a new
AirPrex application are underway in Amsterdam.

43
The Waßmannsdorf WWTP is one of the six treatment plants of BWB, largest by BOD5
load, and the second largest in terms of the influent flow. The plant has a capacity of
230 000 m3/d, with an average influent flow of 180 000 m3/d during dry weather
conditions. Table 12 shows concentrations of the influent and effluent flow in
Waßmannsdorf WWTP in 2006.
Table 12: Concentrations (mg/l) of the influent and effluent at WWTP Waßmannsdorf in 2006
(Berliner Wasserbetriebe 2007).
COD BOD5 Ptotal NH4N NO3N Ntotal
Influent 1087 389 13.7 65.7 Effluent 54 4 0.4 0.2 11.6 12
The WWTP at Waßmannsdorf has secondary treatment process with biological
phosphorus removal. To ensure the quality of the effluent, the plant can provide
iron(III)sulfate precipitation when needed. The waste activated sludge (WAS) holding a
dry solids (DS) content of 1% is thickened to 3% DS by flotation and dewatered to 8%
DS with centrifuges. The dewatering is aided with 7.5 kg/t DS flocculants. The
dewatered WAS is stored in a mixed sludge collection tank with the sludge from
primary sedimentation. In the tank, the sludge is heated with heat exchangers to 33 oC
before pumping it into the mesophilic digestion process.
For the digestion process, the WWPT Waßmannsdorf has six digesters of 8000 m3 each.
The process provides biogas for energy production covering over 60% (90 000 KWh/d)
of the total 140 000 KWh/d energy demand of the plant (Lengemann 2010c). The heat
generated during the electricity production is used for heating the sludge and the
buildings (Berliner Wasserbetriebe 2007).
The flow to the sludge treatment facility is 2000 m3/d of digested sludge. First, the
sludge is dewatered with a centrifuge to 27% DS. Two thirds of the dewatered sludge
are transported to a lignitefired power plant for energy production. The remaining 1/3
is treated in a dryer to reach a dry solid content of 97% and used in a power plant to
replace coal (Lengemann 2010a).
Process developement
Spontaneous precipitation of struvite was a problem at Waßmannsdorf WWTP causing
incrustations to the sludge treatment equipment. The digested sludge at Waßmannsdorf

44
holds a magnesium concentration of 10 mg/l. Figure 23 presents a bend joint pump and
an intake aperture from the centrate pumping station after 319 and 180 operating hours,
respectively. Analyses from the incrustations showed that the precipitated material was
mainly struvite with small portions of calcium phosphate (Heinzmann 2009).
Figure 23: A Pump and aperture with struvite incrustations (Heinzmann 2009).
The problem was solved by developing a method for controlled precipitation of struvite
in cooperation with Technical University of Berlin. The method described here is “the
old method” that was operational eight years before the AirPrex procedure, described in
the following section. Figure 24 shows the principle of the method and the old
precipitation tanks. The digested sludge was transferred to the aerated precipitation tank
and stripped from CO2 with a flow of air. The stripping of CO2 causes an increase in pH
value, and the simultaneous dosage of MgCl2 balances the molar ratio of Mg2+,
NH4+and PO4
3, inducing the precipitation.
Figure 24: The old method for struvite precipitation (Heinzmann 2009) and the old precipitation
tanks (Picture: P. Rantanen) at Waßmannsdorf WWTP.

45
The process precipitated 20 tons of struvite in 3 months period. Being discontinuous,
the aeration and precipitation needed to be stopped while the tank was emptied. Not
having a permission for fertilizer use, the struvite was landfilled with disposal costs of
140 €/t. Moreover, there was no efficient method for separating the product from the
sludge phase, although different separation methods such as hydrocyclones had been
tested (Heinzmann 2009). Nevertheless, the PO4P content in the sludge decreased
during the precipitation from 300 mg/l to 50 mg/l PO4P (Figure 25), decreasing the
phosphorus recycle flow and improving the dewaterability of sludge (Lengemann
2010c).
Figure 25: The daily phosphorus balance (kg/d) at WWTP Waßmannsdorf with the “old method”
(modified from Lengemann 2010a).
As can be seen from the Figure 25, the primary and the secondary treatment transfer
97% of the phosphorus into the sludge. Comparison between the influent and effluent
from the struvite reactor show that the struvite precipitation removed over 83% of PO4
P. The total internal phosphorus load returning to the process was 227 kg/d consisting of
the 57 kg/d flow from the secondary sludge clarifier and 170 kg/d from the sludge
dewatering process (Lengemann 2010a).
DEWATERING
SURPLUS SLUDGE(THICKENING)
PROCESSPrimary andsecondarytreatment
Influent2355 kg
DIGESTION
2153 kg
Effluent77 kg
300 mg/lOPO4
50 mg/lOPO4
SLUDGE STORAGEPrimary Sludge +
Thickened SurplusSludge
57 kg
170 kg
STRUVITEREACTOR
Air MgCl2
Struvite 80 t/a
227 kg
Wastegrease
Dried sludge
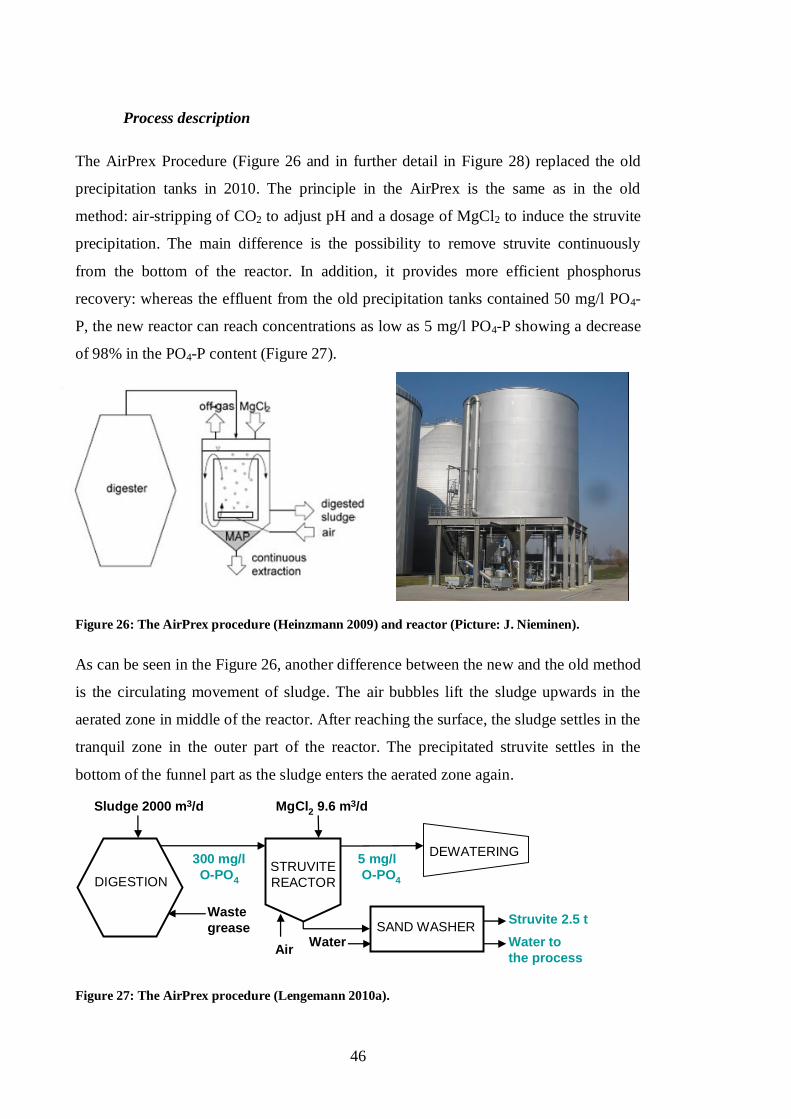
46
Process description
The AirPrex Procedure (Figure 26 and in further detail in Figure 28) replaced the old
precipitation tanks in 2010. The principle in the AirPrex is the same as in the old
method: airstripping of CO2 to adjust pH and a dosage of MgCl2 to induce the struvite
precipitation. The main difference is the possibility to remove struvite continuously
from the bottom of the reactor. In addition, it provides more efficient phosphorus
recovery: whereas the effluent from the old precipitation tanks contained 50 mg/l PO4
P, the new reactor can reach concentrations as low as 5 mg/l PO4P showing a decrease
of 98% in the PO4P content (Figure 27).
Figure 26: The AirPrex procedure (Heinzmann 2009) and reactor (Picture: J. Nieminen).
As can be seen in the Figure 26, another difference between the new and the old method
is the circulating movement of sludge. The air bubbles lift the sludge upwards in the
aerated zone in middle of the reactor. After reaching the surface, the sludge settles in the
tranquil zone in the outer part of the reactor. The precipitated struvite settles in the
bottom of the funnel part as the sludge enters the aerated zone again.
Figure 27: The AirPrex procedure (Lengemann 2010a).
DIGESTION
300 mg/lOPO4
5 mg/lOPO4
STRUVITEREACTOR
Air
MgCl2 9.6 m3/d
SAND WASHERWater
Struvite 2.5 tWater tothe process
Wastegrease
DEWATERING
Sludge 2000 m3/d

47
Figure 28: The AirPrex Reactor from above (Lengemann 2010a) and side (Hannemann et al. 2009).

48
The AirPrex reactor at Waßmannsdorf WWTP measures approximately 17 m in height,
10 m in diameter, and 500 m3 in volume. The HRT in the reactor is 8 hours, during
which the sludge is aerated with airflow of 2840 Nm3/h. The target pH in the reactor is
approximately 8, with typical values varying between 7.2 and 7.4. The magnesium
chloride solution containing 10% of magnesium is added into the sludge feed pipe just
before the sludge enters the reactor. The feed rate of the MgCl2 solution is
approximately 400 l/h. The pipeline between digester and reactor is still subject to
incrustations, creating a need for antiincrustation agent (Lengemann 2010a and 2010b).
From Figure 28, it can be noticed that a wall rising above the sludge surface divides the
reactor in two zones. The aerated zone 1 removes most of the CO2. The sludge
circulates down the tranquil zone returning to the aerated zone under the aeration
equipment. As the sludge enters the aerated zone 2 the rest of the CO2 is stripped. The
sludge leaves the reactor through the discharge shaft in the upper part of the zone 2
(Figure 29). As the sludge travels through the tranquil zone, the struvite settles to the
funnel part of the reactor (Hannemann et al. 2009).
Figure 29: The discharge shaft (Lengemann 2010a) and the crosssectional view of the reactor
(Hannemann et al. 2009).
Figure 30 presents the bottom of the reactor with the tip of the funnel part, the discharge
container, and the separation machinery with the sand washer, screw conveyors and the
metal container trolleys.

49
Figure 30: The bottom of the AirPrex Reactor.
The funnel needs to be emptied from struvite six times a day. A valve at the bottom of
the funnel part prevents the sludge entering the discharge container. As the valve is
opened the struvite falls to the discharge container from where it is transferred with a
screw conveyer to the sand washer. The sand washer uses water that is afterwards
transferred to the wastewater treatment process. The washed struvite is stored in the
container trolleys. Targets for the future are a continuous struvite removal process and a
storage container for struvite measuring 10 m3 (Lengemann 2010a).
Experiences and costs
Struvite production is 2.5 t/d and the quality meets the limiting values given in the
German fertilizer ordinance. The struvite is sold to be used as raw material in fertilizer
production, where it is mixed with another fertilizer. According to Lengemann (2010a),
the investment for the new process was 2.5 M€ and the ideal price of the struvite is 50
€/t. This value is calculated taking into account all the costs of the new plant. Converted
to €/t phosphorus, the value is 400 €/t.
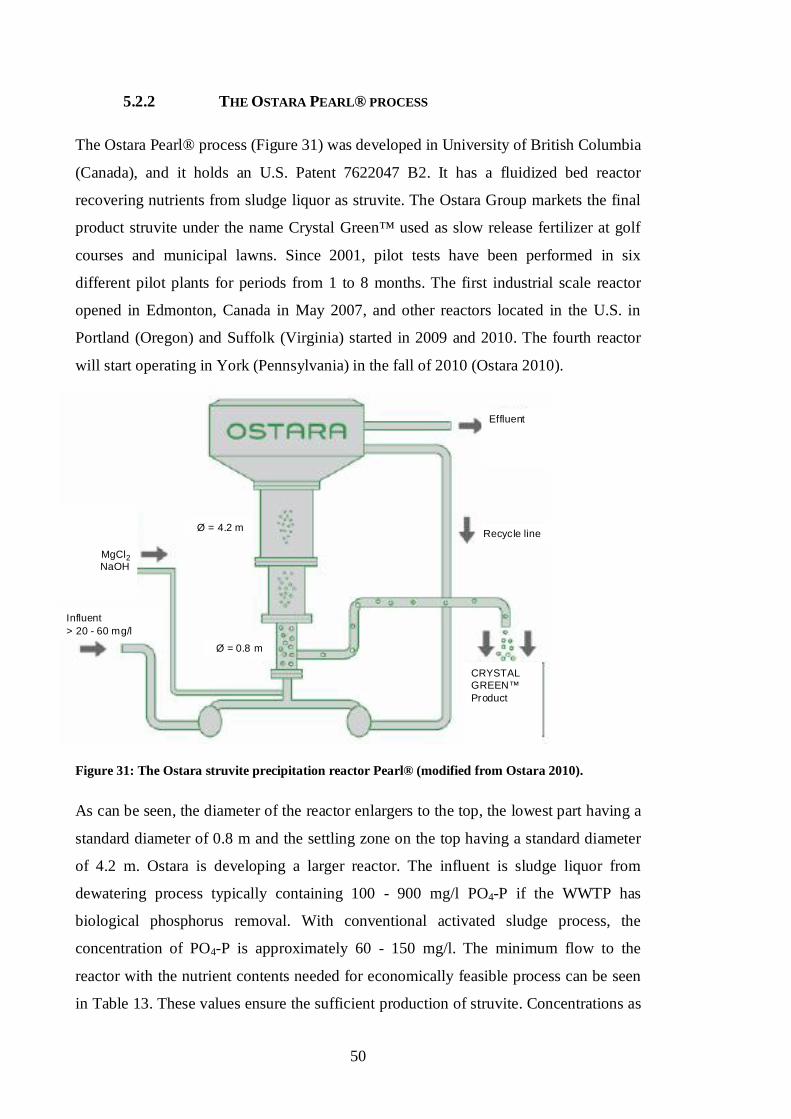
50
5.2.2 THE OSTARA PEARL® PROCESS
The Ostara Pearl® process (Figure 31) was developed in University of British Columbia
(Canada), and it holds an U.S. Patent 7622047 B2. It has a fluidized bed reactor
recovering nutrients from sludge liquor as struvite. The Ostara Group markets the final
product struvite under the name Crystal Green™ used as slow release fertilizer at golf
courses and municipal lawns. Since 2001, pilot tests have been performed in six
different pilot plants for periods from 1 to 8 months. The first industrial scale reactor
opened in Edmonton, Canada in May 2007, and other reactors located in the U.S. in
Portland (Oregon) and Suffolk (Virginia) started in 2009 and 2010. The fourth reactor
will start operating in York (Pennsylvania) in the fall of 2010 (Ostara 2010).
Figure 31: The Ostara struvite precipitation reactor Pearl® (modified from Ostara 2010).
As can be seen, the diameter of the reactor enlargers to the top, the lowest part having a
standard diameter of 0.8 m and the settling zone on the top having a standard diameter
of 4.2 m. Ostara is developing a larger reactor. The influent is sludge liquor from
dewatering process typically containing 100 900 mg/l PO4P if the WWTP has
biological phosphorus removal. With conventional activated sludge process, the
concentration of PO4P is approximately 60 150 mg/l. The minimum flow to the
reactor with the nutrient contents needed for economically feasible process can be seen
in Table 13. These values ensure the sufficient production of struvite. Concentrations as
MgCl2NaOH
CRYSTALGREEN™Product
Effluent
Recycle line
Influent> 20 60 mg/l
Ø = 4.2 m
Ø = 0.8 m
MgCl2NaOH
CRYSTALGREEN™Product
Effluent
Recycle line
Influent> 20 60 mg/l
Ø = 4.2 m
Ø = 0.8 m

51
low as 10 mg/l PO4P can be processed, but the limit for feasibility is 20 30 mg/l PO4
P, the preferable concentration being above 60 mg/l PO4P. The process could remove
even more phosphorus, but the economical feasibility lies in the range of 75 – 95% PO4
P. Typically, the process removes 85 % of phosphorus and 10 – 15% of ammonium
(Ostara 2010).
Table 13: Ostara Pearl® information (Ostara 2010).
Reactor sizeHeight 7.3 mDiameter 0.8 4.2 mInfluentFlow 500 m3/dMinimum PO4P flow 70 kg/dMinimum NH4N flow 32 kg/dSuspended solids content < 1000 mg/lFinal productStruvite production 500 kg/dAmmonia removal 10 50%Operational parameterspH 7.2 8.0Energy consumption 7.2 13 kW
Electricity consumption needed for drying the pellets, varies depending on availability
of waste heat. One full time equivalent covers the maintenance of the process. The
chemical used for precipitation and the pH adjustment are MgCl2 and NaOH,
respectively. Struvite production rate is 500 kg/d; the final product is marketed under
the name Crystal Green®, having a nutrient formula NP 528, also containing 10% of
magnesium.
Ostara offers a turnkey solution for WWTPs that includes the Ostara PEARL® reactor
vessel with peripherals such as access platforms, pumps and instrumentation, as well as
equipment for chemical handling, screen dryer, and bagging equipment. Before the
implementation, Ostara rents a mobile pilotplant in a scale of 1/100. The capital costs
are estimated 2 4 M€ the paidback time being 3 5 years.
5.2.3 THE PHOSNIX PROCESS
The Phosnix process was developed in Japan by Unitika Ltd Environmental and
Engineering Div. The process is a side stream process that can treat water from a
number of processes including digester, industrial, and biological nutrient removal

52
systems. A fullscale application has been in use in lake Shinji Eastern Clarification
Center of Shimane Prefecture (SECC), Japan, since 1998. Figure 32 presents the two
Phosnix reactors at SECC, the larger treating a stream of 500 m3/d and the smaller 150
m3/d. Phosnix can treat flows with 100 – 150 mg/l PO4P, recovering 80 90% of PO4P
as struvite. Another reactor of 500 m3/d started operating in 2000 in Osaka South Ace
Centre (GEC 2010).
Figure 32: The Phosnix Process at the lake Shinji Eastern Clarification Center of Shimane
Prefecture (SECC), Japan (Nawa 2009).
As can be seen in Figure 33, the inflow to the reactor is liquid phase from sludge
dewatering, containing approximately 120 mg/l PO4P. The figure success, that the
reduction of 100 mg/l PO4P, equaling 83% of the influent phosphate concentration.
Figure 33: The Phosnix process (Nawa 2009).
Mg(OH)2NaOH
Dried sludge
Effluent
STRUVITEREACTOR
Struvite containing100 kg/d of phosphorus
ANAEROBICDIGESTION
PO4P120 mg/l
SECONDARYCLARIFIER
DEWATERING
PROCESSPrimary andsecondarytreatment
PO4P20 mg/l
Influent
Recyclingof crystals
SCREENSEPARATOR

53
The amount of precipitated phosphorus, 100 kg/d, is for a plant with capacity of 1000
m3/d. The effluent from the Phosnix reactor is transferred to the beginning of the
wastewater treatment process (Nawa 2009). The process reduces the need for
precipitation chemicals in the activated sludge process as well as in the sludge
dewatering step (Ueno and Fuji 2001).
The reactor is an airagitated column with chemical dosing equipment (Stratful et al.
1999). The sludge liquor is pumped to the bottom of the reactor and the chemicals,
sodium hydroxide and Mg(OH)2, are added for precipitation and pH adjustment to pH
8.5 – 8.8 (Nawa 2009). Crystals grow, and sink to the bottom of the column where they
are removed periodically. Fine struvite particles separated from the product struvite, are
fed back to the reactor as seed material. Struvite granules of 0.5 – 1.0 mm form in ten
days retention time. The product is dewatered for 24 hours in filter bag system or
natural drying in an ambient temperature. (Stratful et al. 1999) The water content of the
final product is <10% (Nawa 2009).
The produced struvite is sold to fertilizer company for 250 €/t. Transport costs are
covered by the purchaser. The company mixes the struvite with other products and adds
potassium to produce a fertilizer sold in 20 kg bag for 100 – 200 € (CEEP 2001).
Estimated savings using phosphorus recovery as part of the water treatment process are
171 000 €/a, calculated with a price of struvite 210 €/t. In his paper Stratful et al. (1999)
states that Unitika claims total operation cost of a plant with 500 m3/d influent
containing 50 mg/l PO4P 70 £/d (83 €/d at the current conversion price), including
maintenance. The estimate is considerably lower compared to costs of similar sized
plant with chemical phosphorus removal with aluminum sulfate, 420 £/d (284 €/d at the
current conversion price) (Stratful et al. 1999).
5.3 Wet chemical process
5.3.1 THE SEABORNE PROCESS
The Seaborne Process is a complex network of unit operations, suitable for recovering
nutrients from various biomasses, such as sludge from wastewater treatment plants,

54
manure, and agricultural waste. It was developed and patented by a German company
Seaborne Environmental Research Laboratory (EPM AG). The first fullscale
implementation is located at Gifhorn WWTP in Germany. Earlier, the thickened sewage
sludge from the Gifhorn WWTP was utilized in agriculture as fertilizer, but the general
interest, limits in heavy metal content, pressures created by discussion concerning
organic toxins and drug residues led to a need for new sludge treatment method
(Bayerle 2010).
The Gifhorn WWTP has an influent flow of 6500 m3/d corresponding to 50 000 p.e.
The secondary treatment consists of three activated sludge tanks (2900 m³ each) and
three clarifiers (2700 m³ each). Digestion capacity consists of two mesophilic digesters
(2000 m³ each), built in 1972 (Bayerle 2009). The inflow to the digester consists of 60
m3/d primary sludge, 40 m3/d of secondary sludge, and 20 m3/d of waste grease from
food industry. A storage tank levels off volume changes in the flow from the digester,
the feed to the process being 110 m3/d.
Process development
The construction of the process at Gifhorn WWTP started in 2003, being ready for the
basic mass balance monitoring in 2004. In cooperation were the Institute of Sanitary
and Environmental Engineering at the Technical University of Braunschweig and the
institute of Waste Quality and Waste management at the University of Hannover. The
operation started in 2005 and a testing period before continuous operation lasted until
2007 (Müller et al. 2007).
Figure 34 presents a partial view from the Gifhorn process hall. The first figure has
centrifuges in the front and the precipitation step tanks in the back. The other shows the
RoHM (Removal of Heavy Metals) unit.

55
Figure 34: Partial view of the Seaborne Process at Gifhorn WWTP.
The original patented Seaborne process needed modifications to meet the economical
requirements of Gifhorn WWTP. The modifications and solutions for the Gifhorn
process are presented is Table 14. Figure 35 presents the patented process as described
by Vesterager (2009) and Figure 36 in the next section presents the implemented
process in Gifhorn.
Table 14: Summary of the modifications at Gifhorn plant.
Patented version The Gifhorn ProcessAcid leaching
Circulation between two units with differentpH.
The target pH value is 2, but due to theincreased price of sulfuric acid, the processuses pH 4.5 5.
The patent does not include a detailedtreatment for organic residues, butsuggests incineration
The residue can not be incinerated due tothe heavy metal content, but is compostedinstead.
Oxidizing agent Not used
Separation unit Separation with centrifuge
Removal of heavy metals
pH adjustment with base, NaOH preferred Higher pH in the previous step reduces theconsumption of the base.
Digester gas is exploited to precipitate theheavy metals simultaneously cleaning thegas from sulfides.
Na2S replaces the digester gas.
Separation Separation with band filter
Precipitation
Me2+, preferably MgO for the precipitation. MgO is mixed with water producingMg(OH)2.
StrippingStripping unit for producing ammonium richflow to be used in fertilizer industry.
The stripping unit is not in use due toproblems with calcium precipitation.

56
Figure 35: The patented version of the Seaborne process (modified from Vesterager 2009).
BaseMetal ionsMe2+
INCINERATION /COMPOST
Struvite
Acid
Desulphurisedgas
Digester gas
Digestedsludge
(Flocculant) Organicresidues
MxS
(Oxidizingagent)
SEPARATION
Acid
Water
(Oxidizingagent)
Organic residuesLiquid
Base
pH 3.5
pH 3.5 –7.5
pH 1.1
SEPARATION
Neutralizingagent pH 3.5
(Flocculant)
pH 8.5 –10
Metal ions Me2+
(Flocculant)
SEPARATION
NH4+
HEATEXCHANGER
BaseGas
Waste liquid
DES
OR
PTIO
N
Gas
ADSO
RPT
ION
AcidWater
A Acid leaching
B Removal of heavy metals
C Precipitation
D Stripping
A
B
C
D

57
Process description
The process consists of three main steps presented in Figure 36: acid leaching, removal of
heavy metals and the precipitation of struvite. In addition to these steps, the process
contains stripping unit for ammonium recovery. Due to problems with calcium
precipitation, the stripping unit is not at the moment operational and the ammonium rich
flow returns to the beginning of the process (Bayerle 2010). The designed concentrations of
nitrogen and phosphorus in the influent are 1800 mg/l and 1000 mg/l, respectively (Bayerle
2010). However, according to Bayerle (2010), the phosphorus concentration entering the
Seaborne process is 600 mg/l.
Figure 36: Flowchart of the Seaborne process at Gifhorn (Bayerle 2010).
In the acid leaching step in the patented method, the digested sludge is mixed with an acid
(H2SO4) and an oxidizing agent (H2O2) to lower the pH below 3.5. The oxidizing agent is
optional but it improves the dissolution of the heavy metals and phosphates. If included in
the process, the oxidizing agent can be added simultaneously with the acid or after it. The
mixture is circulated to another leaching tank with pH 1.1 for thorough dilution (Vesterager
2009). The Gifhorn process has only one acid leaching stage with a target value of pH 2.
Reaching this value would require 7.4 l/m3 sulfuric acid. For economical reasons, the
operational area was set to pH 4.5 5 reached with 4.5 l/m3 sulfuric acid. Compared with
the start of the project in 2006, the chemicals prices have more than doubled (Bayerle
2010). After two hours, the insoluble part is separated in a centrifuge. To improve the
separation, flocculent is added before the mixture enters the centrifuge. Options for the
treatment of the residue are incineration, thermal drying and composting.
COMPOSTING
PRECIPITATIONACID LEACHING HEAVY METALREMOVALDIGESTION
Mg(OH)2NaOH
FlocculantH2SO4
Waste liquidAmmonium
Struvite
Metal sulfides
Na2SFlocculant
To the wastewatertreatment process
58
The operational area pH 4.5 – pH 5 dissolves approximately 50% of the total phosphorus
but do not transfer considerable amounts of heavy metals to the liquid phase. Hence, most
of the heavy metals are removed with the undissolved part from the acid leaching step
excluding incineration as treatment option. Nevertheless, according to Bayerle (2010), this
is not a problem, since the concentrations of heavy metals are low in the sludge.
The liquid phase containing dissolved phosphorus, nitrogen and heavy metals goes to the
removal of heavy metals (RoHM) step. As the pH is already on the target level at pH 4 –
4.5, NaOH dosage is not necessarily needed. Removal of heavy metals is not executed by
exploiting digester gas as in the original Seaborne process, but with a substituting chemical
Na2S. Since the dissolved heavy metal fraction in the acid leaching step is smaller than
designed, only a about 20 kg/d of heavy metal sulfides precipitate. The solid material is
separated in a belt filter and landfilled with costs of 200 €/t.
The third step is the struvite precipitation. The pH is increased to 8.7 9 with NaOH and
Mg(OH)2 added to induce precipitation. The magnesium hydroxide is prepared in situ from
MgO delivered in sack, and mixed with water. The magnesium dosage is controlled by
observing daily the precipitation reactor effluent. The flow leaving the process contains
about 5 6 mg/l phosphorus and 250 mg/l nitrogen. Precipitated product is dewatered by
centrifuges (Bayerle 2010).
The last step in the process is the stripping of the excess ammonium removing the
NH3/NH4 from the liquid phase. The stripping unit is not operational due to the problems
with calcium precipitation in the column. The patented method for stripping is to increase
the pH value to pH 8.5 – pH 10.5 by adding a base (NaOH), after which the temperature is
raised to 50oC in a heat exchanger. The warm liquid enters the desorption unit where,
together with a high specific surface, the counter current gas flow transfers the NH3 from
the liquid phase to the gas phase. The gas from desorption is sent to the adsorption unit
where the gas containing NH3 is washed with a counter current of an acidic solution (water
and H2SO4). The reaction between the ammonia and the acid produces NH4+ transferred to
the liquid phase. The liquid phase is recirculated in the adsorption column (Vesterager
2009). The concentrations of NH4N and PO4P in the stripping effluent were estimated <
40 mg/l and < 6 mg/l respectively, the planned product being 38% (NH4)2SO4 diammonium

59
sulfate. As the solution for the stripping unit problems is studied: an increase of the share of
calcium phosphate in the final product would remove calcium before the stripping columns
(Bayerle 2010).
The formed product contains MgNH4PO4, Mg3(PO4)2, Ca3(PO4)2, (NH4)3PO4,
MgHPO4⋅3H2O CaHPO4⋅nH2O and (NH4)2HPO4 (Bayerle 2010). The precipitated product
is not crystalloid as the Waßmannsdorf struvite; about 90% is amorphous and crystal
content is about 10% (Bayerle 2009). Figure 37 shows the produced struvite: the first
beaker contains struvite after atmospheric drying, the second after centrifuge separation,
and the third the liquid phase from the centrifuge.
Figure 37: Amorphous struvite from Seaborne process after atmospheric drying and after centrifuge
separation, as well as the liquid phase from the centrifuge.
Costs and experiences
The complicated process has faced many challenges; by March 2010, the process had been
working properly only for two weeks after the startup (Bayerle 2010). The problems with
pH adjustment result in decreased struvite production that is currently 250 t/a, the maximal
production with pH 2 being 500 t/a. The produced struvite with 50 % DS has been sold for
5 €/t to be used as fertilizer. As can be seen in Table 15, the major part of the costs derive
from chemical consumption, showing also that with pH 4, the specific cost for recovered
phosphorus is approximately 15 €/kg PO43, equalling 46 €/kg phosphorus.

60
Table 15. Costs and chemical consumption of the Seaborne process with several pH values (Bayerle
2009).
pHvalue
Chemical consumption(kg/kg DS)
Specificcosts Yield Cost distribution
H2SO4 NaOH Mg(OH)2 (€/kg PO43) (kg PO4
3/a) Depreciation andMaintenance costs
Chemicalcosts
7 0 7.1 0.7 20.19 4.715 62% 38%6 5.7 10.1 0.4 17.30 6.800 50% 50%5 10.7 14.2 0.3 15.68 9.823 38% 62%4 15.3 19.4 0.8 14.72 13.010 29% 71%3 19.9 28.4 1.4 14.22 17.681 23% 71%
Table 16 presents the investment costs of the Seaborne process in Gifhorn. The federal
state of Lower Saxony funded the project with 3822 M€, covering 50.6% of the total costs
(Adam 2009).
Table 16: Investment costs of the Seaborne process in Gifhorn (Bayerle 2010).
M€The process shed building 1274Digestion, energy, miscellaneous 1284Technical costs 2987Engineering costs 1012Technical and scientific monitoring 1000Total 7557Lower Saxony funding (50.6 %) 3822Gifhorn 3735
Although, the Seaborne is not feasible now, a reevaluation should occur in 5 – 10 years.
Possible future Seaborne processes should be designed more simple with larger reactors. In
addition, operating a plant twice or three times larger or collecting sludge from several
plants would increase the feasibility (Bayerle 2010).
5.4 Summary of the fullscale processes
The five industrialscale processes described in this Chapter represent crystallization and
precipitation, and wet chemical methods. The processes showing the best operative
performance include AirPrex, Ostara Pearl® and Unitika Phosnix recovering phosphorus as
struvite from sludge liquor. Crystalactor®, using calcium phosphate crystallization, has
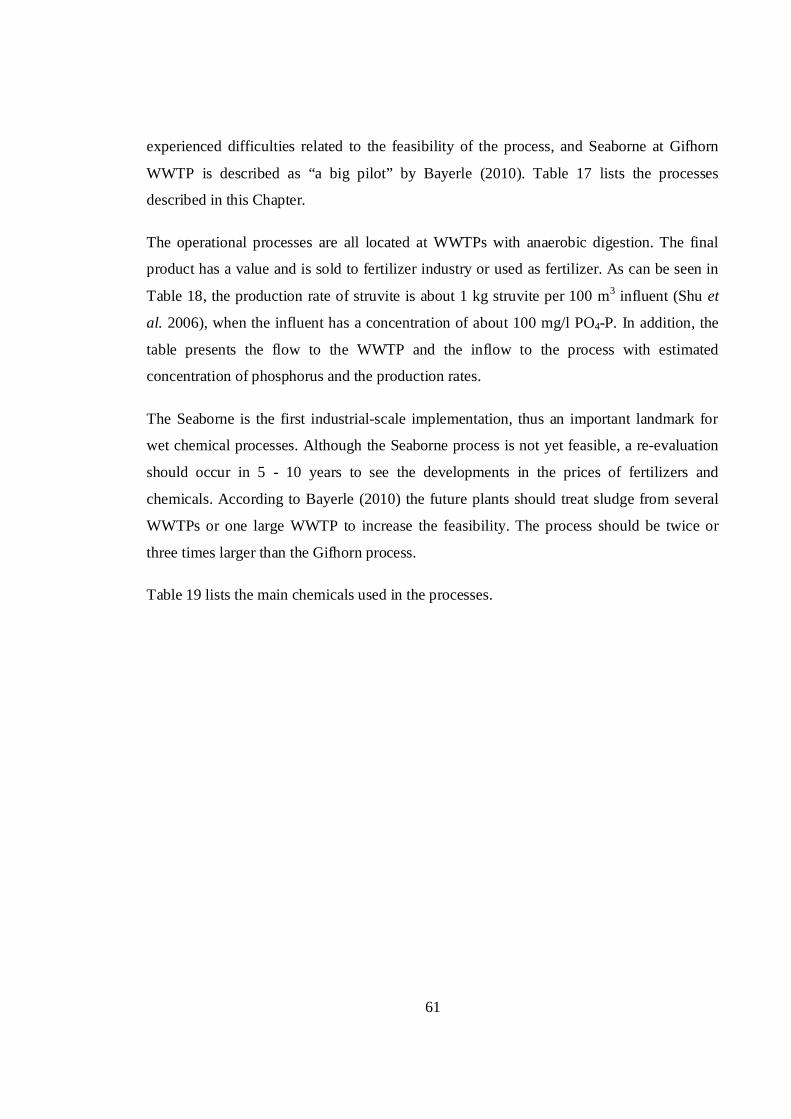
61
experienced difficulties related to the feasibility of the process, and Seaborne at Gifhorn
WWTP is described as “a big pilot” by Bayerle (2010). Table 17 lists the processes
described in this Chapter.
The operational processes are all located at WWTPs with anaerobic digestion. The final
product has a value and is sold to fertilizer industry or used as fertilizer. As can be seen in
Table 18, the production rate of struvite is about 1 kg struvite per 100 m3 influent (Shu et
al. 2006), when the influent has a concentration of about 100 mg/l PO4P. In addition, the
table presents the flow to the WWTP and the inflow to the process with estimated
concentration of phosphorus and the production rates.
The Seaborne is the first industrialscale implementation, thus an important landmark for
wet chemical processes. Although the Seaborne process is not yet feasible, a reevaluation
should occur in 5 10 years to see the developments in the prices of fertilizers and
chemicals. According to Bayerle (2010) the future plants should treat sludge from several
WWTPs or one large WWTP to increase the feasibility. The process should be twice or
three times larger than the Gifhorn process.
Table 19 lists the main chemicals used in the processes.

62
Table 17: The industrialscale processes.
Fullscaleprocess Owner Developer Location Startup Feed
material Method Final product
AirPrexBerlinerWasserbetriebe /License: P.C.S GmbH
BerlinerWasserbetriebe
Waßmannsdorf,Berlin, Germany 2010
Digestedsludge /sludge liquor
Crystallization Struvite
Crystalactor® WaterboardUitwaterende Sluizen DVH Water BV Geestmerambacht,
the Netherlands 1988 Liquid Crystallization Calciumphosphate
Ostara Pearl™ Gold Bar WWTP,Edmonton
University of BritishColumbia / Ostara Edmonton 2007 Liquid Crystallization Struvite
Phosnix
The lake ShinjiEastern ClarificationCenter of ShimanePrefecture (SECC)
Unitika Ltd. ShimanePrefecture, Japan 1998 Liquid Crystallization Struvite
Seaborne The city of Gifhorn
SeaborneEnvironmentalresearchlaboratory
Gifhorn, Germany 2005 Digestedsludge
Acid leaching,crystallization Struvite

63
Table 18: The flow of the processes.
Inflow of the WWTP Feed materialflow
P concentrationin influent
P concentrationin the effluent Production
m3/d p.e. m3/d mg/l PO4P kg/d
AirPrex 180 000 230 000 2 000 300 mg/l < 5mg/l 2 500
Crystalactor® 120 000 230 000 6 000 5080 mg/l 1520 mg/l 4 600
Ostara Pearl™ n.f. 700 000 500 100 900 mg/l n.f. 500
Phosnix 45 000 n.f. 500 + 150 100 110 mg/l 10 mg/l 500 550
Seaborne 6 500 50 000 110 600 mg/l Ptot 5 6 mg/l Ptot 680
n.f. Not found

64
Table 19: Chemicals used in the processes.
Chemical Purpose Consumption Additional information
AirPrex MgCl2 Magnesium source for struvite precipitation 400 l/h (33% Mg) Brenntafloc ML 200
Rockaway PX 60 N Incrustation preventing agent Marketed by: P.C.S GmbH
Flocculent Praestol® 40560 Material: 737092, Ashland
Crystalactor Sand Seed material
NaOH Adjusting pH for crystallization
Ca(OH)2 Calcium source for crystallization
Pearl NaOH Adjusting pH for struvite precipitation
Mg(OH)2 Magnesium source for struvite precipitation
Phosnix NaOH Adjusting pH for struvite precipitation
Mg(OH)2 Magnesium source for struvite precipitation
Seaborne H2SO4 Acid leaching 240 000 t/a
Na2S Precipitation of the heavy metals 12 t/a
NaOH Adjusting pH for struvite precipitation 100 t/a
MgO Magnesium source for struvite precipitation 20 t/a
Flocculent Praestol® K 255 L Material: 371792, Ashland
65
6 PILOT AND LABORATORY SCALE PROCESSES
6.1 Crystallization / precipitation
6.1.1 PROC
The PRoC process (Phosphorus Recovery from wastewater by Crystallization of calcium
phosphate compounds) was developed in Germany, at Forschungszentrum Karlsruhe
GmbH, ITCWGT (the Institute of Technical Chemistry – Water and Geotechnology
Division) in cooperation with Universities of Karlsruhe and Darmstadt and the Leibniz
University Hannover (Hermann 2009a).
The PRoC (Figure 38) is a crystallization process using calcium silicate hydrate (CSH) as
seed material to produce calcium phosphates from concentrated side stream. The maximum
recovery potential is estimated 45% of total phosphorus (Hermann 2009a).
Figure 38: The PRoC process flow chart (Berg and Schaum 2005).
CSH, or Tobermorite (Figure 39), is a byproduct in building material industry. Due to the
calcium content of the compound, it can be utilized as the calcium doner in the process.
Due to the seed material CHS, a simultaneous increase in pH occurrs and the process
requires no additional chemicals (Berg et al. 2006a). The mixture of phosphorus rich water
and seed material is agitated in a reactor for two hours after which the product is separated
and dried (Hermann 2009a). The proposed separation and drying methods are a settling
tank and utilization of solar power (Berg et al. 2006a).

66
Figure 39: CSH granules (Petzet and Cornel 2009).
Berg et al. (2006a) tested the PRoC both in laboratoryscale and in pilotscale with fixed
bed, stirred, and expanded bed reactors. The stirred reactor was proved to be the
economical and technical optimum, although further studies are needed to prevent the seed
material escaping the reactor. The final product was analyzed for total phosphorus,
mineralogical composition, and surface morphology with Scanning Electron Microscopy
(SEM) and Energy Dispersive XRay Fluorescence (EDX). The analyses showed that
calcium phosphate crystallized on the surface of CSH and over time, the seed completely
transformed into calcium phosphate (Hermann 2009a).
The pilotscale tests show that the production of crystals with 13% phosphorus content
equaling 30% P2O5 is possible. Furthermore, the iron, cadmium and uranium levels are
below those in natural phosphate rock. Hence, the product is suitable for phosphate
industry as a substitute raw material (Berg et al. 2006a).
In their study, Berg et al. (2006b) evaluate the costs for the total phosphorus recovery
process including the investment and running costs for a plant of 45 000 p.e. with hydraulic
load of 250 l/d per capita. Maintenance costs were estimated 0.5% of the investment costs
per year. The sales value of the product was not included in the estimate, presented in Table
20). If the problems with the seed material loss are solved, the continuous stirred process in
large scale is the most economical choice (Berg et al. 2006b).

67
Table 20: Cost evaluation for the PRoc Process with reactor options (Berg et al. 2006b).
Process Annual costs (€/p.e./a)Phostrip 0.79
Pretreatment 0.32
Crystallization
Fixed bed 1.71
Stirred reactor, discontinuous batch 1.30
Stirred reactor, continuous flow 1.10
Expanded bed 0.95 1.24
Solar drying 0.09
Total 2.14 2.90
The future development aims at the implementation in full scale and concentrates on the
optimization of the stirred reactor process, the material selection and the suitability studies
of the final product for fertilizer use (Berg et al. 2006b).
6.1.2 PRISA PROCESS
The PRISA (Phosphorus Recovery by ISA) process was developed in RWTH Aachen
University (Germany) at the Institute of Environmental Engineering (ISA). The process
aims at phosphorus and ammonium recovery precipitating struvite from supernatant liquor
separated from the sludge in the thickeners before and after anaerobic digestion (Montag et
al. 2007). Figure 40 presents the simplified flow chart of the PRISA process.
Figure 40: Simplified flow chart of the PRISA process (Montag et al. 2007).
Dewateredsludge
Sludge
Struvite
EQUALIZINGTANK
ANAEROBICDIGESTION
Supernatant liquor
PRETHICKENER
POSTTHICKENER
FILTER
MgONaOH
Returnflow
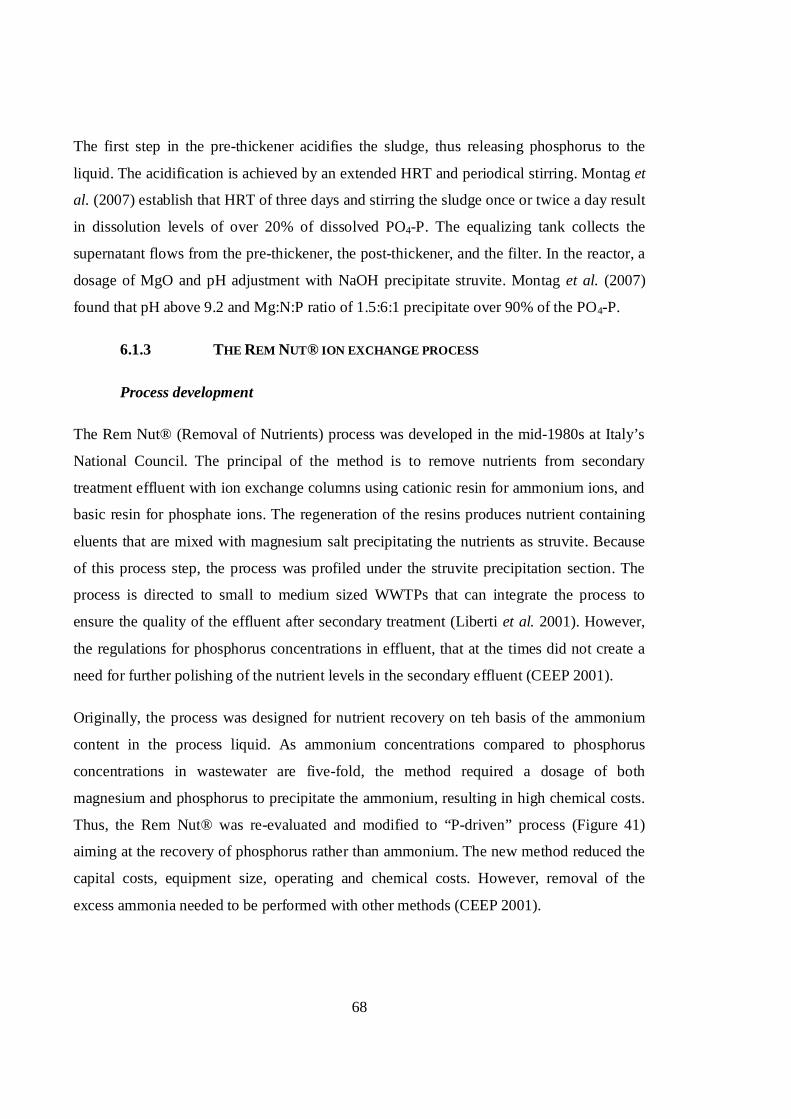
68
The first step in the prethickener acidifies the sludge, thus releasing phosphorus to the
liquid. The acidification is achieved by an extended HRT and periodical stirring. Montag et
al. (2007) establish that HRT of three days and stirring the sludge once or twice a day result
in dissolution levels of over 20% of dissolved PO4P. The equalizing tank collects the
supernatant flows from the prethickener, the postthickener, and the filter. In the reactor, a
dosage of MgO and pH adjustment with NaOH precipitate struvite. Montag et al. (2007)
found that pH above 9.2 and Mg:N:P ratio of 1.5:6:1 precipitate over 90% of the PO4P.
6.1.3 THE REM NUT® ION EXCHANGE PROCESS
Process development
The Rem Nut® (Removal of Nutrients) process was developed in the mid1980s at Italy’s
National Council. The principal of the method is to remove nutrients from secondary
treatment effluent with ion exchange columns using cationic resin for ammonium ions, and
basic resin for phosphate ions. The regeneration of the resins produces nutrient containing
eluents that are mixed with magnesium salt precipitating the nutrients as struvite. Because
of this process step, the process was profiled under the struvite precipitation section. The
process is directed to small to medium sized WWTPs that can integrate the process to
ensure the quality of the effluent after secondary treatment (Liberti et al. 2001). However,
the regulations for phosphorus concentrations in effluent, that at the times did not create a
need for further polishing of the nutrient levels in the secondary effluent (CEEP 2001).
Originally, the process was designed for nutrient recovery on teh basis of the ammonium
content in the process liquid. As ammonium concentrations compared to phosphorus
concentrations in wastewater are fivefold, the method required a dosage of both
magnesium and phosphorus to precipitate the ammonium, resulting in high chemical costs.
Thus, the Rem Nut® was reevaluated and modified to “Pdriven” process (Figure 41)
aiming at the recovery of phosphorus rather than ammonium. The new method reduced the
capital costs, equipment size, operating and chemical costs. However, removal of the
excess ammonia needed to be performed with other methods (CEEP 2001).
69
Figure 41: The “Pdriven” Rem Nut® ion exchanger process flowchart (Liberti et al. 2001).
As can be seen in the Figure, the “Pdriven” Rem Nut® processes the whole influent stream
in the anionic resin column, whereas only 1/10 is passing through the cationic resin (Liberti
et al. 2001).
Process description
As described by Stratful et al. (1999) the liquid from secondary treatment is controlled for
pH and temperature, and the flow is measured with rotameter. The liquid enters the cationic
resin column with 0.45 m3 natural zeolite (Clinoptilolite), where ammonium ions are
removed. Then the flow is led to the anionic column with 0.43 m3 strongly basic resin
removing phosphate ions. The reactions in the columns are:
ZNa + NH4+ (K+) ZNH4 + Na+ (17)
2RCl + HPO42 R2HPO4 + 2Cl (18)
Where Z = zeolite, R = anion exchanger (Liberti et al. 2001).
The process consists of two columns with both resins, thus enabling continuous process
during regeneration. Regeneration is needed every 3 hours with a flow rate of 30 m3/cycle
(Stratful et al. 1999). Seawater can be used in regeneration when possible, resulting in
0.9 Q
RCl
0.1 Q
ZNa
Struvite
SecondaryEffluent Q
0.6 M NaClRegenerate
Regenerate
RecoveredNaClEffluent MgCl2
NaOH
0.9 Q
RCl
0.1 Q
ZNa
Struvite
SecondaryEffluent Q
0.6 M NaClRegenerate
Regenerate
RecoveredNaClEffluent MgCl2
NaOH

70
estimated savings of over 80% of chemical costs. Otherwise, 0.6 M NaCl solution is
recirculated four times as a closed loop (Liberti et al. 2001). Cationic resin is regenerated
with 2.6 m3, and the anionic resin with 2 x 0.86 m3 of the NaCl solution. The elutes are
mixed and the lacking substances for struvite precipitation ratio are added. The final
product is stored in filter bags letting the supernatant drain off before returning it to the
process. At this point, the product is sludgelike with high solids concentration (Stratful et
al.1999).
Costs and Experiences
Typical negative factors in ion exchangers include relatively high cost, environmental
impact of regeneration eluents, and the fouling of ion exchangers. These effects are
decreased by a closed loop technology developed for Rem Nut® (Liberti et al. 2001).
Additional problems in anionic resins are poor selectivity towards phosphates leading to
low operative retention capacity, inefficient regeneration, and gradual loss of the loading
capacity due to the fouling phenomena (Petruzzelli et al. 2003). NH4selective natural
zeolite and commercial anion exchanger seem to be able to remove phosphorus to meet the
requirements for effluent quality. However, commercial availability is weak for synthetic
and natural zeolites because they are limited to specialized applications in the US and the
United Kingdom (Liberti et al. 2001).
The process has been tested in pilotscale: in 1983, a fully automatic pilot plant with
capacity of 240 m3/d was located at West Bari WWTP in southeast Italy. Another pilot
plant was opened in 1986 at South Lyon in Michigan, USA (Liberti et al. 2001). Intentions
to build a fullscale plant failed in 1998 as the readily planned application with financial
approvals lost the buyer of the produced struvite in the closedown of the nearby fertilizer
factory (CEEP 2001).
Liberti et al. (2001) estimate that the total investment of the Rem Nut® process in a
WWTP with an influent flow of 11 000 m3/d, would be 440 000 €, the operational costs
336 900 €/a, and the net unit cost 0.048 €/m3. The production of struvite is estimated 285
t/a.

71
Petruzzelli et al. (2003) tested a phosphate selective resin, based on the commercialized
DOWEX 4195. The resin was based new promising ion exchanger that, according to
previous tests, shows good selectivity towards phosphates. It was developed in USA at
Lehigh University, Pennsylvania. The reference materials are based on the use of
commercial weak base anion exchanger saturated with copper ions. The resin was first
tested in laboratory for the phosphate selectivity. The tests showed that the phosphorus
level stayed below 1 mg P/l during 400 bed volumes, and the phosphorus recovery rate was
over 95% in regeneration (Petruzzelli et al. 2003). The resin was tested in the pilot plant
with the capacity of 0.1 m3/d. The pilot for this study was located at the Grottaglie
Monteiasi WWTP, having an inflow of 3 000 m3/d and 20 000 p.e. The experiments
showed half the capacity detected in the laboratoryscale experiments. The leakage stayed
below 1 mg P/l during 150 200 BV. Regeneration was performed using 1M NaCl pH 4.3
with 2 BV and resulted in over 95% recovery. No fouling of the polymer matrix was
observed, but the results were not encouraging in terms of performance improvement of the
new sorbent. Although the resins are improving, the feasibility of the process has to be
evaluated. Often the ion exchangers are too expensive in fullscale use (Petruzzelli et al.
2003).
6.2 Wet chemical
6.2.1 THE SEPHOS AND THE ADVANCED SEPHOS PROCESS
The SEPHOS process (Sequential Precipitation of Phosphorus) was developed in the
Technical University of Darmstadt (Germany), at the Institute of Water Technology (WAR)
as part of a twoyear project funded by the federal state of North RhineWestphalia. The
SEPHOS Process is based on the studies of Schaum (2007) on the wet chemical approach
of phosphorus recovery from sewage sludge ash.
First step of the SEPHOS process is the elution of ash with H2SO4 to reach pH value below
1.5 dissolving phosphorus and most of the metals (Figure 42). Undissolved residues are
removed from the mixture and pH increased stepwise with caustic soda to pH 3.5.

72
Aluminum phosphates precipitate below pH 3.5 whereas heavy metals remain dissolved.
The produced aluminum phosphate is separated and suitable for the electrochemical
process of Thermphos, although more development is needed on the product quality, such
as reduction of sulfur and sodium. Due to the high aluminum content, the SEPHOS product
is not suitable for agriculture, since aluminum can cause root damage (Schaum et al. 2005).
Figure 42: The SEPHOS Process and the Advanced SEPHOS Process (modified from Schaum et al.
2005).
Further processing with the advanced SEPHOS process recovers calcium phosphate that
can be used in agriculture. The SEPHOS product is treated with base in pH 12 14. This
dissolves aluminum and phosphate, but the most heavy metals remain solid and can be
separated. The liquid rich in dissolved phosphorus and aluminum is transferred to a reactor
where a dosage of calcium ions precipitate calcium phosphate (Schaum et al. 2005).
After phosphorus removal from the liquid, the remaining aluminum can be reused as
precipitant at a WWTP. Crystallization with PRoC process, using CSH as seed material
has been tested with promising results to replace the precipitation (Schaum et al. 2005).
The analyses from the product showed that the SEPHOS product had a phosphorus content
of 12% whereas the phosphorus content in the ash before treatment was 9.8%. Compared to
the test on the aluminum ash before and after SEPHOS treatment, the heavy metals content
had reduced about 70 to 90% (Schaum et al. 2005). By adding sulfides before increasing
the pH, it is possible to lower the amount of Cd and Cu in the SEPHOS product. In their
DEWATERING
CaPO4
NaOH
SEPHOSProduct(AlPO4)
Heavy metals
H2SO4
AshDEWATERING
pH 1.5 pH 3.5
DEWATERING
Ca2+BasepH 1214 Filtrate
(Aluminium)
Acid recycling
SEPHOSProduct
Solid residue
DEWATERING
CaPO4
NaOH
SEPHOSProduct(AlPO4)
Heavy metals
H2SO4
AshDEWATERING
pH 1.5 pH 3.5
DEWATERING
Ca2+BasepH 1214 Filtrate
(Aluminium)
Acid recycling
SEPHOSProduct
Solid residue

73
paper, Schaum et al. report 50% and 90% lower concentrations of cadmium and copper,
respectively, in the laboratory experiments when using sodium sulfate Na2S precipitation
before pH increase.
Figure 43 presents estimates of the mass flow in SEPHOS process (Schaum 2007).
Figure 43: Mass flow in the SEPHOS Process (modified from Schaum 2007).
The price of the SEPHOS Product is estimated on basis of the chemical costs and is about 2
to 3 times higher compared to the price of raw phosphorus (Schaum et al. 2005).
6.2.2 THE PASH PROCESS
Developed in the Institute of Applied Polymer Science (IAP) at Aachen University
(Germany), the PASH (Phosphorus recovery from Ash) process recovers phosphorus as
calcium phosphate from incinerated sewage sludge ash and also meat and bone meal ash.
The PASH process was developed during the PASCH project launched as part of the
German government funded program "Recycling management of plant nutrients, especially
phosphorus" (BMBF/BMU 2010). Figure 44 presents the simplified flow chart of the
process. The process utilizes liquidliquid extraction for heavy metal and iron separation
after acid leaching with HCl. The precipitation chemical determines the final product; lime
or magnesium compounds are possible options (Montag 2008, Montag and Pinnekamp
2009).
DEWATERING
NaOH (100 %) 300 kg
SEPHOS Product400 kg (80 % water, 20% SO3, 10 % Na2O)~800 kg DM with 12 % P
H2SO4 (100 %) 600 kgWater 940 kg
Ash1000 kg DEWATERING
Solid residue2800 kg (67 % water)~920 kg DS
Wastewater 480 kg
DEWATERING
NaOH (100 %) 300 kg
SEPHOS Product400 kg (80 % water, 20% SO3, 10 % Na2O)~800 kg DM with 12 % P
H2SO4 (100 %) 600 kgWater 940 kg
Ash1000 kg DEWATERING
Solid residue2800 kg (67 % water)~920 kg DS
Wastewater 480 kg
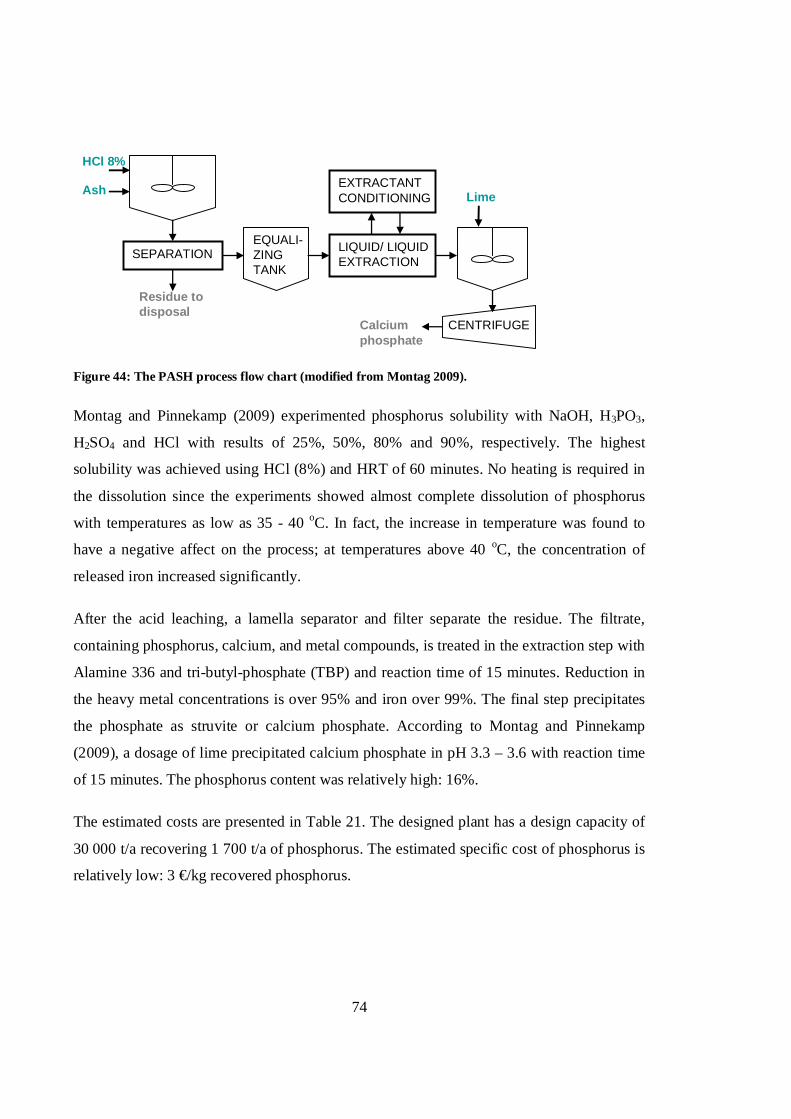
74
Figure 44: The PASH process flow chart (modified from Montag 2009).
Montag and Pinnekamp (2009) experimented phosphorus solubility with NaOH, H3PO3,
H2SO4 and HCl with results of 25%, 50%, 80% and 90%, respectively. The highest
solubility was achieved using HCl (8%) and HRT of 60 minutes. No heating is required in
the dissolution since the experiments showed almost complete dissolution of phosphorus
with temperatures as low as 35 40 oC. In fact, the increase in temperature was found to
have a negative affect on the process; at temperatures above 40 oC, the concentration of
released iron increased significantly.
After the acid leaching, a lamella separator and filter separate the residue. The filtrate,
containing phosphorus, calcium, and metal compounds, is treated in the extraction step with
Alamine 336 and tributylphosphate (TBP) and reaction time of 15 minutes. Reduction in
the heavy metal concentrations is over 95% and iron over 99%. The final step precipitates
the phosphate as struvite or calcium phosphate. According to Montag and Pinnekamp
(2009), a dosage of lime precipitated calcium phosphate in pH 3.3 – 3.6 with reaction time
of 15 minutes. The phosphorus content was relatively high: 16%.
The estimated costs are presented in Table 21. The designed plant has a design capacity of
30 000 t/a recovering 1 700 t/a of phosphorus. The estimated specific cost of phosphorus is
relatively low: 3 €/kg recovered phosphorus.
Calciumphosphate
HCl 8%
Residue todisposal
LIQUID/ LIQUIDEXTRACTION
CENTRIFUGE
Ash
SEPARATIONEQUALIZINGTANK
EXTRACTANTCONDITIONING Lime

75
Table 21: The cost evaluation of the PASH process (Montag and Pinnekamp 2009).
Investment costsBuilding and civil engineering works 2.0 M€Mechanical equipment 2.4 M€Electrical equipment 0.6 M€
Operational costs 4 M€/a
6.2.3 THE BIOCON® PROCESS
The BioCon® process recovers phosphorus as phosphoric acid from sewage sludge ashes.
The process was developed in Denmark by PM Energi A/S. Now, the brand BioCon®
belongs to a subsidiary of Veolia Water, a Danish company Krüger A/S located in Aalborg.
The process consists of three parts: sludge drying, sludge incineration, and recovery unit
with ion exchangers. According to the company website (Veolia Water 2010), the process
is available only with the sludge drying and sludge incineration process, without the
recovery unit. However, this Section discusses only the recovery unit (Figure 45). Due to
the acid leaching step, the process was profiled under the wet chemical methods Section.
Figure 45: The recovery unit of BioCon® Process with mass flow information from the pilot plant at
Brønderslev WWTP (modified from Levlin 2002 and Hultman et al. 2001).
FeCl331 kg
SludgeResidue< 5 kg
KHSO4235 kg
HCl26 kg
H3PO492 kg
ASHSILO
ASHMILL
H2SO4146 kg
NaOH49 kg H2SO4
46 kg
Water
Ash fromincineration
1000 kg cat an catan
Sand
pH ~ 1
FeCl331 kg
SludgeResidue< 5 kg
KHSO4235 kg
HCl26 kg
H3PO492 kg
ASHSILO
ASHMILL
H2SO4146 kg
NaOH49 kg H2SO4
46 kg
Water
Ash fromincineration
1000 kg cat an catan
Sand
pH ~ 1
76
The first step of the process dissolves the phosphorus and heavy metal contents with
sulfuric acid from the ground feed material (Hermann 2009a). The addition of the acid and
water in the stirred reactor leads approximately to pH 1 (Berg and Schaum 2005). The
solution passes through a series of ion exchangers. The first exchanger is cationic,
separating Fe3+ ions. It is regenerated with HCl producing FeCl3. The following exchanger
is anionic, collecting potassium ions, and after regeneration with sulfuric acid produces
potassium hydrogen sulfate. In this step, NaOH is used for both pH adjustment and
regeneration (Hultman et al. 2001). The final exchanger collects phosphates. Regeneration
with hydrochloric acid produces a stream of phosphoric acid (Lundin et al. 2004). The
effluent needs to be further treated due to heavy metals remaining in the liquid (Hermann
2009a).
The method has been tested in pilot scale in WWTP of Brønderslev, Denmark. The plant
has biological phosphorus removal process and the sludge from the process, holding iron
200 mol/t DS, is incinerated without digestion step. A permit for a large scale incineration
plant with BioCon® application has been applied in Falun, Sweden (Levlin et al. 2001).
Ion exchangers are not considered economical due to considerable ion concentrations,
numerous regenerations. Lundin et al. (2004) evaluated the total cost of 155€/t DS
consisting of capital costs 88 €/t DS and operational costs 67 €/t DS.
6.2.4 THE AQUA RECI PROCESS
The Aqua Reci process was developed jointly by Feralco and Chematur Engineering AB. A
pilot plant is located in Karlskoga, Sweden. The process uses supercritical water oxidation
(SCWO) with conditions of p > 221 bar and T > 374 °C. Under these conditions, pure
oxygen is added for complete oxidation of sludge constituents. Reaction time is 60 seconds
in the reactor, the total retention time being five minutes. Energy for heating is needed only
in the startup of the process because the oxidation reaction is exothermic generating
sufficient energy to maintain the reactor temperature (Stendahl and Jäfverström 2004,
Hermann 2009a). During the process, 99.9% of organic substances decompose to CO2,
organic and inorganic nitrogen oxidizes to N2, and phosphorus to P2O5. The inorganic ash

77
from the SCWO process is very reactive. Thus, the metal oxides and phosphorus are easily
soluble. The phosphorus recovery step, presented in Figure 46, follows the SCWO.
Figure 46: The recycling step after SCWO in the Aqua Reci process (Stendahl and Jäfverström 2004).
Phosphorus can be extracted using base. Since heavy metals are insoluble under alkaline
conditions, they can be separated from the mixture. Phosphorus is recovered as calcium
phosphate by adding lime.
Table 22: Cost evaluation for Aqua Reci investment (Stendahl and Jäfverström 2004).
Costs (€)Energy 3 000 MWh @ €50 150 000Oxygen 8 750 tons @ €80 700 000Sulfuric acid 3 300 tons @ €40 132 000Magnesium oxide 1 170 tons @ €120 140 000Staff, 2 people 60 000Miscellaneous 100 000Total annual operative costs 1 282 000Operative costs €/ton DS 128Total annual capital costs 1 200 000Total annual costs 2 482 000Total costs €/ton DS 248Total costs €/ton 25% DS 62
6.2.5 NANOFILTRATION
Güney et al. (2008) used Nafion 117 (DuPont) cation exchange membrane to remove
metals from digested sludge in order to recover phosphorus as struvite. In the study, four
40% DS10 000 t/a (1.3 t/h)
Filter cake40% DS8 800 t/a (1.1 t/h)
SCWO ash
THICKNER/STORAGETANK
NaOH recycling
FILTER
Lime750 t/a(0.9 t/h)
Water57 000 t/a (7.1 t/h)
Calcium phosphate70% DS2 400 t/a (0.3 t/h)
FILTER
FILTER
78
types of sludge were used: original, diluted, centrifuged and incinerated sludge from the
digester. It was found that the most important factors to successful filtration are adequate
mixing and low concentration of suspended solids (SS) and organic material, both for
avoiding problems in cake layer and giving the metal ions a change to a good contact with
the filter surface. The best material for metal ion removal was the incinerated sludge,
because it has the minimum amount of organic material and solids to interrupt the filtration.
It also holds a high metal content. The removal rate with incinerated sludge was the highest
of all four: 98%, 97% and 80% of Al, Ca and Fe, respectively, was removed. After removal
of metal ions the phosphorus rich solution was brought to pH 8.5, the residue of metal
phosphates was filtered and struvite production was initiated by adding NH4Cl and MgCl2.
More than 65% of influent phosphorus was recovered as struvite with high quality. The
mass fraction of produced struvite was close to the mass fraction of pure struvite, and met
the requirements of DümV (Güney et al. 2008).
6.3 Thermochemical
6.3.1 THE ASH DEC PROCESS
The ASH DEC process treats monoincinerated sewage sludge ashes by a chloride dosage
and thermal treatment in order to remove heavy metals making the product suitable for
agricultural use. The development of the process started already in 2002, but was
completed as a part of the EU Project SUSAN (2008) with the pilotscale implementation
and the experiments for the fertilizer use of the final product.
Process description
The process can treat ashes with phosphorus concentration from 5 to 30%. In the first step,
the ash is mixed with an environmentally acceptable chloride donor such as alkali metal
chloride, alkaline earth metal chloride, or both. Preferred chemicals are CaCl2, KCl, and
MgCl2, that can be added in powder or aqueous solution. The crystallization water content
of the additive is insignificant. The amount of chemical varies between 60 to 95% of ash
and 5 to 40% of metal chloride by weight based on the total weight of the mixture
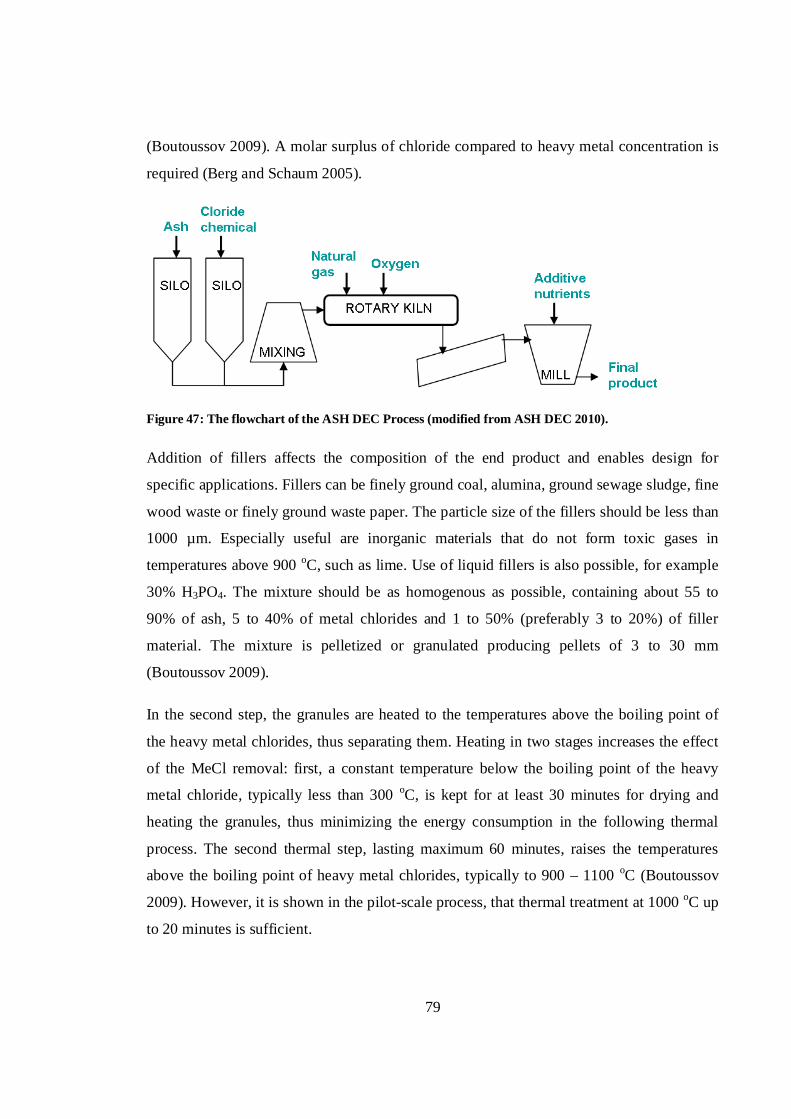
79
(Boutoussov 2009). A molar surplus of chloride compared to heavy metal concentration is
required (Berg and Schaum 2005).
Figure 47: The flowchart of the ASH DEC Process (modified from ASH DEC 2010).
Addition of fillers affects the composition of the end product and enables design for
specific applications. Fillers can be finely ground coal, alumina, ground sewage sludge, fine
wood waste or finely ground waste paper. The particle size of the fillers should be less than
1000 µm. Especially useful are inorganic materials that do not form toxic gases in
temperatures above 900 oC, such as lime. Use of liquid fillers is also possible, for example
30% H3PO4. The mixture should be as homogenous as possible, containing about 55 to
90% of ash, 5 to 40% of metal chlorides and 1 to 50% (preferably 3 to 20%) of filler
material. The mixture is pelletized or granulated producing pellets of 3 to 30 mm
(Boutoussov 2009).
In the second step, the granules are heated to the temperatures above the boiling point of
the heavy metal chlorides, thus separating them. Heating in two stages increases the effect
of the MeCl removal: first, a constant temperature below the boiling point of the heavy
metal chloride, typically less than 300 oC, is kept for at least 30 minutes for drying and
heating the granules, thus minimizing the energy consumption in the following thermal
process. The second thermal step, lasting maximum 60 minutes, raises the temperatures
above the boiling point of heavy metal chlorides, typically to 900 – 1100 oC (Boutoussov
2009). However, it is shown in the pilotscale process, that thermal treatment at 1000 oC up
to 20 minutes is sufficient.
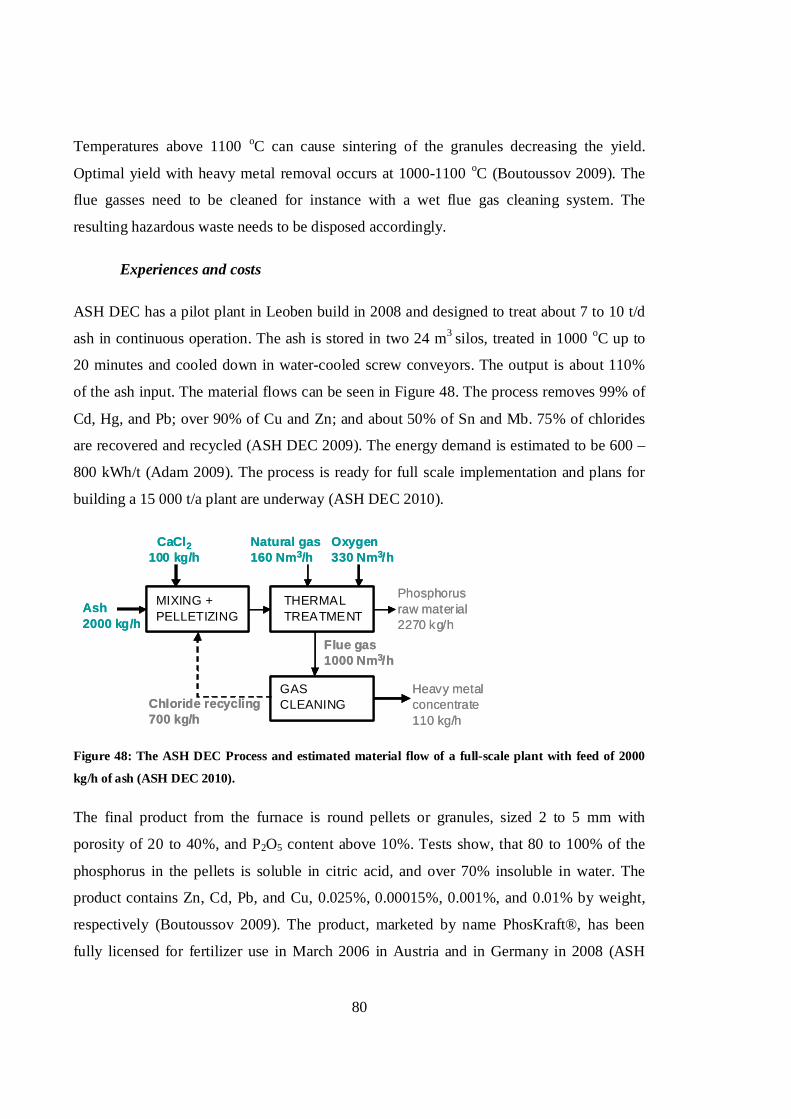
80
Temperatures above 1100 oC can cause sintering of the granules decreasing the yield.
Optimal yield with heavy metal removal occurs at 10001100 oC (Boutoussov 2009). The
flue gasses need to be cleaned for instance with a wet flue gas cleaning system. The
resulting hazardous waste needs to be disposed accordingly.
Experiences and costs
ASH DEC has a pilot plant in Leoben build in 2008 and designed to treat about 7 to 10 t/d
ash in continuous operation. The ash is stored in two 24 m3 silos, treated in 1000 oC up to
20 minutes and cooled down in watercooled screw conveyors. The output is about 110%
of the ash input. The material flows can be seen in Figure 48. The process removes 99% of
Cd, Hg, and Pb; over 90% of Cu and Zn; and about 50% of Sn and Mb. 75% of chlorides
are recovered and recycled (ASH DEC 2009). The energy demand is estimated to be 600 –
800 kWh/t (Adam 2009). The process is ready for full scale implementation and plans for
building a 15 000 t/a plant are underway (ASH DEC 2010).
Figure 48: The ASH DEC Process and estimated material flow of a fullscale plant with feed of 2000
kg/h of ash (ASH DEC 2010).
The final product from the furnace is round pellets or granules, sized 2 to 5 mm with
porosity of 20 to 40%, and P2O5 content above 10%. Tests show, that 80 to 100% of the
phosphorus in the pellets is soluble in citric acid, and over 70% insoluble in water. The
product contains Zn, Cd, Pb, and Cu, 0.025%, 0.00015%, 0.001%, and 0.01% by weight,
respectively (Boutoussov 2009). The product, marketed by name PhosKraft®, has been
fully licensed for fertilizer use in March 2006 in Austria and in Germany in 2008 (ASH
THERMALTREATMENT
CaCl2100 kg/h
Natural gas160 Nm3/h
Heavy metalconcentrate110 kg/h
Ash2000 kg/h
MIXING +PELLETIZING
GASCLEANINGChloride recycling
700 kg/h
Flue gas1000 Nm3/h
Oxygen330 Nm3/h
Phosphorusraw material2270 kg/h
THERMALTREATMENT
CaCl2100 kg/h
Natural gas160 Nm3/h
Heavy metalconcentrate110 kg/h
Ash2000 kg/h
MIXING +PELLETIZING
GASCLEANINGChloride recycling
700 kg/h
Flue gas1000 Nm3/h
Oxygen330 Nm3/h
Phosphorusraw material2270 kg/h
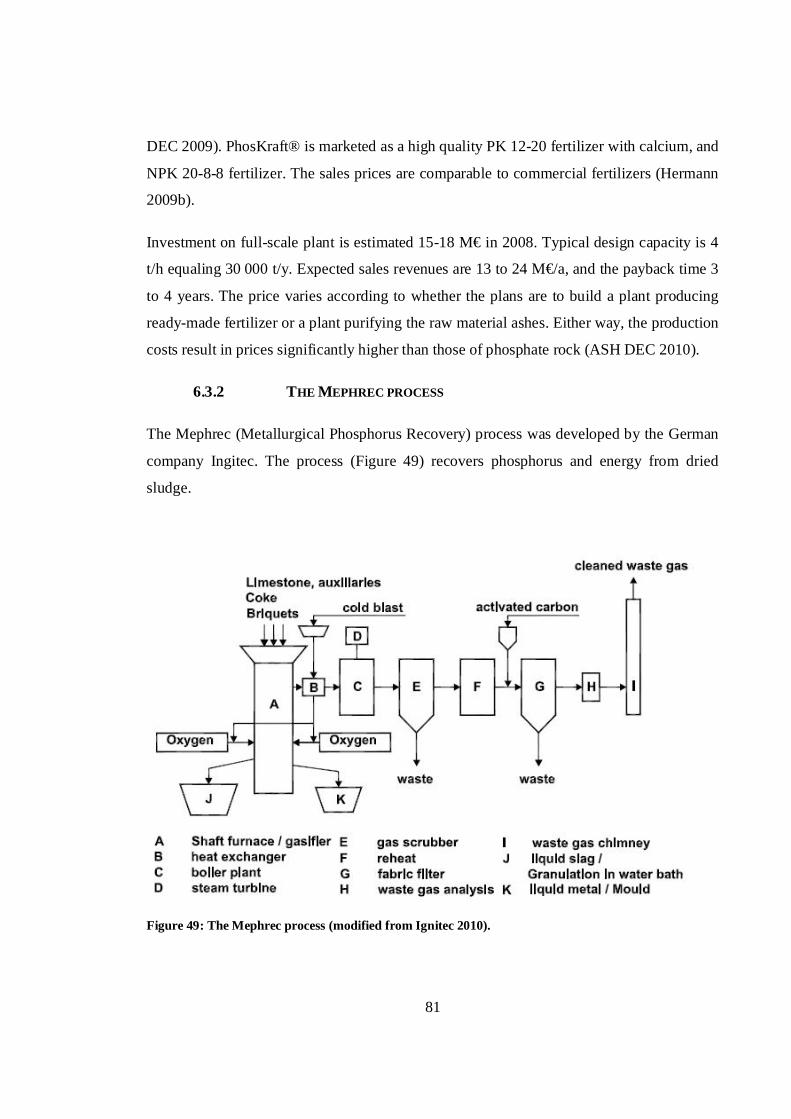
81
DEC 2009). PhosKraft® is marketed as a high quality PK 1220 fertilizer with calcium, and
NPK 2088 fertilizer. The sales prices are comparable to commercial fertilizers (Hermann
2009b).
Investment on fullscale plant is estimated 1518 M€ in 2008. Typical design capacity is 4
t/h equaling 30 000 t/y. Expected sales revenues are 13 to 24 M€/a, and the payback time 3
to 4 years. The price varies according to whether the plans are to build a plant producing
readymade fertilizer or a plant purifying the raw material ashes. Either way, the production
costs result in prices significantly higher than those of phosphate rock (ASH DEC 2010).
6.3.2 THE MEPHREC PROCESS
The Mephrec (Metallurgical Phosphorus Recovery) process was developed by the German
company Ingitec. The process (Figure 49) recovers phosphorus and energy from dried
sludge.
Figure 49: The Mephrec process (modified from Ignitec 2010).
82
Dried sludge is briquetted with slag forming substances and coke. The mixture is treated in
2000 oC transferring phosphorus into the mineral slag and heavy metals to liquid metal
phase (Fe, Cu, Cr, Ni) or to gaseous phase (Hg, Cd, Pb, Zn). The silico phosphates
containing slag is separated from metal phase after being tapped at 1450 oC (Adam 2009).
The final product contains 4.6 12% P2O5 with over 90% citric acid solubility. The content
can be varied by mixing sewage sludge with animal meal. With sewage sludge ash, the
P2O5 content can reach 20%, but the energy recovery is not possible. The process has been
tested in a pilot plant with a capacity of 8 t/h briquettes. A feasible process should have a
minimum capacity of 40 000 t/a briquettes (Ingitec 2010).
6.4 Summary of the pilot and laboratory scale processes
The processes in pilot and laboratoryscale include three crystallization or precipitation
processes, five wet chemical processes, and two thermal processes. Only one of the
crystallization processes, the PRoC process, uses crystallization as calcium phosphate from
process liquid. The PRoC operates with no chemical dosage the seed material providing
everything needed for the crystallization. This decreases the chemical cost which is
important as the experiences from the industrialscale Crystalactor® show that the method
is not economically feasible.
The processes using wet chemical approach with phosphorus leaching step with acid or
base separate the phosphorus with crystallization, sequential precipitation, nanofiltration,
and ion exchangers.
Two processes, the Rem Nut® and the BioCon® use an ion exchanger process step with
the difference that RemNut® is designed to remove phosphorus from liquid phase as
struvite and BioCon® uses acid leaching of phosphorus from sludge ash, producing H3PO4
after regeneration. These methods do not seem to be feasible until ion exchange resins
develop.
Table 23 presents the basic information of the processes including the place of
development, location, feed material, method, and the final product. Not all processes
found in the table are dicussed in detail in this Chapter.

83
The laboratoryscale processes are presented in Table 24. Literature search provided more
information of SEPHOS than other processes. The recently established and yet developing
processes include ATZ, LOPROX, and ERPHOS, whereas PECO, CSIR, Kurita, AFBNR
SCP, Sydney Water Board process, and processes based on the high gradient magnetic
separation were found in the literature published before 2000.

84
Table 23: The summary of the pilotscale processes.
Pilotscaleprocess Developer Location Feed material Method Final product
Aqua Reci Feralco AB Karlskoga, Sweden Sludge SCWO, precipitation Calcium phosphate
ASH DEC ASH DEC UmweltAG Leoben, Austria Ash Thermal method
Ash, purified fromheavy metals /Fertilizer
BioCon PM Energi A/S Falun, Sweden Sludge/ Ash Acid leaching, ion exchange H3PO4
KREPRO Kemira Oyj Helsingborg, Sweden Sludge Thermal hydrolysis, acidleaching, precipitation FePO4
PASH RWTH Aachen Aachen, Germany Ash Acid leaching, liquidliquidextraction, precipitation
Calcium phosphate /struvite
PRISA RWTH Aachen Aachen, Germany Sludge liquor Precipitation Struvite
Mephrec Ingitec Freiberg, Germany Dried sludge/ Ash Metallurgical method Silicophosphate
PRoC Institut ITCWGT Karlsruhe, Germany Liquid Crystallization Calcium phosphate
Oxley Creek Unitika Ltd. Brisbane, Australia Sludg liquor Crystallization Struvite
Rem Nut Bari polytechnics GrottaglieMonteiasi,Italy Liquid Ion exchange and
Precipitation Struvite

85
Table 24: The laboratoryscale processes.
Laboratoryscale process Developer Feed material Final product Chemicals Process description
PECO TU Braunschweig,Germany Liquid Struvite Sea water, NaOH
Struvite precipitation after anaerobictreatment using sea water as magnesiumsource.
LOPROX RWTH Aachen,Germany
Digestersludge H3PO4 n.f. Acid leaching of metal ions with acid and
nanofiltration of the liquid phase.
ATZATZEntwicklumszentrum,Germany
Sludge/ ash Phosphate richslag n.f. Thermal treatment in an iron bed reactor
Sydney WaterBoard Process
Sydney water board,Australia Liquid Amorphous
calcium phosphate Gypsum, magnesia Contact bed reactor for crystallization
SEPHOS /AdvancedSEPHOS
TU Darmstadt,Germany
Ash / SEPHOSproduct
Aluminumphosphate /Calcium phosphate
H2SO4, NaOH, Ca2+ Acid leaching and sequential precipitation
CSIRCouncil for Scientificand IndustrialResearch
Secondaryeffluent
Calciumphosphate, struvite
Quartz sand(0.5 1.2 mm), NaOH Fluidized bed reactor for crystallization
Kurita Kurita, Japan Secondaryeffluent Calcium phosphate
Phosphate rock(0.5 – 1.0 mm) asseed material, CaCl,NaOH
Fixed bed reactor for crystallization
EPHOS TU Darmstadt Ash n.f. n.f. Electrokinetic method
AFBNRSCP n.f.Enricheddigesterstream
Struvite n.f. Anaerobic fermentation biological nutrientremoval struvite crystallization process
High GradientMagneticSeparationTechnique
n.f. Tertiary flow n.f.Precipitationchemical, Magnetite(Fe2O3),
Precipitated phosphorus is mixed with finegrained magnetite (Fe2O3). The magnetite isseparated from phosphate by shear forcesin a drum separator. Separated phosphatesludge needs to be processed for final use.High energy costs are expected.

86
7 POTENTIAL AND COSTS
The sludge treatment costs are presented in Table 25 listing the estimates of Andersen
and Sede (2002) updated to 2009 level by Salado et al. (2009). The total costs consist
mainly of investment and operating costs, the external costs representing less than 15%
of the total costs. The calculation take into account the diminished need for fertilizers
estimating the agronomic value 10 30% of the cost of landspreading.
Table 25: Total costs of disposal of sewage sludge (Salado et al. 2009).
€ / t DSAgricultural use (landspreading)Semisolids 198Semisolids, digested 198Solids 255Composted sludge 374IncinerationCoincinerat 298Monoincineration 384Landfilling 308
As can be seen from Table 25, the landspreading of semisolids is the least expensive
method with total costs less than 200 €/t DS. The three most expensive methods with
total costs over 300 €/t DS are monoincineration, landspreading of composted sludge
and landfilling. Table 26 presents the recovery potential of sludge, assuming the sludge
production as presented by Salado et al. (2009) and the phosphorus content in
dewatered sludge 2% by weight of total phosphorus. The Table assumes that the
recovery from liquid phase could reach 50% of the total phosphorus in the sludge, and
90% represents the recovery potential from sludge or ash. However, the estimates in the
Table appear to be lower than those presented in the literature. For example, Adam
(2009) estimates the recycling potential in Germany 60 000 t/a, and in the Netherlands
8000 t/a, and Hermann (2009) 293 000 t/a in the EU15 countries.
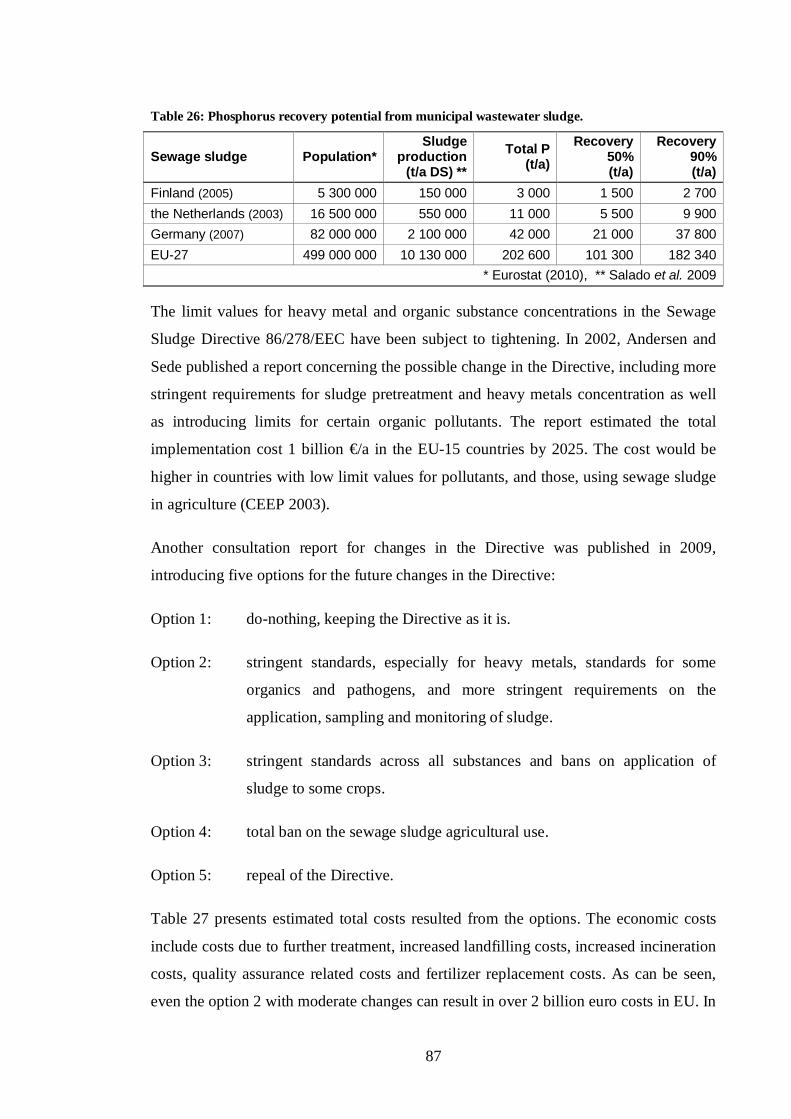
87
Table 26: Phosphorus recovery potential from municipal wastewater sludge.
Sewage sludge Population*Sludge
production(t/a DS) **
Total P(t/a)
Recovery50%(t/a)
Recovery90%(t/a)
Finland (2005) 5 300 000 150 000 3 000 1 500 2 700the Netherlands (2003) 16 500 000 550 000 11 000 5 500 9 900Germany (2007) 82 000 000 2 100 000 42 000 21 000 37 800EU27 499 000 000 10 130 000 202 600 101 300 182 340
* Eurostat (2010), ** Salado et al. 2009
The limit values for heavy metal and organic substance concentrations in the Sewage
Sludge Directive 86/278/EEC have been subject to tightening. In 2002, Andersen and
Sede published a report concerning the possible change in the Directive, including more
stringent requirements for sludge pretreatment and heavy metals concentration as well
as introducing limits for certain organic pollutants. The report estimated the total
implementation cost 1 billion €/a in the EU15 countries by 2025. The cost would be
higher in countries with low limit values for pollutants, and those, using sewage sludge
in agriculture (CEEP 2003).
Another consultation report for changes in the Directive was published in 2009,
introducing five options for the future changes in the Directive:
Option 1: donothing, keeping the Directive as it is.
Option 2: stringent standards, especially for heavy metals, standards for some
organics and pathogens, and more stringent requirements on the
application, sampling and monitoring of sludge.
Option 3: stringent standards across all substances and bans on application of
sludge to some crops.
Option 4: total ban on the sewage sludge agricultural use.
Option 5: repeal of the Directive.
Table 27 presents estimated total costs resulted from the options. The economic costs
include costs due to further treatment, increased landfilling costs, increased incineration
costs, quality assurance related costs and fertilizer replacement costs. As can be seen,
even the option 2 with moderate changes can result in over 2 billion euro costs in EU. In
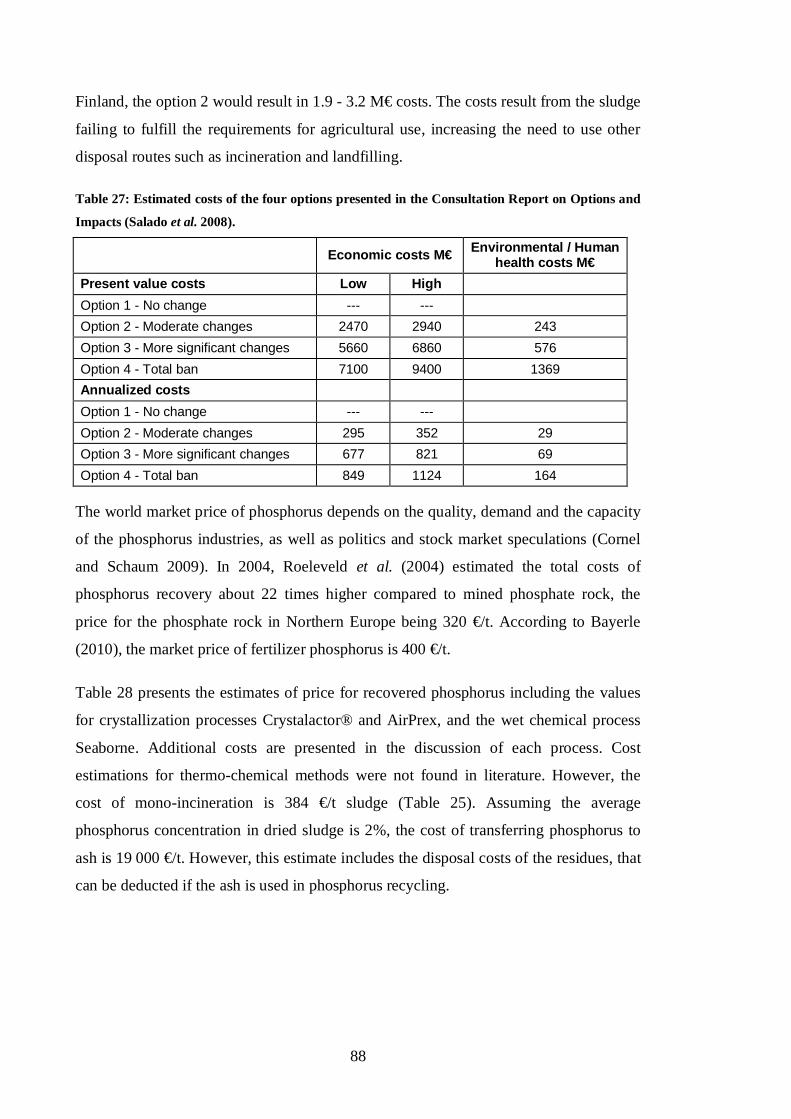
88
Finland, the option 2 would result in 1.9 3.2 M€ costs. The costs result from the sludge
failing to fulfill the requirements for agricultural use, increasing the need to use other
disposal routes such as incineration and landfilling.
Table 27: Estimated costs of the four options presented in the Consultation Report on Options and
Impacts (Salado et al. 2008).
Economic costs M€ Environmental / Humanhealth costs M€
Present value costs Low HighOption 1 No change Option 2 Moderate changes 2470 2940 243Option 3 More significant changes 5660 6860 576Option 4 Total ban 7100 9400 1369Annualized costsOption 1 No change Option 2 Moderate changes 295 352 29Option 3 More significant changes 677 821 69Option 4 Total ban 849 1124 164
The world market price of phosphorus depends on the quality, demand and the capacity
of the phosphorus industries, as well as politics and stock market speculations (Cornel
and Schaum 2009). In 2004, Roeleveld et al. (2004) estimated the total costs of
phosphorus recovery about 22 times higher compared to mined phosphate rock, the
price for the phosphate rock in Northern Europe being 320 €/t. According to Bayerle
(2010), the market price of fertilizer phosphorus is 400 €/t.
Table 28 presents the estimates of price for recovered phosphorus including the values
for crystallization processes Crystalactor® and AirPrex, and the wet chemical process
Seaborne. Additional costs are presented in the discussion of each process. Cost
estimations for thermochemical methods were not found in literature. However, the
cost of monoincineration is 384 €/t sludge (Table 25). Assuming the average
phosphorus concentration in dried sludge is 2%, the cost of transferring phosphorus to
ash is 19 000 €/t. However, this estimate includes the disposal costs of the residues, that
can be deducted if the ash is used in phosphorus recycling.

89
Table 28: The price of recovered phosphorus (€/t).
Process Phase Product €/t P Reference
Crystalactor® Liquid Calcium phosphate 7 300 (Gaanstra et al. 1998)
Sludge Struvite 1 235 2 833 (Jeanmaire and Evans2001)
Liquid 3 600 (Balmér 2003)
Sludge 8 800 (Balmér 2003)
Seaborne Sludge Struvite 40 000 (Bayerle 2010)
AirPrex Sludge liquid Struvite 390 (Lengemann 2010a)
PASH Ash Calcium phosphate 2 900 (Montag andPinnekamp 2009)
As can be seen, compared to the cost of calcium phosphate recovery, the expenses of
struvite production are lower. Indeed, the operational processes mostly recover struvite
whereas the only calcium precipitation plant, Crystalactor® is about to be shut down.
Furthermore, the phosphorus recovery as struvite from the AirPrex reactor results in
costs as low as 50 €/t of struvite (Lengemann 2010a), being even lower than the market
price for NPK fertilizer 400 €/t (Bayerle 2010). Jaffer et al. (2001) calculated that 97%
of the chemical costs in a struvite precipitation process are due to the pH adjustment
with sodium hydroxide, which is not used in the AirPrex procedure. Shu et al. (2005)
estimate a payback period for a recovery process located in a WWTP with an inflow of
55 000 m3/a, using struvite precipitation, five years. The estimate includes the savings
due to reduce sludge handling and disposal.
The wet chemical methods recover phosphorus with higher costs. Balmér (2003)
estimates the cost of phosphorus recovery from wastewater about 40% of the costs from
the recovery from sewage sludge. Experiences from the Seaborne application in Gifhorn
show that the costs depend on the used pH value and thus, the leaching chemical, as
well as the pH adjustion chemical. The magnesium chemical used in the precipitation
step does not have a major effect on the chemical costs.
A careful reexamination of the costs is needed, since during the literature search it was
not always clear if the evaluation was calculated as produced struvite or as recovered
phosphorus. Cost evaluation presented as €/t of recovered phosphorus would result in
comparable data.

90
8 CONCLUSION
Phosphorus recovery has received increasing attention as the phosphate rock resources
deplete and the need for finding a replacing source of phosphorus becomes ever more
important. At the same time, a great amount of sewage sludge is disposed off by using
methods that do not ensure the sustainable recycling of the nutrients bound in the
sludge. Furthermore, as the most economical way to dispose the sludge, the agricultural
use, appears to be increasingly restricted, new technologies are needed to recover
phosphorus from sludge and to process it into a suitable form for fertilizing purposes.
The three raw material options for phosphorus recovery from municipal WWTPs
include: sludge, ash from sludge incineration, and liquid phase after anaerobic treatment
containing phosphorus in soluble form. These options provide a maximum recovery
potentials of 90% from sludge or ash, and 50 60% of total phosphorus from
concentrated side streams. Although the recovery potential is higher with sludge or ash,
recovery from these materials requires chemical leaching of phosphorus or energy
consuming thermal treatment, resulting in higher costs than methods recovering
phosphorus from liquid.
The methods for phosphorus recovery discussed in this thesis include crystallization and
precipitation, wet chemical methods, and thermochemical methods. The crystallization
and precipitation methods convert phosphorus into solid form with a chemical dosage
and pH adjustment. The wet chemical methods recover the phosphorus bound in sludge
or ash by leaching it with acid or base, and recovering the resulting dissolved
phosphorus with various methods, the most common being the precipitation. The ash
fraction after incineration can be treated with thermochemical methods by adding
chloride chemical and bringing the ash to temperature higher than the boiling point of
the resulted heavy metal chlorides, leading to their evaporation. Other thermal methods,
based on metallurgical approaches, produce phosphate rich slag in high temperatures.
Phosphorus recovery technologies have several operational examples, especially of
precipitation technologies. This study suggest that the precipitation is more feasible
economically and technically than methods using wet chemical or thermochemical
methods. Furthermore, the precipitation of struvite is more feasible than calcium
91
phosphate crystallization. In terms of technical feasibility, struvite producing processes
offer a relatively simple and functional method with long operational history.
The wet chemical methods offer experiences from shorter period of time with only one
fullscale process, the Seaborne. The process is currently not feasible due to the high
chemical costs and low influent flow to the plant. The preferred flow to the plants of
future implementatios should be at least twofold compared to the process at Gifhorn
WWTP, having the influent flow of 6 500 m3/d and population equivalent of 50 000.
Many researches expect the increase of the phosphate rock prices solve the feasibility
problems and a reevaluation should occur in 5 10 years to see the development of the
fertilizer and chemical prices. In addition, centralizing the treatment facilities would
result in higher feasibility by increasing the volume of the feed material. However,
centralizing increases the transporting costs and the transportation of sludge requires
dewatering of the sludge. Nevertheless, being the first industrialscale wet chemical
implementation, the Seaborne is an important example and has already granted several
experiences for future fullscale wet chemical applications.
The thermochemical processes have high energy consumption and they require sludge
incineration plants in addition to the thermochemical process itself: in countries lacking
incineration facilities, the implementation of such plant would require large
investments. Thus, these methods can be suitable in countries already using incineration
as a common approach to sludge disposal. Thermochemical processes have indefinitely
been implemented only in pilotscale. However, plans for a plant utilizing ASH DEC
technology are nearly completed, and a fullscale application is expected in the near
future.
It is necessary to recognize the consequences of the depletion of the phosphorus
resources nationally on the governmental level as well as globally. The developments of
the recovery methods conserve the remaining phosphorus resources, and ensure that
reliable technology will be available, when the secondary raw materials become
increasingly important source of phosphorus.

92
9 REFERENCES
Adam, C. 2009. Techniques for Precovery from wastewater, sewage sludge and sewagesludge ashes an overview. Presentation in BALTIC 21 Phosphorus Recyclingand Good Agricultural Management Practice, September 2830, 2009. Berlin.
Andersen, A. and Sede. 2002. Disposal and Recycling Routes for Sewage Sludge, Part 4– Economic Report. Available:http://ec.europa.eu/environment/waste/sludge/pdf/sludge_disposal4.pdf.
ASH DEC. 2009. ASH DEC Umwelt AG. Available:http://www.ashdec.com/eng_index.html. [November 28, 2009]
Balmér, P. 2003. Ref. Cornel, P and Schaum. 2009. Phosphorus recovery fromwastewater: needs, technologies and costs, Water Science and Technology, 59 (6),pp. 10691076.
Balmér, P. 2004. Phosphorus recovery an overview of potentials and possibilities,Water Science and Technology, 49 (10), pp. 185–190.
Battistoni P., Pavan P., Prisciandaro, M. and Cecchi F. 2000. Struvite crystallization: afeasible and reliable way to fix phosphorus in anaerobic supernatants. WaterResources, 34, pp. 30333041.
Bayerle, N. 2009. Phosphorus recycling in Gifhorn with a modified Seaborne process.(PRecycling in Gifhorn mit dem modifizierten SeaborneProzess). Proceedings ofBALTIC 21 Phosphorus Recycling and Good Agricultural Management Practice,September 2830, 2009. Berlin. (In German)
Bayerle, N. 2010. Personal communication. Excursion 10. March, 2010.
Berg, U. and Schaum, C. 2005. Recovery of Phosphorus from sewage sludge and sludgeashes Applications in Germany and Northern Europe. Available:http://www.iwar.bauing.tudarmstadt.de/abw/Deutsch/veroeffentlichungen/05Izmirprecovery_applications_in_europe.pdf
Berg, U., Donnert, D., Weidler, P.G., Kaschka, E., Knoll, G. and Nüesch, R. 2006a.Phosphorus removal and recovery from wastewater by tobermoriteseededcrystallisation of calcium phosphate, Water Science and Technology 53 (3), pp.131138.
Berg, U., Knoll, G., Kaschka, E., Weidler, P.G. and Nüesch, R. 2006b. Is phosphorusrecovery from waste water feasible?. Environmental Technology 28, pp. 165172.
Berliner Wasserbetriebe. 2007. Waßmannsdorf Wastewater Treatment Works Report.Available: http://www.bwb.de/content/language1/downloads/Wamannsdorf07.pdf. (In German)

93
BioCrete Project. 2007. Memo: Composition of European bio ashes. Available:http://www.biocrete.dk/_root/media/28474_Memo%20%20Chemical%20composition%20of%20European%20bio%20ashes.pdf
BMBF/BMU. 2010. Recycling management of plant nutrients, especially phosphorus.Available: http://www.phosphorrecycling.com/
BOOM. 1998. Decision of January 30, 1998, on rules regarding the quality and theapplication on the land application of other organic fertilizers (decision quality,other organic fertilizers). (Besluit van 30 januari 1998, houdende regels metbetrekking tot de kwaliteit en het op of in de bodem brengen van overigeorganische meststoffen (Besluit kwaliteit en gebruik overage organischemeststoffen)). Available: http://faolex.fao.org/docs/pdf/net9006.PDF. (In Dutch)
Boutoussov, M. 2009. Thermal process for separating heavy metals from ash inagglomerated form. US 2009183543 (A1).
CEEP. 2001. SCOPE NEWSLETTER # 41. Phosphate recovery where do we standtoday? Available: http://www.ceepphosphates.org/Files/Newsletter/Scope%20Newsletter%2041.PDF.
CEEP. 2003. SCOPE NEWSLETTER # 50. Available: http://www.ceepphosphates.org/Files/Newsletter/scope50.pdf.
Cordell, D., Drangerta, JO. and White, S. 2009. The story of phosphorus: Global foodsecurity and food for thought. Global Environmental Change, 2, pp. 292305.
Cornel, P. and Schaum, C. 2009. Phosphorus recovery from wastewater: needs,technologies and costs, Water Science and Technology, 59 (6), pp. 10691076.
De Root, P. 2010. Personal communication. 6 May 2010.
Driver, J., Lijmbach, D. and Steen, I. 1999. Why recover phosphorus for recycling, andhow?, Environmental Technology, 20 (1999), pp. 651–662.
DüMV. 2008. German fertilizer ordinance. (Verordnung über das Inverkehrbringen vonDüngemitteln, Bodenhilfstoffen, Kultursubstraten und Pflanzenhilfsmitteln(Düngemittelverordnung – DüMV). Available:http://www.landtag.nrw.de/portal/WWW/dokumentenarchiv/Dokument/XBCBGI0860.pdf. (In German)
EU Comission. 2007. Comission of the European. Report from the commission to thecouncil and the European parliament. Pursuant to Article 16 of Regulation (EC)No 648/2004 of the European Parliament and of the Council of 31 March 2004 ondetergents, concerning the use of phosphates. COM(2007) 234 final. Brussels.
Eurostat. 2010. Population projections. Available:http://epp.eurostat.ec.europa.eu/tgm/table.do?tab=table&init=1&language=en&pcode=tps00002&plugin=1

94
Gaanstra, S., Schemen, R., Bakker, P. and Bannik, M. 1998. Full Scale PhosphateRecovery at Sewage Treatment Plant Geestmerambacht, Holland. Proceedings of 1st International Conference on Phosphorus Recovery for recycling, WarwickUniversity, UK.
GEC. 2010. Global Environment Centre Foundation. Available:http://www.gec.jp/WATER/data/water_251.html.
Giesen, A. 2009a. Presentation: Precovery with the Crystalactor® process. Presentationin BALTIC 21 Phosphorus Recycling and Good Agricultural ManagementPractice, September 2830, 2009. Berlin.
Giesen, A. 2009b. Personal communication. 8 January 2010.
Giesen, A. and van der Molen, J.G. 1996. The Crystalactor: Wastewater treatment bycrystallization without waste production. Technical Report, DHV Water BV,Amersfoot, the Netherlands.
Güney, K., Weidelener, A. and Krampe, J. 2008. Phosphorus recovery from digestedsewage sludge as MAP by the help of metal ion separation. Water research, 42(18) pp. 46924698.
Hannemann, T. Gernot, J. and Lengemann, A. 2009. Verfahren und Vorrichtung zurRückgewinnung von Magnesiumammoniumphosphat aus Klärschlamm. EP2 028 161 A1.
Heinzmann, B. 2009. PRecovery in Berlin from Pilot Scale Experiments to largeScale Application. Presentation in BALTIC 21 Phosphorus Recycling and GoodAgricultural Management Practice, September 2830, 2009.
HELCOM. 2009. Eutrophication in the Baltic Sea – An integrated thematic assessmentof the effects of nutrient enrichment and eutrophication in the Baltic Sea region.Balt. Sea Environ. Proc. No. 115B.
Hermann, L. 2009a. Recovery of phosphorus from wastewater treatment. A review.(Rückgewinnung von Phosphor aus der Abwassereinigung. EineBestandesaufnahme). UmweltWissen Nr. 0929. Bundesamt für Umwelt (BAFU).Bern. (In German)
Hermann, L. 2009b. Precovery from sewage sludge ashes by thermochemicaltreatment. Presentation in BALTIC 21 Phosphorus Recycling and GoodAgricultural Management Practice, September 2830, 2009.
Hultman, B., Levlin, E., Löwén, M., Mossakowska, A. and Stark, K. 2001. Extractionof phosphorus and other products from sludge and ash. Interim report. (Utvinningav fosfor och andra produkter ur slam och aska. Delrapport). Stockholm VattenAB. Vattenvårdsteknik, KTH. Available:http://www.lwr.kth.se/Forskningsprojekt/Precovery/StVattendelr.pdf. (In Swedish)
95
Ingitec. 2010. Mephrec – Metallurgical Phosphorus Recycling. A poster. Available:http://www.ingitec.de/Englisch/Praes/posteraengl.pdf.
Jaffer, Y., Clark, T.A., Pearce, P. and Parsons, S.A. 2001. Potential phosphorusrecovery by struvite formation. Water Research, 36, pp. 18341842.
Janssen, P.M.J., Meinema, K. and van der Roest, H.F. 2002. Biological PhosphorusRemoval, Manual for design and operation. Water and Wastewater PractitionerSeries: STOWA Report. IWA Publishing
Jeanmaire, N. and Evans, T. 2001. Technicoeconomic feasibility of Precovery frommunicipal wastewaters, Environmental technology, 22 (11), pp. 13551361.
Kaper, C. 2010. Personal communication. 6 May 2010.
Kern, J., Heinzmann, B., Markus, B., Kaufmann, N., Soethe, N. and Engels, C. 2008.Recycling and Assessment of Struvite Phosphorus from Sewage Sludge,Agricultural Engineering International: the CIGR Ejournal, vol. X, no. Manuscriptnumber CE 12 01. pp. 113.
Koch, F.A., Mavinic, D.S., Yonemitsu, N. and Britton, A.T. 2009. Fluidized bedwastewater treatment. US 7622047 B2.
Korving, L. 2010. Personal communication. 11 March, 2010.
Laitinen R. and Toivonen, J. 1982. General and inorganic chemistry. (Yleinen jaepäorgaaninen kemia). Otatieto 477. (In Finnish)
Lanning, MC.E. 2008. Phosphate recovery from wastewaters comparing two differentsources of magnesium oxide in the precipitation of struvite. Thesis, the Universityof Guelph.
Lengemann, A. 2010a. Personal communication. 9 March, 2010.
Lengemann, A. 2010b. Personal communication. 23 March, 2010.
Lengemann, A. 2010c. Personal communication. 31 March, 2010.
Levlin, E. 2001. Recovery of phosphate from sewage sludge and separation of metals byion exchange. Proceedings of a PolishSwedish seminar, October 2426, 2001.Wastewater, Sludge and Solid Waste Management.
Liberti, L., Petruzzelli, D. and De Florio, L. 2001. REM NUT ion exchange plus struviteprecipitation process, Environmental technology, 22 (11), pp. 13131324.
Lippert, R. 2010. Bob Lippert's frequently asked questions regarding soil testing, plantanalysis and fertilizers. Available:http://hubcap.clemson.edu/~blpprt/bobweb/bobweb.html.
96
Lundin, M., Olofsson, M., Pettersson, G.J. and Zetterlind, H. 2004. Environmental andeconomic assessment of sewage sludge handling options. Resources, Conservationand Recycling, 41 (4), pp. 255278.
Mäkelä, M. 2004. Requirements for nutrient removal at municipal wastewater treatmentplants. (Jätevedenpuhdistamoiden ravinteidenpoistovaatimukset). Vesitalous, 4,pp. 1214. (In Finnish)
Metcalf & Eddy, Inc. 2003. Wastewater Engineering Treatment and reuse. Mc GrawHill, New York.
MMM. 2007. Ministry of Agriculture and Forestry: regulation of fertilizer products12/7. (Maa ja metsätalousministeriö: Maa ja metsätalousministeriön asetuslannoitevalmisteista 12/07). DNro: 656/01/2007. Given: 13.02.2007,Implementation: 15.03.2007. (In Finnish)
Mongabay. 2010. Phosphate rock price chart.Available:http://www.mongabay.com/images/commodities/charts/chartphosphate.html. [May 19, 2010]
Montag, D., Gethke, K. and Pinnekamp, J. 2007. A Feasible Approach of IntegratingPhosphate Recovery as Struvite at Waste Water Treatment Plants. Proceedings ofthe IWA Specialist Conference: Moncton, New Brunswick, Canada, June 2427:Moving Forward Wastewater Biosolids Sustainability: Technical, Managerial, andPublic Synergy, pp. 551558.
Montag, D. 2008. Phosphorus recovery in wastewater treatment Development of aprocedure for integration into municipal wastewater treatment plants.(Phosphorrückgewinnung bei der Abwasserreinigung –Entwicklung einesVerfahrens zur Integration in kommunale Kläranlagen). Dissertation from derRheinischWestfälischen Technischen Hochschule Aachen. Available:http://deposit.ddb.de/cgibin/dokserv?idn=98906901xanddok_var=d1anddok_ext=pdfandfilename=98906901x.pdf. (In German)
Montag, D. and Pinnekamp, J. 2009. The PASH process for Precovery and overview ofthe German Funding Programme "Recycling management of plant nutrients,especially phosphorous". Presentation in BALTIC 21 Phosphorus Recycling andGood Agricultural Management Practice, September 2830, 2009. Berlin.
Morse, G., Brett, S., Guy, J. and Lester, J. 1998. Review: Phosphorus removal andrecovery technologies, Science of the Total Environment, 212 (1), pp. 6981.
Müench, E. and Barr, K. 2001. Controlled struvite crystallisation for removingphosphorus from anaerobic digester sidestreams. Water Research, 35 (1), pp. 151159.
Nawa, Y. 2009. Precovery in Japan the PHOSNIX process. A Poster from BALTIC21 Phosphorus Recycling and Good Agricultural Management Practice,September 2830, 2009. Available:
97
http://www.jki.bund.de/fileadmin/dam_uploads/_koordinierend/bs_naehrstofftage/baltic21/8_poster%20UNITIKA.pdf
Niewersch, C., Koh, C.N., Wintgens, T., Melin, T., Schaum, C. and Cornel, P. 2008.Potentials of using nanofiltration to recover phosphorus from sewage sludge,Water Science and Technology, 57 (6), pp. 707714.
Ostara 2010.Ostara Group, Questions and answers. Available:http://www.ostara.com/files/u2/Ostara_Q__A.pdf. [April 22, 2010].
Parsons, S. and Smith, J. A. 2008. Phosphorus removal and recovery from municipalwastewaters. Elements, 4 (2), pp. 109112.
Petruzzelli, D., De Florio, L., Dell'Erba, A., Liberti, L., Notarnicola, M. and Sengupta,A. 2003. A new phosphateselective sorbent for the Rem Nut registered process.Laboratory investigation and field experience at a medium size wastewatertreatment plant.
Petzet, S. and Cornel, P. 2009. Precovery from sewage sludge and sewage sludgeashes. Presentation in BALTIC 21 Phosphorus Recycling and Good AgriculturalManagement Practice, September 2830, 2009.
Phosphate Forum of the Americas. 2010. Phosphate Facts. Available:http://www.phosphatesfacts.org/uses.asp [March 4, 2010].
Rantanen, P. and Valve, M. 1994. Biologinen fosforinpoisto kirjallisuuskatsaus, Vesija Ympäristöhallinto, Helsinki.
Rantanen, P., Valve, M. and Kangas, A. 2008. Lietteen loppusijoitus –esiselvitys.Suomen ympäristökeskuksen raportteja 1/2008.
RaynerCanham, G. and Overton, T. Descriptive Inorganic Chemistry. 2006. 4th Ed.Chapter 15: The Group 15 Elements. Craig Bleyer, USA, pp. 351396.
Roeleveld, P., Loeffen, P., Temmink, H. and Klapwijk, B. 2004. Dutch analysis for Precovery from municipal wastewater. Water Science and Technology, 49 (10), pp.191199.
Salado, R., Daly, E., Vencovsky, D., Zamparutti, T. and Palfrey, R. 2009.Environmental, economic and social impact of the use of sewage sludge on land.Consultation Report on Options and Impacts. Interim Report, October 2009.
Salminen, R. 2006. Geochemical atlas of Europe. P – Phosphorus, part 2. Available:http://www.gtk.fi/publ/foregsatlas/text/P.pdf.
Schaum, C. 2007. Procedure for a future sewage sludge treatment: Sewage sludgeconditioning and recovery of phosphorus from sewage sludge ash (Verfahren füreine zukünftige Klärschlammbehandlung: Klärschlammkonditionierung undRückgewinnung von Phosphor aus Klärschlammasche). Instute WAR, Darmstadt.Ref. Adam, C. 2009. Techniques for Precovery from wastewater, sewage sludge

98
and sewage sludge ashes an overview, Presentation in BALTIC 21 PhosphorusRecycling and Good Agricultural Management Practice, September 2830, 2009.Berlin.
Schaum, C., Cornel, P. and Jardin, N. 2005. Possibilities for a Phosphorus Recoveryfrom Sewage Sludge Ash, 9 12 August 2005. Management of ResiduesEmanating from Water and Wastewater Treatment, Johannesburg, South Africa.
Schipper, W.J. and Korving, L. 2009. Fullscale plant test using sewage sludge ash asraw material for phosphorus production. Proceedings of International conferenceon nutrient recovery from wastewater streams, May 10 – 13 2009, Vancouver,Brittish Columbia.
Schipper, W.J., Klapwijk, A., Potjer, B., Rulkens, W.H., Temmink, B.G., Kiestra,F.D.G. and Lijmbach, A.C.M. 2001. Phosphate recycling in the phosphorusindustry. Available: www.thermphos.com.
SEPA. 2002. Swedish Environmental Protection Agency (Naturvårdsverket). Actionplan for recycling of phosphorus from sewage. Main report to the good sludge andphosphorus cycles. (Aktionsplan för återföring av fosfor ur avlopp. Huvudrapporttill bra slam och fosfor i kretslopp). Raport 5214. (In Swedish, summary inEnglish).
Shu, L., Schneider, P., Jegatheesan, V. and Johnson, J. 2005. An economic evaluationof phosphorus recovery as struvite from digester supernatant. BioresourceTechnology, 97 (2006), pp. 22112216.
Stark, K. 2004. Phosphorus recovery from sewage sludge Experiences from Europeancountries. Proceedings of PolishSwedish seminars, Stockholm June 68, 2004Integration and optimisation of urban sanitation systems.
Stark, K., Plaza, E. and Hultman, B. 2006. Phosphorus release from ash, dried sludgeand sludge residue from supercritical water oxidation by acid or base.Chemosphere, 62 (2006), pp. 827832.
Stendahl, K. and Jäfverström, S. 2004. Recycling of sludge with the Aqua Reci process.Water Science and Technology, 49 (10), pp 233240.
Stratful, I., Brett, S., Scrimshaw, M. and Lester, J. 1999. Biological phosphorusremoval, its role in phosphorus recycling, Environmental technology, 20 (7), pp.681695.
Suomenoja. 2010. Suomenoja wastewater treatment plant report 2009. (Suomenojanjäteveden puhdistamon toiminta vuonna 2009).
SUSAN. 2008. SUSAN Newsletter. Available:http://www.susan.bam.de/publications/0801_newsletter_susan.pdf

99
SYKE. 2009. Agriculture increases its share of water environment loading.(Maatalouden osuus vesistökuormituksesta kasvaa). Available:http://www.ymparisto.fi/default.asp?contentid=340163andlan=FI. (In Finnish)
SYKE. 2010. Biological phosphorus removal. (Biologinen fosforinpoisto). Available:http://www.ymparisto.fi/default.asp?contentid=317540andlan=FI. (In Finnish)
Thermphos. 2010. Focus on Phosphorus and Derivatives. Available:http://www.thermphos.com/Home/Brochures/~/media/Pdf/brochure/brochure09.ashx
U.S. Geological Survey. 2009. Mineral commodity summaries 2009, Phosphorus.United States Government Printing Office.Available:http://minerals.usgs.gov/minerals/pubs/commodity/phosphate_rock/
U.S. Geological Survey. 2010. Mineral commodity summaries 2010, Phosphorus.United States Government Printing Office.Available:http://minerals.usgs.gov/minerals/pubs/commodity/phosphate_rock/
Ueno, Y. and Fuji, M. 2001. Three years experience of operating and selling recoveredstruvite from full scale plant, Environmental Technology 22 (2001), pp. 13731381.
Veolia Water. 2010. http://www.veoliawaterst.com/bioco/en/. [April 20, 2010]
Vesilind, P. A. 1998. Wastewater Treatment Plant Design. Water environmentfederation. Alexandria, USA. IWA Publishing.
Vesterager, O. 2009. Method of recovering phosphate from biomass, WO 2009/001027A1.
Ylinen, P. 2009. Requirements for recycled P from the perspective of fertiliser industry.Presentation in BALTIC 21 Phosphorus Recycling and Good AgriculturalManagement Practice, September 2830, 2009.


![Nährstoffrückgewinnung und -recycling in Europa (in German) [Nutrient recovery and recycling in Europe] - seminar Phosphorus recovery technologies in Bonn 21-07-2016](https://img.dokumen.tips/doc/110x75/589b3f651a28ab22038b6b0d/naehrstoffrueckgewinnung-und-recycling-in-europa-in-german-nutrient-recovery.jpg)