Embed Size (px)
Citation preview

PHOSPHORUS IMMOBILIZATION IN MANURE-IMPACTED SOIL WITH
ALUMINUM-BASED DRINKING WATER TREATMENT RESIDUAL
By
MICHAEL MIYITTAH-KPORGBE
A THESIS PRESENTED TO THE GRADUATE SCHOOL OF THE UNIVERSITY OF FLORIDA IN PARTIAL FULFILLMENT
OF THE REQUIREMENTS FOR THE DEGREE OF MASTER OF SCIENCE
UNIVERSITY OF FLORIDA
2004

Copyright 2004
by
Michael Miyittah-Kporgbe

This thesis is dedicated as a memorial to the nature of the Rhema

ACKNOWLEDGMENTS
My sincere gratitude goes to Dr. George A. O’Connor under whose tutelage this
project came to completion. Unconsciously, he has impacted his astuteness to me. I also
thank other members of my committee, Drs. W. G. Harris, R. D. Rhue, and Jean-Claude
Bonzongo, for their inspiration and support. Further, my thanks go to Dr. R.C. Littell,
who, though not on my committee brainstormed with me during the statistical analysis. I
would also like to thank Scott R. Brinton, who was the senior chemist in the laboratory of
soil environmental chemistry, my fellow lab mates and colleagues in the department. To
my parents who sowed the “seed” (John and Cecilia), and my siblings (Esinam, Delali,
Dziedzorm, and Emefa) for their enormous understanding and patience of my long
absence from home. I say “Mia woe dogbeda loo”. I thank, Augustine and Alice whose
efforts to get me the Kenkey, to save time was fruitful. Above all, I thank my Lord, who
has given me the needed inner peace that surpasses every kind of knowledge and
understanding: to Him be the Glory, the Honor and the Praise.
iv

TABLE OF CONTENTS page ACKNOWLEDGMENTS ................................................................................................. iv
LIST OF TABLES............................................................................................................. vi
LIST OF FIGURES ......................................................................................................... viii
ABBREVIATIONS .............................................................................................................x
ABSTRACT....................................................................................................................... xi
CHAPTER 1 INTRODUCTION ........................................................................................................1
Hypotheses....................................................................................................................4 Objectives .....................................................................................................................4
2 LITERATURE REVIEW .............................................................................................6
3 MATERIALS AND METHODS ...............................................................................16
Soil and WTR Used ....................................................................................................16 Single Point Adsorption Determinations.............................................................19 Soil Column Leaching Study...............................................................................21 Rainfall Simulation..............................................................................................23
4 RESULTS AND DISCUSSION.................................................................................27
Soil and WTR Characterization..................................................................................27 Single Point Adsorption Determination ..............................................................29 Soil Column Study ..............................................................................................32
Rainfall Simulation……………………………………………………….. ……42 5 CONCLUSIONS ........................................................................................................51
APPENDIX STATISTICAL DATA ........................................................................53
LIST OF REFERENCES...................................................................................................63
BIOGRAPHICAL SKETCH .............................................................................................69
v

LIST OF TABLES
Table page 4-1 Selected properties of the soils used ........................................................................27
4-2 Selected properties of Al-WTR (O’Connor and Elliott, 2000) ................................29
4-3 Statistical analysis of equilibrated solution P (no P initially added) data. ...............31
4-4 Statistical analysis of P sorption data following P load of 400 µg g-1 .....................32
4-5 Repeated measures ANOVA: P concentration, SRP (mg L-1) .................................37
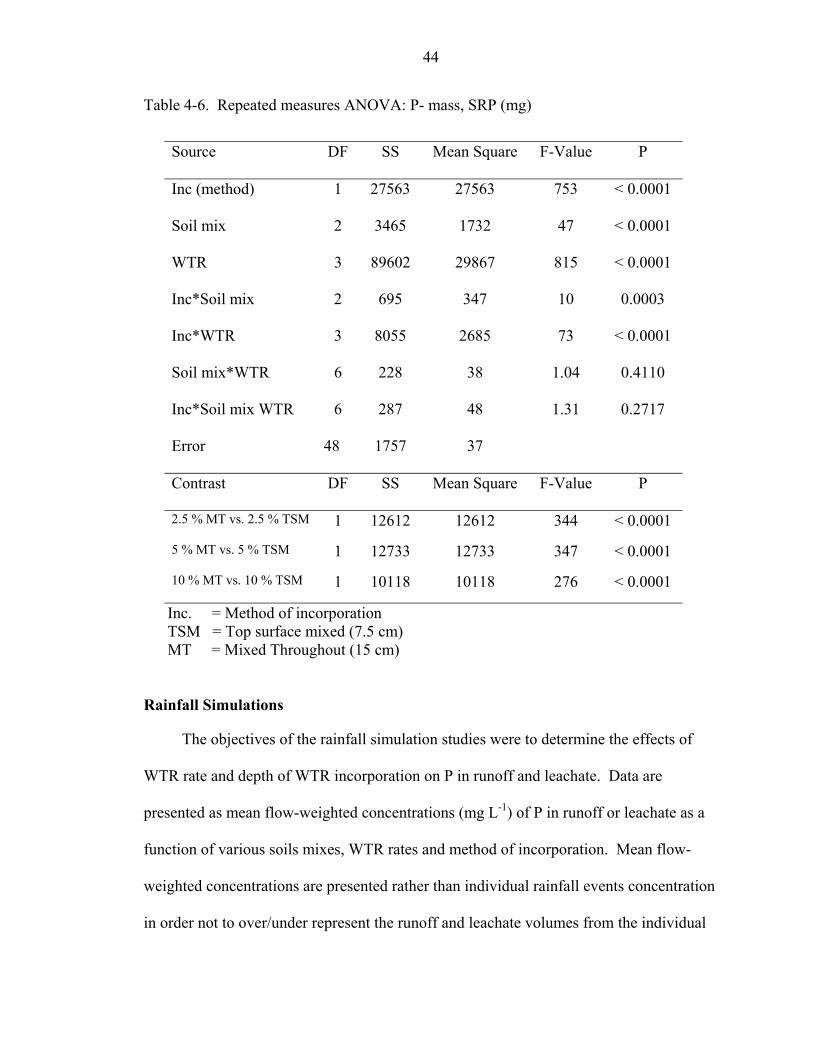
4-6 Repeated measures ANOVA: P- mass, SRP (mg) ...................................................44
A-1 Equilibrated solution concentration (no P initially added).......................................53
A-2 P sorption following P load of 400 µg g-1 ................................................................54
A-3 Time series analysis of P concentration leached (SRP mg L-1) at 6, 11, and 15 pore volume for 100%A-0%E soil mix....................................................................55
A-4 Time series analysis of P concentration leached (SRP mg L-1) at 6, 11, and 15 pore volume for 50%A-50%E soil mix....................................................................56
A-5 Time series analysis of P concentration leached (SRP mg L-1) at 6, 11, and 15 pore volume for 33%A-67%E soil mix....................................................................57
A-6 Time series analysis of P mass leached (SRP mg) at 6, 11, and 15 pore volume for 100%A-0%E soil mix.........................................................................................58
A-7 Time series analysis of P mass leached (SRP mg) at 6, 11, and 15 pore volume for 50%A-50%E soil mix.........................................................................................59
A-8 Time series analysis of P mass leached (SRP mg) at 6, 11, and 15 pore volume for 33%A-67%E soil mix.........................................................................................60
A-9 Statistical analysis of Runoff SRP in Rainfall Simulations .....................................61
A-10 Statistical analysis of Runoff TDP in Rainfall Simulations.....................................61
A-11 Statistical analysis of Runoff TP in Rainfall Simulations........................................61
A-12 Statistical analysis of Leachate SRP in Rainfall Simulations ..................................62
A-13 Statistical analysis of Leachate TDP in Rainfall Simulations..................................62
vi

A-14 Statistical analysis of Leachate TP in Rainfall Simulations.....................................62
vii
LIST OF FIGURES
Figure page 3-1 Schematic diagram of rainfall simulator. .................................................................25
4-2 Equilibrated solution P concentrations (no P initially added) for various soil mixes and WTR rate.................................................................................................31
4-3 P sorption following P load of 400 µg g-1 to various soil mixes with WTR rates....32
4-4 100%A-0%E soil with WTR rates mixed thoroughly and mixed in only the top 7.5 cm of the column soil mass.. ..............................................................................34
4-5 50%A-50%E soil with WTR rates mixed thoroughly and mixed in only the top 7.5 cm of the column soil mass.. ..............................................................................35
4-6 33%A-67%E soil with WTR rates mixed thoroughly and mixed in only the top 7.5 cm of the column soil mass.. ..............................................................................36
4-7 P released in 16 repeated water extractions (1:10 soil water) (Bars indicate SE of the mean) ..................................................................................................................40
4-8 WTR rate and depth of incorporation effects on leached P mass for the 100%A-0%E soil mix. ...........................................................................................................42
4-9 WTR rate and depth of incorporation effects on leached P mass for the 50%A-50%E soil mix.. ........................................................................................................43
4-10 WTR rate and depth of incorporation effects on leached P mass for the 33%A-67%E soil mix.. ........................................................................................................43
4-11 Mean flow weighted SRP in runoff as a function of percent soil mix, WTR rates, and method of incorporation. ...................................................................................46
4-12 Mean flow weighted TDP in Runoff as a function of percent soil mix, WTR rates, and method of incorporation...........................................................................46
4-13 Mean flow weighted Total P in runoff as a function of percent soil mix, WTR rate, and method of incorporation. ...........................................................................47
4-14 Mean flow weighted SRP leachate as a function of percent soil mix, WTR rate, and method of incorporation. ...................................................................................48
viii

4-15 Mean flow weighted TDP in leachate as a function of percent soil mix, WTR rate, and method of incorporation. ...........................................................................49
4-16 Mean flow weighted Total P in leachate as a function of percent soil mix, WTR rate, and method of incorporation. ...........................................................................49
ix

ABBREVIATIONS
Al-WTR……………………………………………………….WTR generated using alum
Ca-WTR…………………………………WTR generated in lime water softening process
Fe-WTR…………………………………………………...WTR generated using iron salts
HCl-P…………………………………………....Ca-and Mg-associated inorganic P forms
KCl-P…………………………………………………………………....Soluble or labile P
NaOH-orgP………………………………………....Fe-and Al-associated organic P forms
NaOH-P…………………………………………..Fe-and Al-associated inorganic P forms
PSI…………………………………………………………....Phosphorus saturation index
Residue-org P………………………………………………...Recalcitrant organic P forms
WTRs……………………………………………………………Water treatment residuals
SE……………………………………………………………………………Standard error
TP………………………………………………………………………...Total phosphorus
TDP……………………………………………………………Total dissolved phosphorus
SRP…………………………………………………………...Soluble reactive phosphorus
TSM………………………………………………………………….....Top surface mixed
TM………………………………………………………………………Thoroughly mixed
x
Abstract of Thesis Presented to the Graduate School
of the University of Florida in Partial Fulfillment of the Requirements for the Degree of Master of Science
PHOSPHORUS IMMOBILIZATION IN MANURE-IMPACTED SOIL WITH ALUMINUM-BASED DRINKING WATER TREATMENT RESIDUAL
By
Michael Miyittah-Kporgbe
December 2004
Chair: George A. O’Connor Major Department: Soil and Water Science
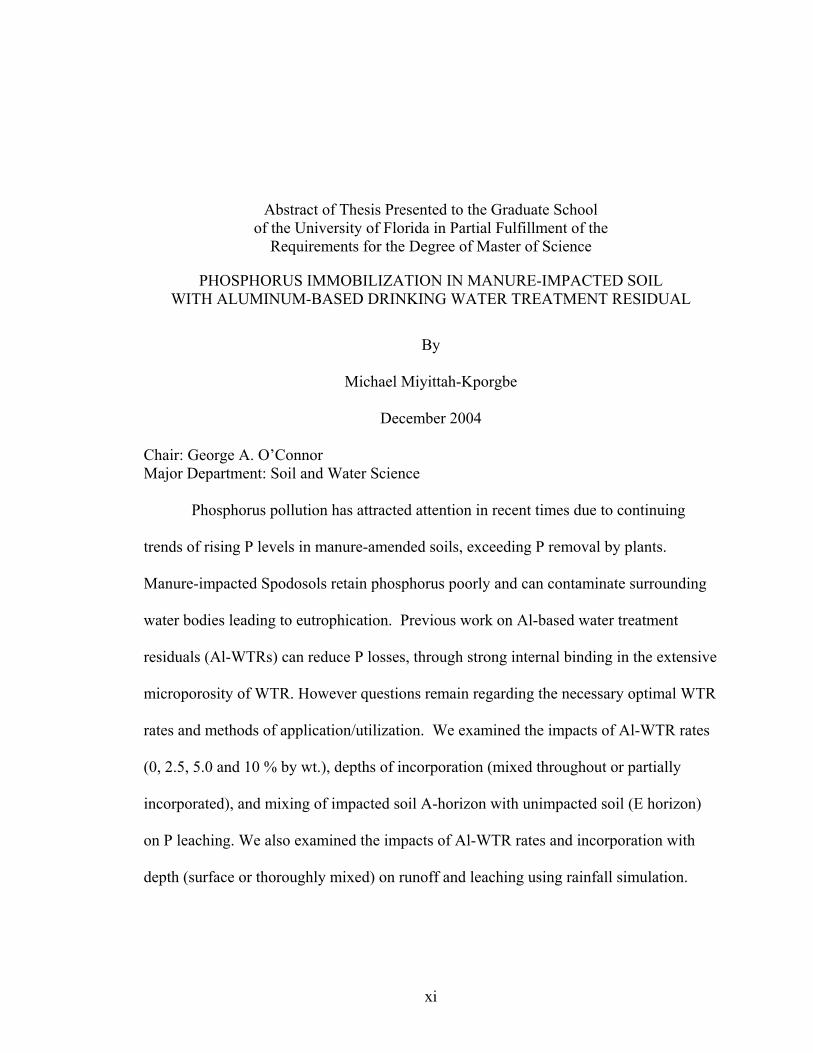
Phosphorus pollution has attracted attention in recent times due to continuing
trends of rising P levels in manure-amended soils, exceeding P removal by plants.
Manure-impacted Spodosols retain phosphorus poorly and can contaminate surrounding
water bodies leading to eutrophication. Previous work on Al-based water treatment
residuals (Al-WTRs) can reduce P losses, through strong internal binding in the extensive
microporosity of WTR. However questions remain regarding the necessary optimal WTR
rates and methods of application/utilization. We examined the impacts of Al-WTR rates
(0, 2.5, 5.0 and 10 % by wt.), depths of incorporation (mixed throughout or partially
incorporated), and mixing of impacted soil A-horizon with unimpacted soil (E horizon)
on P leaching. We also examined the impacts of Al-WTR rates and incorporation with
depth (surface or thoroughly mixed) on runoff and leaching using rainfall simulation.
xi
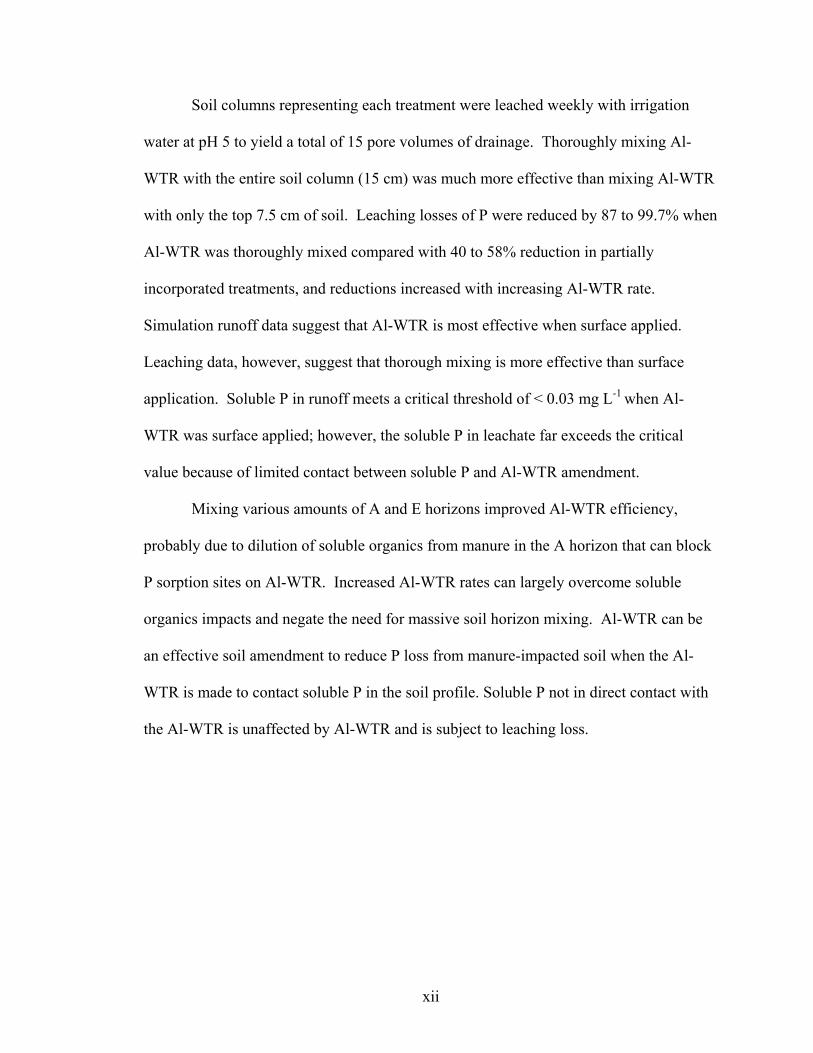
Soil columns representing each treatment were leached weekly with irrigation
water at pH 5 to yield a total of 15 pore volumes of drainage. Thoroughly mixing Al-
WTR with the entire soil column (15 cm) was much more effective than mixing Al-WTR
with only the top 7.5 cm of soil. Leaching losses of P were reduced by 87 to 99.7% when
Al-WTR was thoroughly mixed compared with 40 to 58% reduction in partially
incorporated treatments, and reductions increased with increasing Al-WTR rate.
Simulation runoff data suggest that Al-WTR is most effective when surface applied.
Leaching data, however, suggest that thorough mixing is more effective than surface
application. Soluble P in runoff meets a critical threshold of < 0.03 mg L-1 when Al-
WTR was surface applied; however, the soluble P in leachate far exceeds the critical
value because of limited contact between soluble P and Al-WTR amendment.
Mixing various amounts of A and E horizons improved Al-WTR efficiency,
probably due to dilution of soluble organics from manure in the A horizon that can block
P sorption sites on Al-WTR. Increased Al-WTR rates can largely overcome soluble
organics impacts and negate the need for massive soil horizon mixing. Al-WTR can be
an effective soil amendment to reduce P loss from manure-impacted soil when the Al-
WTR is made to contact soluble P in the soil profile. Soluble P not in direct contact with
the Al-WTR is unaffected by Al-WTR and is subject to leaching loss.
xii
CHAPTER 1 INTRODUCTION
Phosphorus pollution has attracted attention in recent times due to continuing
trends of rising P levels in manure-amended soils, which far exceed P removal by plants.
This rise in P leads to incidental loss to water bodies, resulting in eutrophication and
water quality degradation. Phosphorus losses are common concerns in pasture schemes
subjected to fertilizer or manure applications. Several soils in Florida have low P
retention capacities, which allow significant P leaching (O’Connor et al., 2001).
Various management practices have been suggested to reduce potential P losses
and subsequent impacts on water bodies. One such practice involves the use of soil
amendments to improve soil retention of P and to reduce P solubility in soils. Successful
soil amendments include industrial by-products and municipal wastes that contain metals
(e.g., Fe, Ca, Al) for reaction with P. Metal salts (e.g., Al2(SO4) 3, FeCl3) have also been
used to mitigate P solubility and mobility in poultry manure and poultry-amended soils
(Moore and Miller, 1994; Moore et al., 1999).
Water treatment residuals (WTR), by-products of drinking water treatment, have
been shown to be effective in P immobilization (Elliott et al., 2002a). Various types of
residuals are generated in water purification processes; two major types of WTR (Al-
based and Fe-based) are produced in large quantities in Florida and have the potential for
reducing P solubility. Residuals are produced from the process of sedimentation and
flocculation, where the primary coagulant is either Al salts (e.g. alum) or Fe salts (e.g.
ferric chloride); these residuals are known as Al- or Fe- WTR, respectively. A third
1
2
major residual type, calcium-WTR, is produced in water treatment facilities where lime is
used to remove hardness in water, and can be an effective liming agent.
The effectiveness of WTRs in reducing P solubility is usually attributed to a
combination of P sorption and precipitation. O’Connor et al. (2001) reported the benefits
of water treatment residuals (WTRs) in reducing P solubilities in P- impacted soils. The
rendering of P insoluble is either by ligand exchange through the addition of Al oxides or
precipitation reactions. Hydroxides and oxyhydroxides are major sources of P sorption
capacity in soil and form insoluble surface complexes when they react with P from the
solution (Bohn et al., 2001; McBride, 1994). Phosphate is adsorbed onto hydrous metal
oxides through the following ligand exchange reaction:
>M-OH(s) +H+(aq) → >M-OH2+
>M-OH2+(s) +H2PO4
- (aq) → >M-H2PO4-(s) +H2O(l)
M is usually Al or Fe. The covalent bond formed between the hydrous oxide and
phosphate is very stable (Sposito, 1989). Al-WTR was used in this study because
previous work found it more effective in sorbing P than Fe-or Ca-based WTRs; also, the
Al-WTR material is inexpensive and abundant (Lane, 2002; Makris, 2003). Phosphorus
retention by Al-WTR lacks pH dependency in soils over wide range of pH changes
(Moore and Miller, 1994; O’Connor et al., 2001).
Makris (2004) speculated that P retention by WTR could be via surface P
chemisorption, or precipitation of an amorphous Al-P phase. He suggested that most P
sorbs to WTR following intraparticle diffusion in three-dimensional fashion towards the
interior of the WTR particles. Thus, closeness of soluble P proximity to WTR particle

3
could be an important factor in determining the kinetics and extent of P sorption in WTR
amended soils or aquatic media.
Studies on native Immokalee soil (sandy, siliceous, hyperthermic Arenic Alaquods)
showed that P leaching could be reduced by 99 % when the soil was amended with 2.5 %
(by wt.) Al-WTR, regardless of whether the added P source was TSP, biosolids or
manure (O’Connor and Elliott, 2000; Elliott et al., 2002b). Lane (2002), however,
observed a dramatic reduction of Al-WTR sorption capacity when it was applied to a
highly manure impacted Immokalee soil. To fully remove P from the soil solution, an
Al-WTR rate of ≥ 22.5 % (by weight) was required. Walker (2004) also observed that P
sorption by Al-WTR applied to a soil impacted with dairy effluent was low, only about
22 % P was removed with surface applied Al-WTR at 5 % rate. The reduction in Al-
WTR sorbing capacity was attributed to soluble organic carbon (SOC) interference,
which was found to be nine times greater in the manure impacted A horizon than in the
native (unimpacted) soil. A P isotherm in the presence of an organic carbon solution
resulted in a 20 % reduction in sorption capacity of WTR (Lane, 2002).
Spodosols of Florida receiving significant loadings of animal manure are prone to
subsurface leaching or surface runoff (Nair and Graetz, 2002). The A and E horizons of
Spodosols are sandy and have poor P sorption capacities, while the Bh (spodic) and the
Bw horizons have much greater affinities for P. High water tables typically occur
between the Bh and A horizons during the summer rainy season in Florida Spodosols
(Soil Survey Staff, 1996). Thus, rainfall that infiltrates the soil during high water table
conditions can transport P to the shallow water table and may move laterally, transporting
P to surface drainage ditches (Burgoa et al., 1991).
4
The E horizon may also be impacted with P depending on the P loading of the
existing A horizon and the hydrologic conditions (Nair and Graetz, 2002). However, if
the E horizon has little manure impact, mixing the E and A horizons may dilute the
impact of soluble organics associated with the A-horizon and reduce the impairment of
WTR effectiveness.
With this information in mind, a study was designed to determine the effects of
WTR rates and depths of incorporation on soluble P retention in soils prepared by mixing
various amounts of A and E horizons. Impacts of the treatments on soluble P were
determined using sorption isotherms, small column leaching studies, and rainfall
simulations.
Hypotheses
(i) Diluting an impacted A horizon with unimpacted E horizon reduces SOC impacts on WTR sorption capacity and improves WTR effectiveness.
(ii) The depth of amendment incorporation differentially impacts reductions in
soluble P effected by WTR application.
(iii) Suitable rates of WTR can be achieved for various soil mixes that reduce soluble P.
To test these hypotheses, our objectives were:
Objectives
(i) To determine the effect of percent soil mix of A and E horizons on P
immobilization by WTR. (ii) To determine the effect of mixing WTR throughout a soil column vs. mixing
only with soil in top half of the column on P leaching using manure-impacted soils.
(iii) To determine optimal WTR rates appropriate for various percentages soil mix
and depths of incorporation.

5
(iv) To determine the effect of thorough mixing of WTR versus surface application on P runoff in rainfall simulations.
(v) To determine the effect of various rates of WTR on P in leachates and runoff
in rainfall simulations.
CHAPTER 2 LITERATURE REVIEW
Phosphorus (P) is an essential element for all forms of life on earth. It is a
component of adenosine triphosphate (ATP), a high-energy phosphate group that drives
most energy requiring biochemical reactions, deoxyribonucleic acid (DNA), the seat of
genetic inheritance, and ribonucleic acid (RNA), which directs protein synthesis of both
plants and animal. Phosphorus is a macronutrient with typical concentrations in most
plants ranging from 1 to 5 g kg-1 (Brady and Weil, 2002).
Phosphorus is considered as one of the major nutrients limiting the productivity of
terrestrial (upland), wetland, and aquatic ecosystems. Environmental concerns regarding
P center on its stimulation of biological activities of surface waters, or eutrophication,
resulting from nutrient inputs stimulating algal and rooted aquatic plant growth
(Thomann and Mueller, 1987). Although N and C are also required for algal growth,
much of the concern with eutrophication has focused on P. This is because the
difficulties in controlling the air-water exchange of N and C and the fixation of
atmospheric N2 by some blue-green algae often result in P being the nutrient that
promotes accelerated eutrophication (Sharpley et al., 1994).
Phosphorus inputs into ecosystems come from three main sources: rainfall,
fertilizers (inorganic), and organic sources (feeds/manure). Although the amount of P
input from rainfall is not agronomically important compared to fertilizer and manure
inputs, it has been shown to be significant in P cycle of oligotrophic lakes (Sharpley,
1999). For example, rainfall was estimated to account for up to 50 % of P entering Lake
6

7
Superior. About 25-50 % of the total phosphorus (TP) in rainfall was soluble and directly
available to organisms in the lake (Sharpley, 1999).
Organic and inorganic sources account for the bulk of P inputs to soils that can
lead to incidental loss to surface waters resulting in eutrophication. The environmental
impacts of eutrophication on water quality have spurred efforts to develop strategies
(best management practices) to reduce P inputs and, where possible, to reclaim the land,
eutrophic lakes, or ponds. The primary organic sources of P include livestock manures
and biosolids. The P contents and composition of fresh livestock manures vary widely
with the type and age of the animal, the bedding material used, and the composition and
digestibility of the diet, particularly where mineral supplements (di-calcium phosphate)
are used. The typical P concentration in dairy manure is 6 g kg-1, in poultry manure 18 g
kg-1, and swine manure 15 g kg-1 (Pierzynski et al., 2002). Biosolids P contents also vary,
but typically average 20 g kg-1 (USEPA, 1995b).
Most grains used in animal diet such as corn, wheat, or soybean, store as much as
80-90 % of total P in the form of inositol hexaphosphate (phytate) (Turner et al., 2002).
Phytate-bound P is relatively unavailable to animals, especially monogastrics that do not
benefit from the aid of microflora and microfauna of the rumen in the release of P from
phytate. Phytase, an enzyme released by certain micro-organisms (e.g., Aspergillus
niger), has the ability to cleave the P from the phytate molecule (Smith et al., 2004). Due
to poor availability of phytate-bound P to monogastrics, nutritionists have used dicalcium
phosphate (dical), monocalcium phosphate (monocal), de-flourinated phosphate and other
phosphatic minerals to supplement P requirement in feed rations. Use of P supplements
in diets can lead to increased total P in manure, and possibly increase the risk of P runoff

8
from fields fertilized with animal manure. Use of phytase in diets increases the
availability of phytate bound P in grain, and reduces the need for supplemental P, thereby
reducing the total P load in manure. However, some studies suggest that diets containing
phytase may increase the soluble P component of manure, thereby increasing soluble P in
runoff (Delaune and Moore, 2001). Soluble P in manure is the most important factor that
determines the P runoff losses from fields fertilized with animal manures (Delaune et al.,
2001).
The soluble P from manure and biosolids may accumulate in, or be released by,
soils depending on the capacities of the soils to retain P through adsorption and
precipitation reactions. Rhue and Harris (1999) described two P adsorption reactions
mechanisms active in soils; non-specific/ ion exchange and or specific/ligand exchange.
Ion exchange results from electrostatic attraction of phosphate anions to positive reactive
sites of variable-charge surfaces. Ion exchange is rapid and reversible, and typically
accounts for a small fraction of adsorbed P in Florida soils. Ligand exchange occurs
when a phosphate anion replaces a surface hydroxyl coordinated with a metal cation,
usually with reactive surfaces of Al or Fe oxyhydroxides. Ligands in soils and
sediments capable of replacing surface hydroxyls are not restricted to P. Other ligands
such as sulphate, fluoride, silicate and organic acids can be sorbed at the surfaces of Al or
Fe crystals and can exchange with, or compete with, P for sorption sites (Violante and
Gianfreda, 1993; Rhue and Harris, 1999).
Precipitation of a new solid phase is usually initiated when the critical
concentration is greater than equilibrium mineral solubility. However the heterogeneous
nature of soils and sediments makes it difficult to determine the critical concentrations of
9
all constituents needed to form precipitates (Rhue and Harris, 1999). Direct evidence of
contemporary phosphate-mineral precipitation in soils and sediments is rare, even in case
of soil heavily amended with soluble forms of P (Pierzynski et al., 1990; Harris et al.,
1994). However, Harris et al. (1994) reported that the mineral vivianite
[(Fe3(PO4).8H2O)] precipitated in the sediment of a stream receiving run-off from a diary
barn. Vivianite has also been reported in other sediments and soils (Lindsay et al., 1989;
Froelich, 1988). The precipitation reaction process can be slow and require years to
attain equilibrium, and can be strongly affected by pH. Under alkaline conditions, Ca2+
generally controls P solubility and orthophosphate readily forms less soluble di and
tricalcium phosphates. Under acid conditions, Al3+ and Fe3+ control P solubility and
orthophosphate readily precipitates as highly insoluble Al3+ or Fe3 phosphate compounds.
Generally, aluminum and iron oxides in soils are amorphous, although crystalline
solids can exist. The sorbing properties of Al-and Fe- amorphous oxides are used to
remove organic matter, P, and other constituents during municipal wastewater treatment.
The amorphous oxides flocculate and settle out of suspension during treatment and
contribute to biosolids production. Similarly, in the process of treating raw water
supplies for portable use, Al-and Fe amorphous oxides are used to remove color,
turbidity, and chemical contaminants during drinking water treatment. Water treatment
plants normally generate large deposits of residual called water treatment residuals
(WTRs). The WTR produced from the process of sedimentation and flocculation,
depends on the metal salts used. When the primary coagulant is Al salts (e.g. alum), Fe
salts (e.g. ferric chloride), or calcium salts (e.g. CaCO3), the residuals are referred to as
Al-WTR, Fe-WTR and Ca-WTR, respectively.
10
WTRs are predominantly amorphous and made up of Al, Fe oxides and calcium
carbonate, carbon, polymers, sand, silt, and clay particles. Ions of Al and Fe bind
strongly to hydroxides, inorganic ions, phosphates and organic compounds in water
resulting in insoluble compounds (Elliott et al, 1990; Knocke and Walkeland, 1983).
The small size to high surface area ratio of the amorphous Al, Fe solids in WTRs makes
them reactive to oxyanions, and Al-and Fe-WTRs have been shown to be effective in P
immobilization (Elliott et al, 2002a). The potential for, and the effectiveness of, WTRs
in P reducing soluble P concentrations is usually attributed to a combination of P sorption
and precipitation. Basta et al. (1999) found alum-based WTR reduced P and NH+4
concentration by 75 % in surface runoff water from agricultural land treated with poultry
manure. O’Connor et al. (2001) reported on the benefits of water treatment residuals
(WTRs) in reducing P solubilities and leaching in manure amended soils. Brown and
Sartain (2000) showed that 2.5 % (by weight) Fe-WTR application rate significantly
reduced P leaching in a simulated golf course setting.
Haustein et al. (2000) compared Al-rich water treatment residual and HiClay
Alumina (HCA-a by-product of commercial alum production) for decreasing P in run-off
from fields excessively high in soil test P. The Al-WTR had a P adsorption capacity 20
times greater than HCA, and increased the total recoverable Al in soil whereas HCA had
no effect. Differences between the two materials were attributed to the greater Al content
(159 vs. 46.7 g kg-1) and greater P adsorption capacity (1750 vs. 86 mmol kg-1) of the
WTR compared to the HCA.
Hyde and Morris (2000) incubated up to 60 g kg-1 (120 Mg ha-1) dry solids (d.s)
of three different dewatered (raw, dry, and frozen Al- and Fe-WTRs) with two soils

11
having above-optimum Mehlich-3P concentrations at 26 oC for 21 days and observed
significant average reductions in Mehlich-3P values in soils with raw, dry, and frozen Al-
and Fe-WTRs. They concluded that dewatering significantly impacted the ability of
WTR to decrease Mehlich-3P soil concentrations. Similarly, Peters and Basta (1996)
incubated 30 and 100 g kg-1 (60 and 200 Mg ha-1) d.s of two WTRs (HS1 and HS2),
cement kiln dust (CKD) and treated bauxite red mud (RM) with a slightly acid soil
having 533 mg Mehlich-3P kg-1 soil and a calcareous soil having 296 mg Mehlich-3P kg-
1 soil at 25 oC for 9 weeks. Reductions in Mehlich-3P ranged from 533 to 250 mg P kg-1
and followed the trend HS2 = CKD ≥ HS1 ≥ RM for the acid soil, and ranged from 296
to 110 mg Mehlich-3P kg-1 soil and followed the trend HS2 > HS1 > RM > CKD for the
calcareous soil. The treatments caused no serious pH, soluble soil Al, or soil salinity
problems.
Codling et al. (2000) reported that incorporating Al-WTR or Fe-rich residue
substantially reduced the water-soluble P and the Bray and Kurtz no.1-extractable P
concentrations in poultry litter and long-term litter amended soils. The results suggest
that the residues could be useful for reducing P runoff and leaching from poultry litter
and litter amended fields.
Elliott et al. (2002b) compared the ability of water treatment residuals, [aluminum sulfate
(Al-WTR) ferric sulfate (Fe-WTR), and a lime softening residual (Ca-WTR] to alter P
solubility and leaching in low P-sorbing, Immokalee sandy soil amended with dewatered
biosolids and triple superphosphate (TSP) fertilizer. In the absence of WTRs, 21 % of
TSP total P and 11 % of biosolids total P leached from laboratory columns over 4
months. When WTRs were co-applied with the P sources, the losses from TSP treated
12
columns were reduced to 3.5 % (Fe-WTR), 2.5 % (Ca-WTR) and < 1 % (Al-WTR) of
applied P. For the biosolids treatments, all WTRs retarded downward P flux such that
leachate P was not statistically different than for the control (soil only) columns. It was
suggested that oxalate extraction be used to obtain an index of the P-fixing capacity of Al
and Fe amorphous oxides in WTRs and potentially releasable P in biosolids using the
Phosphorus Saturation Index. Conceptually, {PSI = Pox / (Alox + Feox)} is the molar ratio
of total sorbed P to the Al and Fe components capable of P fixation.
PSI < 1 indicates excess P adsorption sites in materials and little soluble P available for
leaching, whereas PSI > 1 indicates excess soluble P and a potential leaching problem.
However, the PSI applies only to materials in which Al- and Fe amorphous oxides
determine the P fixing capacity, and the index is most useful for systems in which the
characteristics of the amendment dominate P chemistry.
Ippolito et al. (1999) conducted a greenhouse study to investigate the efficacy of
co-application of Al-WTR and biosolids to two native shortgrass species (blue gama
(Triodanis Perfoliata) and western wheatgrass (Agropyron smithii (Rydb)). Results with
blue gama indicated a positive linear relationship between increasing WTR rate and yield
and a negative relationship between increasing WTR rate and shoot P and Al
concentrations (P < 0.10). With western wheatgrass, there was a negative quadratic
relationship between increasing WTR rate and shoot Al concentration (P < 0.10). No P
deficiency symptoms were observed. All soluble biosolids P was adsorbed when WTR
and biosolids were mixed at 8:1 mass ratio and it was suggested that higher ratios of these
materials might induce P deficiency.

13
Basta et al. (2000) evaluated three Al-WTRs as soil substitutes and the ability of
soil tests to predict P adequacy for bermudagrass. Soil tests indicated P deficiency for
two of the WTRs and a control soil. Phosphorus concentrations in grasses grown on the
unfertilized WTRs and soil were below adequate levels. Phosphorus fertilization (50,
100 and 200 mg P kg-1) increased bermudagrass yields and tissue P concentrations for the
soil, but not for the WTRs. Water-soluble P and Olsen P provided information on the
ability of WTRs to support growth, but not on P adequacy. The Mehlich-3P soil test
overestimated plant availability of P in WTRs due to the dissolution of P adsorbed by
amorphous Al. Water extracts were the best predictor of P adequacy in WTR and were
recommended for determining P fertilizer additions to these materials.
Cox et al. (1997) conducted a greenhouse study to determine Al-WTR effects on
inorganic forms of P and availability to wheat (Triticum aestivum L.) in a thermic Aquic
Hapludults soil. Surface applied Al-WTR had little effect on P availability to wheat, but
incorporation into the entire soil decreased P availability. Reduced availability resulted
from a decrease in “loosely bound” P due to retention on Al compounds in the WTR. Of
the inorganic P fractions studied, loosely bound (1 M NH4Cl-extractable) P was the best
predictor of P availability in Al-WTR amended soil, but Mehlich-1 P was also a good
indicator. Thus, the fertilizer P requirement is greater on alum sludge amended soil than
on unamended soil, but traditional soil testing methods (Mehlich-1 P) can be used to
determine it.
Lake water concentrations of P above 0.03 mg L-1 generally accelerate
eutrophication (Pierzynski et al., 2000). This value is an order of magnitude lower than P
concentrations in soil solution critical for plant growth 0.2 to 0.3 mg kg-1 (Sharpley et al.,
14
2002), emphasizing the disparity between critical lake and soil P concentrations and the
importance of controlling P losses to limit eutrophication. Concern over eutrophication
has led to the establishment of National Phosphorus Research Project (NPRP) to assess
the effects of soil properties, particularly soil test P levels and management, on P loss in
overland flow (Sharpley et al., 2002). Agricultural runoff encompasses two processes
that occur in the field: surface runoff and subsurface flow. The loss of P in agricultural
runoff occurs in sediment-bound and dissolved forms. Sediment P includes P associated
with soil particles and organic materials eroded during flow events, whereas surface
runoff generally is dominated by dissolved P. The dissolved P occurs when rainfall or
irrigation water interacts with a thin layer of the soil surface and plant materials before
leaving the field as surface runoff (Sharpley, 1985). Most dissolved P is immediately
available for biological uptake. Sediment P is not readily available, but can be a long-
term source of P for aquatic biota (Ekholm, 1994).
Dayton et al. (2003) used various Al-based treatment residuals to reduce
phosphorus in agricultural runoff. Runoff P was reduced up to 58 %, and there was a
linear relationship (P < 0.05) between runoff reduction and acid ammonium oxalate
extractable Al (Alox). However, the various rates of WTR needed to produce the desired
minimum level of P in runoff were not shown.
The benefits of WTR have been reported in regards to reducing P solubility. However,
rates of WTR require to control P solubility in highly manure-impacted soils need to be
clarified. Also, the method (and depth) of WTR application needs further study.
Furthermore, the effects of WTR on runoff and leachate P need documentation, so that

15
results obtained in controlled studies can be extrapolated to field conditions in reducing P
from polluted sites.

CHAPTER 3 MATERIALS AND METHODS
Soil and WTR Used
The primary soil used in all studies was a P-impacted Immokalee (sandy,
siliceous, hyperthermic Arenic Alaquods). Samples representing the A-horizon were
collected from the Dry Lakes Dairy in Okeechobee, FL. Samples of the native
(unimpacted) Immokalee soil were also obtained IFAS Research and Education Center,
located in Immokalee, Fl. The unimpacted Immokalee was included to allow
comparisons between natural, low P soil systems and soil heavily impacted by years of
manure additions. Samples of an uncontaminated E-horizon were also used, and were
obtained from E2 horizon of Myakka sand (sandy, siliceous, hyperthermic Aeric
Alaquods). The dry E-horizon soil has a whitish appearance (little evidence of organic
material), and was selected based on its negligible P retention capacity (O’Connor et al.,
2004). Soils were digested following USEPA method 3050A (USEPA, 1995), which
entails ashing (550 oC), a hot plate digestion with a strong acid (6M HCl), filtering
(Whatman 41), and bringing to final volume 50 mL. Digests were analyzed for total P,
Fe, Al, Ca, and Mg by inductively coupled plasma atomic emission spectroscopy (ICP).
An Accumet(R), Basic, AB15 pH Meter (Fisher Scientific) was used for soil pH on 1:2
soil solution suspension (Hanlon et al., 1997).
Sequential extraction procedures allow soil P to be separated and characterized as
P into different forms. A modified sequential fractionation scheme of Chang et al. (1984)
was adopted to distinguish between the various inorganic and organic P pools in the soil.
16
17
Approximately 1.5 g of (≤ 2 mm sieved) soil was weighed into a pre-weighed 50 ml
centrifuge tube. To each tube, 30 mL of 1M KCl was added and shaken for 2 hr for
soluble P extraction. The tubes were then centrifuged (Eppendorf, centrifuge 5810R) at
3040 X g for 15 min. The supernatant was vacuum filtered (0.45µm) into 20 mL
scintillation vials and stored at 4-7 oC until analysis for inorganic Pi using the
colorimetric method of Riley and Murphy (1962). Phosphorus extracted by KCl is
operationally defined as soluble P, and is regarded as readily labile P (plant available and
leacheable).
The second extraction step involved shaking the residual from step 1 with 30 mL
of 0.1M NaOH at 250 rpm for 17 hr to extract Fe and Al bound P. The suspensions were
centrifuged and filtered as described above. The solution was usually darkly colored;
hence, an aliquot of the solution was acidified with one drop of concentrated H2SO4 per
mL of supernatant to precipitate soluble organics. The solution was then centrifuged at
3040 X g for 10 min before analysis (NaOH Pi). The original NaOH supernatant was
digested with a sulfuric acid and potassium persulfate (USAEPA, 1993) for determination
of Fe- and Al- associated total P (NaOH TP). Organic P sorbed by Fe- and Al (NaOH Po)
was estimated by the difference between NaOH Pi and NaOH TP values.
The final step in the extraction sequence was a 24-h reaction with 0.5 M HCl
(1:20 solid: solution) to extract Ca- and Mg-bound P. The suspension was centrifuged
and filtered as above and P analysed for Ca- and Mg-bound P. Ca- and Mg P forms are
typically minor constituents in soils, but are significant in manure-amended soils (Nair et
al., 1995). The sum of P in the three extractants is generally considered as total inorganic
P in a material (O’Connor et al., 2002). The unextracted P (residual P) is usually

18
considered to be recalcitrant organic P. In most cases, this quantity is negligible and was
not quantified here. The sum of all fractions (Seq. Sum) approximates total P, but in this
case minus the residual P.
Total P was determined by the ignition (ashing) method (Anderson, 1976). Soils
(0.5 g oven-dry equivalent) were ground and passed through ≤ 2 mm sieve, and were
ashed in a muffle furnace. The temperature was set to 250 oC and maintained for 30 min
before increasing the temperature 550 oC for 4 hr. The cooled ash was moisten with
sufficient distilled dionized water (DDI), to just wet the ash, and 20 mL of 6.0 M HCl
added to the beakers. The ash suspensions were placed on a hot plate and digested at 120
oC until dry, and then allowed to cool. The sample was then moisten with 2-3 mL DDI
and with 2.25 mL of 6.0 M HCl, and returned to the hot plate to bring the sample to near
boiling. Digested samples were quantitatively transferred and filtered with Whatman #
41 paper into 50 mL volumetric flasks. The filter paper was also rinsed 3 times with
DDI water to into 50 mL volumetric flasks, and the volume brought to 50 mL. The
contents were then mixed well and sufficient sample was stored in 20 mL scintillation
vials at room temperature until TP analysis was determined using Murphy and Riley
(1962) method.
The Al-WTR came from the Hillsborough, Florida drinking water treatment
plants as a residual waste of water purification. The WTR was analyzed for total P, Fe,
Al, Ca, and Mg by inductively coupled plasma atomic emission spectroscopy (ICP)
following EPA method 3050A (USEPA, 1993). Total C and N were determined by
combustion at 1010oC using a Carlo Erba (Milan, Italy) NA-1500 CNS analyzer.
Organic matter content was determined by loss on ignition, oxalate-extractable P (Pox), Fe

19
(Feox), and Al (Al ox) by McKeague et al. (1971) method and pH (1:2 solid to solution)
and percent solids by standard methods (Page, 1982).
Single Point Adsorption Determinations
The objectives of this study were: (i) To determine optimal WTR rates for P
retention for various percent soil mixes of A and E horizon soils and (ii) To determine P
sorption (using a single point P load) in soils representing various percent soil mixes.
Various WTR rates of 0, 1, 2.5, 5.0, and 10 % by weight were chosen based on previous
sorption data (O’Connor and Elliott, 2000). Percent soil mixes of 100%A-0%E, 75%A-
25%E, 60%A-40%E, 50%A-50%E, and 33%A-67%E were used. These combinations of
soil mixes were selected to reflect possible soil mixing scenarios in the field. Thus, the
50%A-50%E mix represent mixing the 15 cm of A horizon with an equal depth of E
horizon. The experiment contained 75 samples (5 Soil mix, 5 WTR rates, and 3
replicates).
Standard equations are typically used to describe the relationship between
adsorbed and solution P concentration; they are referred to as the Langmuir and
Freundlich equations. However, work done by Harris et al., (1996) on sandy soils of
Florida showed that a single point adsorption determination at 400 µg P g-1 load is
equally useful identifying the P sorption maximum of sandy Fl soils and is less laborious
than the traditional isotherm studies. Phosphorus retention was determined using 2 g
each of the various percent soil mixes and 20 mL of 0.01M KCl as background
electrolyte (1:10 soil to solution ratio). Two sets of experiments were conducted, using
different initial added P concentrations. The total number of samples was 150 i.e. 2[5
WTR rates x 5 Soil mixes (x) 3 Replicates]. In the first experiment, the initial added P
20
concentration was 0 µg P mL-1, and in the second experiment, the initial P concentration
was 10 mL of 40 µg P mL-1 (400 µg P g-1 soil load).
The sorption study was conducted at room temperature (23 ± 2 oC) with 0.01M
KCl as background electrolyte to mimic soil solution composition and to control ionic
strength. The suspensions were equilibrated, by shaking in a gyrotory shaker at 250 rpm
for 4 d (96 h). Following shaking, the solution was separated from the soil by
centrifugation (3040 X g for 15 min), vacuum filtered (0.45 µm membrane filter), and
analyzed for pH, EC and soluble reactive P. Soluble reactive P was determined with
Murphy and Riley (1962) method. The difference between P mass originally present and
that remaining in solution after shaking was assumed to have been sorbed.
Repeated water extraction was determined by using 2 g of soil and 20 mL of DDI.
Following shaking for one hour, the solution was separated from the soil by
centrifugation (3040 X g for 15 min), vacuum filtered (0.45 µm membrane filter), and
analyzed for soluble reactive P. The extraction procedure was repeated 16 times and with
subsequent analysis of P.
Quality assurance and quality control (QA/QC) protocol were followed, including
the use of 5 % repeats and 5 % spikes and blanks for each procedure. Standard calibration
curves, as well as quality control check standards, were prepared for each procedure.
Repeats were within 10 % relative standard deviation. In situation where samples
standard deviation falls outside 10 % range, repeats were conducted to cross check any
anomaly. In these reported experiments, < 5 % of total samples had to be re-run. Spike
recovery varied with procedure, but all fell within acceptable levels (95-110 %). Outside
quality control checks achieved recoveries within (98-110 %).
21
Calculation:
Phosphate retained by soils was calculated as follows:
[(Co )-(Ceq) V ]/M = X/m (Eq. 1-1)
Where
Co = concentration of P added, ug/ml
V = volume of liquid, mL
Ceq = concentration of P in solution after 96 h equilibration, ug/mL
M = mass of soil mix (oven dry equivalent), g
X/m = P sorbed by solid phase, ug/g
Equation (Eq. 1-1) was used to calculate P adsorbed or released (desorbed) in relation to
initial P added to the soil mix.
Soil Column Leaching Study
Columns were made with PVC pipe (5 cm inner diameter x 17 cm height). Each
column was equipped with a 2 cm drainage hole at the bottom. The bottom had end caps
drilled and screwed to accept 13 mm X 102 mm male-to-male adapters, as drainage
pipes. Screens of fiber garden mulch were glued over the holes with silicon caulk to
prevent soil loss. The columns were supported on a wooden rack by two 28 cm cable
ties per column.
Selected treatments from the laboratory equilibration study were used in the
column leaching study. Soil mixes selected for further study were: 100%A-0%E, 50%A-
50%E, and 33%A-67%E. Each soil mix was treated with four rates of WTR (0, 2.5, 5.0,
and 10 % by wt.) and two methods of WTR incorporation. Thus, each WTR rate was
either thoroughly mixed with the entire soil mass (whole column length) or with soil
22
representing the top half (7.5 cm) of soil depth. Three 100%E (no WTR) columns were
also included to serve as controls representing a total of 75 columns. [3 soil mixes x 4
WTR rates x 2 methods of incorporation x 3 replicates + 3 controls].
A known weight (330 or 165 g) of each soil mix was weighed into a labeled
polythene bag (Ziploc Brand) with dimensions of (26.4 cm X 29.7 cm). The soil mix and
added WTR were thoroughly mixed by hand to promote uniform distribution. Water was
added to bring the mixture to gravimetric moisture content of 10 % (g/g), which
approximates field capacity of the soils. The treatments in the bags were incubated for
7d at room temperature. Each morning, the bags were kneaded and opened for about 15
min to minimize the development of anaerobic conditions. After incubation, about 20 g
of the respective replicates of each soil was archived for analysis and represented the
initial (“time zero”) state of the soil. The remaining soil was weighed into the small
columns for leaching study. Columns were saturated with water and allowed to drain and
weighed. The estimated pore volume for 100%A-0%E soil mix was 107 mL, 50%A-
50%E was 107 mL, and 33%A-67%E was 96 mL. An average pore-volume of 100 mL
(± 5) was assumed for all treatments. The columns were irrigated weekly with tap water.
The tap water has a pH of 8.25, whereas rainfall in Florida is usually acidic, with
a pH around 5. Hence, the tap water was acidified to mimic the natural system pertaining
to the region where the soil was collected (Lane, 2002). A thin transparent plastic wrap
was used to lightly cover the wetted columns between irrigations to reduce evaporation of
water from the soils and to maintain field capacity.
One-half pore volume (50 ml) was used to leach the soil in the columns each of
the first two weeks. Subsequent weekly irrigations were equivalent to one pore volume.
23
Collected leachates volumes were recorded and leachates analysed for pH, soluble
reactive P, total dissolved P and total P.
Soluble reactive phosphorus (SRP), generally considered to be inorganic
orthophosphate, was determined colorimetrically on 0.45 µm filtrates. Total P (TP) was
determined on unfiltered samples following sulphuric acid/acid persulphate digest
(USEPA 356.1, 1993). Persulphate digest of the filtered leachate yields total dissolved
phosphorus (TDP) i.e. digesting any organic P in the < 0.45 µm for analysis of
orthophosphate colorimetrically.
Early results (data not shown) revealed only minor differences in P concentrations
as SRP, TDP, and TP in the initial leachates from the column; thus, the independent TDP
and TP determinations were discontinued after six weeks of leaching. For simplicity,
only the concentrations of P in the filtered undigested samples (SRP) are presented.
Rainfall Simulation
Rainfall simulation studies were conducted in accordance with a slight
modification of the procedure prescribed by the National Phosphorus Research Project
(NPRP, 2001). The national project was implemented in response to concerns over non-
point P losses, with a primary objective of coordinating environmental P research to
quantify soil P –runoff P relationships. To achieve this, rainfall-runoff simulations are
being conducted, using runoff boxes, at various locations across USA. The NPRP (2001)
specifies dimensions of runoff boxes (1 m, long, 20 cm wide, and 7.5 cm deep), rainfall
intensity of (7.1 cm h-1), equivalent to a 10 yr, 24-h rain, applied from a height of 3 m
above the soil surface), and soil packing and surface slope (3 degrees).
24
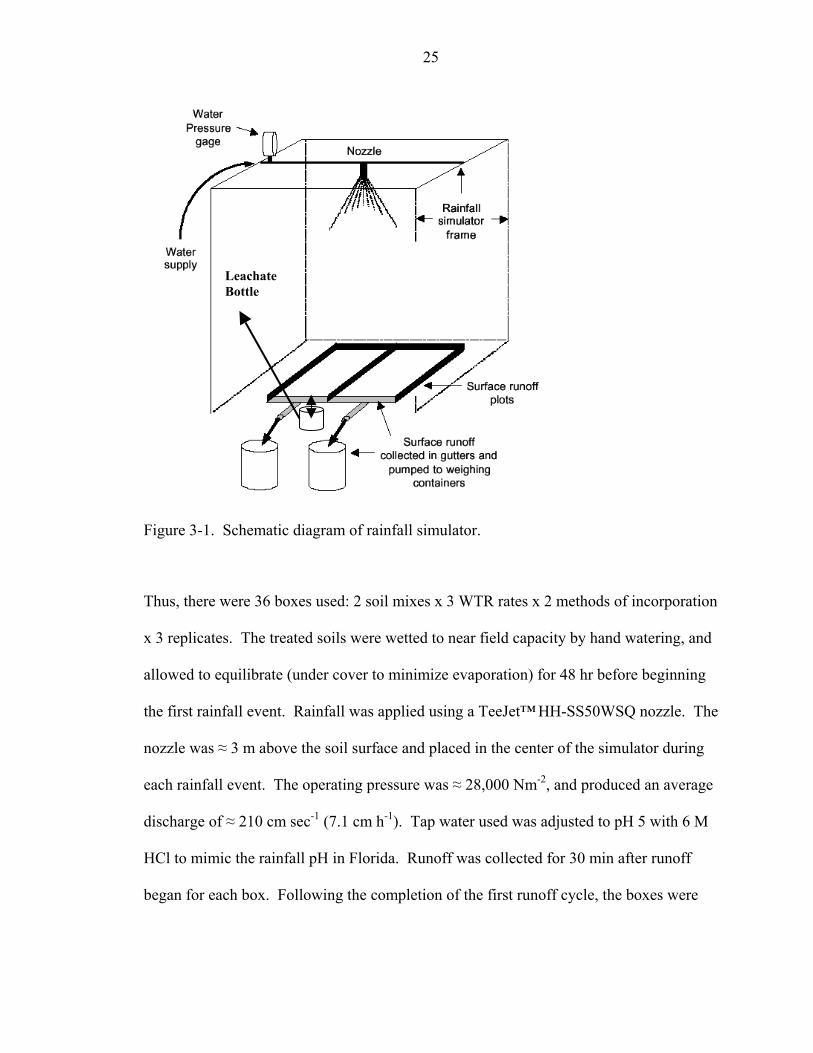
The rainfall simulator (Fig. 3-1) was based on design of Miller (1987). The runoff
box design used here was modified slightly to quantify leaching of P in addition to runoff
P by adding a second box under the first in a double-decker design. This design allowed
collection of runoff and leachate simultaneously. Based on results from the column
leaching study, treatments were selected for evaluation in the rainfall simulation, and
included soil mixes of 100 %A-0%E, and 50 %A-50 %E. The Al-WTR rates used were
0, 2.5, and 5.0 %. Al-WTR amendments were either thoroughly mixed with the soils
prior to adding to the boxes, or surface applied to soils already in the boxes. Air dried
samples of mixed soils of 100 %A-0 %E and for 50 %A-50 %E were added to fill the
box. For 100 %A-0 %E soil mix, 1.2 kg soil was used, and 50 %A-50 %E soil mix, 1.4
kg soil was added to the boxes, tapped to produce a depth of 5 cm and bulk density of ≈
1.4 g cm-3 to mimic filed conditions.
25
Leachate Bottle
Figure 3-1. Schematic diagram of rainfall simulator.
Thus, there were 36 boxes used: 2 soil mixes x 3 WTR rates x 2 methods of incorporation
x 3 replicates. The treated soils were wetted to near field capacity by hand watering, and
allowed to equilibrate (under cover to minimize evaporation) for 48 hr before beginning
the first rainfall event. Rainfall was applied using a TeeJet™ HH-SS50WSQ nozzle. The
nozzle was ≈ 3 m above the soil surface and placed in the center of the simulator during
each rainfall event. The operating pressure was ≈ 28,000 Nm-2, and produced an average
discharge of ≈ 210 cm sec-1 (7.1 cm h-1). Tap water used was adjusted to pH 5 with 6 M
HCl to mimic the rainfall pH in Florida. Runoff was collected for 30 min after runoff
began for each box. Following the completion of the first runoff cycle, the boxes were

26
stored on racks and covered with plastic for one week before the second cycle began.
The same procedure was followed for a third rainfall event.
The total runoff volume from each box was collected and weighed. An ~ 1L sub-
sample was collected under constant mixing to promote uniformity of the sample for
subsequent analysis. A second sub-sample of the runoff was filtered (0.45 µm) on site,
using a vacuum pump to obtain ~100 mL aliquot for analysis. The leachate sample was
thoroughly mixed and sub-sampled (250 mL) for later analysis. All samples were
refrigerated until P analyses were performed, usually, the next day. Filtered runoff
samples were analysed for pH, soluble reactive P (SRP), and total dissolved P (TDP)
(Eaton et al., 1995). Analyses performed on the sediment-laden runoff samples included
pH, soluble reactive P (SRP), total dissolved P (TDP), and total P (TP). Soluble reactive
P, TP, TDP, and pH, was also measured on the leachate samples. All P analyses were
conducted using the ascorbic acid method (Murphy and Riley, 1962). Total dissolved P
and TP were determined following a sulphuric acid/persulphate digest (USEPA, 1993) on
filtered and unfiltered samples respectively.
Statistical Analysis
All data were subjected to analysis using SAS statistical analysis procedures
(SAS, Institute, Version 9.1, 2003). Significant differences among treatment means were
analysed for soil mix and WTR rate at initial P concentrations = 0 µg ml-1, and initial P
concentration = 40 µg ml-1 by Least Significant Difference (LSD) method at the 0.05
probability level. Repeated measures analysis of variance and time series analyses by
Tukey’s (HSD) test were performed on the column leaching samples, and analysis of
variance was conducted on rainfall data.

CHAPTER 4 RESULTS AND DISCUSSION
Soil and WTR Characterization
The selected properties of the soils used are presented in Table 4-1.
Table 4-1. Selected properties of the soils used Parameters/ Units
P-impacted Immokalee
Unimpacted Immokalee §Myakka (E2)
pH DOC (mg kg-1)
7.69 79.2
5.55 ND
5.06 1.60
TC (%)* 5 0.65 ND Oxalate-P (mg kg-1) * 1160 12 3.7 Oxalate-Fe (mg kg-1) * 468 85 10.1 Oxalate-Al (mg kg-1) * 110 40 12.5 RPA‡ ND 5.3 3.2 Total P (mg kg-1) 1380 18.8 5.6 KCl-P (mg kg-1) 240 1.9 1.8 NaOH-P (mg kg-1) 275 3.3 1.2 HCl-P (mg kg-1) 660 0.9 0.6 Seq. Sum (mg kg-1) 1175 6.1 3.6 §= Data from O’Connor et al., 2004 *= Data from Lane, 2002 ‡= Relative phosphorus adsorption (% of 400 mg P kg-1 soil load sorbed). (Harris et al., 1996). ND = Not determined.
The unimpacted (nature) Immokalee and Myakka soils were low in total C, but
the impacted Immokalee total C content was much greater, reflecting the years of manure
additions. The pH of the soils varied from about 5.0 to 7.69. The lowest pH values were
observed for 100 %E horizon, since the E horizon is mainly sand with virtually no
organic matter and lacks the basic cations to buffer pH at higher values. The greater soil
27
28
pH of A impacted Immokalee horizon likely reflects the presence of basic cations sorbed
to the clay and organic matter present furnished by manure addition. This observation
was supported by the sequential extraction data, revealing significant amounts of Ca-Mg
associated P (about 53 % of total P). Graetz and Nair (1995) observed that dairy
manure, containing alkaline salts of Ca and Mg, results in higher soil pH values as in the
P-impacted Immokalee A horizon. The P impacted soil also contained significantly
more total C and P (various forms) than the native Immokalee reflecting years of manure
application to the impacted soil. The single point adsorption determination (Harris et al.,
1996) showed that the Myakka (E2) sand had relative P adsorption of 3.2 % (RPA =
fraction of 400 ug P g-1 soil load sorbed). The low RPA suggested that the E2 would
adsorb minimal P during the column leaching and rainfall simulation studies. The P
impacted Immokalee soil contains more ox-extractable Fe and Al than the native soil,
which is reflected in greater oxalate P extracted. Sequential extractions in the impacted-
Immokalee reveals > 53 % of the P is Ca-Mg associated, ≈ 28 % P associated with Fe-Al,
and ≈ 19 % labile P. The sum of these sequentially extracted P forms is usually taken to
approximate total inorganic P, and averaged ~ 85 % of the total P in these soils.
Dissolved organic carbon was determined following USEPA method 9060 using (TOC
analyzer Shimadzu, 5000 (USEPA, 1986) for the impacted Immokalee and Myakka soils.
The Al-WTR in (Table 4-2) is acidic (pH = 5.3) and is dominated by Al (total Al
= 89 g kg-1), of which about 80 % is amorphous (oxalate-extractable).
29
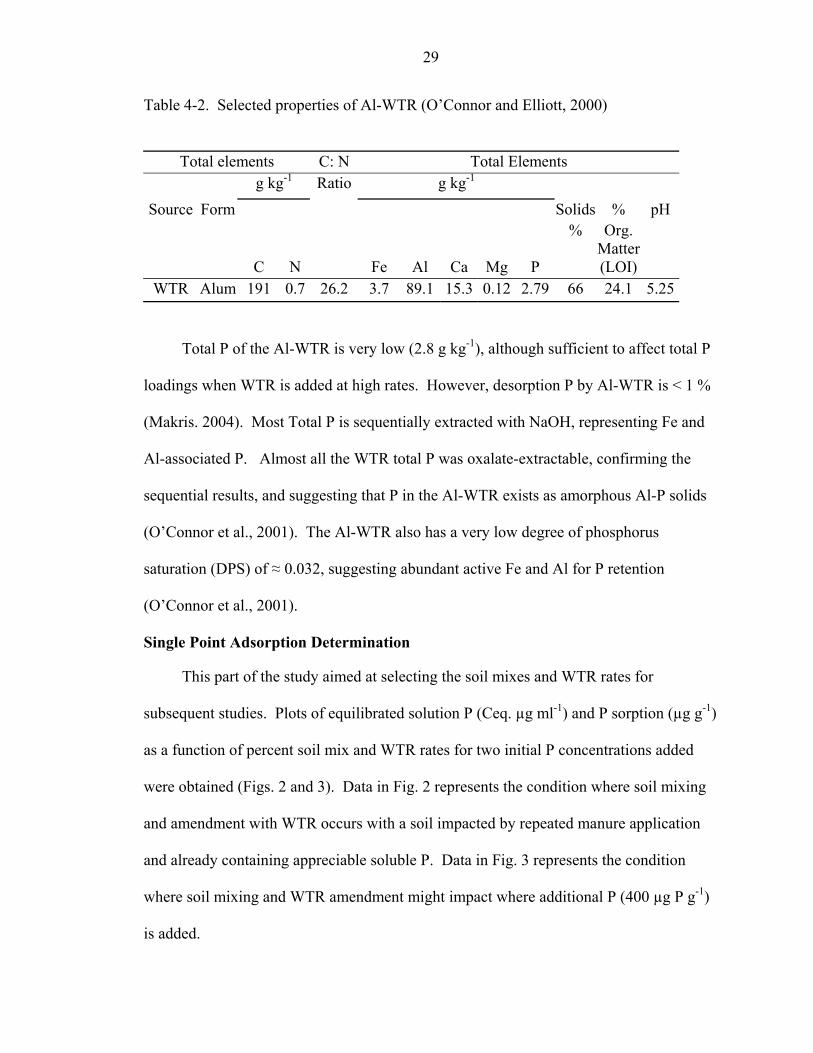
Table 4-2. Selected properties of Al-WTR (O’Connor and Elliott, 2000)
Total elements C: N Total Elements g kg-1 Ratio g kg-1
Source Form Solids % pH
% Org.
Matter
C N Fe Al Ca Mg P (LOI) WTR Alum 191 0.7 26.2 3.7 89.1 15.3 0.12 2.79 66 24.1 5.25
Total P of the Al-WTR is very low (2.8 g kg-1), although sufficient to affect total P
loadings when WTR is added at high rates. However, desorption P by Al-WTR is < 1 %
(Makris. 2004). Most Total P is sequentially extracted with NaOH, representing Fe and
Al-associated P. Almost all the WTR total P was oxalate-extractable, confirming the
sequential results, and suggesting that P in the Al-WTR exists as amorphous Al-P solids
(O’Connor et al., 2001). The Al-WTR also has a very low degree of phosphorus
saturation (DPS) of ≈ 0.032, suggesting abundant active Fe and Al for P retention
(O’Connor et al., 2001).
Single Point Adsorption Determination
This part of the study aimed at selecting the soil mixes and WTR rates for
subsequent studies. Plots of equilibrated solution P (Ceq. µg ml-1) and P sorption (µg g-1)
as a function of percent soil mix and WTR rates for two initial P concentrations added
were obtained (Figs. 2 and 3). Data in Fig. 2 represents the condition where soil mixing
and amendment with WTR occurs with a soil impacted by repeated manure application
and already containing appreciable soluble P. Data in Fig. 3 represents the condition
where soil mixing and WTR amendment might impact where additional P (400 µg P g-1)
is added.
30
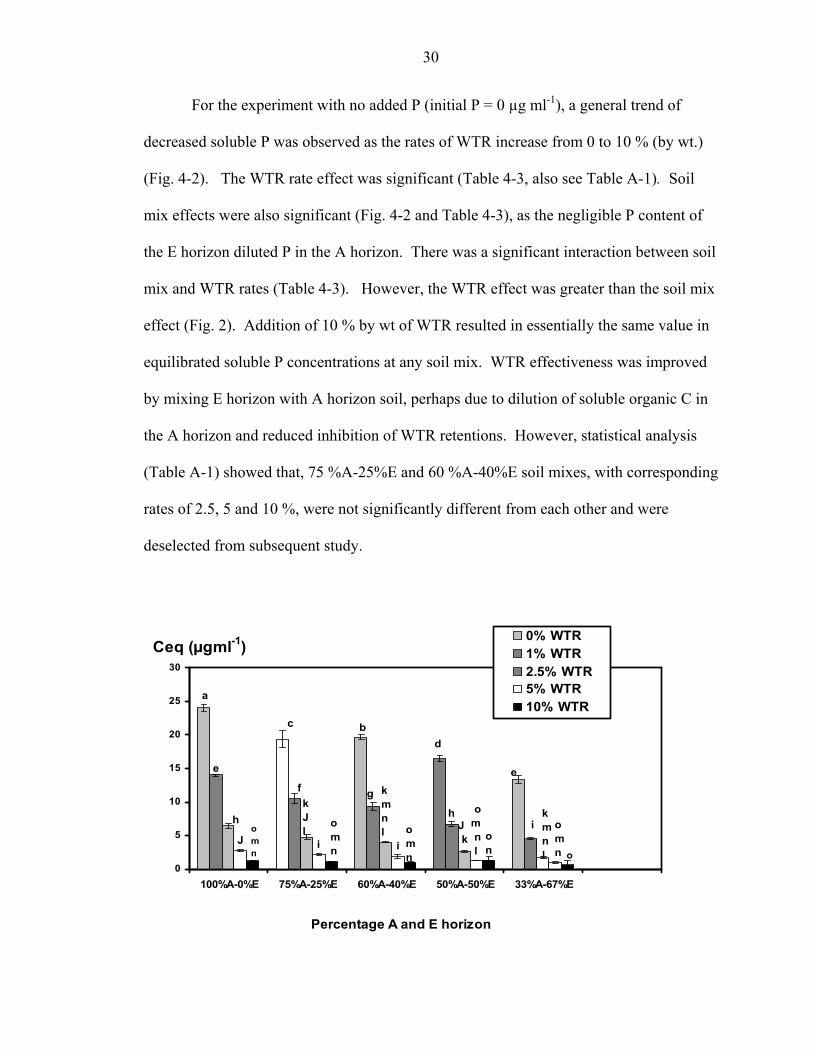
For the experiment with no added P (initial P = 0 µg ml-1), a general trend of
decreased soluble P was observed as the rates of WTR increase from 0 to 10 % (by wt.)
(Fig. 4-2). The WTR rate effect was significant (Table 4-3, also see Table A-1). Soil
mix effects were also significant (Fig. 4-2 and Table 4-3), as the negligible P content of
the E horizon diluted P in the A horizon. There was a significant interaction between soil
mix and WTR rates (Table 4-3). However, the WTR effect was greater than the soil mix
effect (Fig. 2). Addition of 10 % by wt of WTR resulted in essentially the same value in
equilibrated soluble P concentrations at any soil mix. WTR effectiveness was improved
by mixing E horizon with A horizon soil, perhaps due to dilution of soluble organic C in
the A horizon and reduced inhibition of WTR retentions. However, statistical analysis
(Table A-1) showed that, 75 %A-25%E and 60 %A-40%E soil mixes, with corresponding
rates of 2.5, 5 and 10 %, were not significantly different from each other and were
deselected from subsequent study.
0
5
10
15
20
25
30
100%A-0%E 75%A-25%E 60%A-40%E 50%A-50%E 33%A-67%E
Percentage A and E horizon
Ceq (µgml-1)0% WTR1% WTR2.5% WTR5% WTR10% WTR
a
c bd
ee
f g
hih
i i
J kJ
kmnl
om n l
omn
omnl
omn
omn
on
kJl
kmnl o
31
Figure 4- 2. Equilibrated solution P concentrations (no P initially added) for various soil mixes and WTR rate. Bars indicate standard error of the mean. Means with the same letter are not significantly different (LSD α = 0.05).
Table 4-3. Statistical analysis of equilibrated solution P (no P initially added) data.
Source DF SS Mean Square F-Value Pr > F Soil mix 4 260 65 162 < 0.0001 WTR 4 3210 802 1996 < 0.0001 Soil*WTR 16 143 9 22 < 0.0001
SS = Sum of Square
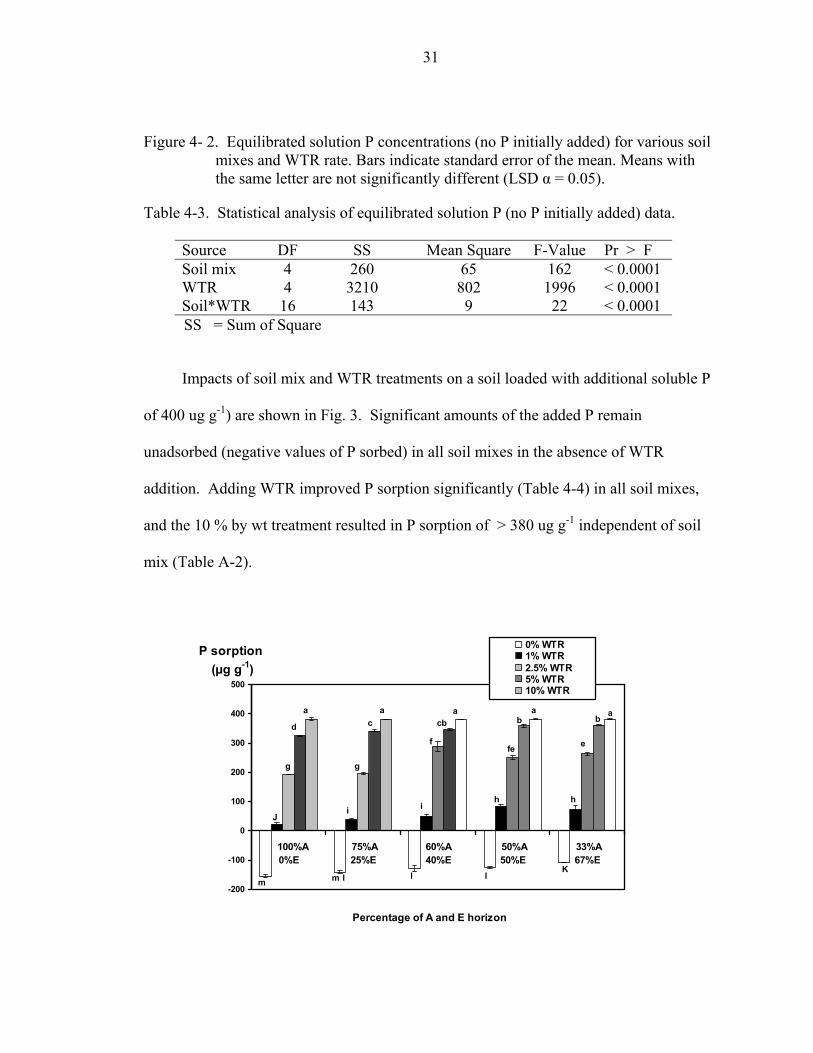
Impacts of soil mix and WTR treatments on a soil loaded with additional soluble P
of 400 ug g-1) are shown in Fig. 3. Significant amounts of the added P remain
unadsorbed (negative values of P sorbed) in all soil mixes in the absence of WTR
addition. Adding WTR improved P sorption significantly (Table 4-4) in all soil mixes,
and the 10 % by wt treatment resulted in P sorption of > 380 ug g-1 independent of soil
mix (Table A-2).
-200
-100
0
100
200
300
400
500
100%A 0%E
75%A 25%E
60%A 40%E
50%A 50%E
33%A 67%E
Percentage of A and E horizon
P sorption (µg g-1)
0% WTR1% WTR2.5% WTR5% WTR10% WTR
m m l l lK
J i i
h
h
g g
f fe
e
d c cb
b b
a a a a a
32
Figure 4- 3. P sorption following P load of 400 µg g-1 to various soil mixes with WTR
rates. Bar indicate standard error of the mean. Mean with the same letter are not significantly different (LSD α =0.05)
Despite the smaller soil mix effect (relative to the WTR effect), the combined data
of Fig. 2 and 3 led us to select both soil mix and WTR rate treatments for further study.
The treatments selected were soil mixes of 100 %A-0%E, 50 %A-50%E and 33 %A-
67%E and WTR rates of 0, 2.5, 5.0, and 10 % by wt.
A P sorbed per unit mass of WTR used was also calculated for the various soils
mixes. The value of (P sorbed/mass (g) WTR) was found to increase as the impacted A
was diluted with the E horizon. For example, 50%A-50%E soil mix at 5 % WTR rate
was significantly greater than 100%A-0%E soil mix at 10 % WTR rate. Thus suggesting
that WTR sorption improves as the impacted A is diluted with the unimpacted E horizon.
Table 4-4. Statistical analysis of P sorption data following P load of 400 µg g-1 Source DF SS Mean Square F Value Pr > F
Soil mix 4 18792 4698 48 < 0.0001WTR 4 2751194 687798 7093 < 0.0001 Soil*WTR 16 7967 497 5 < 0.0001
SS = Sum of Squares Soil Column Study
This experiment aimed at fulfilling objectives (ii) and (iii), stated as:
(ii) To determine the effect of mixing WTR throughout a soil column vs. mixing only with soil in top half of the column on P leaching using manure-impacted soils.
(iii) To determine optimal WTR rates appropriate for various soil mixes and
depths of incorporation.

33
Data presented in Fig. 4 to 6 show concentrations of soluble reactive P (SRP mg L-
1) in leachates collected over sixteen leaching events (15 pore volumes) of drainage from
the three soil mixes treated with various WTR rates mixed thoroughly or partially in the
column soil mass. In general, there were early fluctuations in the SRP of the leachates,
but leached SRP stabilized after the sixth pore volume. The mean SRP concentration for
the 100%A-0%E soil mix was ≈ 40 mg L-1 in the absence of WTR. Applying WTR to
the soil in the top to half the column (7.5 cm), decreased SRP in the leachates to a mean
value of ≈ 20 mg L-1. However, when the WTR was thoroughly mixed with the whole
soil mass in the column, the mean SRP value fell to ≈ 2 mg L-1. Clearly, the depth of
incorporation significantly impacted soluble P immobilization (see also Table 4-5).
34
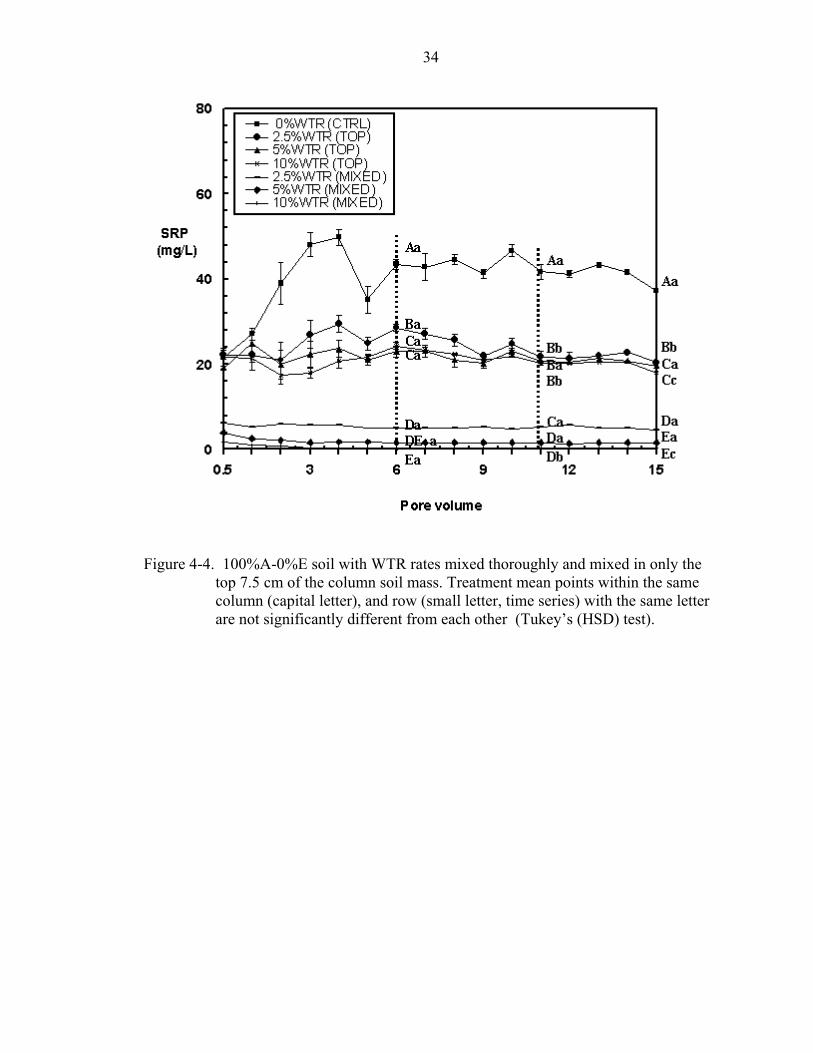
Figure 4-4. 100%A-0%E soil with WTR rates mixed thoroughly and mixed in only the top 7.5 cm of the column soil mass. Treatment mean points within the same column (capital letter), and row (small letter, time series) with the same letter are not significantly different from each other (Tukey’s (HSD) test).

35
Figure 4-5. 50%A-50%E soil with WTR rates mixed thoroughly and mixed in only the top 7.5 cm of the column soil mass. Treatment mean points within the same column (capital letter), and row (small letter, time series) with the same letter are not significantly different from each other (Tukey’s (HSD) test).

36
Figure 4-6. 33%A-67%E soil with WTR rates mixed thoroughly and mixed in only the top 7.5 cm of the column soil mass. Treatment mean points with the same letter are not significantly different from each other (Tukey’s (HSD) test).
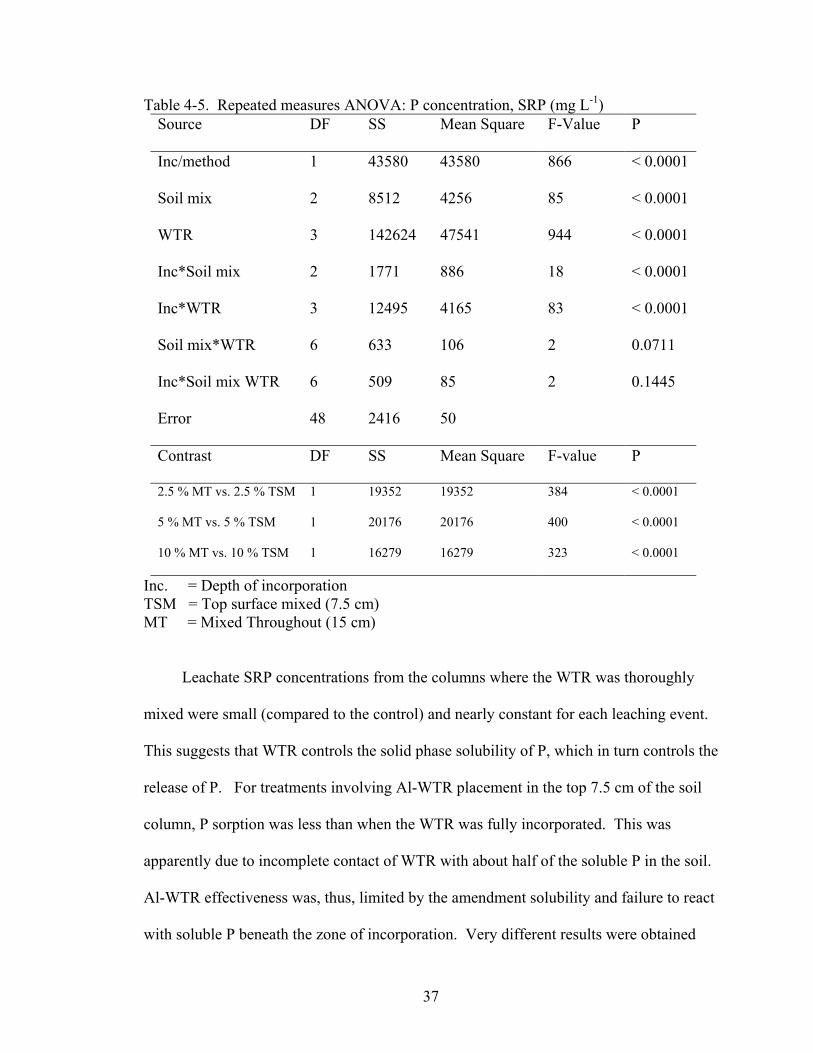
Table 4-5. Repeated measures ANOVA: P concentration, SRP (mg L-1) Source DF SS Mean Square F-Value P
Inc/method 1 43580 43580 866 < 0.0001
Soil mix 2 8512 4256 85 < 0.0001
WTR 3 142624 47541 944 < 0.0001
Inc*Soil mix 2 1771 886 18 < 0.0001
Inc*WTR 3 12495 4165 83 < 0.0001
Soil mix*WTR 6 633 106 2 0.0711
Inc*Soil mix WTR 6 509 85 2 0.1445
Error 48 2416 50
Contrast DF SS Mean Square F-value P
2.5 % MT vs. 2.5 % TSM 1 19352 19352 384 < 0.0001
5 % MT vs. 5 % TSM 1 20176 20176 400 < 0.0001
10 % MT vs. 10 % TSM 1 16279 16279 323 < 0.0001
Inc. = Depth of incorporation TSM = Top surface mixed (7.5 cm) MT = Mixed Throughout (15 cm)
Leachate SRP concentrations from the columns where the WTR was thoroughly
mixed were small (compared to the control) and nearly constant for each leaching event.
This suggests that WTR controls the solid phase solubility of P, which in turn controls the
release of P. For treatments involving Al-WTR placement in the top 7.5 cm of the soil
column, P sorption was less than when the WTR was fully incorporated. This was
apparently due to incomplete contact of WTR with about half of the soluble P in the soil.
Al-WTR effectiveness was, thus, limited by the amendment solubility and failure to react
with soluble P beneath the zone of incorporation. Very different results were obtained
37

38
when Al-WTR were thoroughly mixed with the entire column soil mass. Soluble P
mobilized by leaching irrigations apparently passed through reactive P-sorbing zones in
the Al-WTR-amended soils, and leached soluble P was significantly reduced. Significant
differences (P < 0.0001) were obtained for (SRP, mg L-1) using the repeated measures of
ANOVA between rates of WTR (2.5, 5, and 10 %).
For various soil mixes, time series analysis was performed on the leachate SRP
concentrations at the 6, 11, and 15 pore volumes (Table A-3 to A-5). Leachates
concentrations were not affected by time at the 6 th, 11 th, and 15 th pore volumes for
100%A-0%E soil mix in the absence of WTR (Fig. 4). Whereas, in 50%A-50%E and
33%A-67%E soil mixes (Fig. 5 and 6) due to the E horizon effects, significant
differences were observed as we moved across the treatments for no WTR incorporation.
More significant reductions over time were observed in SRP concentration from the
33%A-67%E soil mix compared to 50%A-55%E and 100%A-0%E soil mixes. This
suggest that mixing the impacted A horizon with E horizon soil significantly reduced
SRP concentrations across time. Further, soil mixing thoroughly with WTR tends to
control the solubility of P, as noted by the slow, and linear release of P (Fig 4 to 6). The
linear release of P as a result of WTR controlling the solid phase, coupled with no
observable desorption, suggest long term immobilization of P by WTR.
The soil mixes (Figs. 4 to 6) had decreasing significant SRP values in proportion to
the amount of P (in soil mixes). SRP values decreased in the order 100%A-0%E > 50
%A-50%E > 30%A-67%E in accordance with decreasing amount of total P in the soil
mixes. Interaction occurred between soil mix and WTR rates, however, it was weak (P =
0.07, see Table 4-5).

39
Data presented in Figs. 8, 9 and 10 show cumulative mass of SRP (mg P) leached.
At 15 pore volumes, a total of ≈ 1500 mL of leachate was collected, representing a depth
of 70.6 cm of rainfall per unit area of the soil column. Average rainfall in South Florida
Basin (Okeechobee) is ≈ 140 cm year-1, and average evapotranspiration is ≈ 100 cm year-
1 (USGS, 1996). Thus, rainfall exceeds evapotranspiration by ≈ 40 cm yr-1, which can
serve as a gross estimate of effective recharge (leaching). One pore volume of leachate,
(100 mL) ≈ 4.7 cm of drainage. Assuming 40 cm of drainage per year, each year in the
field is roughly equivalent to 8.5 pore volumes of drainage (40 cm y-1/4.7 cm pv-1 = 8.5
pv y-1) in the column study. The 15 pore volumes of drainage collected in this study,
thus, equates ≤ 2yr in the field, although this calculation is a gross over-simplification of
the actual field condition. The linear relation for the 100%A-0%E soil mix (Fig. 4),
suggest ≈ 4.2 % of total P would be lost from the soil by leaching. However, if WTR is
applied (2.5, 5, and 10 %) and thoroughly mixed with the soil, P losses would be only ~
0.6, 0.2, and 0.05 %, respectively of total P. Our data (Fig. 4) suggest that substantial P
loss would persist, unabated from the impacted soil for a long time if no actions were
taken to control P movement and release. Amendment with WTR can apparently
significantly reduce the magnitude of the P loss.
Repeated water extractions of the 100 %A-0%E, 50 %A-50%E and 33 %A-67%E,
soil mix (soil solution ratio of 1:10) showed that the mass of P released (SRP) exceeded

40
Figure 4-7. P released in 16 repeated water extractions (1:10 soil water) (Bars indicate
SE of the mean)
that obtained by leaching, and that the amount of P released was time dependent (Fig. 7).
For 100%A-0%E soil, the cumulative mass of P released in 16 extractions was 490 mg
kg-1, (36 % of the total P in the soils). The 50%A-50%E and 33%A-67%E treatments
had 300 mg kg-1 and 222 mg kg-1 cumulative P released, respectively, representing 47 %
and 55 % of total P, respectively, in the soils. Phosphorus released in the repeated water
extractions could be considered as a measure of readily released P from soils. Thus, the
data confirm that the soils were heavily impacted with phosphorus, and that P removal
would take a long time without any chemical immobilization of P. For all the soils
studied, the amounts of P released were generally greater during the first four leachings
or extractions than in subsequent leachings or extractions. This might be due to the rapid
release of loosely adsorbed or easily soluble P, whereas less soluble P fractions were
likely slowly released in the consequent extractions. Sequential extraction data (Table 4-
41
1) suggested ~ 19 % of P was labile (from KCl extracts), which might correspond to the
readily released P coming from the repeated water extractable and that P is subject to
easy leaching. Subsequent releases after labile P is depleted might be from Ca-Mg
associated P, (followed by Fe-Al associated P), which are all part of the large inorganic
pool of P in the manure-impacted soil.
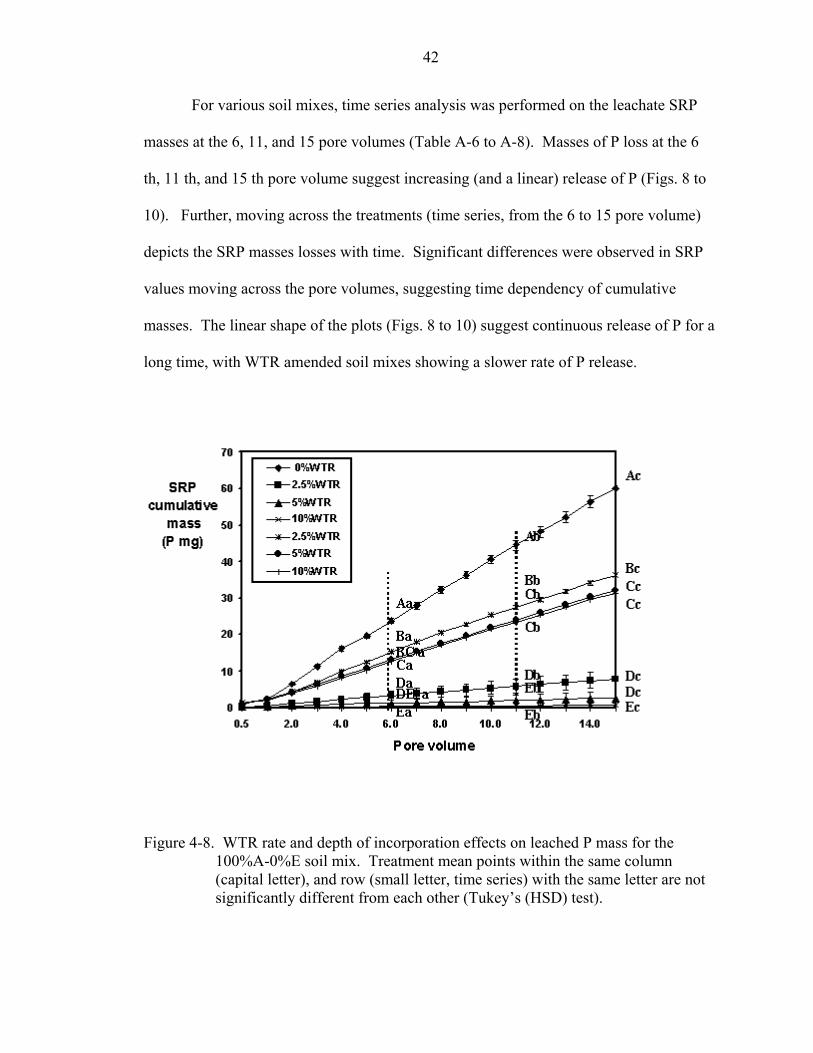
Data in Figs. 8 to 10 show cumulative masses of P leached with time from the
three soil mixes treated with various WTR rates incorporated (thoroughly or partially) in
the soil columns. The cumulative masses leached were nearly linear with time in all the
treatments, although the slopes of the linear relationships were much less when WTR was
added. For the 100%A-0%E soil, the mass leached without WTR was 60 mg (Fig. 8).
When WTR was applied to top half of the column, the mean mass was ≈ 30 mg. When
WTR was thoroughly mixed the mean mass was significantly decreased (Table 4-6) to <
5 mg. Similar decreasing trends of leached masses were observed in 50%A-50%E (Fig.
9) and 33%A-67%E (Fig. 4-10) soils, when the WTR was partially and thoroughly
mixed. Soil mixing significantly decreased P mass lost to leaching because less total P
was available.
Modeling of the SRP cumulative mass (mg), over time (pore volumes of leachate)
using linear regression equation (data not shown) suggest that for the 100%A-0%E soil,
soluble P would be lost for many years. The calculation estimate suggests, that ≥ 7.5 yrs
of leaching would be required to remove all total P (assuming all total P is leacheable).
However, as more P is leached the curve is expected to become increasingly non-linear.
Thus, total P removal may require much greater time than estimated.
42
For various soil mixes, time series analysis was performed on the leachate SRP
masses at the 6, 11, and 15 pore volumes (Table A-6 to A-8). Masses of P loss at the 6
th, 11 th, and 15 th pore volume suggest increasing (and a linear) release of P (Figs. 8 to
10). Further, moving across the treatments (time series, from the 6 to 15 pore volume)
depicts the SRP masses losses with time. Significant differences were observed in SRP
values moving across the pore volumes, suggesting time dependency of cumulative
masses. The linear shape of the plots (Figs. 8 to 10) suggest continuous release of P for a
long time, with WTR amended soil mixes showing a slower rate of P release.
Figure 4-8. WTR rate and depth of incorporation effects on leached P mass for the 100%A-0%E soil mix. Treatment mean points within the same column (capital letter), and row (small letter, time series) with the same letter are not significantly different from each other (Tukey’s (HSD) test).

43
Figure 4-9. WTR rate and depth of incorporation effects on leached P mass for the
50%A-50%E soil mix. Treatment mean points within the same column (capital letter), and row (small letter, time series) with the same letter are not significantly different from each other (Tukey’s (HSD) test).
igure 4-10. WTR rate and depth of incorporation effects on leached P mass for the
not
F
33%A-67%E soil mix. Treatment mean points within the same column (capital letter), and row (small letter, time series) with the same letter aresignificantly different from each other (Tukey’s (HSD) test).
44
Table 4-6. Repeated measures ANOVA: P- mass, SRP (mg)
Source DF SS Mean Square F-Value P
Inc (method) 1 27563 27563 753 < 0.0001
Soil mix 2 3465 1732 47 < 0.0001
WTR 3 89602 29867 815 < 0.0001
Inc*Soil mix 2 695 347 10 0.0003
Inc*WTR 3 8055 2685 73 < 0.0001
Soil mix*WTR 6 228 38 1.04 0.4110
Inc*Soil mix WTR 6 287 48 1.31 0.2717
Error 48 1757 37
Contrast DF SS Mean Square F-Value P
2.5 % MT vs. 2.5 % TSM 1 12612 12612 344 < 0.0001
5 % MT vs. 5 % TSM 1 12733 12733 347 < 0.0001
10 % MT vs. 10 % TSM 1 10118 10118 276 < 0.0001
Inc. = Method of incorporation )
Rainfall Simulations
The objectives of the rainfall simulation studies were to determine the effects of
WTR rate and depth of WTR incorporation on P in runoff and leachate. Data are
presented as mean flow-weighted concentrations (mg L-1) of P in runoff or leachate as a
function of various soils mixes, WTR rates and method of incorporation. Mean flow-
weighted concentrations are presented rather than individual rainfall events concentration
in order not to over/under represent the runoff and leachate volumes from the individual
TSM = Top surface mixed (7.5 cm MT = Mixed Throughout (15 cm)

45
events. It is used mostly when interest is focused on water quality. Mean flow-weighted
concentration is computed by multiplying the runoff and leachate volumes for each
sampling event by the concentration of P in runoff or leachate from the rainfall events,
and then by dividing by the sum of the volumes for the collective events.
A general decreasing trend of P in runoff SRP (Fig. 4-11), TDP (Fig. 4-12) and TP
(Fig. 4-13) was observed when Al-WTR was either surface applied or mixed throughout
the soil mixes 100%A-0%E and 50%A-50%E. The reduction in runoff SRP was greater
in surface applied WTR treatments than in soils where WTR was thoroughly mixed with
100 %A-0%E or 50% A-50%E soil (Fig.11). This suggests that surface applications of
Al-WTR can reduce P surface runoff, which might be biologically readily available for
eutrophication. However, flow-weighted SRP in runoff obtained due to soil mixing was
not significant (P > 0.05) from the control for both soils. This is explained by the fact
that runoff (as a surface phenomenon) is better controlled by preventing edge- of-field
transport of P. However, soil mixing with WTR was not directly directed to surface
water flow control per se; hence mixing with WTR seems to have had no effect on runoff
(Table A-9).
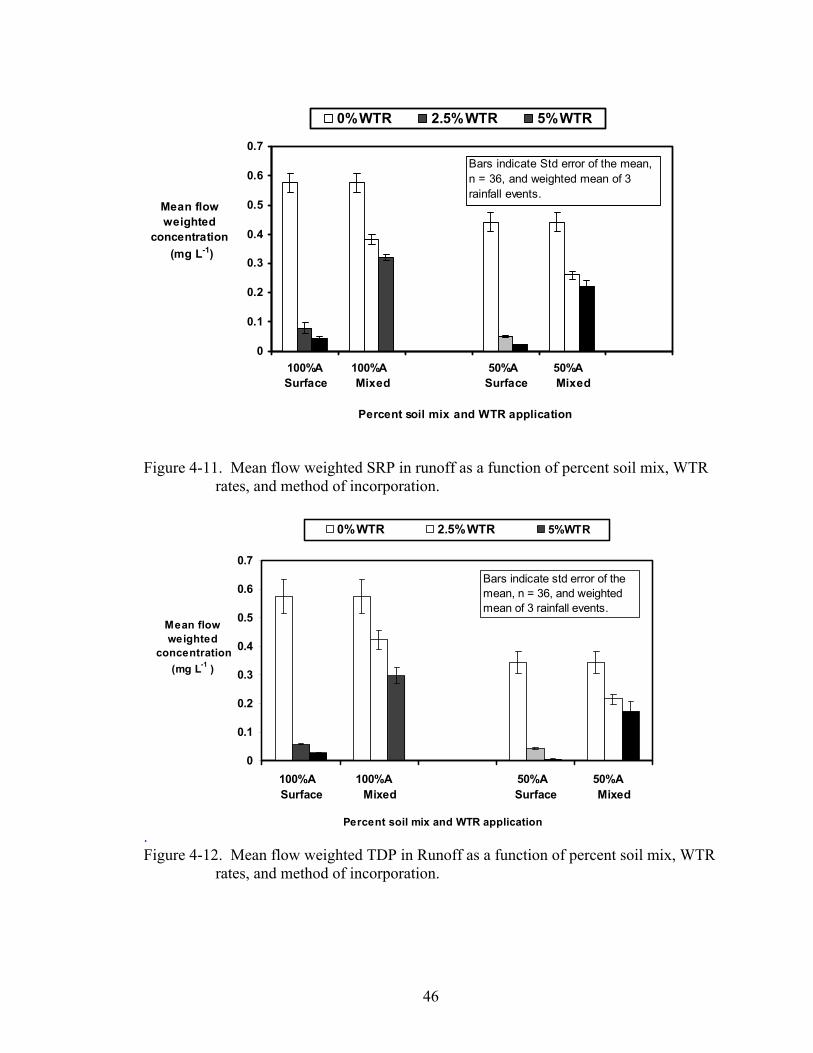
0
0.1
0.2
0.3
0.4
0.5
0.6
0.7
100%A Surface
100%A Mixed
50%A Surface
50%A Mixed
Percent soil mix and WTR application
Mean flowweighted
concentration (mg L-1)
0%WTR 2.5%WTR 5%WTR
Bars indicate Std error of the mean, n = 36, and weighted mean of 3 rainfall events.
Figure 4-11. Mean flow weighted SRP in runoff as a function of percent soil mix, WTR rates, and method of incorporation.
.
0
0.1
0.2
0.3
0.4
0.5
0.6
0.7
100%A Surface
100%A Mixed
50%A Surface
50%A Mixed
Percent soil mix and WTR application
Mean flowweighted
concentration (mg L-1 )
0%WTR 2.5%WTR 5%WTR
Bars indicate std error of the mean, n = 36, and weighted mean of 3 rainfall events.
Figure 4-12. Mean flow weighted TDP in Runoff as a function of percent soil mix, WTR
rates, and method of incorporation.
46

47
0
1
2
3
4
5
100%A Surface
100%A Mixed
50%A Surface
50%A Mixed
Percent Soil mix and WTR application
Mean flowweighted
concentration (mg L-1 )
0%WTR 2.5%WTR 5%WTR
Bars indicate Std error of the mean, n = 36, and weighted mean of 3 rainfall events.
Figure 4-13. Mean flow weighted Total P in runoff as a function of percent soil mix, WTR rate, and method of incorporation.
Although soil mixing did not significantly affect P in runoff, significant
interactions between soil mix and method of application occurred for SRP and TDP (P <
0.05), but not on TP. TP runoff values (Fig. 4-13) were 8 times greater than either SRP
(Fig. 4-11) or TDP (Fig. 4-12), with no significant difference in soil mix (Table A-9 to A-
11).
For TP (Table A-11), soil mix effects were significant (P < 0.05), probably due to
the fact that soil mixing evenly distributed the P throughout the soil, which otherwise
might be concentrated at the surface. The high rainfall intensity used promotes heavy
washing away of surface soils and, combined with bare soil surface, likely represents an
extreme case scenario. Grasses or crop residues would tend to reduce sediment-bound P
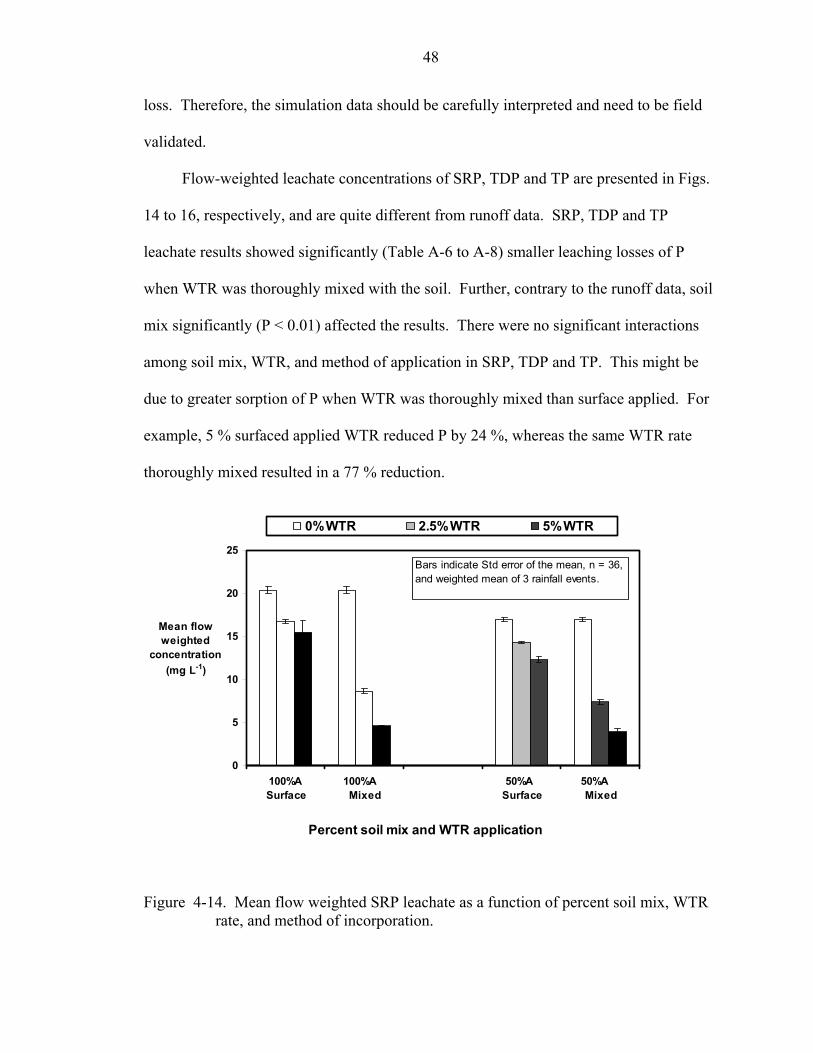
48
loss. Therefore, the simulation data should be carefully interpreted and need to be field
validated.
Flow-weighted leachate concentrations of SRP, TDP and TP are presented in Figs.
14 to 16, respectively, and are quite different from runoff data. SRP, TDP and TP
leachate results showed significantly (Table A-6 to A-8) smaller leaching losses of P
when WTR was thoroughly mixed with the soil. Further, contrary to the runoff data, soil
mix significantly (P < 0.01) affected the results. There were no significant interactions
among soil mix, WTR, and method of application in SRP, TDP and TP. This might be
due to greater sorption of P when WTR was thoroughly mixed than surface applied. For
example, 5 % surfaced applied WTR reduced P by 24 %, whereas the same WTR rate
thoroughly mixed resulted in a 77 % reduction.
0
5
10
15
20
25
100%A Surface
100%A Mixed
50%A Surface
50%A Mixed
Percent soil mix and WTR application
Mean flow weighted
concentration (mg L-1)
0%WTR 2.5%WTR 5%WTR
Bars indicate Std error of the mean, n = 36, and weighted mean of 3 rainfall events.
Figure 4-14. Mean flow weighted SRP leachate as a function of percent soil mix, WTR rate, and method of incorporation.

49
0
5
10
15
20
25
100%ASurface
100%A Mixed
50%ASurface
50%A Mixed
Percent soil mix and WTR application
Mean flow weighted
concentration (mg L-1 )
0%WTR 2.5%WTR 5%WTR
Bars indicate Std error of the mean, n = 36, and weighted mean of 3 rainfall events.
Figure 4-15. Mean flow weighted TDP in leachate as a function of percent soil mix, WTR rate, and method of incorporation.
0
5
10
15
20
25
100%A Surface
100%A Mixed
50%A Surface
50%A Mixed
Percent Soil mix and WTR application
Mean flowweighted
concentration (mg L-1 )
0%WTR 2.5%WTR 5%WTR
Bars indicate Std error of the mean, n = 36, and weighted mean of 3 rainfall events
Figure 4-16. Mean flow weighted Total P in leachate as a function of percent soil mix, WTR rate, and method of incorporation.
50
Surface application of WTR, significantly (P < 0.0001) reduced P in runoff and
leachate SRP, TP (P = 0.003), and TDP (P = 0.001). To minimize P losses through
leaching, WTR should be mixed with the soil to promote full contact of the amendment
with all soluble P.
The critical threshold P value (SRP) leading to eutrophication is about 0.03 mg L-1
(Pierzynski et al, 2000). The SRP, TDP and TP values, in runoff for surface applied
WTR rates were all below 0.03 mg L-1, suggesting that WTR can effectively reduce
eutrophication. Leachate concentration values of SRP, TDP and TP were greater than
runoff values, and exceeded the threshold value of 0.03 mg L-1 regardless of the WTR
rate and depth of incorporation. The greater values could be due to high rainfall intensity
of 7.1 cm hr-1 used in the simulations. Due to the high rain intensity, the water
(containing soluble P) likely moved through the soil so quickly that there was insufficient
time to react with the applied WTR. The experimental approach of the rainfall study is
based on losses of P in runoff under worse–case condition of no vegetations, and results
should be interpreted accordingly.

CHAPTER 5 CONCLUSIONS
The experimental approach used in this study was intended to provide guidance for
managing soils highly impacted with manure-P. Management practices evaluated
included use of a soil amendment (Al-WTR) to immobilize soluble P and mixing of
heavily impacted soil horizons with less impacted horizon to reduce overall total P
concentrations. The single adsorption point studies provided the basis for selection of
WTR rates and percent soil mixing in subsequent soil column leaching and rainfall
simulation studies. The WTR effect was more pronounced than percent soil mixing in
the laboratory equilibrium and soil column leaching studies. Various rates of WTR were
used 0, 1, 2.5, 5, and 10 % (by wt). The 2.5 % rate (56 Mg ha-1) was generally effective
and represents a practical field application in most situations. Care must be taken not to
add excess WTR to the soil (rates > 56 Mg ha-1), which might excessively fix
phosphorus, needed in the long run by plants. The soil mixing thoroughly with WTR
treatments suggest that P leaching can be minimized by WTR and that more P sorption to
WTR occurs as a result of dilution of A-horizon. The inclusion of 10 % WTR rate (224
Mg ha-1) in our case is an extreme-case scenario, but could be useful to treat small
acreage “hotspots” excessively contaminated with P. WTR supply in Florida would
likely support treating < 100 ha y-1 at 224 Mg ha-1 rate. Nevertheless, the environmental
cost of allowing continual P leakage from badly polluted sites into water bodies might
justify using such a high rate.
51

52
As noted in rainfall simulations, surface applications of WTR are more effective in
P reducing runoff P than thorough mixing. Both the leaching and runoff studies, thus
emphasize that WTR should be placed where phosphorus would likely flow to maximize
its effectiveness. If surface runoff is expected to be the major contributor to water quality
degradation, WTR should be surface applied. However, if leaching of P is the major
concern, then mix the WTR where the soluble P is.
One likely effect of mixing A and E horizons was to decrease the concentration of
soluble organics that can complex with WTR surfaces and reduce its P-sorbing
effectiveness. The mixing of A and E horizons (e.g. ≥ 50%A-50%E), reduced the
amount of WTR required, and allowed the WTR to effectively immobilized soluble P.
Such mixing, however, can require moving and mixing very large masses of soil.
Increasing WTR rates of 5 to 10 % (by wt.) can be as effective as mixing soil horizons
and using lower WTR rates (2.5 %). All the data generated herein were under highly
controlled conditions. Field validation of the treatment effects is needed before the
management practices are widely recommended.

APPENDIX STATISTICAL DATA
Table A-1. Equilibrated solution concentration (no P initially added)
Treatment % WTR Mean*
(µg ml-1) N Grouping 100%A-0%E 0 24 3 A 60%A-40%E 0 20 3 B 75%A-25%E 0 19 3 C 50%A-50%E 0 17 3 D 100%A-0%E 1 14 3 E 33%A-67%E 0 14 3 E 75%A-25%E 1 11 3 F 60%A-40%E 1 10 3 G 50%A-50%E 1 7 3 H 100%A-0%E 2.5 7 3 H 75%A-25%E 2.5 5 3 I 33%A-67%E 1 5 3 I 60%A-40%E 2.5 4 3 I 100%A-0%E 5 3 3 J 50%A-50%E 2.5 3 3 K J 75%A-25%E 5 2 3 K J L 60%A-40%E 5 2 3 K M J L 33%A-67%E 2.5 2 3 K M N L 50%A-50%E 5 1 3 O M N L 100%A-0%E 10 1 3 O M N L 75%A-25%E 10 1 3 O M N 60%A-40%E 10 1 3 O M N 33%A-67%E 5 1 3 O M N 50%A-50%E 10 1 3 O N 33%A-67%E 10 1 3 O
*Means with the same letter are not significantly different. (LSD, α = 0.05) = 1.04

54
Table A-2. P sorption following P load of 400 µg g-1
Treatment % WTR Mean* (µg g-1) N Grouping
50%A-50%E 10 384 3 A 33%A-67%E 10 383 3 A 75%A-25%E 10 382 3 A 100%A-0%E 10 382 3 A 60%A-40%E 10 382 3 A 33%A-67%E 5 361 3 B 50%A-50%E 5 359 3 B 60%A-40%E 5 346 3 B C 75%A-25%E 5 342 3 C 100%A-0%E 5 321 3 D 33%A-67%E 2.5 263 3 E 50%A-50%E 2.5 250 3 F E 60%A-40%E 2.5 239 3 F 75%A-25%E 2.5 196 3 G 100%A-0%E 2.5 191 3 G 50%A-50%E 1 83 3 H 33%A-67%E 1 72 3 H 60%A-40%E 1 51 3 I 75%A-25%E 1 38 3 I 100%A-0%E 1 22 3 J 33%A-67%E 0 -107 3 K 50%A-50%E 0 -125 3 L 60%A-40%E 0 -128 3 L 75%A-25%E 0 -141 3 L M 100%A-0%E 0 -157 3 M
*Means with the same letter are not significantly different (LSD, α = 0.05) = 16.15
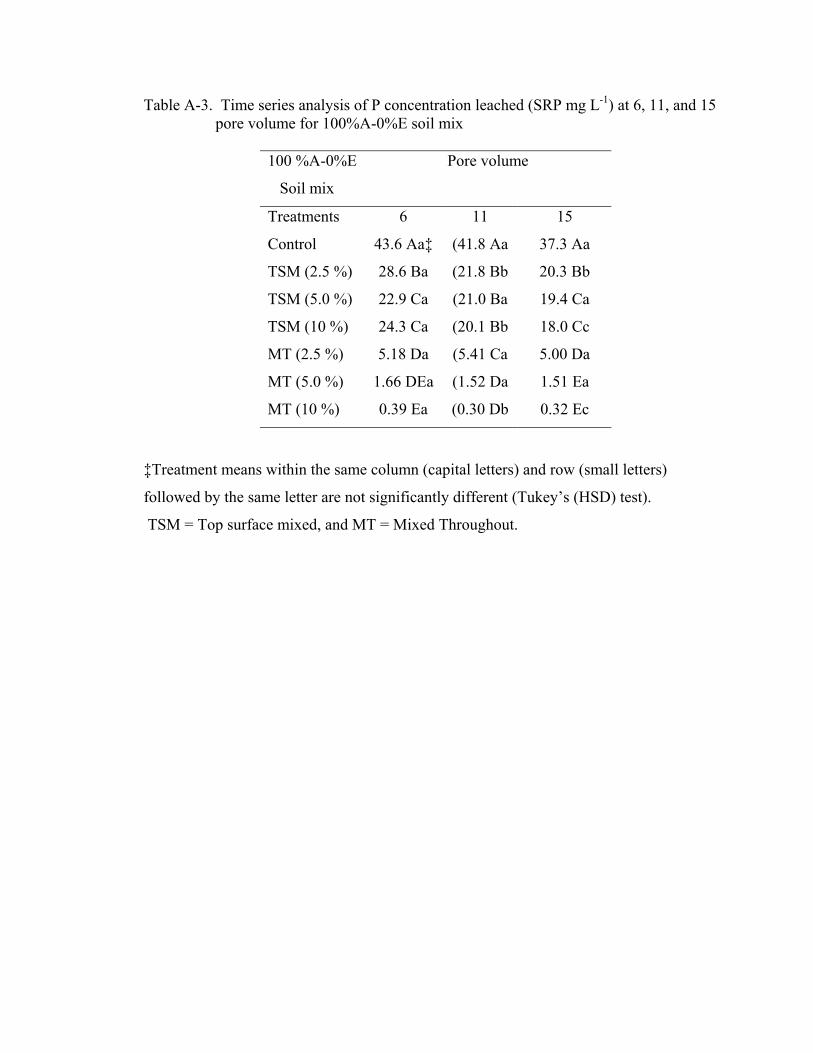
Table A-3. Time series analysis of P concentration leached (SRP mg L-1) at 6, 11, and 15 pore volume for 100%A-0%E soil mix
100 %A-0%E
Soil mix
Pore volume
Treatments 6 11 15
Control 43.6 Aa‡ (41.8 Aa 37.3 Aa
TSM (2.5 %) 28.6 Ba (21.8 Bb 20.3 Bb
TSM (5.0 %) 22.9 Ca (21.0 Ba 19.4 Ca
TSM (10 %) 24.3 Ca (20.1 Bb 18.0 Cc
MT (2.5 %) 5.18 Da (5.41 Ca 5.00 Da
MT (5.0 %) 1.66 DEa (1.52 Da 1.51 Ea
MT (10 %) 0.39 Ea (0.30 Db 0.32 Ec
‡Treatment means within the same column (capital letters) and row (small letters)
followed by the same letter are not significantly different (Tukey’s (HSD) test).
TSM = Top surface mixed, and MT = Mixed Throughout.

Table A-4. Time series analysis of P concentration leached (SRP mg L-1) at 6, 11, and 15
pore volume for 50%A-50%E soil mix
50 %A-50%E
Soil mix
Pore volume
Treatments 6 11 15
Control 40.1 Aa‡ 31.6 Ab 25.4 Ab
TSM (2.5 %) 17.7 Ba 14.3 Bb 12.2 Bb
TSM (5.0 %) 17.1 Ba 13.1 Ba 11.2 Ba
TSM (10 %) 18.0 Ba 13.8 Ba 8.4 Cb
MT (2.5 %) 1.72 Ca 1.72 Ca 1.68 Da
MT (5.0 %) 0.36 Ca 0.27 Cab 0.33 Db
MT (10 %) 0.13 Ca 0.06 Ca 0.15 b
‡Treatment means within the same column (capital letters) and row (small letters)
followed by the same letter are not significantly different (Tukey’s (HSD) test).
TSM = Top surface mixed, and MT = Mixed Throughout.
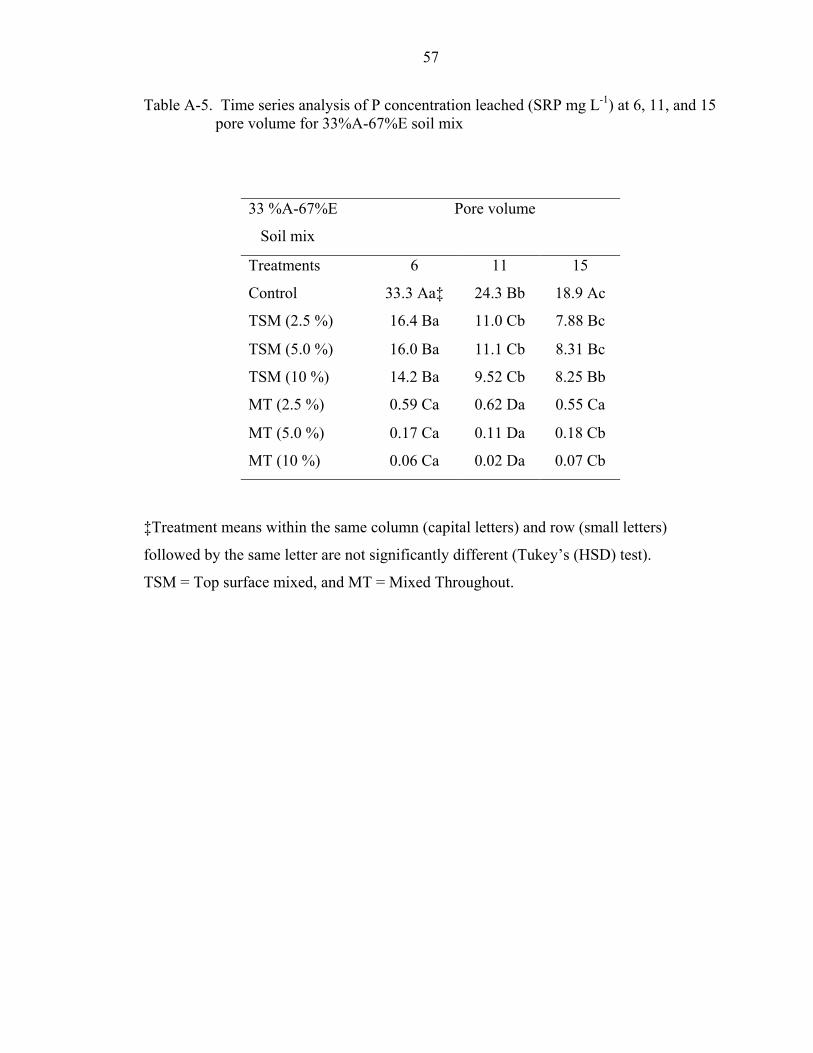
57
Table A-5. Time series analysis of P concentration leached (SRP mg L-1) at 6, 11, and 15 pore volume for 33%A-67%E soil mix
33 %A-67%E
Soil mix
Pore volume
Treatments 6 11 15
Control 33.3 Aa‡ 24.3 Bb 18.9 Ac
TSM (2.5 %) 16.4 Ba 11.0 Cb 7.88 Bc
TSM (5.0 %) 16.0 Ba 11.1 Cb 8.31 Bc
TSM (10 %) 14.2 Ba 9.52 Cb 8.25 Bb
MT (2.5 %) 0.59 Ca 0.62 Da 0.55 Ca
MT (5.0 %) 0.17 Ca 0.11 Da 0.18 Cb
MT (10 %) 0.06 Ca 0.02 Da 0.07 Cb
‡Treatment means within the same column (capital letters) and row (small letters)
followed by the same letter are not significantly different (Tukey’s (HSD) test).
TSM = Top surface mixed, and MT = Mixed Throughout.

Table A-6. Time series analysis of P mass leached (SRP mg) at 6, 11, and 15 pore volume for 100%A-0%E soil mix
100 %A-0%E
Soil mix
Pore volume
Treatments 6 11 15
Control 23.8 Aa‡ 44.5 Ab 60.1 Ac
TSM (2.5 %) 15.3 Ba 27.5 Bb 36.2 Bc
TSM (5.0 %) 13.2 BCa 24.0 Cb 32.2 Cc
TSM (10 %) 12.6 Ca 23.4 Cb 31.4 Cc
MT (2.5 %) 3.30 Da 5.90 Db 7.90 Dc
MT (5.0 %) 1.23 DEa 2.01 Eb 2.61 Dc
MT (10 %) 0.38 Ea 0.55 Eb 0.68 Ec
‡Treatment means within the same column (capital letters) and row (small letters)
followed by the same letter are not significantly different (Tukey’s (HSD) test).
TSM = Top surface mixed, and MT = Mixed Throughout.

Table A-7. Time series analysis of P mass leached (SRP mg) at 6, 11, and 15 pore volume for 50%A-50%E soil mix
50 %A-50%E
Soil mix
Pore volume
Treatments 6 11 15
Control 24.4 Aa‡ 41.4 Ab 52.8 Ac
TSM (2.5 %) 13.2 Ba 21.4 Bb 26.9 Bc
TSM (5.0 %) 12.6 Ba 19.7 Cb 24.8 Cc
TSM (10 %) 11.6 Ca 19.0 Cb 23.4 Cc
MT (2.5 %) 1.32 Da 2.19 Db 2.89 Dc
MT (5.0 %) 0.37 Da 0.53 Eb 0.66 Ec
MT (10 %) 0.16 Da 0.20 Eb 0.25 Ec
‡Treatment means within the same column (capital letters) and row (small letters)
followed by the same letter are not significantly different (Tukey’s (HSD) test).
TSM = Top surface mixed, and MT = Mixed Throughout.
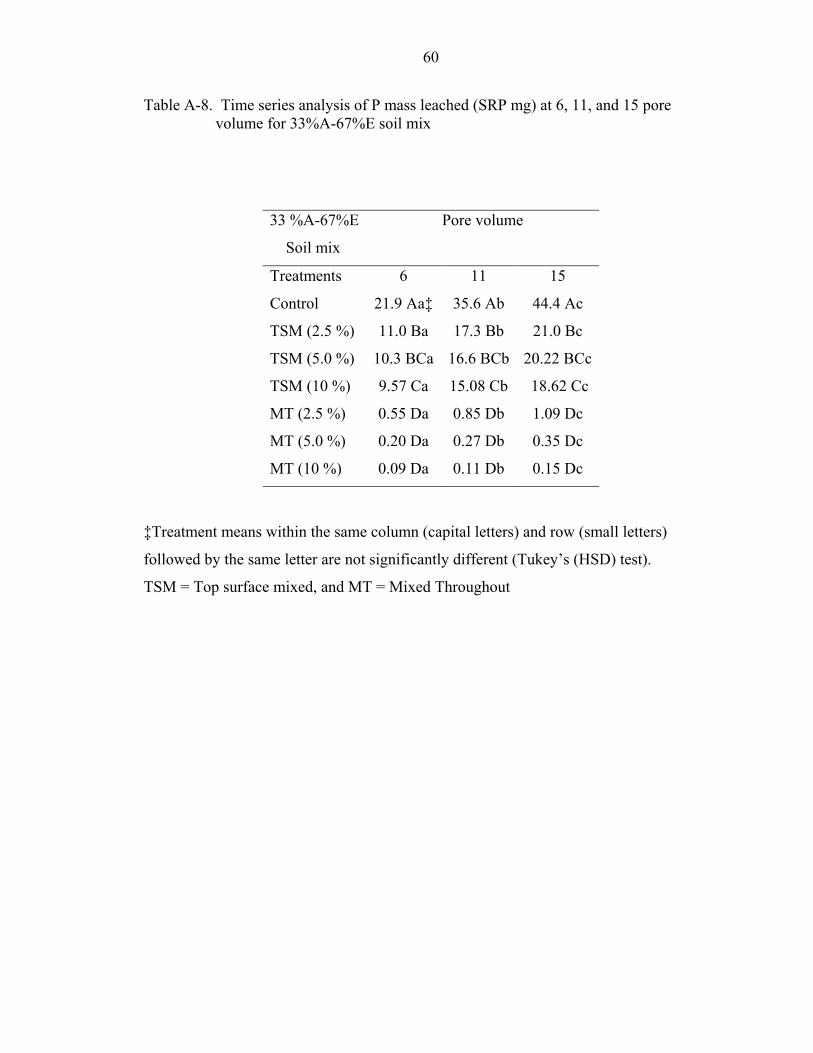
60
Table A-8. Time series analysis of P mass leached (SRP mg) at 6, 11, and 15 pore volume for 33%A-67%E soil mix
33 %A-67%E
Soil mix
Pore volume
Treatments 6 11 15
Control 21.9 Aa‡ 35.6 Ab 44.4 Ac
TSM (2.5 %) 11.0 Ba 17.3 Bb 21.0 Bc
TSM (5.0 %) 10.3 BCa 16.6 BCb 20.22 BCc
TSM (10 %) 9.57 Ca 15.08 Cb 18.62 Cc
MT (2.5 %) 0.55 Da 0.85 Db 1.09 Dc
MT (5.0 %) 0.20 Da 0.27 Db 0.35 Dc
MT (10 %) 0.09 Da 0.11 Db 0.15 Dc
‡Treatment means within the same column (capital letters) and row (small letters)
followed by the same letter are not significantly different (Tukey’s (HSD) test).
TSM = Top surface mixed, and MT = Mixed Throughout
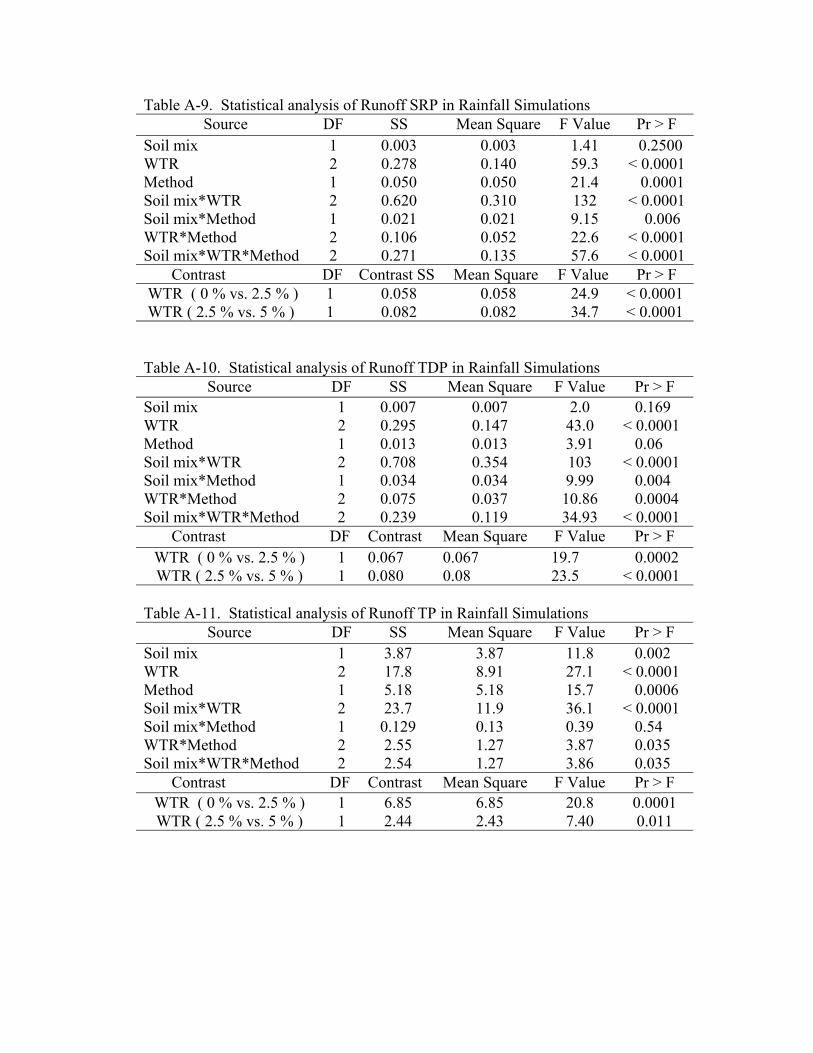
Table A-9. Statistical analysis of Runoff SRP in Rainfall Simulations Source DF SS Mean Square F Value Pr > F
Soil mix 1 0.003 0.003 1.41 0.2500 WTR 2 0.278 0.140 59.3 < 0.0001 Method 1 0.050 0.050 21.4 0.0001 Soil mix*WTR 2 0.620 0.310 132 < 0.0001 Soil mix*Method 1 0.021 0.021 9.15 0.006 WTR*Method 2 0.106 0.052 22.6 < 0.0001 Soil mix*WTR*Method 2 0.271 0.135 57.6 < 0.0001 Contrast DF Contrast SS Mean Square F Value Pr > F WTR ( 0 % vs. 2.5 % ) 1 0.058 0.058 24.9 < 0.0001 WTR ( 2.5 % vs. 5 % ) 1 0.082 0.082 34.7 < 0.0001 Table A-10. Statistical analysis of Runoff TDP in Rainfall Simulations
Source DF SS Mean Square F Value Pr > F Soil mix 1 0.007 0.007 2.0 0.169 WTR 2 0.295 0.147 43.0 < 0.0001 Method 1 0.013 0.013 3.91 0.06 Soil mix*WTR 2 0.708 0.354 103 < 0.0001 Soil mix*Method 1 0.034 0.034 9.99 0.004 WTR*Method 2 0.075 0.037 10.86 0.0004 Soil mix*WTR*Method 2 0.239 0.119 34.93 < 0.0001 Contrast DF Contrast Mean Square F Value Pr > F
WTR ( 0 % vs. 2.5 % ) 1 0.067 0.067 19.7 0.0002 WTR ( 2.5 % vs. 5 % ) 1 0.080 0.08 23.5 < 0.0001
Table A-11. Statistical analysis of Runoff TP in Rainfall Simulations
Source DF SS Mean Square F Value Pr > F Soil mix 1 3.87 3.87 11.8 0.002 WTR 2 17.8 8.91 27.1 < 0.0001 Method 1 5.18 5.18 15.7 0.0006 Soil mix*WTR 2 23.7 11.9 36.1 < 0.0001 Soil mix*Method 1 0.129 0.13 0.39 0.54 WTR*Method 2 2.55 1.27 3.87 0.035 Soil mix*WTR*Method 2 2.54 1.27 3.86 0.035 Contrast DF Contrast Mean Square F Value Pr > F
WTR ( 0 % vs. 2.5 % ) 1 6.85 6.85 20.8 0.0001 WTR ( 2.5 % vs. 5 % ) 1 2.44 2.43 7.40 0.011

62
Table A-12. Statistical analysis of Leachate SRP in Rainfall Simulations Source DF SS Mean Square F Value Pr > F
Soil mix 1 634 634 67.8 < 0.0001 WTR 2 214 107 11.5 0.0003 Method 1 10.8 10.8 1.16 0.2927 Soil mix*WTR 2 1.43 0.71 0.08 0.9265 Soil mix*Method 1 5.62 5.62 0.60 0.4459 WTR*Method 2 17.4 8.68 0.93 0.4089 Soil mix*WTR*Method 2 6.59 3.29 0.35 0.7068 Contrast DF Contrast Mean Square F Value Pr > F
WTR ( 0 % vs. 2.5 % ) 1 97.4 97.4 10.4 0.003 WTR ( 2.5 % vs. 5 % ) 1 19.7 19.7 2.11 0.160
Table A-13. Statistical analysis of Leachate TDP in Rainfall Simulations
Source DF SS Mean Square F Value Pr > F Soil mix 1 652 652 53.1 < 0.0001 WTR 2 225 112 9.20 0.0011 Method 1 34.9 34.9 2.84 0.1047 Soil mix*WTR 2 5.88 2.94 0.24 0.789 Soil mix*Method 1 17.89 17.9 1.46 0.239 WTR*Method 2 23.2 11.6 0.95 0.403 Soil mix*WTR*Method 2 13.3 6.64 0.54 0.589 Contrast DF Contrast Mean Square F Value Pr > F
WTR ( 0 % vs. 2.5 % ) 1 69.91 69.9 5.70 0.025 WTR ( 2.5 % vs. 5 % ) 1 44.03 44.0 3.59 0.07
Table A-14. Statistical analysis of Leachate TP in Rainfall Simulations
Source DF SS Mean Square F Value Pr > F Soil mix 1 829 829 74.35 < 0.001 WTR 2 266 133 11.94 0.0003 Method 1 15.4 15.4 1.38 0.25 Soil mix*WTR 2 0.70 0.35 0.03 0.96 Soil mix*Method 1 11.2 11.2 1.00 0.33 WTR*Method 2 23.0 11.50 1.03 0.37 Soil mix*WTR*Method 2 15.8 7.91 0.71 0.50 Contrast DF Contrast Mean Square F Value Pr > F
WTR ( 0 % vs. 2.5 % ) 1 114 114.0 10.2 0.004 WTR ( 2.5 % vs. 5 % ) 1 28.5 28.6 2.56 0.123
LIST OF REFERENCES
Anderson, J.M. 1976. An ignition method for the determination of total phosphorus in lake sediments. Water Research 10: 329-331.
Basta, N.T., and J.J. Sloan. 1999. Bioavailability of heavy metals in strongly acidic soils
treated with exceptional quality biosolids. J. Environ. Qual. 28:633-638. Basta, N.T., R.J. Zupancic, and E.A. Dayton. 2000. Evaluating soil tests to predict
bermudagrass growth in drinking water treatment residuals with phosphorus fertilizer. J. Environ. Qual. 29: 2007-2012.
Brady, N.C., and R.R. Weil. 2002. The nature and properties of soils. Thirteenth
Edition. Prentice Hall, Upper Saddle River New Jersey. Brown, E., and J. Sartain 2000. Phosphorus retention in United States Golf Association (USGA) greens. Soil Crop Sci. Soc. Florida Proc. 59:112-117. Bohn, H.L., B.L. McNeal, and G.A. O’Connor. 2001. Soil chemistry 3rd ed. John Wiley and Sons. New York. Burgoa, B., A.B. Bottcher, R.S. Mansell, and L.A. Allen, Jr. 1991. Distributions of
residual soil phosphorus along transacts for three dairies in Okeechobee County, Florida. Soil Crop Sci. Soc. Fla. Proc. 50:137-144.
Chang, A.C., A.L. Page, J.E. Warneke, and E. Grgrurevic. 1984. Sequential extraction
of soil heavy metals following a sludge application. J. Environ. Qual., 13: 33-38. Codling, E.E., R.L. Chaney, and C.L. Mulchi. 2000. Use of aluminum- and iron-rich
residues to immobilize phosphorus in poultry litter and litter-amended soils. J. Environ. Qual. 29: 1924-1931.
Correll, D.L., 1998. The role of phosphorus in the eutrophication of receiving waters: A
review. J. Environ. Qual. 27: 261. Cox, A. E., J.J. Camberato, and B.R. Smith. 1997. Phosphate availability and inorganic
transformation in an alum sludge-affected soil. J. Environ. Qual. 26: 1393-1398. Dayton, E.A., N.T. Basta, C.A. Jakober, and J.A. Hattey. 2003. Using treatment residuals
to reduce phosphorus in agricultural runoff. Journal AWWA. 95: 151-158.
63

64
DeLaune, P.B., and P.A. Moore, Jr. 2001. Predicting annual phosphorus losses from
fields using the phosphorus index for pastures. Better Crops 85 (4): 16-19. Eaton, A.D., L.S. Clesceri, and A.E. Greenberg (eds.). 1995. Standard methods for the
examination of water and wastewater. American Public Health Association. Washington. D.C.
Elliott, H.A., B.A. Dempsey, D.W. Hamilton, and J.R. DeWolfe. 1990. Land application
of water treatment sludges: impacts and management. Am. Water Works Assoc. Res. Foundation, Denver.
Elliott, H.A., G.A. O’Connor, P Lu, and, S. Brinton. 2002a. Influence of water treatment
residuals on phosphorus solubility and leaching. J. Environ. Qual. 31: 1362-1369. Elliott, H.A., G.A. O’Connor, and S. Brinton. 2002b. Phosphorus leaching from
biosolids-amended sandy soils. J. Environ. Qual. 31:681-689. Froelich, P.N. 1988. Kinetic control of dissolved phosphate in natural rivers and
estuaries: A primer on the phosphate buffer mechanism. Limnol. Oceanography 33: 649-668.
Hanlon, E.A., J.S. Gonzalez, and J.M. Bartos. 1997a. Soil pH (1:2v/v). pp. 15, 75-76. In
IFAS extension soil testing laboratory (ESTL) and analytical research laboratory (ARL) chemical procedures and training manual. Fl. Coop. Ext. Ser. Cir. 812, Univ. of Florida, Gainesville.
Hanlon, E.A., J.S. Gonzalez, and J.M. Bartos. 1997b. Electrical conductivity. pp. 24-77.
In IFAS extension soil testing laboratory (ESTL) and analytical research laboratory (ARL) chemical procedures and training manual. Fl. Coop. Ext. Ser. Cir. 812, Univ. of Florida, Gainesville.
Harris, W.G., H.D. Wang, and K.R. Reddy. 1994. Dairy manure influence on soil and
sediment composition: implications for P retention. J. Environ. Qual. 23: 107-1081.
Harris, W.G., R.D. Rhue, G. Kidder, R.B. Brown, and R. Littell. 1996. Phosphorus retention as related to morphology of sandy coastal plain soil materials. Soil Sci Soc. Am. J. 60:1513-1521.
Haustein, G.K., T.C. Daniel, D.M. Miller, P.A. Moore, Jr, and R.W. McNew, 2000.
Aluminum-containing residuals influence high-phosphorus soils and runoff water quality. J. Environ. Qual. 29: 1954-1959.
65
Hyde, J.E., and T.F. Morris, 2000. Phosphorus availability in soils amended with
dewatered water treatment residual and metal concentrations with time in residual. J. Environ. Qual. 29: 1896-1904.
Ippolito, J.A., K.A. Barbarick, and E.F. Redente. 1999. Co-application of water
treatment residuals and biosolids on two range grasses. J. Environ. Qual. 28: 1644-1650.
Ippolito, J.A., K.A. Barbarick, D. M. Heil, J.P. Chandler, and E.F. Redente. 2003.
Phosphorus retention mechanisms of a water treatment residual. J. Environ. Qual. 30: 1857-1864.
Knocke, W. R., and D.L. Walkeland. 1983. Fundamental characteristics of water
treatment plant sludges. J. AWWA, p. 516 - 523. Lane, C.T. 2002. Water treatment residuals effects on phosphorus in soils amended with
dairy manure. M.Sc Thesis, Univ. Fl., Gainesville, Fl. 32611-0510. Lindsay, W.L., P.L.G. Vlek, and S.H. Chien. 1989. Phosphate minerals. P.1089-1130. In
J.B. Dixon and S.B. Weed (ed). Minerals in soils environments. Soil Sci. Soc. Am., Madison, WI.
Makris, K.C. 2004. Long-term stability of sorbed phosphorus by drinking water treatment
residuals: Mechanisms and implications. PhD Dissertation, Univ. Fl., Gainesville, Fl. 32611-0510.
McBride, M.B. 1994. Environmental chemistry of soils. Oxford University Press. Inc.
198 Madison Avenue, New York. McKeague, J.A., J.E. Brydon, and N.M. Miles. 1971. Differentiation of forms of
extractable iron and aluminium in soils. Soils Sci Soc. Am. Proc. 35:33-48. Miller, W.P. 1987. A solenoid-operated, variable intensity rainfall simulator. Soil Sci.
Soc. Am. J. 51:832-834. Moore, P.A. Jr., T.C. Daniel, and D.R. Edwards. 2000. Reducing phosphorus runoff and
inhibiting ammonia loss from poultry manure with aluminum sulfate. J. Environ. Qual. 29: 37-49.
Moore, P.A., and D.M. Miller. 1994. Decreased phosphorus solubility in poultry litter
with aluminum, calcium and iron amendments. J. Environ. Qual. 23: 325-330. Moore, P.A., Daniel T.C, and D.R. Edwards. 1999. Reducing phosphorous runoff and
improving poultry production with alum. Poultry Sci. 78:692-698.
66
Murphy, J., and J.P. Riley. 1962. A modified single solution method for the
determination of phosphate in natural waters. Anal. Chim. Acta 27:31-36. Nair, V.D., and D.A. Graetz. 2002. Phosphorus saturation in Spodosols impacted by
manure. J. Environ. Qual. 31: 1279-1285. Nair, V.D., D. A. Graetz, and K.M. Portier. 1995. Forms of phosphorus in soil profiles
from dairies of South Florida. Soil Sci. Soc. Am. J. 59: 1244-1249. National Phosphorus Research Project. 2001. Rain simulator protocols. (Accessed
09/5/04). http://pswmru.arsup.psu.edu/phosphorus/nprp.htm O’Connor G.A., H.A. Elliott, and P. Lu. 2001. Charactering water treatment residuals
phosphorus retention. Soil and Crop Sci. Soc. Florida Proc. 61:67-73. O’Connor, G.A and H.A. Elliott. 2000. Co-application of biosolids and water treatment
residuals. Final report. Florida Dept. of Environ. Protection, Tallahassee. O’Connor, G.A., D. Sakar, S.R., Brinton, H.A. Elliott, and F.G. Martin. 2004.
Phytoavailabilty of biosolids phosphorus. J. Environ. Qual. 33:703-712. O’Connor, G.A., H.A. Elliott, and P. Lu. 2001: Characterizing water treatment residuals
phosphorus retention. Soil Crop Sci. Soc. Florida Proc. 61:67-73. O’Connor, G.A., H.A. Elliott, D. Sarkar, and D.A Graetz. 2002. Charactering forms,
solubilities, bioavailabilities, and mineralization rates of phosphorus in biosolids, commercial fertilizers, and manures. Final Report, Water Env. Res. Foundation, Alexandria, VA.
Page, A.L. 1982. Methods of soil analysis. Part 2. Chemical and microbiological
properties. 2nd ed. Agron. Monogr. 9. ASA and SSSA, Madison, WI. Peters, J.M., and N.T. Basta. 1996. Reduction of excessive bioavailable phosphorus in
soils by using municipal and industrial wastes. J. Environ. Qual. 25: 1236-1241. Pierzynski, G.M., T. J. Logan, S.J. Triana, and J.M. Bigham. 1990a. Phosphorus
chemistry and mineralogy in excessively fertilized soils: Quantitative analysis of phosphorus rich particles. Soil Sci. Soc. Am. J. 54:1576-1583.
Pierzynski, G.M., J.T. Sims, and G.F. Vance. 2000. Soils and environmental chemistry
2nd ed. CRC Press, Boca Raton, Florida.
67
Rhue, R.D., and W.G Harris. 1999. Phosphorus sorption/desorption reactions in soils
and sediments. p.187-206. In Reddy, K.R., G.A. O’Connor, and C.L. Schelske (ed.) Phosphorus biogeochemistry in subtropical ecosystems. Lewis publishers, CRC Press LLC, Boca Raton, Florida.
Sawyer, C. N., P.L. McCarty, and G.F. Parkin. 1994. Chemistry for environmental
engineering. McGraw-Hill, Inc. New York. 596-6001. Schoumans, O.F. 2000. Determining the degree of phosphorus saturation in calcareous
soils. p . 31-34. In. Methods of phosphorus analysis for soils, sediments, residuals and waters. Southern Coop. Ser. Bull. 396. Coop. Ext. Serv., North Carolina State Univ., Raleigh.
Sharpley, A.N. 1997. Rainfall frequency and nitrogen and phosphorus runoff from soil
amended with poultry litter. J. Environ. Quality, 26:1127. Sharpley, A.N. 1999. Global issues of phosphorus in Terrestrial ecosystems. p.15-46. In
Reddy, K.R., G.A. O’Connor, and C.L. Schelske (ed.) Phosphorus biogeochemistry in subtropical ecosystems. Lewis publishers, CRC Press LLC, Boca Raton, Florida.
Sharpley, A.N. S.C. Chapra, R. Wedepohl, J.T. Sims, T.C. Daniel, and K.R. Reddy.
1994. Managing agricultural phosphorus for protection of surface waters: Issues and options. J. Environ. Qual. 23: 437-451.
Sims, J.T., R.R. Simrad, and B.C. Joern. 1998. Phosphorus loss in agricultural drainage:
Historical perspective and current research. J. Environ. Qual. 27: 277-293. Smith, D.R., P.A. Moore, Jr., C.V. Maxwell, B. E. Haggard, and T.C. Daniel. 2004.
Reducing phosphorus runoff from swine manure with dietary phytase and aluminum chloride. J. Environ. Qual. 33: 799-1176.
Soil Survey Staff. 1996. Keys to soil taxonomy. U.S. Gov. Print. Office, Washington
D.C. Sposito, G. 1989. The chemistry of soils. Oxford University Press. New York.
Thomann, R.V., and J.A. Mueller. 1987. Principles of surface water quality modeling and control. Harper Collins Publ., New York.
Tisdale, S.L., W.L. Nelson, and J.D. Beaton. 1985. Soil and fertilizer phosphorus. In Soil
Fertility and Fertilizers, 4th ed., Chapter 8: 189-248. Macmillan Publ. Co., New York.

68
Turner, B. L., M.J. Paphazy, P.M. Haygarth, and I.D. McKevlie, 2002. Inositol
phosphates in the environment. Philos. Trans. R. Soc. London Ser. B. 357:449-469.
USEPA. 1986. Measuring total organic carbon. Revision 0.0 USEPA. 1993. Methods for the determination of inorganic substances in environmental
samples. 356.1. Revision 2.0. USEPA. 1995. A process design manual: land application of sewage sludge and
domestic septage, EPA/625/R-95/001, Office of R & D, Cincinnati, Ohio. USEPA. 1995b. A guide to the biosolids risk assessments for the EPA part 503 rule.
EPA832-B-93-005. Washington DC. USGS. 1996. Regional evaluation of evapotranspiration. (Accessed 10/23/2004).
http://fl.water.usgs.gov/PDF_files/fs168_96_german.pdf Violante A., and L. Gianfreda. 1993. Competition in adsorption between phosphate and
oxalate on an aluminium hydroxide montmorillonite complex. Soil Sci. Soc. Am. J. 57. 1235-1241.
Walker, L.C. 2004. Vertical mobility and dynamics of phosphorus from fertilizer and
manure in sandy soils. M.Sc Thesis, Univ. Fl., Gainesville, Fl. 32611-0510.
BIOGRAPHICAL SKETCH
Michael, Miyittah-Kporgbe is a native of Ghana (West Africa). He graduated from
the University of Ghana, Legon, with Bsc. (Hons) degree (upper class division) in
agriculture (soil science major). After graduation, he taught briefly and later went back
to the University of Ghana for postgraduate study (M.Phil. soil science) and at the
University of Cape Coast, Ghana (post graduate diploma in education). In October 1998,
Michael won a Japanese Government Scholarship to Chiba University, Japan, where he
graduated with M.Phil. in environmental science (2002). He came to the University of
Florida, Soil and Water Science Department, in January 2003.
69