Embed Size (px)
Citation preview

1 | P a g e
Page | 1

Page 2 Source: Company, www.dynamiclevels.com
Banking to make poorer ric
Company’s Method & Process ……………………..……….……………….……3
Company’s Products ……………………………………………………………...…..4
Major findings from Analyst Meet …………………………………………….. 4
Guidance from Company’s Management ……………………………………. 6
Industry Outlook ………………………………..…………….………….….………. 7
Balance sheet……………………………………………………………………………..9
Key Ratios………………………............................….……..……………....….10
Investment Rationale………………………………………...………….......…....11

Page 3 Source: Company, www.dynamiclevels.com
About Bharat Finance Inclusion Ltd.
Microfinance has become an effective tool that can help bringing economic equilibrium and
reduce poverty. Bharat Financial ltd is one company that spread economic opportunity by
giving poor people access to financial services, such as credit and insurance.
Bharat Financial Inclusion is the largest microfinance company in India in terms of gross loan
portfolio. The company’s core business is providing small value loans and other basic
financial services to its customers, who are predominantly located in rural areas. The
company provides loans mainly for use in small businesses or for other income generating
activities and not for personal consumption. BHARAT FINANCE has an AUM of over INR8500.
CRS, with active customer base of over 5 MILLION and over 1,000 branches.
Bharat Finance Methodology & Process
BFIL distributes small loans that begin at Rs. 2,000 to Rs. 12,000 (about $44-$260) to poor
women so they can start and expand simple businesses and increase their incomes. Their
micro-enterprise range includes:
raising cows and goats in order to sell their milk
opening a village tea stall
BFIL uses the group lending mechanism where poor women guarantee each other’s loans.
Borrowers are provided financial literacy training and must pass a test before they are
allowed to avail loans. There are weekly meetings with borrowers which follow a highly
disciplined approach.
Re-payment rates on our collateral-free loans are more than 99% because of this systematic
process. BFIL also offers micro-insurance to the poor as well as financing for other goods and
services that can help them combat poverty.

Page 4 Source: Company, www.dynamiclevels.com
Company’s Products
1) Proprietary:
a) Income Generation Loans , Mid-term Loans, Long- term loans : These provide self-
employed women financial assistance to support their business enterprises, such as
raising livestock, running local retail shops called kirana stores, providing tailoring and
other assorted trades and services
b) Loans are offered to members for purchase of products like cook-stove/ solar light/
water purifier/ mobile phone/ bicycle and sewing machine to enhance their productivity
and income generation ability.
2) Distributor Products:
Life insurance – A weekly payment of Rs. 20 is to be made for the term of five years.
Upon death, disbursement made to the beneficiary for the full sum assured of Rs. 5,000
plus the account value, which is equal to the aggregate of the premiums paid plus interest
accrued, if any, less any charges for the administration of the policy .In the event where
the death is deemed an accidental death, the beneficiary receives Rs. 10,000 plus the
account value.
Major Findings from Analyst Meet:
1) Collection:
The states where there was no external interference the collection efficiency disrupted
for a while due to demonetization, but in many states like Bihar, Chhattisgarh,
Jharkhand and Orissa it got restored to normalcy at 99% plus.
States having external interference along with the impact of demonetization, the
collection efficiency got impacted which was quite evident in places like UP,
Maharashtra districts bordering Maharashtra and Karnataka, and parts of Madhya
Pradesh where few women have not paid their installments on time.

Page 5 Source: Company, www.dynamiclevels.com
That is in our view not due to any cash shortage at the village level or at the borrower
level but on account of local level interference – misrepresentation of the RBI circular
of 90-day dispensation on the provision. Subsequently because of elections lot of
these local politicians encouraging women not to pay promising them that they would
get them their loans waived.
Despite this, we see collection rates to the north of 80% in these states. Post the
elections we expect situation to normalize in couple of months in these states.
2) Disbursement:
Disbursements got impacted due to – non-availability of the cash in the system,
imposed restrictions on withdrawls from current account and self imposed norm i.e
disbursement to the centres with 100% collection efficiency. The above factors led to
de-growth in the portfolio by 6% QoQ.
However, disbursements have recovered back to pre-demonetisation levels. In
February, 2017, the Company reported disbursements of Rs.1358 crores as compared
to Rs.1188 crores in October, 2016.
3) Borrowing Cost:
The positive side to demonetization was that banks have materially cut their MCLR
which will lead to reduction in Company’s cost of borrowing anywhere between 35 to
50 basis points. The Company operates at 19.75% interest rate being the lowest
amongst the Private sector MFIs and we are operating at a spread of 8.7% vis-à-vis
10% stipulated by the RBI. Hence it can retain the benefit due to the reduction in cost
of borrowing, in forthcoming financial year.
4) Net Interest Margin (NIM):
NIM is down from 10.6% to 10.1%, primarily on the account of Rs. 14 crores loss on
short collections, which was reduced from the excess interest spread of securitizing
transactions. However if the same is added back, the Company will have a flat NIM on
Q-o-Q basis. In fact, the difference between the marginal cost of borrowing and the
weighted average of cost of borrowing, is about 40-50 bps. So, there is a positive gap

Page 6 Source: Company, www.dynamiclevels.com
there, which is going to play out in the next 2 to 3 quarters in NIM with the exception
of loss on short collections on off-balance sheet.
Guidance from Company’s Management: Opportunities:
1) Market leadership: The Company is the second largest MFI in India by Gross Loan
Portfolio. The Company believes that its consistent position among the leading
MFIs in the microfinance sector enhances its reputation.
2) Lowest cost lender: The Company has the lowest lending rate (19.75%) amongst
private sector MFIs. The lending rate of the company is lower by 2.25-4% than the
lending rate of other major NBFC-MFIs in India.
3) Improving profitability, stable financial condition and emphasis on asset and
liability management: Although the Company’s financial condition deteriorated in
the aftermath of events in Andhra Pradesh and the Company incurred losses during
FY12 and FY13, the Company satisfied all its debt repayment obligations even
during the Andhra Pradesh microfinance situation, that is, in FY12 and FY13, and
thereafter. Its revenues grew at a CAGR of 55.3% from FY13 to FY16, and the
Company reported a profit of 303 crores for FY16, the third consecutive year of
profit post the turnaround.
Risk:
1) Political Risk - The Company recognizes political risk as one of the major risks facing
the industry and believes that political risk can be mitigated through Responsible
lending and fair pricing.
Page 7 Source: Company, www.dynamiclevels.com
2) Concentration Risk - The Company aims to avoid unbalanced concentration in both its
loan portfolio and borrowings. To mitigate the concentration risk, the company has
well defined Geographic & Borrower dependence norms.
Borrowing dependence norms – In order to reduce dependence on a single borrower,
the Company has adopted a cap on borrowing from any single credit granter at 15%.
The share of borrowing from top 3 banks reduced significantly from 61% in March
2013 to 34% in March 2016.
3) Liquidity Risk - The Company places significant importance on liquidity management
and has a bias for liquidity mainly to address operational requirements and corporate
commitments
GUIDANCE FOR Q4, FY’17 & FY’18: “We think the last quarter was a temporary blip which might continue to this quarter as well.
We are confident that we will be able to disburse about Rs. 3,300 in Q4FY17 crores and we
will be able to maintain the portfolio at Rs. 8500 by March’17. However in the medium to
long run we are confident that we will be able to grow at 50% next year.” – Mr. M R Rao, MD
& CEO
Industry Outlook
The Microfinance industry continues to be one of the sectors in India that has a huge
potential for sustainable growth, based on industry reports. The MFI industry GLP
grew by 84% YoY while the disbursements during the year grew by 65% in FY16. The
industry grew by 69% in FY15 and 47% in FY14. As on March 2016, the MFI industry
served 3.25 crore clients.
World Bank and EDA Rural Systems’ reports indicate that 150 million households in
India require microcredit with an average credit requirement per household at `
20,000. This translates into an annual aggregate demand of ` 2,40,000 crore for
microcredit in India. Hence there is a huge demand-supply gap.

Page 8 Source: Company, www.dynamiclevels.com
Technical & Fundamental overview at Glance
EXCHANGE SYMBOL BHARATFIN (NSE)
Sector FINANCIAL SERVICES-NBFC
Current Price * (Rs.) 746
Face Value (Rs.) 10
52 Week High (Rs.) 939.00 (29-Jul-16)
52 Week Low (Rs.) 465.10 (27-Dec-16)
Life Time high (Rs.) 1491.50 (28-Sep-10)
Life Time low (Rs.) 54.30 (05-Jun-12)
Average Daily Movement [ADM] 30.78
Average Volume [20 days] 5358240
1 Month Return (%) 0.11
Standalone Trailing PE Ratio 18.60
Book Value 101.01
Market Cap 11645.07 (Cr)
% of Promoter holding pledged 0
The company does not have any
promotor’s pledge
Company is trading at PE Multiple of
18.15 gives company’s share price cope
to go up with improving fundamentals
The Chart shows that stock has corrected after
giving good movement from 400 to 850.
Page 9 Source: Company, www.dynamiclevels.com
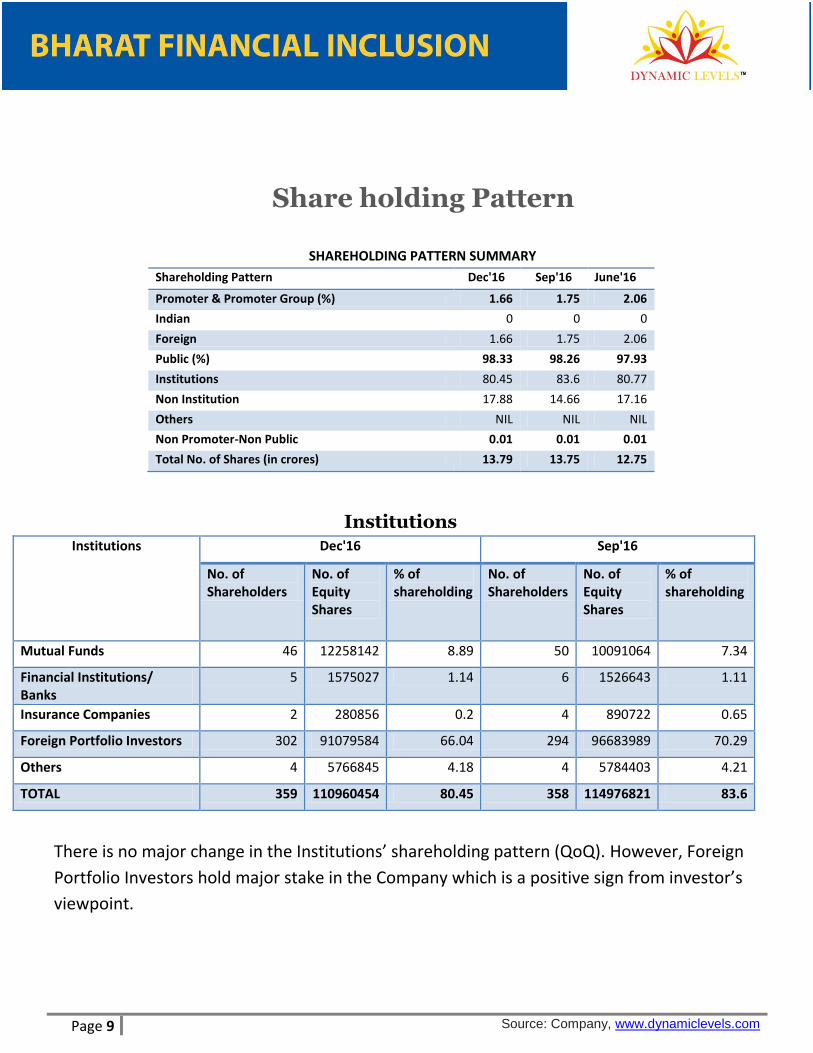
Share holding Pattern
There is no major change in the Institutions’ shareholding pattern (QoQ). However, Foreign
Portfolio Investors hold major stake in the Company which is a positive sign from investor’s
viewpoint.
SHAREHOLDING PATTERN SUMMARY
Shareholding Pattern Dec'16 Sep'16 June'16
Promoter & Promoter Group (%) 1.66 1.75 2.06
Indian 0 0 0
Foreign 1.66 1.75 2.06
Public (%) 98.33 98.26 97.93
Institutions 80.45 83.6 80.77
Non Institution 17.88 14.66 17.16
Others NIL NIL NIL
Non Promoter-Non Public 0.01 0.01 0.01
Total No. of Shares (in crores) 13.79 13.75 12.75
Institutions Institutions Dec'16 Sep'16
No. of Shareholders
No. of Equity Shares
% of shareholding
No. of Shareholders
No. of Equity Shares
% of shareholding
Mutual Funds 46 12258142 8.89 50 10091064 7.34
Financial Institutions/ Banks
5 1575027 1.14 6 1526643 1.11
Insurance Companies 2 280856 0.2 4 890722 0.65
Foreign Portfolio Investors 302 91079584 66.04 294 96683989 70.29
Others 4 5766845 4.18 4 5784403 4.21
TOTAL 359 110960454 80.45 358 114976821 83.6
Page 10 Source: Company, www.dynamiclevels.com
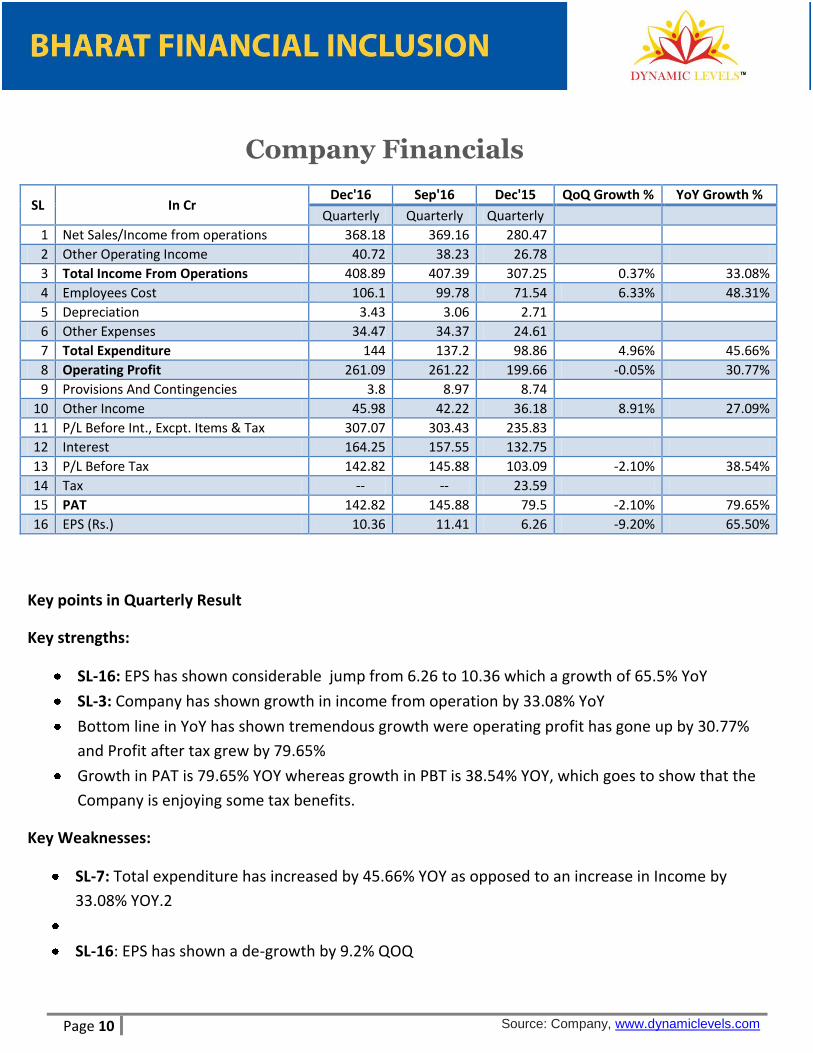
Company Financials
SL In Cr Dec'16 Sep'16 Dec'15 QoQ Growth % YoY Growth %
Quarterly Quarterly Quarterly
1 Net Sales/Income from operations 368.18 369.16 280.47
2 Other Operating Income 40.72 38.23 26.78
3 Total Income From Operations 408.89 407.39 307.25 0.37% 33.08%
4 Employees Cost 106.1 99.78 71.54 6.33% 48.31%
5 Depreciation 3.43 3.06 2.71
6 Other Expenses 34.47 34.37 24.61
7 Total Expenditure 144 137.2 98.86 4.96% 45.66%
8 Operating Profit 261.09 261.22 199.66 -0.05% 30.77%
9 Provisions And Contingencies 3.8 8.97 8.74
10 Other Income 45.98 42.22 36.18 8.91% 27.09%
11 P/L Before Int., Excpt. Items & Tax 307.07 303.43 235.83
12 Interest 164.25 157.55 132.75
13 P/L Before Tax 142.82 145.88 103.09 -2.10% 38.54%
14 Tax -- -- 23.59
15 PAT 142.82 145.88 79.5 -2.10% 79.65%
16 EPS (Rs.) 10.36 11.41 6.26 -9.20% 65.50%
Key points in Quarterly Result
Key strengths:
SL-16: EPS has shown considerable jump from 6.26 to 10.36 which a growth of 65.5% YoY
SL-3: Company has shown growth in income from operation by 33.08% YoY
Bottom line in YoY has shown tremendous growth were operating profit has gone up by 30.77%
and Profit after tax grew by 79.65%
Growth in PAT is 79.65% YOY whereas growth in PBT is 38.54% YOY, which goes to show that the
Company is enjoying some tax benefits.
Key Weaknesses:
SL-7: Total expenditure has increased by 45.66% YOY as opposed to an increase in Income by
33.08% YOY.2
SL-16: EPS has shown a de-growth by 9.2% QOQ

Page 11 Source: Company, www.dynamiclevels.com
Balance Sheet
Sl No. Particulars
March'16 12 mths
March15' 12 mths
March'14 12 mths
March'13 12 mths
1 EQUITIES AND LIABILITIES
2 SHAREHOLDER'S FUNDS
3 Equity Share Capital 127.31 126.29 108.21 108.21
4 Total Share Capital 127.31 126.29 108.21 108.21
5 Reserves and Surplus 1255.68 920.16 351 282.18
6 Total Reserves and Surplus 1255.68 920.16 351 282.18
7 Total Shareholders Funds 1383 1046.46 459.21 390.39
8 Equity Share Application Money 0 0.01 0 0
9 NON-CURRENT LIABILITIES
10 Long Term Borrowings 2268.74 1057.22 300.21 265.6
11 Long Term Provisions 20.89 12.72 186.22 263.26
12 Total Non-Current Liabilities 2289.63 1069.94 486.42 528.87
13 CURRENT LIABILITIES
14 Short Term Borrowings 644.32 609.63 332.35 570.52
15 Other Current Liabilities 2760.7 1927.19 1180.65 994.25
16 Short Term Provisions 76.05 45.51 38.56 27.42
17 Total Current Liabilities 3481.07 2582.32 1551.56 1592.19
18 Total Capital And Liabilities 7153.7 4698.73 2497.2 2511.45
19 ASSETS
20 NON-CURRENT ASSETS
21 Tangible Assets 11.42 5.15 6.59 8.47
22 Intangible Assets 3.61 3.8 3.09 2.71
23 Intangible Assets Under Development 1.42 1.24 1.5 0.13
24 Fixed Assets 16.45 10.2 11.18 11.31
25 Non-Current Investments 0.2 0.2 0.2 0.2
26 Long Term Loans And Advances 413.54 244.85 229.27 282.57
27 Other Non-Current Assets 179.27 125.23 32.85 36.43
28 Total Non-Current Assets 609.46 380.47 273.5 330.51
29 CURRENT ASSETS
30 Trade Receivables 6.37 3.42 5.11 0.16
31 Cash And Cash Equivalents 1766.28 1536.77 639.71 860.59
32 Short Term Loans And Advances 4608.02 2713.55 1523.5 1282.79
33 OtherCurrentAssets 163.57 64.51 55.38 37.4
34 Total Current Assets 6544.24 4318.26 2223.7 2180.94
35 Total Assets 7153.7 4698.73 2497.2 2511.45
Key strength in Balance sheet
SL-6: There has been phenomenal growth in Reserves & Surplus from Rs.282.18 crores to
Rs.1255.68 crores from 2013 to 2016.
SL-31: The Company has improved on it’s liquidity and has become cash rich over a span
of 3 years, with increase in liquidity over 300%.

Page 12 Source: Company, www.dynamiclevels.com
Clarification on “Bharat Financial close to merger deal with Induslnd Bank
and merger ration decided to be 10:7”
“We would like to clarify that the aforesaid news item is merely market speculation. As informed earlier, the Company has been exploring various options from time to time and will make an announcement in accordance with the relevant regulations as and when a transaction, if any, is approved by the Board. We further confirm that we have been complying with all our disclosure obligations under applicable law and are not aware of any information that ought to have been disclosed under the relevant regulations but has not been disclosed to the Exchange.” – Mr. Rajendra Patil, Executive Vice President – Legal & Company Secretary
Key Ratios Per Share Ratios March'16 March'15 March'14 Explanations Signals
Basic EPS (Rs.) 23.9 15.22 6.45
It has shown phenomenal growth as per annual trend Positive
Cash EPS (Rs.) 24.46 15.22 6.83
It has shown phenomenal growth as per annual trend Positive
Book Value/Share (Rs.) 108.63 82.86 42.44
Since Book Value is increasing, it is a good sign. YOY growth is 33% Positive
Profitability Ratios
PBDIT Margin (%) 75.85 65.91 55.52
Margins are improving at an increasing pace Positive
Net Profit Margin (%) 25.91 25.92 13.45
Return on Equity (%) 21.9 17.93 15.21 A healthy ROE is around 10% Positive
Return on Capital Employed (%) 8.24 8.86 7.38
Return on Assets (%) 4.23 3.99 2.79
Total Debt/Equity (X) 2.11 1.59 1.38
Since the Company is an NBFC, D/E Ratio is not significant.
Liquidity Ratios
Current Ratio (X) 1.88 1.67 1.43 Commonly accepted ratio is 1. Positive
Valuation Ratios
Enterprise Value (Cr.) 8094.14 5899.12 2209.59
Price/BV (X) 5.02 5.51 4.83
Price/BV till 7 does not have a negative impact as per studies. Positive
Page 13 Source: Company, www.dynamiclevels.com
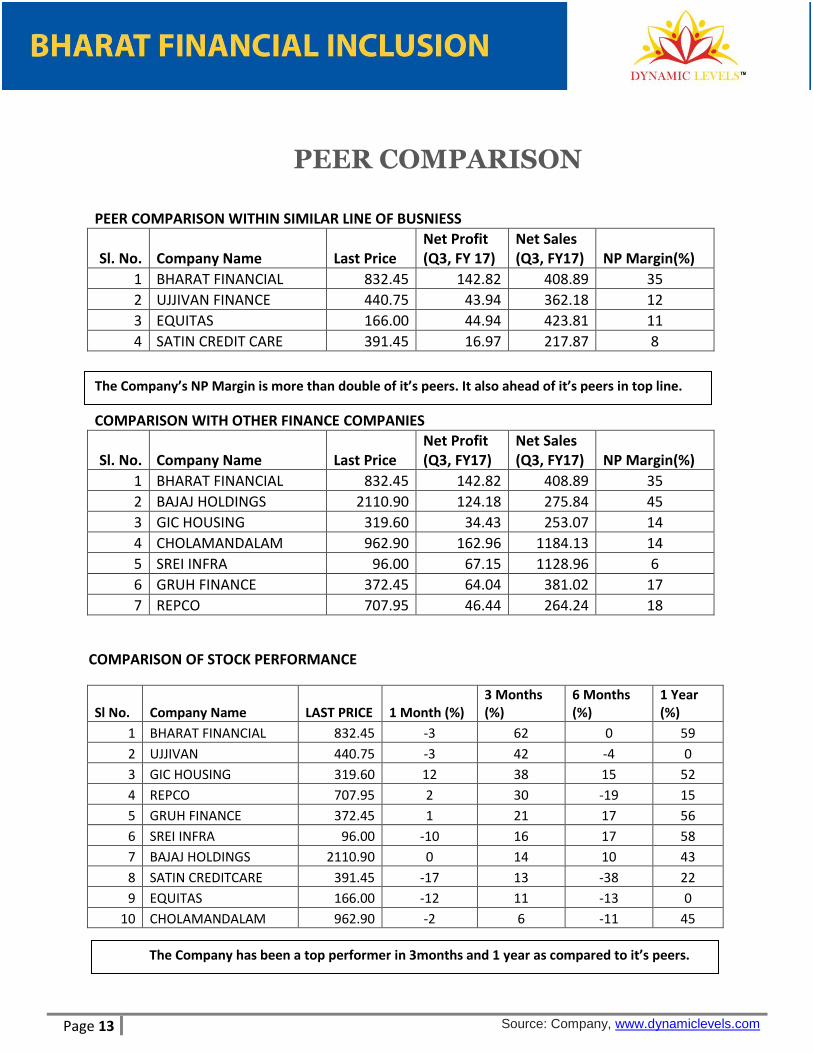
PEER COMPARISON
PEER COMPARISON WITHIN SIMILAR LINE OF BUSNIESS
Sl. No. Company Name Last Price Net Profit (Q3, FY 17)
Net Sales (Q3, FY17) NP Margin(%)
1 BHARAT FINANCIAL 832.45 142.82 408.89 35
2 UJJIVAN FINANCE 440.75 43.94 362.18 12
3 EQUITAS 166.00 44.94 423.81 11
4 SATIN CREDIT CARE 391.45 16.97 217.87 8
COMPARISON WITH OTHER FINANCE COMPANIES
Sl. No. Company Name Last Price Net Profit (Q3, FY17)
Net Sales (Q3, FY17) NP Margin(%)
1 BHARAT FINANCIAL 832.45 142.82 408.89 35
2 BAJAJ HOLDINGS 2110.90 124.18 275.84 45
3 GIC HOUSING 319.60 34.43 253.07 14
4 CHOLAMANDALAM 962.90 162.96 1184.13 14
5 SREI INFRA 96.00 67.15 1128.96 6
6 GRUH FINANCE 372.45 64.04 381.02 17
7 REPCO 707.95 46.44 264.24 18
COMPARISON OF STOCK PERFORMANCE
Sl No. Company Name LAST PRICE 1 Month (%) 3 Months (%)
6 Months (%)
1 Year (%)
1 BHARAT FINANCIAL 832.45 -3 62 0 59
2 UJJIVAN 440.75 -3 42 -4 0
3 GIC HOUSING 319.60 12 38 15 52
4 REPCO 707.95 2 30 -19 15
5 GRUH FINANCE 372.45 1 21 17 56
6 SREI INFRA 96.00 -10 16 17 58
7 BAJAJ HOLDINGS 2110.90 0 14 10 43
8 SATIN CREDITCARE 391.45 -17 13 -38 22
9 EQUITAS 166.00 -12 11 -13 0
10 CHOLAMANDALAM 962.90 -2 6 -11 45
The Company’s NP Margin is more than double of it’s peers. It also ahead of it’s peers in top line.
The Company has been a top performer in 3months and 1 year as compared to it’s peers.

Page 14 Source: Company, www.dynamiclevels.com
On 28th March 2017, Bharat Finance Inclusion Ltd. share price is
trading @Rs.746, P/E 17.40 (Industry P/E 30). We recommend
BUY in Bharat Finance Inclusion Ltd with the target of Rs910
(Short term) & Rs.1150 (Long Term). It is a Multibagger Stock
recommended by Dynamiclevels.
Investment rationale 1) FAVORABLE MACROS:
Huge demand-supply gap in MFI Sector
Entry barriers and supervisory standards are significantly enhanced thwarting
future competition
No credible alternative for microfinance emerges even after 6 years of AP MFI
Act
2) COMPETITIVE ADVANTAGE:
BFIL is the most efficient and lowest cost MFI lender ,
Impeccable track record of meeting financial obligations in a timely manner even
during the black swan event of AP-MFI Crisis.
Diversified earnings stream with cross-sell / Non-Loan revenue contributing 4%
to PAT for Q3FY17.
Pan-India presence with no unbalanced geographic sectoral exposure.
Strong solvency (Capital Adequacy of 36.2% as onQ3, FY17) and sufficient
liquidity.
Steady state RoA of 4% is the highest among financial services play
3) FINANCIAL PERFORMANCE:
Profit for the period of Rs. 143 Crs. in Q3FY17 (growth of 80% YoY) and Rs. 428
Crs for 9MFY17 (growth of 96% YoY)
A 35% growth (YOY) in Income from Operations has been delivered by the
Company.
Weighted avg. cost of borrowing reduced to 10.8% in Q3FY17 from 11.0% in
Q2FY17

Page 15 Source: Company, www.dynamiclevels.com
Disclaimer: Research Disclaimer and Disclosure inter-alia as required under Securities and Exchange Board of India (Research Analysts) Regulations, 2014. Dynamic Equities Pvt. Ltd. is a member of National Stock Exchange of India Ltd. (NSEIL), Bombay Stock Exchange Ltd (BSE), Multi Stock Exchange of India Ltd (MCX-SX) and also a depository participant with National Securities Depository Ltd (NSDL) and Central Depository Services Ltd.(CDSL). Dynamic is engaged in the business of Stock Broking, Depository Services, Investment Advisory Services and Portfolio Management Services. Dynamic Equities Pvt. Ltd. is holding company of Dynamic Commodities Pvt. Ltd. , a member of Multi Commodities Exchange (MCX) & National Commodity & Derivatives Exchange Ltd.(NCDEX). We hereby declare that our activities were neither suspended nor we have defaulted with any stock exchange authority with whom we are registered. SEBI, Exchanges and Depositories have conducted the routine inspection and based on their observations have issued advise letters or levied minor penalty on for certain operational deviations. Answers to the Best of the knowledge and belief of Dynamic/ its Associates/ Research Analyst who prepared this report
DYANMIC/its Associates/ Research Analyst/ his Relative have any financial interest in the subject company? No
DYANMIC/its Associates/ Research Analyst/ his Relative have actual/beneficial ownership of one per cent or more securities of the subject company? No
DYANMIC/its Associates/ Research Analyst/ his Relative have any other material conflict of interest at the time of publication of the research report or at the time of public appearance? No
DYANMIC/its Associates/ Research Analyst/ his Relative have received any compensation from the subject company in the past twelve months? No
DYANMIC/its Associates/ Research Analyst/ his Relative have managed or co-managed public offering of securities for the subject company in the past twelve months? No
DYANMIC/its Associates/ Research Analyst/ his Relative have received any compensation for investment banking or merchant banking or brokerage services from the subject company in the past twelve months? No
DYANMIC/its Associates/ Research Analyst/ his Relative have received any compensation for products or services other than investment banking or merchant banking or brokerage services from the subject company in the past twelve months? No
DYANMIC/its Associates/ Research Analyst/ his Relative have received any compensation or other benefits from the Subject Company or third party in connection with the research report? No
DYANMIC/its Associates/ Research Analyst/ his Relative have served as an officer, director or employee of the subject company? No
DYANMIC/its Associates/ Research Analyst/ his Relative have been engaged in market making activity for the subject company? No
General Disclaimer: - This Research Report (hereinafter called “Report”) is meant solely for use by the recipient and is not for circulation. This Report does not constitute a personal recommendation or take into account the particular investment objectives, financial situations, or needs of individual clients. The recommendations, if any, made herein are expression of views and/or opinions and should not be deemed or construed to be neither advice for the purpose of purchase or sale of any security, derivatives or any other security through Dynamic nor any solicitation or offering of any investment /trading opportunity on behalf of the issuer(s) of the respective security (ies) referred to herein. These information / opinions / views are not meant to serve as a professional investment guide for the readers. No action is solicited based upon the information provided herein. Recipients of this Report should rely on information/data arising out of their own investigations. Readers are advised to seek independent professional advice and arrive at an informed trading/investment decision before executing any trades or making any investments. This Report has been prepared on the basis of publicly available information, internally developed data and other sources believed by Dynamic to be reliable. Dynamic or its directors, employees, affiliates or representatives do not assume any responsibility for, or warrant the accuracy, completeness, adequacy and reliability of such information / opinions / views. While due care has been taken to ensure that the disclosures and opinions given are fair and reasonable, none of the directors, employees, affiliates or representatives of Dynamic shall be liable for any direct, indirect, special, incidental, consequential, punitive or exemplary damages, including loss profits arising in any way whatsoever from the information / opinions / views contained in this Report. The price and value of the investments referred to in this Report and the income from them may go down as well as up, and investors may realize losses on any investments. Past performance is not a guide for future performance. Dynamic levels do not provide tax advice to its clients, and all investors are strongly advised to consult with their tax advisers regarding taxation aspects of any potential investment. Opinions expressed are our current opinions as of the date appearing on this Research only. We do not undertake to advise you as to any change of our views expressed in this Report. User should keep this risk in mind and not hold dynamic levels, its employees and associates responsible for any losses, damages of any type whatsoever. Dynamic and its associates or employees may; (a) from time to time, have long or short positions in, and buy or sell the investments in/ security of company (ies) mentioned herein and it may not be construed as potential conflict of interest with respect to any recommendation and related information and opinions. Without limiting any of the foregoing, in no event shall Dynamic and its associates or employees or any third party involved in, or related to computing or compiling the information have any liability for any damages of any kind. We and our affiliates/associates, officers, directors, and employees, Research Analyst(including relatives) worldwide may: (a) from time to time, have long or short positions in, and buy or sell the securities thereof, of company (ies) mentioned herein or (b) be engaged in any other transaction involving such securities and earn brokerage or other compensation or act as a market maker in the financial instruments of the subject company/company (ies) discussed herein or act as advisor to such company (ies) or have other potential/material conflict of interest with respect to any recommendation and related information and opinions at the time of publication of Research Report. Dynamic may have proprietary long/short position in the above mentioned scrip(s) and therefore may be considered as interested. The views provided herein are general in nature and does not consider risk appetite or investment objective of particular investor; readers are requested to take independent professional advice before investing. This should not be construed as invitation or solicitation to do business with Dynamic. Dynamic Equities Pvt. Ltd. are also engaged in Proprietary Trading apart from Client Business.
https://www.dynamiclevels.com/en/disclaimer


![Actigomenroute [PDF, 2 blz, 3,41 MB] · 0 0 0 0 0 0 0 0 0 0 0 0 0 0 0 0 0 0 0 0 0 0 0 0 0 0 0 0 0 0 0 0 60 0 0 0 0 0 5 5 0 60 60 0 0 0 0 0 0 0 0 5 5 0 0 60 60 0 0 0 0 0 0 0 0 0 0](https://img.dokumen.tips/doc/110x75/60c8b2b62084147a4c1c9962/actigomenroute-pdf-2-blz-341-mb-0-0-0-0-0-0-0-0-0-0-0-0-0-0-0-0-0-0-0-0-0-0.jpg)


![[XLS]data. · Web view0. 0. 2. 0. 0. 0. 0. 0. 0. 0. 0. 0. 0. 0. 0. 0. 0. 0. 0. 0. 0. 0. 0. 0. 0. 0. 0. 0. 0. 0. 0. 0. 0. 0. 0. 0. 0. 0. 0. 0. 0. 0. 0. 0. 0. 0. 0. 0. 0. 0. 0. 0. 0](https://img.dokumen.tips/doc/110x75/5ab13df97f8b9ac66c8c4034/xlsdata-view0-0-2-0-0-0-0-0-0-0-0-0-0-0-0-0-0-0-0-0-0-0.jpg)