Embed Size (px)
Citation preview

Philips Lighting reports 0.5% full year comparable sales growth, 10% operational profitability and EUR 403 million free cash flow
Q4 & Full Year 2017 presentation
February 2, 2018
Important information
2
Forward-Looking Statements and Risks & Uncertainties
This document and the related oral presentation contain, and responses to questions following the presentation may contain, forward-looking statements that reflect the intentions, beliefs or current expectations and projections of Philips Lighting N.V. (the “Company”, and together with its subsidiaries, the “Group”), including statements regarding strategy, estimates of sales growth and future operational results.
By their nature, these statements involve risks and uncertainties facing the Company and its Group Companies and a number of important factors could cause actual results or outcomes to differ materially from those expressed in any forward-looking statement as a result of risks and uncertainties. Such risks, uncertainties and other important factors include but are not limited to: adverse economic and political developments, the impacts of rapid technological change, competition in the general lighting market, development of lighting systems and services, successful implementation of business transformation programs, impact of acquisitions and other transactions, impact of the Group’s operation as a separate publicly listed company, pension liabilities and costs, establishment of corporate and brand identity, adverse tax consequences from the separation from Royal Philips and exposure to international tax laws. Please see “Risk Factors and Risk Management” in Chapter 12 of the Annual Report 2016 for discussion of material risks, uncertainties and other important factors which may have a material adverse effect on the business, results of operations, financial condition and prospects of the Group. Such risks, uncertainties and other important factors should be read in conjunction with the information included in the Company’s Annual Report 2016 and the semi-annual report for 2017.
Additional risks currently not known to the Group or that the Group has not considered material as of the date of this document could also prove to be important and may have a material adverse effect on the business, results of operations, financial condition and prospects of the Group or could cause the forward-looking events discussed in this document not to occur. The Group undertakes no duty to and will not necessarily update any of the forward-looking statements in light of new information or future events, except to the extent required by applicable law.
Market and Industry Information
All references to market share, market data, industry statistics and industry forecasts in this document consist of estimates compiled by industry professionals, competitors, organizations or analysts, of publicly available information or of the Group’s own assessment of its sales and markets. Rankings are based on sales unless otherwise stated.
Non-IFRS Financial Statements
Certain parts of this document contain non-IFRS financial measures and ratios, such as comparable sales growth, adjusted gross margin, EBITA, adjusted EBITA, EBITDA, adjusted EBITDA and free cash flow, and other related ratios, which are not recognized measures of financial performance or liquidity under IFRS. The non-IFRS financial measures presented are measures used by management to monitor the underlying performance of the Group’s business and operations and, accordingly, they have not been audited or reviewed. Not all companies calculate non-IFRS financial measures in the same manner or on a consistent basis and these measures and ratios may not be comparable to measures used by other companies under the same or similar names. A reconciliation of these non-IFRS financial measures to the most directly comparable IFRS financial measures is contained in this document. For further information on non-IFRS financial measures, see “Chapter 17 Reconciliation of non-IFRS measures” in the Annual Report 2016.
Presentation
All amounts are in millions of euros unless otherwise stated. Due to rounding, amounts may not add up to totals provided. All reported data are unaudited. Unless otherwise indicated, financial information has been prepared in accordance with the accounting policies as stated in the Annual Report 2016.
Market Abuse Regulation
This presentation contains information within the meaning of Article 7(1) of the EU Market Abuse Regulation.

AgendaWelcome & introduction by Eric Rondolat
Highlights for Q4 2017 by Stéphane Rougeot
Highlights for the year 2017 by Eric Rondolat
Outlook & conclusion by Eric Rondolat
Q&A

Welcome & introduction
• Returned to positive comparable sales growth in 2017, driven by the growth of LED and connected lighting Systems & Services, which demonstrates the successful execution of our strategy
• Operational profitability improved by 90 basis points to 10%• Delivered free cash flow of EUR 403m• Home exceeded the break-even level
• Continued progress to achieve strategic goals and medium-term financial objectives• Executing concrete actions to continue to improve our cost base• Continue to invest in growth opportunities, provide a return to shareholders and optimize our balance sheet
• Improved customer Net Promoter Score and remain committed to meeting the needs of our customers through innovation
• Sustainability is at the core of our strategy; honored #1 in the Electrical Components and Equipment category of the Dow Jones Sustainability Index
4

AgendaWelcome & introduction by Eric Rondolat
Highlights for Q4 2017 by Stéphane Rougeot
Highlights for the year 2017 by Eric Rondolat
Outlook & conclusion by Eric Rondolat
Q&A

6
Growth and margin improvement mainly driven by Professional & Home
4Q17 CSG %Adjusted
EBITA (EURm)vs LY (EURm)
Adjusted EBITA %
vs LY (bps)
Lamps
LED
Professional
Home
Philips Lighting
-18.4%
5.1%
11.2%
37.3%
3.0%
76
46
95
20
207
-34
-7
+44
+17
+19
17.3%*
10.4%
12.2%
8.5%
10.9%
-180
-160
+530
+680
+120
* Includes a one-off (non-cash) negative impact of 120 bps from adjusting the calculation method for unrealized intercompany profits

Increased profitability driven by Professional and Home
7
200 bps
Home
10 bps
10.9%
Adjusted EBITA margin 4Q17
60 bps
-40 bps
Lamps ProfessionalLED OtherAdjusted EBITA margin 4Q16
-120 bps
9.7%

188 19 -91
7220 10 -10 207
Q4 2016 Volume / Mix Price CoGS Indirect Costs Currency OBI Q4 2017
Adjusted EBITA margin improvement primarily driven by procurement & productivity savings and indirect cost reductions
8
Adjusted EBITA (EURm)
as % of sales +120 bps9.7% 10.9%
*
* Other business income includes the sale of real estate last year
Gross margin + 10 bps

Lamps margin impacted by continued significant top-line decline
9
Key observations for Q4 2017
• Comparable sales declined by 18.4%
• We estimate that the conventional lighting market declined at a faster pace than our Lamps business, which has resulted in continued market share gains
• Adjusted EBITA margin declined by 180 bps to 17.3% due to:• Negative one-off impact of 120 bps from adjusting the
calculation method for unrealized intercompany profits
• Sales decline, partly offset by procurement, productivity and adjusted indirect cost savings
Sales (in EURm) & comparable sales growth (in %)
Adjusted EBITA (in EURm & as % of sales)
-180 bps
576 498 458 423 442
-18.5% -17.9% -18.2% -20.2% -18.4%
4Q16 1Q17 2Q17 3Q17 4Q17
110 114 95 85 76
19.1%
22.9%20.7% 20.0%
17.3%
20.9%18.5%
4Q16 1Q17 2Q17 3Q17 4Q17Excl. real estate gain in 1Q17, and 4Q17 one-off (non-cash) negative impact from adjusting the calculation method for unrealized intercompany profits
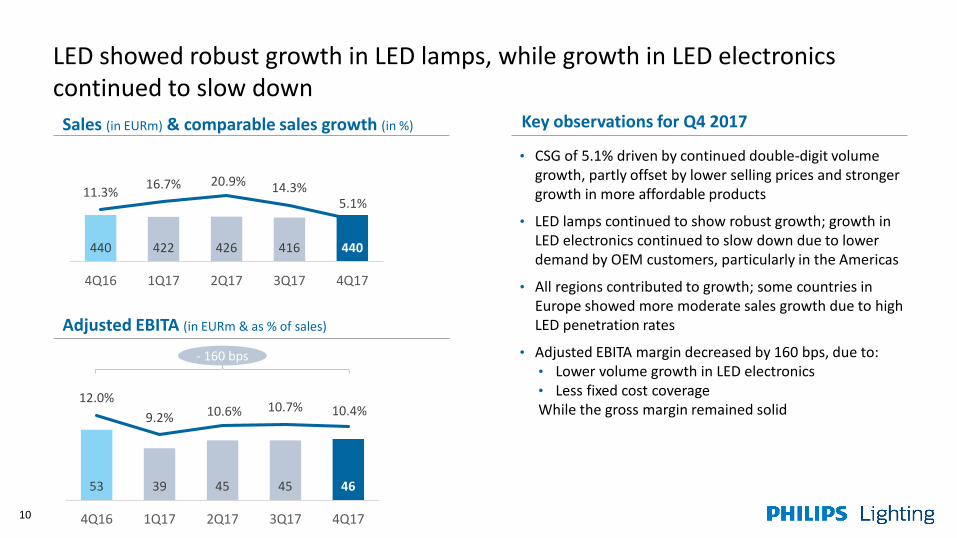
LED showed robust growth in LED lamps, while growth in LED electronics continued to slow down
10
Key observations for Q4 2017
• CSG of 5.1% driven by continued double-digit volume growth, partly offset by lower selling prices and stronger growth in more affordable products
• LED lamps continued to show robust growth; growth in LED electronics continued to slow down due to lower demand by OEM customers, particularly in the Americas
• All regions contributed to growth; some countries in Europe showed more moderate sales growth due to high LED penetration rates
• Adjusted EBITA margin decreased by 160 bps, due to:• Lower volume growth in LED electronics• Less fixed cost coverageWhile the gross margin remained solid
Sales (in EURm) & comparable sales growth (in %)
Adjusted EBITA (in EURm & as % of sales)
- 160 bps
440 422 426 416 440
11.3%16.7% 20.9% 14.3%
5.1%
4Q16 1Q17 2Q17 3Q17 4Q17
53 39 45 45 46
12.0%
9.2% 10.6% 10.7% 10.4%
4Q16 1Q17 2Q17 3Q17 4Q17

Professional significantly improved CSG and profitability
11
Key observations for Q4 2017
• CSG of 11.2%; all regions contributed to growth
• Performance in Europe and Rest of the World continued to be solid
• Comparable sales trend in the US improved compared to previous quarters, benefiting from:• Sales improvement initiatives• Revenues related to a large-scale project
• Market conditions in Saudi Arabia remained challenging, impacting CSG by -330bps
• Adjusted EBITA margin increased by 530 bps to 12.2%, driven by:• Operational leverage• Manufacturing footprint rationalization• Indirect cost savings
Sales (in EURm) & comparable sales growth (in %)
Adjusted EBITA (in EURm & as % of sales)
¹KSA: Kingdom of Saudi Arabia
CSG incl. KSA¹ CSG excl. KSA¹
+ 530 bps
734 621 668 685 781
0.1% 2.5%-2.7%
7.0%11.2%
3.6% 3.8%-1.0%
10.1% 14.4%
4Q16 1Q17 2Q17 3Q17 4Q17
51 13 48 69 95
6.9%
2.1%
7.2%10.1%
12.2%
4Q16 1Q17 2Q17 3Q17 4Q17

Home showed solid growth and profitability improvement
12
Key observations for Q4 2017
• Strong CSG at 37.3%:• Significant growth in Home Systems• Solid growth in Home Luminaires
• Adjusted EBITA margin improved by 680 bps to 8.5%, driven by:• Operational leverage• Procurement savings
Sales (in EURm) & comparable sales growth (in %)
Adjusted EBITA (in EURm & as % of sales)
178 148 146 158 232
8.8%
20.6%15.5%
28.1%37.3%
4Q16 1Q17 2Q17 3Q17 4Q17
3 3 12 2 20
1.7% 2.0%
8.2%
1.4%8.5%
-2.1%
4Q16 1Q17 2Q17 3Q17 4Q17
Margin incl. real estate gain Margin excl. real estate gain
+ 680 bps
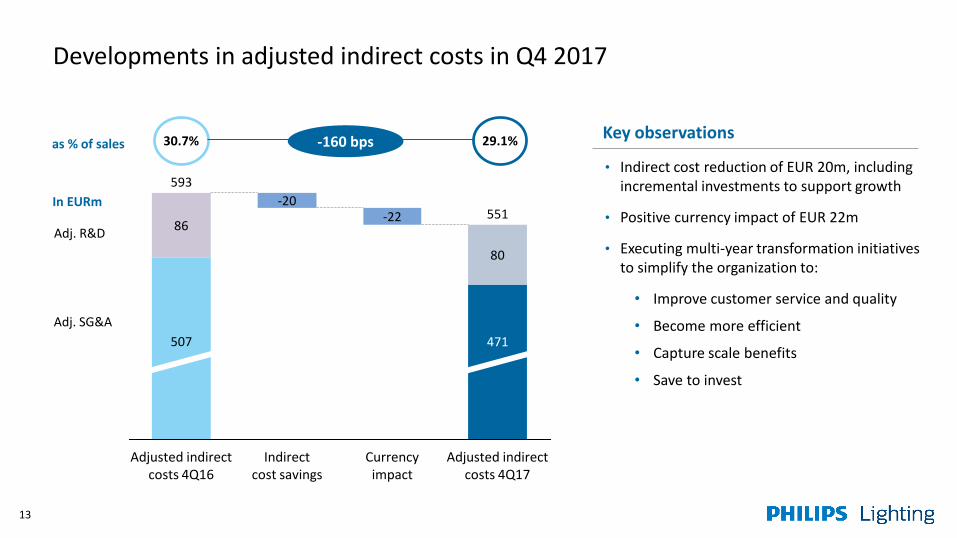
Developments in adjusted indirect costs in Q4 2017
13
Key observations
• Indirect cost reduction of EUR 20m, including incremental investments to support growth
• Positive currency impact of EUR 22m
• Executing multi-year transformation initiatives to simplify the organization to:
• Improve customer service and quality
• Become more efficient
• Capture scale benefits
• Save to invest
Adj. SG&A
Adj. R&D
as % of sales 30.7% 29.1%
In EURm
-160 bps
437
593
Adjusted indirect costs 4Q16
Indirect cost savings
-20
Adjusted indirect costs 4Q17
471
80
551
Currencyimpact
-2286
507

14
Benefits of the transformation initiatives increasingly visible from H2 2018
Savings in the adjusted indirect cost base
• Achieved EUR 66m savings in FY17, including incremental investments to support growth
• Additional savings should become particularly visible in the second half of 2018 and in 2019
Peerbenchmark range
Adjusted indirect costs (as % of sales) Transformation initiatives
31.7%
31.5%
29.0%
2016 2017 Medium term
25.0%
Actions underway to drive benefits across multiple levers:
Organization
Processes
Footprint
Sourcing
• Consolidate and rationalize businesses, flatten organizational structure
Products
• Reduce industrial and office locations
• Simplify our portfolios across businesses and reduce product variants
• Digitize and automate processes, establish shared service centres, improve IT landscape
• Improve demand management, simplify requirements, strengthen supplier relationships
Continue to invest in innovation, infrastructure and go-to-market to drive growth

Working capital as % of sales decreased by 130 basis points y-o-y to 8.0% despite higher inventories
1515
Working capital1 (in EURm & as % of sales) Inventories (in EURm & as % of sales)
1 Working capital includes inventories, receivables, accounts and notes payable, other current assets & liabilities, derivative financial assets & liabilities, income tax receivable & payable, and accrued liabilities
-130 bps
+80 bps
695 769 837 557
9.8%10.9%
11.9%
8.0%
1Q17 2Q17 3Q17 4Q17
865 895 809 662
11.6% 12.2% 11.2%9.3%
1Q16 2Q16 3Q16 4Q16
982 1,082 1,137 924
13.8%15.3% 16.2%
13.3%
1Q17 2Q17 3Q17 4Q17
1,010 1,030 999 886
13.6% 14.1% 13.8% 12.5%
1Q16 2Q16 3Q16 4Q16

Solid Free Cash Flow decreases net debt by EUR 342m
16
FCF: EUR 434m
In EURm
*) This is mainly related to cash flow hedges, pension interest expense and share based compensation
709
Change in working capital
163
Net debt end 3Q17
22
EBITDA Net debt end of 4Q17
Share repurchase
Interest & tax
3521
259367
190
23
Change in provisions
Net capex OtherOther FCF items*
Net leverage stable at 0.5x versus last year

AgendaWelcome & introduction by Eric Rondolat
Highlights for Q4 2017 by Stéphane Rougeot
Highlights for the year 2017 by Eric Rondolat
Outlook & conclusion by Eric Rondolat
Q&A
Progress in 2017
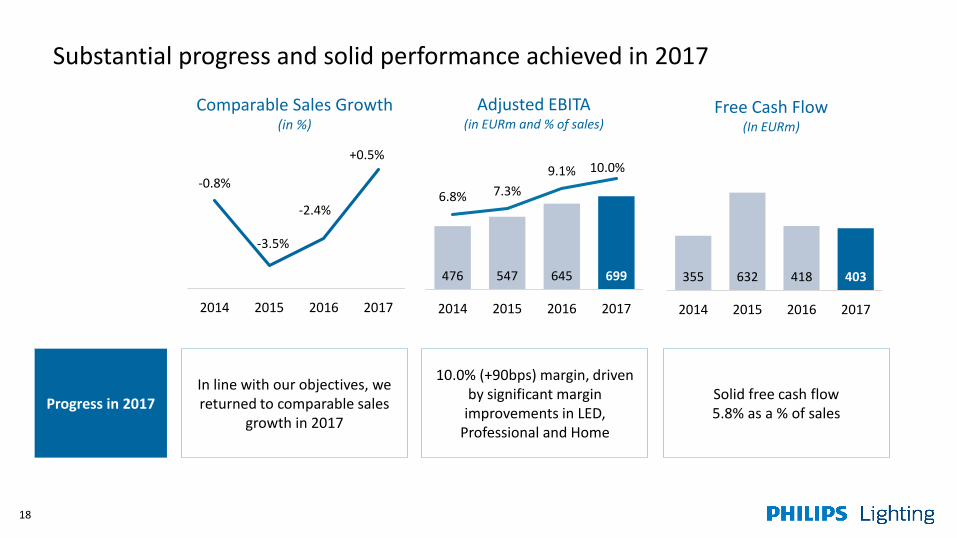
Substantial progress and solid performance achieved in 2017
-0.8%
-3.5%
-2.4%
+0.5%
2014 2015 2016 2017
Comparable Sales Growth(in %)
476 547 645 699
6.8% 7.3%
9.1% 10.0%
2014 2015 2016 2017
Adjusted EBITA (in EURm and % of sales)
In line with our objectives, we returned to comparable sales
growth in 2017
10.0% (+90bps) margin, driven by significant margin
improvements in LED, Professional and Home
Solid free cash flow5.8% as a % of sales
18
355 632 418 403
2014 2015 2016 2017
Free Cash Flow(In EURm)

Solid performance improvements across all business groups in 2017
19
Lamps CSG (%) and Adj. EBITA margin (%) LED CSG (%) and Adj. EBITA margin (%)
Professional CSG (%) and Adj. EBITA margin (%) Home CSG (%) and Adj. EBITA margin (%)
CSG excl. impact Saudi Arabia
20.2% 20.3%
-15.8%-18.6%
FY16 FY17
9.4% 10.2%
16.1%13.8%
FY16 FY17
5.4%
8.2%-0.5%
4.6%
3.6%7.0%
FY16 FY17-3.6%
5.2%11.0%
26.5%
FY16 FY17
• Margin benefited from pro-active rationalization of manufacturing footprint, productivity and procurement savings
• Higher volumes due to lower selling prices & stronger growth in affordable products
• Margin improvement driven by continued operational leverage, procurement savings and innovation
• CSG driven by robust growth in Europe and the Rest of the World
• Margin improvement driven by operational leverage, procurement savings, cost reductions and a positive mix impact
• CSG driven by sustained growth in both Home Systems and Home Luminaires
• Margin improvement driven by operational leverage and procurement savings
3.1%
Impact real estate gain

-30
76
46
95
20
4Q17
-94 -106
472370
142
174
145 225
-20
36
2016 2017
Adjusted EBITA continued to increase, while profit drivers are shifting
20
Adjusted EBITA (EURm)
645699
207
* Percentages represent Lamps’ contribution to adj. EBITA excl Other
Lamps OtherHome LEDProfessional
64%*46%*
32%*
Lamps represented 32%* of Adjusted EBITA (excl. Other) in 4Q17 compared to 64%* in full year 2016

Sound progress made on our strategic priorities during 2017
Proof points in 2017Strategic priorities
Optimize cash from conventional products to fund our growth
Innovate in LED products commercially and technologically to outgrow the market
Lead the shift to Systems, building the largest connected installed base
Capture adjacent value through new Services business models
Be our customers’ best business partner locally, leveraging our global scale
Continue our operational excellence improvement journey
• Free cash flow as % of sales for Lamps improved by 400 bps
• LED lighting share increased from 55% to 65% of total sales
• Connected Systems & Services, for consumers and professionals, represented more than EUR 900m of sales in 2017, CSG +51%• Professional Systems & Services sales of around EUR 650m • Home Systems sales of close to EUR 300m
• Customer Net Promoter Score improved by 14%
• Adjusted EBITA margin improved by 90 basis points to 10.0%• Indirect costs reduced by EUR 66m, incl. investments for growth
21
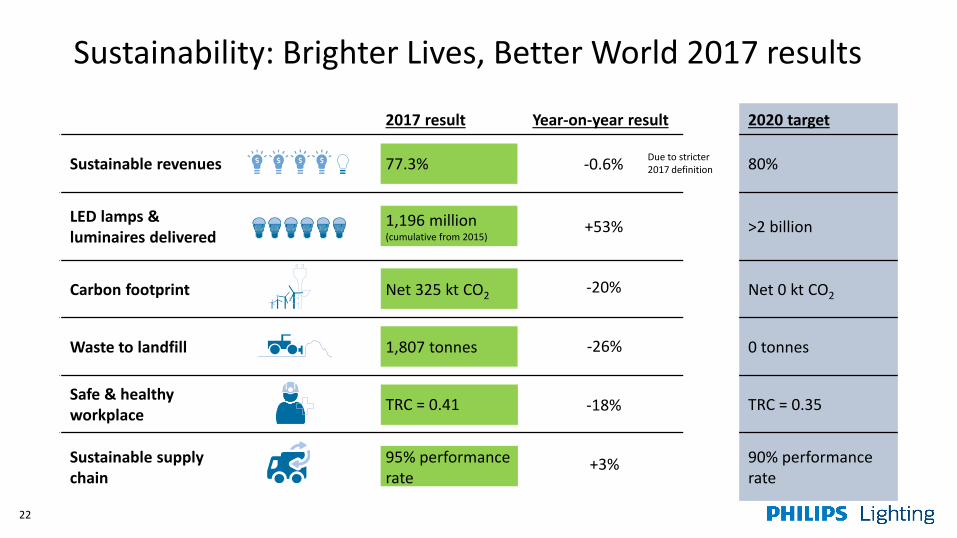
2017 result Year-on-year result 2020 target
Sustainable revenues 77.3% 80%
LED lamps & luminaires delivered
1,196 million(cumulative from 2015)
>2 billion
Carbon footprint Net 325 kt CO2 Net 0 kt CO2
Waste to landfill 1,807 tonnes 0 tonnes
Safe & healthy workplace
TRC = 0.41 TRC = 0.35
Sustainable supply chain
95% performance rate
90% performance rate
Sustainability: Brighter Lives, Better World 2017 results
22
-0.6%
+53%
-20%
-18%
-26%
+3%
Due to stricter 2017 definition

Capital allocation policy
Cash uses
Cash available
• Continued free cash flow generation
• Managing our financial ratios to maintain a financing structure compatible with an investment-grade profile
• Dividend pay-out within 40-50% of continuing net
income*
• Share repurchases
• Balance sheet optimization
• Seizing non-organic opportunities primarily through
small- to medium-sized acquisitions
*Continuing net income: recurring net income from continuing operations, or net income excluding discontinued operations and excluding material non-recurring items such as restructuring, acquisition-related and separation charges
23
2017
EUR 403m free cash flow
Net leverage stable at 0.5x
Dividend paid of EUR 157m Pay-out of 52%
EUR 307m
EUR 42m contribution to US pension fund
E.g. Stack Lighting, PointGrab

Attractive shareholder return2017 dividend EUR 1.25 to be paid in 2018; return additional capital up to EUR 150m in 2018
Key observationsDividend 2017 (in EURm)
• Proposed dividend increase of 14% at EUR 1.25 per
share; pay-out ratio of 45%
• Intention to repurchase shares for an amount of up to EUR 150m in 2018 by participating in share disposals by our main shareholder
• Disciplined management of balance sheet
• Seizing non-organic opportunities primarily through
small- to medium-sized acquisitions
EUR 1.25 per share
* Other incidentals consists of acquisition-related charges, separation costs and other incidentals
FY 2017
Net income attributable to shareholders 294
Restructuring costs 125
Incidentals* 3
Tax impact -35
Continuing net income 386
Total dividend 174
24

AgendaWelcome & introduction by Eric Rondolat
Highlights for Q4 2017 by Stéphane Rougeot
Highlights for the year 2017 by Eric Rondolat
Outlook & conclusion by Eric Rondolat
Q&A

Outlook 2018
26
• Aim to deliver positive comparable sales growth for the full year, with a soft start in the first quarter
• Further improvement of Adjusted EBITA margin to 10.0-10.5%• Continue to focus on cost reduction initiatives; expect to benefit from higher savings as of the
second half of 2018• Expect restructuring P&L charge in 2018 of 1.5-2.0% of sales
• Aim to generate solid free cash flow in 2018, which is, however, expected to be somewhat lower than the level in 2017 due to higher restructuring payments
%

Philips Lighting Path to value – Targeting Adj. EBITA margin of 11-13% by 2019
6.4%10.0%
11-13%
2013 2017 2019
+360bps+100-300 bps
16.4%> 16%
2013 2017 2019
Lamps
-2.1%
10.2%
2013 2017 2019
LED
10-12%
2.2%
2013 2017 2019
Professional11-14%
-11.6%
3.1%*
2013 2017 2019
Home
5-8%
Expected margin improvement
+280 to 580 bps Up to +180bps Up to +490 bps
8.2%
20.3%
*excl. real estate gain

Q&A

Total LED-based sales grew from EUR 2.2bn in 2013 to EUR 4.5bn in 2017
29
Total LED-based sales 2017: EUR 4.5bn, CSG 19%Development of total LED-based sales (in % of total sales)
BG LED37%
(CSG 14%)
LED Professional49%
(CSG 18%)
LED Home13%
(CSG 38%)
26%
34%
43%
55%
65%
2013 2014 2015 2016 2017

Currency movements had a negative impact on sales and positive impact on Adjusted EBITA
Key observationsQ4 2017 Sales FX Footprint (% of total)
• Currency movements had a negative impact on sales and
a positive impact on Adjusted EBITA in Q4 2017
• Sales impact from currencies of EUR -87m, mainly
from the US dollar
• Adjusted EBITA impact of EUR +10m, mainly driven by
positive effect of USD and CNY depreciation
• Philips Lighting policy is to hedge 100% of committed FX
transactions and anticipated transactions up to 80% in
layers over the next 15 months
30
EUR31%
USD25%
CNY7%
Other Currencies
37%

Net income of EUR 38m due to higher restructuring costs and an impairment of other intangible assets
31
From Adjusted EBITA to net income (in EURm) Key observations
1
2
1
2
Higher restructuring costs related to Lamps
Increase due to an impairment of other intangible assets
4Q16 4Q17
Adjusted EBITA 188 207
- Restructuring -25 -75
- Acquisition related charges -2 -
- Other incidental items -25 -12
EBITA 136 119
Amortization -27 -45
EBIT 109 75
Net financial income / expenses -12 -12
Income tax expense -35 -25
Results relating to investments in associates 1 0
Net income 63 38

Free Cash Flow of EUR 434m
Key observationsFree cash flow (in EURm)
• Free cash flow increased to EUR 434m:• Robust working capital performance, in particular the
reduction of inventories and receivables• Change in provision was driven by additions to the
restructuring provision• No separation related payments were made in Q4
32
4Q16 4Q17
Income from operations 109 75
Depreciation and amortization 73 88
Change in working capital 170 259
Net capex -26 -22
Change in provisions -20 21
Interest paid -8 -5
Income taxes paid -23 -18
Other -3 35
Free cash flow 272 434
As % of sales 14.1% 22.9%


![Invariant Shape Features and Relevance Feedback for Weld ... · Sym [0 1] < 0.5 > 0.5 > 0.5 < 0.5 Sig [0 1] < 0.5 < 0.5 → 1 > 0.5 2.2 Generic Fourier descriptor](https://img.dokumen.tips/doc/110x75/5fb60fbe46489e03c70e3474/invariant-shape-features-and-relevance-feedback-for-weld-sym-0-1-05.jpg)