Embed Size (px)
Citation preview

28 October 2014Oxford Hotel, Clark Freeport Zone
Pampanga
Philippine Rural Development
Project (PRDP)
What is the PRDP?
PRDP is a six-year program designed to establish the government platform for a modern, climate-smart and market-oriented agri-fishery sector.
PRDP will partner with the LGUs and the private sector in providing key infrastructure, facilities, technology, and information that will raise incomes, productivity, and competitiveness in the countryside.

Tools for Implementation
Value Chain Analysis (VCA) of priority commodities identified by the province/region consistent with the Agriculture and Fisheries Modernization Plan (AFMP)
LGU Commodity Investment Plan – a rolling plan of the LGU containing specific infrastructure and enterprise subprojects in support to development of the commodities
Business Development Plan (BDP) for Enterprise subprojects

PRDP Project Components
• Investments in AFMP Planning at the Local and National Levels (I-PLAN)
• Infrastructure Development (I-BUILD)
• Enterprise Development (I-REAP)
• Program Support (I-SUPPORT)

MRDP to PRDP
IGR I-PLANI-SUPPORT
Rural Infra (RI) I-BUILD
CFADNRM
I-REAP
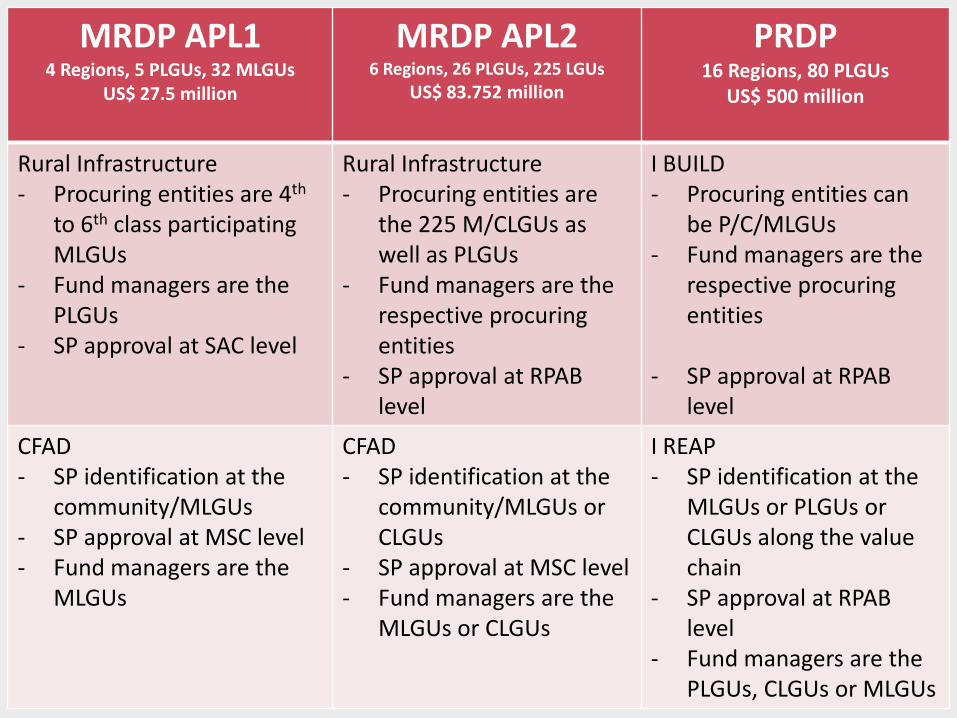
MRDP APL14 Regions, 5 PLGUs, 32 MLGUs
US$ 27.5 million
MRDP APL26 Regions, 26 PLGUs, 225 LGUs
US$ 83.752 million
PRDP16 Regions, 80 PLGUs
US$ 500 million
Rural Infrastructure - Procuring entities are 4th
to 6th class participating MLGUs
- Fund managers are the PLGUs
- SP approval at SAC level
Rural Infrastructure - Procuring entities are
the 225 M/CLGUs as well as PLGUs
- Fund managers are the respective procuring entities
- SP approval at RPAB level
I BUILD- Procuring entities can
be P/C/MLGUs- Fund managers are the
respective procuring entities
- SP approval at RPAB level
CFAD- SP identification at the
community/MLGUs- SP approval at MSC level- Fund managers are the
MLGUs
CFAD- SP identification at the
community/MLGUs or CLGUs
- SP approval at MSC level- Fund managers are the
MLGUs or CLGUs
I REAP- SP identification at the
MLGUs or PLGUs or CLGUs along the value chain
- SP approval at RPAB level
- Fund managers are the PLGUs, CLGUs or MLGUs

Cost Estimates and Financing (Php million)
Component ODA GEF GOP -NG GOP-LGU Total %
Local Planning 586.00 57.40 146.50 - 789.90 2.90%
Infrastructure 14,830.01 - 1,853.75 1,853.75 18,537.51 67.40%
Enterprise 4,100.00 229.60 1,332.50 1,264.44 6,926.54 25.20%
Program Support 984.00 - 246.00 - 1,230.00 4.50%
Total Base Cost 20,500.01 287.00 3,578.75 3,118.2 27,483.95
Front-End-Fee 51.38 - - - 51.38
Total ProgramCost
20,551.39 287.00 3,578.75 3,118.19 27,535.33
Financier Share 75% 1% 13% 11% 100%

NG – LGU Cost Sharing (%)
Component
Loan GEF Grant
LP GOP LGU Grant GOP LGU
I BUILD 80 10 10 0 0 0
I REAP 60 20 20 80 0 20

NG – LGU Cost Sharing (Amount)
Component
Project Cost (PhP Million)
LP GOP LGU Total
Infrastructure(Farm to Market Road)
40.00 5.00 5.00 50.00
Illustrative Example

I BUILD Eligible subprojects
• Construction or rehabilitation of:
–Farm to market roads
–Single/Double lane bridge
–Communal irrigation system
–Potable water system
–Fishery related infrastructure
–Other infra (pre & post harvest facility, enterprise facility, etc.)


• Feasibility Study (EIRR of at least 15%)
• Detailed Engineering Design
• Philippine Bidding Documents (works, Dec 2010)
• Social and Environmental Safeguards – Environmental Management Plan
– Project Affected Persons Survey
– Land Acquisition & Resettlement Plan, if applicable
– Applicable DENR compliance (ECC, CNC, etc.)
– If project is within IP area (FPIC, etc.)
• Geotagged file (.kmz)
• Provincial Development Council Endorsement
I BUILD Documents
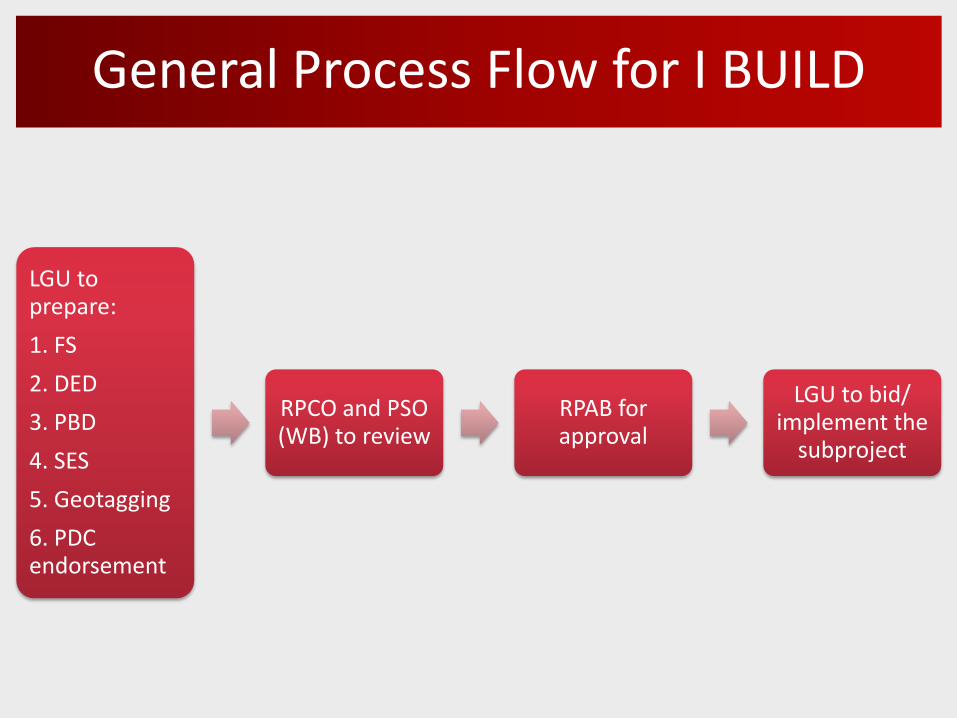
General Process Flow for I BUILD
LGU to prepare:
1. FS
2. DED
3. PBD
4. SES
5. Geotagging
6. PDC endorsement
RPCO and PSO (WB) to review
RPAB for approval
LGU to bid/ implement the
subproject

Review Thresholds for Mindanao
Office I-BUILD I-REAP
RPCO ≤ Php 10 million -
PSO ≤ US$ 1 million -
NPCO ≤ US$ 5 million ≤ Php 18.75 million
WB > US$ 5 million > Php 18.75 million

I-REAP Menu of Enterprises
Eligible subprojects
• Production and Productivity Enhancement
• Postharvest and processing facilities
• Marketing facilities
• Agri-fishery Business Development Services (ABDS) Facility Establishment
• Investments in value chain segments related to priority commodities that integrate producer groups and enterprises to achieve volume and quality required by a specific industrial/commercial market
• Investments in incubation facilities for food processing enterprise for commercial market
• Natural resources management Investments

NG – LGU Cost Sharing (I-REAP)Illustrative Example (case of Oriental Mindoro)
Fund Source
Enterprise Works
Business Plan Amount Amount
Cost sharing
Amount Cost
sharing
LP 4,670,112.21 60% 1,850,080.00 80% 6,520,192.21
GOP 1,556,704.07 20% 231,260.00 10% 1,787,964.07
LGU 1,556,704.07 20% 231,260.00 10% 1,787,964.07
Total 7,783,520.35 2,312,600.00 10,096,120.35
PG 1,945,880.09 20% 1,945,880.09
Total with PG 9,729,400.44 2,312,600.00 12,042,000.44

Calamansi… a growing industryEmerging industry• Indigenous to the Philippines• US$ 505,612 (P23.58M) annual export earnings• 75% of production comes from Oriental Mindoro
Various product uses• Food and non-food use• Medical/ therapeutical
Binding Constraints• Declining productivity • High postharvest losses• Low farmgate prices
1. Assist farmers to form clusters and enter into marketing contracts with buyers
2. Elevate from purely producers by organizing collectively with market outlets
3. Assist farmers to engage in assembling, transporting and processing
PRDP Interventions

MUNICIPAL BOUNDARIES FOR ORIENTAL MINDORO
NATIONAL ROADPRIMARY ROADSECONDARY ROAD
HIGHLY SUITABLE AREA SUITABLE AREA NOT SUITABLE
CALAMANSI PLANTATION
PUERTO GALERA
SAN TEODORO
BACO
CALAPAN CITY
PINAMALAYAN
GLORIA
BANSUD
BONGABONG
ROXAS
MANSALAY
BULALACAO
POLA
SOCORRO
VICTORIA
NAUJAN
`
CALAMANSI – PRDP PROJECTS (ORIENTAL MINDORO)
TOP 3 MUNICIPALITIES
POLA = 1,046 hectares15km FMR2.0 km distance from Provincial Highway20.8km distance from Nautical Highway
SOCORRO = 560 hectares8.5km FMR
VICTORIA = 4,662 hectares, 8.5km FMR0.88km distance from Nautical Highway
PROCESSING PLANTS

I-BUILD Component: Current Portfolio
Subproject Portfolio (By Cluster)
CAR 4 8 945.36 6%
Region 1 1 5 342.89 2%
Region 2 2 10 814.62 6%
Region 3 2 6 256.05 2%
9 29 2,358.92 16%
Region 4A 1 12 523.81 4%
Region 4B 3 15 393.97 3%
Region 5 1 11 717.18 5%
5 38 1,634.96 11%
Region 6 7 26 2,793.12 19%
Region 7 3 27 1,066.62 7%
Region 8 4 22 1,446.58 10%
14 75 5,306.32 36%
Region 9 3 20 673.79 5%
Region 10 4 45 1,326.74 9%
Region 11 5 30 740.43 5%
Region 12 5 49 966.80 7%
Region 13 4 44 759.38 5%
ARMM 5 31 914.02 6%
26 219 5,381.18 37%
54 361 14,681.37 100%TOTAL
Cost
(In Million
Pesos)
Sub-Total
Luzon B
Sub-Total
Visayas
Sub-Total
Mindanao
Cluster Region
No. of
Provinces (w/
subprojects)
No. of SPs
Luzon A
% Distribution
(By Cost)
Sub-Total

I-REAP Component: Enterprise Development Subprojects
Current Subproject Portfolio (By Cluster)
CAR 1 1 2.40 0%
Region 1 1 1 14.99 1%
Region 2 2 2 54.39 4%
Region 3 2 2 39.43 3%
6 6 111.21 9%
Region 4A 0%
Region 4B 1 1 12.04 1%
Region 5 1 1 14.31 1%
2 2 26.35 2%
Region 6 4 13 161.99 12%
Region 7 2 6 19.00 1%
Region 8 8 34 686.47 53%
14 53 867.47 67%
Region 9 2 2 91.70 7%
Region 10 2 2 26.30 2%
Region 11 1 1 53.60 4%
Region 12 2 2 69.10 5%
Region 13 1 1 26.70 2%
ARMM 1 1 25.00 2%
9 9 292.40 23%
31 70 1,297.43 100%
Distribution of Number and Cost of Enterprise Development Subprojects By
Region / Cluster as of August 11, 2014
Cluster Region
No. of
Provinces (w/
subprojects)
No. of SPs
Cost
(In Million
Pesos)
% Distribution
(By Cost)
Luzon A
Sub-Total
Luzon B
Sub-Total
Sub-Total
Mindanao
Sub-Total
TOTAL
Visayas

Philippine Rural Development Program
visit us atwww.daprdp.net
Thank you
Enabling communities…. Expanding opportunities


![prdp.da.gov.phprdp.da.gov.ph/wp-content/uploads/2016/06/PRDP-InFocus-PRDP-NPCO... · [siguro] ang uwak kasi nasesemento na." [Our elders had said that the crow would turn white if](https://img.dokumen.tips/doc/110x75/5e0c7278b4fa0510b104f0df/prdpdagov-siguro-ang-uwak-kasi-nasesemento-na-our-elders-had-said-that.jpg)