Embed Size (px)
Citation preview

COVER SHEET
This is the author-version of article published as: McGregor-Lowndes, Myles and Newton, Cameron and Marsden, Stephen (2006) Did tax incentives play any part in increased giving?. Australian Journal of Social Issues. Accessed from http://eprints.qut.edu.au Copyright 2006 Australian Council of Social Service (ACOSS)

Did tax incentives play any part in increased giving? Myles McGregor-Lowndes
Professor Centre of Philanthropy and Nonprofit Studies
Queensland University of Technology [email protected]
Cameron Newton Research Fellow
Centre of Philanthropy and Nonprofit Studies Queensland University of Technology
Stephen Marsden
Lecturer School of Accountancy
Queensland University of Technology Abstract Since 2000, increased taxation incentives along with other measures have been used by the government to encourage philanthropy in Australia. Since the new incentives were introduced, claimed gift tax deductions have increased. However, generally, donors are not aware of the new tax incentives for giving and in any case they report that their motivation for giving is not primarily, if at all, to obtain tax incentives. This article examines this paradox and seeks some possible explanations. Key words: philanthropy, tax expenditures, prescribed private funds
1

Introduction The United Kingdom, the United States, Canada and Australia, since the beginning of their income tax regimes, have all permitted a deduction or tax credit for gifts to certain public purpose organisations. In the last decade all these countries have used policy measures such as nonprofit fundraising capacity building, publicity campaigns and tax incentives to encourage philanthropy (Lyons and Passey 2006). Tax incentives for gifts are usually the largest ongoing outlay in these policy measures and are often difficult to remove. In 1999 the Australian Prime Minister announced a series of measures ‘to encourage greater corporate and personal philanthropy in Australia’ (Howard 1999, 1). In terms of government expenditure, the major initiative was a package of taxation incentives amounting to approximately $230m over five years. The centrepiece was the allowance of gift deductibility to private and corporate foundations known as Prescribed Private Funds (PPFs). A further $13m was appropriated to establish and administratively support the Prime Minister’s Community-Business Partnership (PMCBP). The PMCBP is a group of prominent Australians from the community and business sectors appointed by the Prime Minister to advise and assist the Government on issues concerning individual and corporate social responsibility. The Prime Minister is the Chair of the Partnership and it operates from the premise that
‘Mutually beneficial collaboration between business and community, as well as engagement and participation at an individual level, can provide more efficient and long-term solutions to community issues and build greater social cohesion.’ (PMCBP, 2006, 1)
The PMCBP has commissioned and disseminated research, made policy recommendations and conducted national awards for community business partnerships.1 The Australian government has not specifically linked these initiatives to wider public policy agendas of capacity building in the Third Sector as clearly demonstrated in the UK and Canada, but merely to the rhetoric of ‘mutual obligation’ (Lyons and Passey 2006). Taxation incentives and moral exhortations have been the main policy instruments used by government to achieve an increase in Australian philanthropy. Australians today appear to be giving at greater levels than in previous years and the most recent research on giving and volunteering in Australia indicates a real increase of 58 percent in giving by individuals in the seven years since 1997 (ACOSS 2005).2 This increase has been explained as a result of economic prosperity; positive publicity for giving; an increase in the number of organisations seeking donations, many with growing sophistication; and perhaps partly due to the 2004 Tsunami halo effect (Lyons and Passey 2005). But what of the taxation incentives for giving? Did the government get a ‘bang for its buck’? This article seeks to understand what role, if any, can be attributed to the government’s taxation incentives for this increase in giving. First, it briefly sketches how the government measures the ‘bang for their buck’ in terms of taxation expenditures. It then examines the material gathered in the Giving Australia project that bears upon the awareness of the taxation incentives and motives for giving (ACOSS 2005). This raises some paradoxes with the statistics available from the Australian Taxation Office (ATO) collected from the income tax returns of individual taxpayers and the information returns from PPFs. In conclusion, suggestions are offered to explain these paradoxes about the expressed motives of donors and actual gift tax incentive behaviours.
2

Tax Expenditures and Encouraging Giving The policy rationale supporting allowing a tax deduction for gifts to certain nonprofit organisations is that it will increase giving to such organisations thus producing more public goods such as research, health and education services. The standard concern of Treasury is whether such tax incentives are more efficient than a direct expenditure such as a ‘grant’ or ‘purchase of services’. The ATO (2001,1) submission to the Inquiry into the Definition of Charities and Related Organisations noted,
‘It is our view that the current system of tax concessions provides an unnecessary layer of administrative cost and complexity, and lacks transparency. We would accordingly favour a single targeted, transparent and accountable program of direct outlays.’
There are those that argue that donations are more efficient when government administrative costs of direct delivery are considered (Lee 2006; Carasso & Steuerle 2003), but there is usually a loss of control in the exact use of such funds. Other reasons for encouraging donations over direct government funding are fostering of consumer choice (Brooks 2004) and civic virtues to maintain a ‘civil society’ (Brooks 2004; Cordes 2001) A significant body of research over four decades in the United States indicates that tax deductions for such giving is ‘treasury efficient’. That is, on average, a decrease in $1 in the cost of giving can be expected to result in more than $1 being donated in personal philanthropy. Peloza and Steel (2005) in a recent meta-analysis of research considering 69 datasets has confirmed the support for the hypothesis. In Australia it is impossible to replicate this research as it relies on access to cross-sectional panel data which follows the same group of taxpayer donors over time which is currently unavailable in Australia. Treasury does annually place a cost on such taxation concessions for deductible gifts through a Tax Expenditure Statement. In Australia, tax expenditures are measured by how much taxation revenue is reduced (relative to a benchmark) because the concession exists (Australian Government 2006). The Tax Expenditure Statement 2005 estimates the tax expenditure on deductible gifts at a cost of $800m being 2 percent of all tax expenditures and .082 percent of GDP (Commonwealth of Australia 2005). It is the ninth largest reported tax expenditure. By comparison for the same period in the United States the gift deduction was $US 41.3b being 4.4 percent of all tax expenditures and 0.32 percent of GDP.3 It is the eighth largest reported expenditure (Joint Committee on Taxation 2006; Hungerford 2006). Canada, Germany, Japan and the United Kingdom all have gift deduction expenditures of less than 0.005 of total tax expenditures (Reich 2005).4 In one of the few scholarly Australian articles on tax expenditures, Burton (2005) notes that many tax expenditures are not reported because of a lack of sufficient data. The Australian tax expenditures for tax deductible gifts appear to be derived from ATO statistics as a function of the top marginal tax rate. As panel data research is not available in Australia, we look to marshalling the evidence that is available to ascertain the use of the new taxation incentives to encourage giving. Is overall giving by Australians increasing? The Giving Australia research (Lyons and Passey 2005) which measured overall giving in Australia, not just those donations claimed for tax purposes, indicates a
3

trend to increased giving. In the seven years since 1997, there had been an increase of 18 percent in the level of giving by the adult population and an 88 percent increase in the amount given with a real increase of 58 percent. The general trend to increased giving is supported by independent research conducted by McNair Ingenuity Research and Roy Morgan Research (Lyons and Passey 2005). This increase has been explained as a result of economic prosperity, positive publicity for giving, increased numbers of organisations seeking donations, many with growing sophistication, and perhaps a possible halo effect caused by the 2004 Tsunami (Lyons and Passey 2005). The Giving Australia survey of Australian adults included questions designed to ascertain the level of awareness of the recent tax incentives for giving and whether people claimed their gifts as tax deductions. Thirty-six percent of respondents had claimed a tax deductible gift in the 2003-04 tax year and as indicated below this percentage is slightly above the 35.29 percent that was reported by the ATO (2006). Further, the amount reported to have been claimed by the survey respondents is also just slightly higher when aggregated than that reported by the ATO in the official statistics. However, only about one quarter of giving by individuals is claimed as a tax deduction either because it is not within the definition of a taxable deduction or simply not claimed in individual tax returns (ACOSS 2005, 36). The survey of individual giving found that the awareness of recent gift deduction incentives was quite low. Only 19 percent were aware of the new taxation incentives. Those that claimed awareness of the incentives made significantly higher total donations than those that were not aware of them. The likelihood of claiming gift deductions also increases with income (Lyons and Passey 2005, 32). Smeaton et al (2004), in a UK study commissioned by the Inland Revenue to understand why (despite the introduction of various charitable tax incentives) the value and frequency of giving has remained unchanged, also found a low level of awareness. Nearly sixty percent were unable to name any charity tax incentive unprompted. The Giving Australia individual giving survey also explored the main reasons why donors gave. These did not include any reasons connected with taxation incentives. The main reasons centred on the worthiness of the cause, the people assisted by the gift and the donor’s affiliation with the cause or those it assisted. ‘Only 1 percent of respondents or 7 percent of those aware of the new tax incentives indicated that it had impacted on their giving’ (Lyons and Passey 2005, 33). Qualitative research among donors was also conducted as part of the Giving Australia project (Madden and Scaife 2005). Thirty-four focus groups and 38 in-depth interviews were conducted across a range of individual and business donors, volunteers and nonprofit employees. This research included interviews with affluent Australians who had established PPFs and other foundations. A clear theme emerging from this research was that ‘participants mostly agreed that tax incentives did not prompt giving’ (Madden and Scaife 2005, 31). Spontaneous small amount givers held the belief that it was not worth the trouble of obtaining and keeping gift receipts for taxation deductions. This changed for proactive givers who kept and claimed gift receipts. For very affluent Australian donors interviewed, there was a different behaviour described as:
‘wealthy donors always claimed tax deductions on their giving (leaving such details to be handled by their accountant or adviser who, in turn, was aware of their gifts). Tax deductibility did not determine if they gave or what they
4

gave to but it was widely regarded as a positive incentive for those wishing to give more than otherwise.’ (Madden and Scaife 2005, 11-12)
The qualitative research, with its ability to reach very affluent donors, provides a gloss to the individual giving survey, which was constrained by the limitations of sampling through telephone interviews. Taxation incentives are acknowledged as playing a part in giving for the very wealthy, although still quite subsidiary to other motivations, which largely concur with those identified in the individual giving survey. Given these findings, is the $800m in foregone taxation revenue wasted when tax incentives are reported by donors as largely irrelevant? We now turn to examining the ATO statistics on claimed gift deductions by individual taxpayers: whether they are being used, by whom, and the impact of recent taxation incentives on claimed deductions. Are claimed tax deductible gifts increasing? The ATO publishes an annual statistical report on tax collections each year, but it is for the financial year usually two years prior to the date of publication (ATO 2006). For example, the 2006 publication will report on data from 2003-2004. It then updates the information for another two years after the outstanding returns for each year are finalised. The claiming of gift deductions by individual taxpayers since 2000 is clearly increasing by any measure and also compared to the five years prior to 2000. Since 2000 the total amount of claimed gift deductions has increased by 67 percent in total, and in real dollar value, 55 percent. The percentage of income claimed as donations and the percentage of taxpayers claiming a donation have both risen over this period. In 1995 claimed gift deductions were $539.21m (av. $165.44) and increased to $738.77m (av. $214.42) in 2000. By 2004 the total claimed had increased to $1.16b (av. $300.61). There was a 6.7 percentage average increase in the five years to 2000 and since then a 9 percentage increase. Tax-deductible donations as a percentage of taxable income is increasing. In 1995-96 taxpayers claimed 0.20381 percent of their taxable income and at the end of the decade it had risen to 0.22626 percent. Since 2000 the percentage has continued to increase to 0.29507 in 2003-04. The percentage of donating taxpayers has also increased over the same period. For 1995-96, donating taxpayers were 31.99 percent rising to 32.75 percent in 2000. The trend has continued with donating taxpayers increasing to 35.29 percent in 2003-04. It should also be noted that the total number of Australian taxpayers has grown since 1995 by nearly 1.5m and the number of taxpayers claiming donations has risen from 3.3m to over 3.8m. In 2003-04 the gift deduction represented 5.1 percent of individual taxpayer’s total deductions for the first time being more than that claimed by taxpayers as tax preparation deductions. We now turn to examining the nature of the new taxation incentives announced by the government in 1999 and what the government expected as a return for its foregone taxation revenue. The New Taxation Incentives
5

On 26 March 1999, the Prime Minister announced new tax initiatives designed to encourage greater corporate and personal philanthropy in Australia (Howard 1999). These initiatives were based on the work of the PMCBP Taxation Working Group. The new measures and others added annually at the time of the PMCBP award recognition dinners represented the most active gift deduction policy implementation of any Australian government since federation in 1901. The measures include: deductibility for gifts of property over $5,000; ability for donors to spread donation deductions over 5 years; administrative simplification of workplace giving deductions; deductibility of conservation covenants; capital gains tax exemption for cultural gifts; deductions for contributions incurred in fundraising dinners and similar events; recognition of deductibility to health promotion charities; and establishment of PPFs.
Whilst personal deductions for gifts to certain bodies have been a part of the federal taxation regime since its inception, the Australian gift deduction regime is quite distinct. Unlike the USA, UK and Canada, Australia does not cap the amount that can be claimed as a gift deduction by either individual or corporate taxpayers. An Australian taxpayer is limited by the gift being over two dollars for money or over $5,000 for property and the gift deduction cannot create a tax loss. Further, the recipient gift deductible organisations are narrowly defined compared to overseas jurisdictions. The USA, UK and Canada provide for deductible gifts to nearly all bodies that are considered “charitable”. Australia accords Deductible Gift Recipients (DGRs) status to only 22,000 organisations compared to its over 48,000 charitable institutions and funds endorsed by the ATO (CPNS 2006). The USA, UK and Canada also allow for deductible gifts to family and corporate foundations. The Australian taxation regime, until PPFs, did not allow deductibility for gifts to funds that were not regarded as public (ATO, 1995). The ‘public’ criteria has two limbs. First, it requires that such funds were controlled by the public, not an individual, family, or business and second, that the fund sought and actually received donations from the public. A fund with a single donation source could not qualify as a public fund. This effectively prevented donations to a family foundation or a corporate foundation from being tax deductible through the gift deduction provisions. The policy provided some public scrutiny of such funds and hence lessened the risk of tax abusive behaviours in closely held arrangements. Such public scrutiny was prudent given that Australian charities and deductible gift recipients did not have to file any type of annual return or report to the ATO and self assessed their concession status with minimum oversight until 2000. The legislation establishing the PPF form relaxed the public criteria for this type of fund. Donations did not have to be sought and received from the public. Only one ‘responsible’ person outside the individual, family or business was required to be a part of the governance arrangements. Individuals, families and businesses could now apply to establish a fund to which they were the sole donor and receive a tax-deduction (ATO 2004). However the policy design evidences a careful balance between flexibility to allow PPF creation and provisions which seek to discourage tax abusive behaviours. A number of measures not required of other DGRs were imposed on PPFs which reduce the risk of tax abusive behaviours. First, PPFs are not permitted to self
6

assess their taxation status and an application for PPF status pre-vetted by the ATO and approved by the Assistant-Treasurer is required. Second, unlike most other DGRs, all PPFs are required to undertake an annual audit and file an annual information return with the ATO. PPFs were also required to annually distribute their income apart from that required to maintain the real value of the corpus. PPFs have become the most scrutinised and monitored of deductible funds. The PPF has characteristics which predestined it to be used by those with substantial wealth (Emerson 2004). The establishment costs are between $2,000 - $10,000, with ongoing audit fees. The ATO also indicated that a fund must, within its first couple of years, reach a minimum of several hundred thousand dollars. However, it was common for an agreement to be struck for the funds to restrict disbursements until a desired corpus level had been obtained. This accommodation has implications for distributions which shall be considered shortly.
The forecast tax expenditure costs of the provisions including PPFs was not itemised for all the new measures. The government estimated that some measures such as payroll deductions and fundraising dinner contributions would involve negligible tax expenditures, others such as conservation covenants, spreading of gift deductions and inclusion of health promotion charities were between one to five million a year. (Australian Parliament 2004). The PPF was the main tax expenditure item of the package. Those involved in the establishment of PPFs were also more likely to take advantage of property gifts and spreading deductions over a five year period. The government indicated that the combined financial effect of the incentives would result in a tax expenditure of:
$5.5m in the 1999-2000 income year; $51m in the 2000-01 income year; $56m in the 2001-02 income year; and $71m in the 2002-03 income year. (Australian Parliament 2004)
The delayed introduction of legislative provisions to give effect to these new philanthropic tax incentives meant that it was not until the final weeks of the 2001 financial year that the first PPFs were approved by the government. We now turn to examine whether these incentives were taken up by Australian taxpayers and encouraged greater philanthropy. Prescribed Private Funds As at September 2006, 440 PPFs had been approved and $505.8m had been donated to them. Table 1 indicates that PPFs have in turn made distributions of $94.3m to DGRs since their inception. These distributions are likely to increase in coming years because as noted above, the ATO allowed a number of PPFs to accumulate income to reach a sustainable corpus level. Once this period has ended investment income can only be accumulated at a rate equivalent to the CPI, with the rest disbursed to DGRs. While the government may be satisfied with achieving its policy intent in encouraging the creation of PPFs, there remains the short term issue of the lack of immediate distributions to DGRs and hence the funds for these organisations to carry on their charitable, benevolent and cultural purposes in the community. In the long term, provided that the PPF corpus is invested prudently, then an increasing perpetual revenue stream should in time flow annually to DGRs.
7

[TABLE 1 ABOUT HERE] PPF returns also record the type of donation and an analysis of 2005 gifts to PPFs is shown in Table 2. It indicates that new provisions to permit deductions for property including shares have been utilised by these donors. The average size of a gift to a PPF in 2005 was $304,844.87. Although no mean is available, the indications are that very affluent taxpayers are involved in making these donations. [TABLE 2 ABOUT HERE] Allowing for the delayed implementation of the PPF, the first five year’s tax expenditure forecast has been exceeded by some $15.9m or 6.6 percent. While Table 3 indicates that the total estimate appears to be relatively close to actual donations, there appears to be a trend towards significant growth of PPF donations. The Government could seek to control the rising tax expenditures by using ministerial discretion to limit the numbers of PPFs being created, for example raising the minimum establishment corpus. However, it would require legislative intervention to curb donations to existing PPFs which may present political difficulties and involve legislative complexities. [TABLE 3 ABOUT HERE] However, for the policy to be regarded as successful, a number of other matters need to be considered. First, who are the recipients of the distributions and is there a bias towards certain types of sectors such as high culture or private schools? The recipients of PPF grants are required by law to be DGRs (excluding other PPFs and ancillary funds). Tables 4 and 5 map the disbursements against general and specific categories of DGRs in category numbers and gross receipts. While there are some variations between the measures, there is no category that appears to receive PPF distributions significantly disproportionate to the number of organisations in each category or their total receipts. [TABLES 4 & 5 ABOUT HERE] Second, ideally the donations need to be funds that would not otherwise have been gifted to DGRs nor to nonprofit organisations outside the deductible gift tax regime. A mere reallocation from either of these pools would not have resulted in greater philanthropy. With the introduction of PPFs there were some concerns that solicitation of large gifts would become more difficult as affluent donors would channel their annual large gifts into their PPFs (Our Community 2006). Not only was the capital gift unavailable to the DGR, but it was now part of the PPF corpus and in most cases only the income from the corpus was to be distributed. Given Australia’s narrow class of deductible gift recipients compared to other jurisdictions, there is also the danger that those nonprofit organisations outside the gift deductible regime could be adversely impacted as well. If ATO taxpayer panel data was available, these aspects could have been tracked to gain an indication of PPF donor behaviour with some precision, however the ATO does not have panel data sets available for researchers. It is possible however with the available data from the PPF annual returns, the ATO annual statistics and the
8

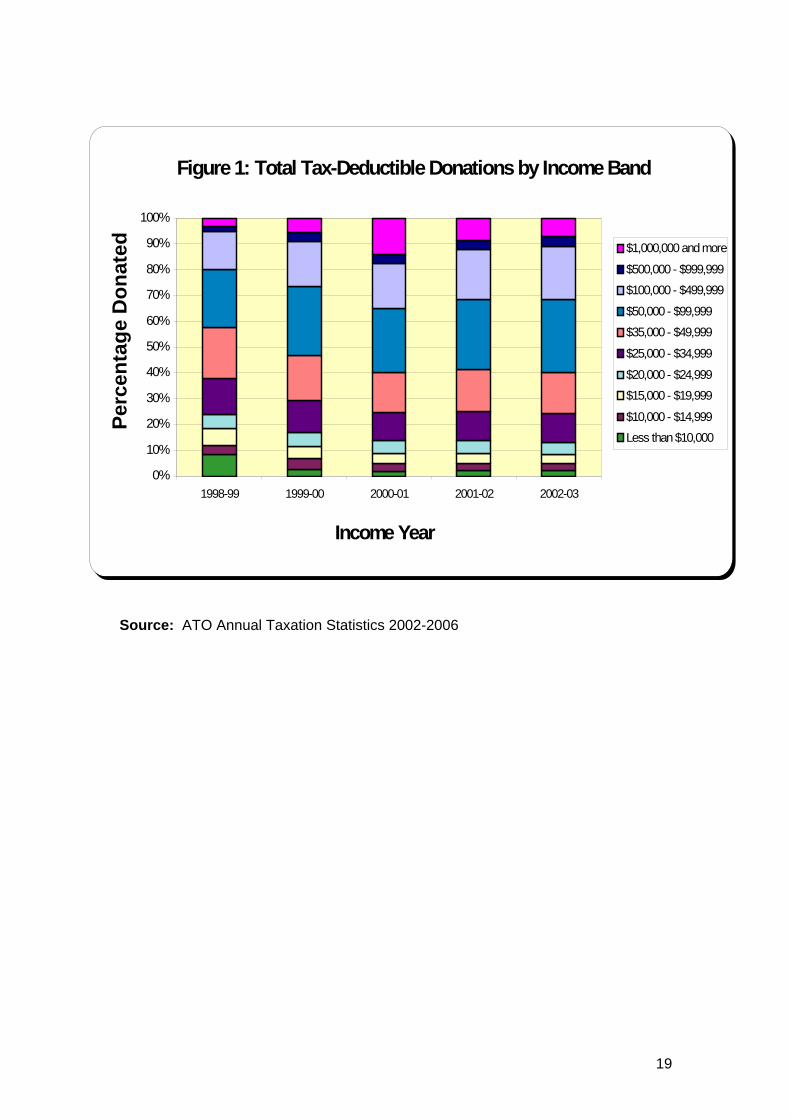
Giving Australia individual giving data to make some inferences as to the behaviour of PPF donors. First, as indicated at the beginning of this article, the giving of money to organisations (whether tax deductible or not) has increased significantly, by both businesses and individuals (Lyons and Passey 2005). Claiming of tax deductible donations by individual taxpayers has also increased significantly since the introduction of PPFs (McGregor-Lowndes and Marsden 2006). The Giving Australia data indicates that giving outside of gifts claimed as tax deductions has increased significantly (Lyons and Passey 2005). Lyons and Passey (2005) address the issue of the gap between claimed and unclaimed gift deductions, but there is no measure available of whether this is increasing or decreasing. Their prediction of claimed gift deductions of $1.2b to $1.3b in 2003-04 (Lyons and Passey 2005, 31) appears close to the mark with the first ATO gift deductions total for that year being $1.16b (McGregor-Lowndes and Marsden 2006). The ATO is likely to revise these figures upwards as outstanding returns are finalised. [TABLES 6 & 7 ABOUT HERE] Tables 6 and 7 separate PPF donations from other claimed tax deductible gifts on a tax expenditure basis as well as from claimed gifts from individual taxpayer income tax returns. Table 6 places the tax expenditures of the new measures in comparison with the total tax expenditures for all gift deductions. The total deductible gift tax expenditures have grown and it appears that the new tax expenditures are not merely being reallocated from existing donations, unless other factors account for the overall increase in gift expenditures. Table 7 separates non-PPF gift deductions and establishes the rate of increase of non-PPF claimed gift deductions. The rate of increase in non-PPF gift deductions from 2001- 2004 has fluctuated between 6.1 percent and 10.5 percent, but averages 8.1 percent. This is significantly higher than the five year period prior to 2000 and before PPF where the average rate of annual increase was 6.7 percent (McGregor-Lowndes and Marsden 2006). These figures may be understated due to two factors. First, the ATO updates its statistics for another two years after their first disclosure as outstanding returns are finalised. In previous years, the revisions have increased the level of deductible gift donations. Second, these figures do not include gifts by corporate taxpayers, as the ATO does not record such deduction information. Some corporate taxpayers have donated to PPFs and these donations while included in the PPF donations shown in Table 1 would not be included in the individual taxpayer deductible gift statistics in Table 6. These factors indicate that the rate of non-PPF donations by individual (not corporate) taxpayers would be even higher than that shown in Table 7. The other supporting evidence for an increase in donations from outside the previously claimed tax deductions is the size of tax deductible receipts by high income bands since the introduction of PPFs. As noted earlier PPFs because of their characteristics of high start up and maintenance costs together with the threshold capital barrier to entry are likely to be used by affluent individuals. In Figure 1 it can be appreciated that the actual taxation gift deduction claims by those earning more than $100,000 in taxable income has dramatically increased since 1999-2000 from 20 percent to over 30 percent (McGregor-Lowndes and Marsden 2006). The average claimed deductible gift of individual taxpayers with a taxable income over one million dollars was $73,355.44 in 2003-04 having risen from just $26,828 in 1999-2000 (McGregor-Lowndes, Marsden, & Flack 2002; McGregor-Lowndes & Marsden 2004). Nor does it appear that, following the 1999 announcement of the new measures,
9

such taxpayers were holding back their donations in anticipation of these new incentives, as previous years have similar averages. [FIGURE 1 ABOUT HERE] Thus the available evidence, although not conclusive, points to substantial new funds flowing into PPFs and not just a reallocation of direct tax deductible gifts or non-tax deductible gifts. So can this be reconciled with the findings of the Giving Australia individual giving survey about the low awareness of the tax incentives for gifts and reported insubstantial impact on donative behaviour? Conclusion The ATO gift deduction figures indicate that there has been a substantial increase in giving by affluent Australians, the intended main mark of the new taxation incentives. There is some indication given the general increase in giving established by the Giving Australia project that this affluent giving is not a mere reallocation of previously unclaimed, or non-tax deductible gifts nor from long standing gift deduction incentives. New donations have been attracted from outside the existing claimed gift deduction pool. Further research into the giving patterns of affluent Australians would be required to substantiate such general observations. How did this occur given that the general awareness of new tax deductibility incentives for giving was a mere 19% of respondents and ‘only 1% of the total respondents or 7% of those aware of the changes indicated that it had impacted on their giving’? (Lyons and Passey 2005, 33) The substantial increases in giving might not be due to tax incentives but to other factors such as publicity about the social desirability of giving, better fundraising techniques or merely a consequence of good economic conditions for a sustained period. Affluent Australians may merely be gaining a bonus for giving that they had already decided upon for other reasons. However, the significant increase in affluent giving occurred upon the introduction of the PPF and property gift incentives and some causality must be seriously considered. A further explanation may be found in methodological issues. It is unlikely that the very affluent givers contributing to the ATO statistics would have been appropriately represented in the Giving Australia telephone survey despite the best efforts of the researchers to attempt to over-sample census districts containing a high proportion of high income households. A significant percentage of respondents (21.2 percent for personal income and 26.2 percent for household income) while happy to provide other information refused to provide or did not know their personal or household income. It is also to be expected that direct questions about whether a tax incentive motivates a donor elicits a socially constructed response that the gift is for purely altruistic reasons rather than for personal gain. The Giving Australia qualitative research with affluent Australians does provide indications that this group do claim tax deductions for gifts and it is a consideration, but not expressed as a significant motive (Madden and Scaife 2005). The Government appears to have received ‘a bang for its buck’ in that there is mounting evidence that new private funds have been directed to deductible gift recipients. There is evidence that many low income taxpayers do not bother claiming a tax deduction for gifts. There has been some delay in some PPF funds actually reaching nonprofit organisations and in turn beneficiaries. This is due to the accumulation permitted of some PPFs, but provided the corpus funds are properly
10

managed, there will be a perpetual stream of distributions to deductible gift recipients.
11

Endnotes 1 Research is available at http://www.partnerships.gov.au. 2 This does not include donations as a result of the 2004 Tsunami appeals. 3There are differences in the US taxation system compared to Australia and the tax expenditure method is on a cash basis, whereas Australia uses an accruals basis. 4 German and Canadian tax expenditures are on a cash basis, whereas Australia uses an accruals basis.
12

References ACOSS (2005) Giving Australia: Research on Philanthropy in Australia – Summary of Findings, Canberra, Department of Family and Community Services, available from http://www.partnerships.gov.au/philanthropy/philanthropy_research.shtml#FinalReports ATO (1995) Income Tax: Public Funds, Taxation Ruling 27, 22 August. ATO (2001) Submission to the Inquiry into the Definition of Charities and Related Organisations, available at http://www.cdi.gov.au ATO (2004) Guidelines for Prescribed Private Funds, Version 3, May. ATO (2006) Taxation Statistics 2003-04, April. Australian Government. (2006) International Comparison of Australia’s Taxes, Canberra, Commonwealth of Australia, April 3. Australian Parliament. (2004) Explanatory Memorandum to Tax Laws Amendment Bill, Commonwealth of Australia. Barrett, K.S., McGuirk, A. M. and Steinberg, R. (1997) ‘Further Evidence on the Dynamic Impact of Taxes on Charitable Giving’ National Tax Journal, 50 (2), 321-334. Brooks, A.C. (2004) ‘The Effects of Public Policy on Private Charity’, Administration & Society, 36(2), 166-85. Brooks, A.C. (2005) ‘Does Social Capital Make You Generous?’, Social Science Quarterly, 86 (1), 1-15. Burman, L.E. (2003) ‘Is the Tax Expenditure Concept Still Relevant’, National Tax Journal, 56 (3), 613-627. Burton, M. (2005) ‘Making the Australian Tax Expenditures Statement an Effective Policy Instrument – From Fiscal Record to the Transparent Report’, Journal of Australian Taxation, 8 (1), 1-68. Carasso, A. and Steuerle, C. (2003) ‘Tax Expenditures: Revenue Loss versus Outlay Equivalents’, Tax Notes, October 13, 287. Commonwealth of Australia, Tax Expenditures Statement 2005, available at http://www.treasury.gov.au Cordes, J. (2001) ‘The Cost of Giving: How Do Changes in Tax Deductions Affect Charitable Contributions?’, Emerging Issues in Philanthropy, available at http://www.urban.org/UploadedPDF/philanthropy_2.pdf CPNS (2006) ‘ATO Data: Deductible Gift Recipients’, Current Issues Information Sheet 2006/5 available at http://www.cpns.bus.qut.edu.au Emerson, J. (2004) ‘The Feel Good Factor’, Financial Planning, July 1, 34-36.
13

Howard, J. (1999) Federal Government Tax Measures to Encourage Philanthropy, available at http://www.pm.gov.au/news/media_releases/1999/philanthropy2603.htm, 26 March 2004. Hungerford, T. L. (2006) Tax Expenditures: Trends and Critiques, United States, Congressional Research Service Report for Congress, Library of Congress, September 13. Joint Committee on Taxation (2006) Estimates of Federal Tax Expenditures for Fiscal Years 2006-2010, Washington, US Government Printing Office, April 25. Lee, K. (2006) ‘Voluntary provision of Public Goods and Administrative Costs’, Public Finance Review, 34 (2), 195-211. Lyons, M. & Passey, A. (2005) Australians Giving and Volunteering 2004. Giving Australia: Research on Philanthropy in Australia, Canberra, Department of Family and Community Services, available from http://www.partnerships.gov.au/philanthropy/philanthropy_research.shtml#FinalReports Lyons, M. & Passey, A. (2006) ‘Need Public Policy Ignore the Third Sector? Government Policy in Australia and the United Kingdom’, Australian Journal of Public Administration, 65 (3), 90-102. Madden, K & Scaife, W. (2005) Report on Qualitative Research. Giving Australia: Research on Philanthropy in Australia, Canberra, Department of Family and Community Services, available from http://www.partnerships.gov.au/philanthropy/philanthropy_research.shtml#FinalReports McGregor-Lowndes, M. & Marsden, S. (2006) ‘An Examination of Tax-Deductible Donations Made by Individual Australian Taxpayers in 2003-04’, Centre of Philanthropy and Nonprofit Studies Working Paper, No. CPNS 33. McGregor-Lowndes, M. & Marsden, S. (2004) ‘An Examination of Tax-Deductible Donations Made by Individual Australian taxpayers in 2001-02’, Centre of Philanthropy and Nonprofit Studies Working Paper, No. CPNS 24. McGregor-Lowndes, M., Marsden, S., & Flack, T. (2002) ‘An Examination of Tax-Deductible Donations Made by Individual Australian taxpayers in 1999-00’, Centre of Philanthropy and Nonprofit Studies Working Paper, No. CPNS 14. Our Community. (2006) The Australian Best Practice Grantmaking Quarterly, Melbourne, Our Community, October. Peloza, P. & Steel, P. (2005) ‘The Price Elasticities of Charitable Contributions: A Meta-Analysis’, American Marketing Association, 24 (2), 260-272. (PMCBP) Prime Minister’s Community Business Partnerships. (2006) Home Page. http://www.partnerships.gov.au/ Reich, R. (2005) ‘A Failure of Philanthropy: American Charity Shortchanges the Poor, and Public Policy is partly to Blame’, Stanford Social Innovation Review, Winter, 24-33.
14

Smeaton, D., Marsh, A., Rajkumar, R. & Thomas, A. (2004) Individuals’ Donations to Charities and their Use of Tax Relief, Research Report No. 9, United Kingdom, HM Revenue & Customs, October.
15

Prescribed Private Funds (PPFs) Aggregate Statistics – to 30 September 2006 Table 1: Numbers of PPFs, donations received, distributions made and closing values.
Approved in the year
Total approved
Donations received
Distributions made
Closing value
No. No. $ Million $ Million $ Million 2001 22 22 78.7 0 78.6 2002 59 81 53.0 6.8 133.7 2003 51 132 53.1 18.3 179.3 2004 89 221 155.7 27.4 334.1 2005 91 312 186.3 41.8 505.8 2006(a) 128 440 n/a n/a n/a (a) To end of September 2006. Source: Australian Tax Office PPF Annual Returns, 2006.
1. The information will change slightly over time as outstanding returns are finalised.
2. Some PPFs have been allowed to capitalise income until a sustainable
corpus is reached and hence are not required in these years to make distributions to DGRs.
Table 2: Type of Donation to PPF 2005. Cash $163,752,504.22 Shares $19,991,194.19 611 donations Property $2,516,520.00 Closing balance
$505,868,722.65 TOTAL $186,260,218.41 Source: Australian Tax Office PPF Annual Returns, 2006.
16

Table 3: New philanthropic tax incentives by tax expenditure: forecast and actual
Forecast tax expenditure
Actual tax expenditure
$ Million $ Million Year 1 5.5 38.2 Year 2 51 25.7 Year 3 56 25.7 Year 4 56 75.5 Year 5 71 90.3 Total 239.5 255.4
Source: Explanatory Memorandum, Tax Laws Amendment Bill (No. 7) 2004 and ATO PPF Annual Returns. Table 5: Distributions of PPFs to DGR by general category, percent of organisations within category and total category receipts.
General Category*
Total PPF distributions 2002-2005 by %
Total no of organisations in DGR category * by %
Total receipts of DGRS by category * by %
Health 5.6 4.5 7.7 Education 24.92 20.5 44.2 Research 3.13 0.7 3.5 Welfare & Rights
51.85 51.5 28.2
Environment 4.37 1.5 0.2 Cultural 10.08 13.7 14.2 Source: (CPNS 2006), ATO 2006 * Categories of ancillary and other funds excluded from PPF distributions and minor categories such as defence and international affairs not shown, hence percentage will not total 100%.
17

Table 6: Tax expenditures for gift deductions and new philanthropic tax measure expenditures.
Total tax expenditures ($ million)
New measures tax expenditures ($ million)
2001 418 38.2 2002 440 25.7 2003 480 25.7 2004 630 75.5 2005 800* 90.3 * Estimate from 2006 Tax Expenditure Statement Source: Treasury (2005) Tax Expenditure Statement and ATO PPF Annual Returns. Table 7: Claimed gift deductions and PPF gift deductions.
Total gift deductions
PPF gift deductions
Non-PPF gift deductions
% increase of non- PPF gift deductions
$ Million $ Million $ Million $ Million 2001 862.45 78.7 783.75 6.1% 2002 919.21 53.0 866.21 10.5% 2003 988.20 53.1 935.1 7.9% 2004 1,164.62 155.7 1008.92 7.9% Source: ATO Taxation Statistics (2006) and ATO PPF Annual Returns The information will change slightly over time as outstanding returns are finalised.
18
19
Source: ATO Annual Taxation Statistics 2002-2006
Figure 1: Total Tax-Deductible Donations by Income Band
40%
50%
60%
70%
80%
90%
100%
tage
Don
ated
0%
10%
20%
30%
1998-99 1999-00 2000-01 2001-02 2002-03
Income Year
Perc
en
Less than $10,000$10,000 - $14,999
$15,000 - $19,999$20,000 - $24,999
$25,000 - $34,999
$35,000 - $49,999$50,000 - $99,999
$100,000 - $499,999$500,000 - $999,999
$1,000,000 and more

Table 4: PPF disbursements to Deductible Gift Recipients
Activity 2002 2003 2004 2005 Totals % of TotalHealth 1.1.1 A public hospital $1,087,620.00 $327,700.00 $196,557.00 $321,353.00 $1,933,230.00 2.29%1.1.2 A hospital carried on by a society or association $67,200.00 $140,000.00 58,000.00 $1,000.00 $266,200.00 0.32%
1.1.3 A public fund established before 23 October 1963 and maintained for the purpose of providing money for hospitals
$- $40,000.00 $25,122.00 $- $65,122.00 0.08%
1.1.4 A public authority engaged in research $6,600.50 $20,231.00 $3,371.00 $15,300.00 $45,502.50 0.05%1.1.5 A public institution engaged solely in research $1,098,181.80 $808,765.00 $84,000.00 $155,700.00 $2,146,646.80 2.54%
1.1.6 A charitable institution whose principal activity is to promote the prevention or the control of diseases in human beings
$160,354.55 $45,600.00 $23,063.00 $40,788.00 $269,805.55 0.32%
Education 2.1.1 A public university $1,698,204.00 $1,469,227.00 $1,635,489.0
0 $579,064.00 $5,381,984.00 6.37%
2.1.4 A residential educational institution affiliated under statutory provisions with a public university $2,560,000.00 $57,907.00 $63,889.00 $32,222.00 $2,714,018.00 3.21%
2.1.5 A residential educational institution (Commonwealth) $- $154,840.00 $- $- $154,840.00 0.18%
2.1.7 Minister declared technical and further education institution $1,800.00 $51,000.00 $ 50,000.00 $- $102,800.00 0.12%
2.1.8 A public fund established and maintained solely for the purpose of providing religious instruction in government schools in Australia
$1,000.00 $- $- $- $1,000.00 0.00%
2.1.10 A public fund for providing money for the acquisition, construction or maintenance of a school or college building
$8,259,410.00 $2,501,823.00 $1,702,260.00 $239,750.00 $12,703,243.00 15.04%
Research
20

3.1.1 A university, college, institute, association or organisation which is an approved research institute
$539,928.44 $1,322,924.79 $577,732.00 $199,800.00 $2,640,385.23 3.13%
Welfare and Rights 4.1.1 A public benevolent institution $22,118,783.23 $9,488,093.25 $6,831,660.7
3 $1,687,284.0
0 $40,125,821.21 47.50%
4.1.2 A public fund - purpose providing money for PBIs or for the establishment of public benevolent institutions
$81,500.00 $6,200.00 $1,200.00 $5,000.00 $93,900.00 0.11%
4.1.3 A public fund for the relief of persons in Australia who are in necessitous circumstances $913,957.00 $69,540.00 $1,482,408.0
0 $1,087,919.0
0 $3,553,824.00 4.21%
4.1.4 A public fund that, when the gift is made, is on the register of *harm prevention charities $50,000.00 $20,000.00 $- $- $70,000.00 0.08%
Environment 6.1.1 A public fund that, when the gift is made, is on the register of *environmental organisations $1,917,820.33 $1,057,177.00 $541,253.00 $176,000.00 $3,692,250.33 4.37%
Cultural 12.1.1 A public fund that, when the gift is made, is on the register of *cultural organisations $921,189.00 $1,405,045.00 $948,626.00 $268,340.00 $3,553,200.00 4.21%
12.1.2 A public library $295,518.00 $320,950.00 $633,250.00 $68,500.00 $1,318,218.00 1.56%12.1.3 A public museum $408,200.00 $392,094.00 $316,050.00 $62,500.00 $1,178,844.00 1.40%12.1.4 A public art gallery $346,600.00 $612,927.00 $450,668.00 $15,400.00 $1,425,595.00 1.69%12.1.5 An institution consisting of a public library, public museum and public art gallery or of any 2 of them
$324,750.00 $162,600.00 $200,786.00 $346,604.70 $1,034,740.70 1.22%
TOTAL $84,471,170.32 100.00% Source: Australian Tax Office PPF Annual Returns, 2006.
The information will change slightly over time as outstanding returns are finalised. Some PPFs have been allowed to capitalise income until a sustainable corpus is reached and hence are not required in these years to make distributions to DGRs.
21