Embed Size (px)
Citation preview

Philadelphia County
Assistance Office (PCAO)
Client Survey Project
Mayor’s Internship Program | Summer 2016
1
Acknowledgements
The MIP interns would like to extend our gracious thanks the Mayor’s Office of Community
Empowerment and Opportunity for their cooperation, support, and encouragement. In particular,
we feel indebted to Carolyn Brown, the CEO’s Director of Planning & Evaluation, for her
invaluable leadership and guidance; Graham O’Neill, CEO’s Benefits Access Coordinator, for
his fascinating insight and capable abilities as an urban motorist; and Helen Squitieri, Data
Fellow, for her impeccable survey design and data analysis.
We would also like to thank the staffs of the PCAO offices in which we had the privilege to
work -- Chelten, Somerset, Liberty, Glendale, and South -- and in particular their gracious
District Liaisons: Jacqueline Mazzitelli, India Harris, Tamiko Brown, Beksy Ortiz and Sheila
Peterson, without whose cooperation this project would never have come to fruition.
Additional thanks must be extended to author Judith Levine, who contributed greatly to our
understanding of the mechanics of trust between people in institutions of power.
And lastly, we must extend our most profound thanks to the 711 considerate and patient clients
of PCAO, who generously volunteered to take our survey.
2
Table of Contents
Research Team………………....………………………………………………………………….3
Executive Summary……………………….……………………………………………….…....4-5
Background………………………………………………………………………………...…..6-10
Results………………………………………………………………………………..…...….10-17
Limitations………………………………………………………………………….……...…17-20
Recommendations……………………………………………………………………………20-22
Conclusion………………………………………………………………………………..……...22
Appendices…………………………....…………………………………………………...…23-33
Appendix I: References….………………………………………………………......…...24
Appendix II: Survey….……………………………………………………….....…...25-28
Appendix III: Survey Code Book….…………………………………………....…....29-33

3
Research Team
Julia Center | Syracuse University, 2017 | B.A. Public Health | Training Unity - DBHIDS Julia is a rising senior at Syracuse University pursuing a Bachelor's in Public Health with a focus on
addiction studies. In her free time, Julia volunteers at Dr. King elementary school, choreographs and
dances with Danceworks dance group, and is an active member of Kappa Alpha Theta Women's
Fraternity.
John Cronin | Carleton College, 2018 | B.A. Political Science, Linguistics | Division of Housing &
Community Development John is rising junior at Carleton College in Northfield, Minnesota working towards a double major in
Political Science and Linguistics. John is a Resident Assistant on campus, in addition to doing acting and
comedy, and participating in campus political activism. Sonja Dahl | Swarthmore College, 2018 | B.A. Sociology and Anthropology, Spanish | PhillyRising Sonja is a rising junior at Swarthmore College working towards a double major in Sociology and Spanish.
Outside of class, she takes piano lessons, works on the Allyship and Anti-Oppression Resource Guide,
and participates in the Anti-Racist Coalition of Swarthmore and the Philadelphia chapter of Showing Up
for Racial Justice. Lauren Enlow | York College of Pennsylvania, 2017 | B.S. Political Science | First Judicial District Lauren is a rising senior at York College of Pennsylvania with a major in Political Science. She is a part
of Student Senate and the president of the Pre-Law Society. Nuha Fariha | Cornell University, 2017 | B.A. Psychology | DBHIDS - Mental Health First Aid Nuha is pursuing a Bachelor's in Psychology at Cornell University with a focus on biological,
evolutionary and neuroscience. Nuha is a peer counselor, a consultant for Cornell Concert Commission, a
social media manager for CornellRadio.com and a member of Asian Pacific Americans for Action. Tirah Hall | Bloomsburg University, 2018 | B.A. | Criminal Justice | First Judicial District Tirah is a rising junior at Bloomsburg University, pursuing a Bachelor's degree in Criminal Justice and a
minor in Dance. In her free time she is a Writing Consultant for freshman students, a modern dance
choreographer, and member of the Bloomsburg Dance Ensemble. John McLaughlin | Johns Hopkins University, 2017 | B.A. International Relations, Sociology |
PhillyRising John is pursuing a Bachelor's degree at Johns Hopkins University in International Studies and Sociology.
He is traveling to Bolivia this fall for a study abroad program. John works on JHU's fossil fuel divestment
campaign and participates in Alpha Phi Omega, a co-ed community service fraternity.
Natalie Parker | University of Pennsylvania, 2017 | M.P.A. | Office of Innovation and Technology Natalie is pursuing a Master’s in Public Administration at the University of Pennsylvania with a focus on
public finance. Natalie is a board member of the Women of Fels, a professional development network for
graduate students, and is the chair of Penn’s Student Financial Services Committee, which oversees all
financial services at the University. Infiniti Stanton | LaSalle University | B.A. English, Psychology | First Judicial District Infiniti is pursuing a dual Bachelor's degree in English and Psychology with a minor in Philosophy.

4
Executive Summary
During the Mayor’s Internship Program (MIP), a group of nine interns worked
throughout the month of July to collect survey data for the Mayor’s Office of Community
Empowerment & Opportunity (CEO). This research project was created to understand why
people have difficulty maintaining public benefits. This problem - often referred to as “churn” -
occurs when people who are eligible for benefits lose access to them for various reasons, and
then re-apply for these same benefits after a short period of time1. Often people experience a
short period without benefits, which can cause them to experience hardship.
We elicited this information by conducting over 700 face-to-face interviews at county
assistance offices throughout the city. The primary goals of our research were to collect
information about people’s experiences receiving SNAP, TANF and Medicaid and then make
recommendations about ways to help eligible Philadelphians remain connected to their benefits.
Background
The Philadelphia County Assistance Office (PCAO) Client Survey Project was developed
in partnership with the Benefits Access Working Group (BAWG),2 which is one of five
committees convened by CEO to support the Shared Prosperity Philadelphia anti-poverty plan.
In February 2016, working group members met with officials from the Pennsylvania Department
of Human Services (DHS), the state agency that manages PCAO offices among offices in every
other PA county, to discuss options for accessing administrative data and exploring special
projects that the BAWG could pursue to learn more about the reasons people get involuntarily
disconnected from benefits.
1 Rosenbaum, Dottie. "Lessons Churned." Center for Budget and Policy Priorities (2015). 2 See Appendix IV.

5
The PCAO Client Survey Project originated from these discussions and is designed to
collect evidence on the incidence and causes of unanticipated termination of benefits from the
perspective of recipients. The BAWG will review the results from the survey project and use the
findings to determine next steps in advancing the goal of helping eligible clients remain
connected to their benefits.
Survey Methods
Over a four-week period (July 1-July 29), our team surveyed 711 people at five County
Assistance Offices in the city. We conducted the survey in an interview format from Tuesday to
Friday within those weeks, along with legal interns from Community Legal Services. All
interviews were conducted privately and no identifying information was taken. This survey
instrument was created by CEO with our group’s input. We received two in-depth trainings from
CEO about surveying best practices and were also instructed how to accurately record, code and
input data.
Results
From the data, we discovered that 35% who have previously applied for benefits have
likely experienced churn in the last six months. The findings point to three specific reasons that
this might occur:
● 55% of clients report not receiving renewal forms.
● 40% of clients on SNAP report not receiving a notice that they had to interview (required
for the continued receipt of benefits).
● 31% of clients on TANF report not receiving a notice of their scheduled interview
(required for the continued receipt of benefits).

6
Background
The public benefits offered to, accessed by, and retained for Americans have been shaped
by a lively history of frequently changing programs and attitudes. Today, the Pennsylvania
Department of Human Services serves 2.8 million clients in the state3. Caseworkers have many,
many cases to process and limited resources with which to do so4. Relative to residents of other
counties in Pennsylvania, Philadelphians have a tremendous need for public benefits programs.
There are thirteen PCAO locations in Philadelphia, at least ten more than every other PA county
besides Allegheny (which has nine and contains Pittsburgh)5.
Our team spent a month surveying PCAO clients in five DHS offices throughout
Philadelphia. We found that many clients were in the office because they were no longer
receiving food stamps (Supplemental Nutrition Assistance Program, SNAP), medical assistance
(Medicaid), and/or cash assistance (Temporary Assistance for Needy Families, TANF), yet they
remained eligible to participate in these programs. These clients are victims of “benefits churn,”
when eligible families that have been receiving public benefits lose them only to reapply for
benefits within a short period of time6. Since SNAP, Medicaid and TANF are each administered
differently, each program has a unique history, renewal process, and therefore “type” of churn.
A history of welfare programs in the United States
Examining this history gives insight into today’s challenges. Though “welfare” in the
United States started with cash payouts to the widows of deceased Civil War soldiers7, most
3 "DHS Budget Request for FY 2016-2017." PA Department of Human Services (2015): 30-35. PA
Department of Human Services. 4 Levine, Judith Adrienne. “Ain't No Trust.” University of California, 2013. 5 "County Assistance Office Contact Information." PA Department of Human Services. 6 Rosenbaum, Dottie. 2015. 7 Levine. 2013.

7
large-scale public benefits programs in the US began with the New Deal, a federal response to
the Great Depression where Americans were experiencing financial hardships unlike that of any
other period. The program often known as “welfare” was called Aid to Families with Dependent
Children (AFDC) and started primarily as indefinite cash assistance to white, non-working,
single mothers. Eligibility and amount were determined by a caseworker, and black mothers who
had always been in the labor force were deemed not eligible. In response to the 1960s civil rights
movement, welfare entitlements expanded to include black women. This would alter the
composition of AFDC recipients, and generate racialized resentment towards the program and
concern over its incentives over time8.
This resentment helped spur the 1996 Personal Responsibility and Work Opportunity Act
(PRWOWA), which renamed AFDC to TANF and placed several limits, restrictions, and
work/job training requirements on SNAP and TANF recipients. Since the widespread inclusion
of white women into the US workplace during the 1970s on, work-related requirements and
expectations previously reserved for men now reached mothers as well9. AFDC lost its
entitlement status (where eligible candidates would always receive cash assistance) when it
transitioned to TANF. States, which administer public benefits, now receive a certain amount of
federal funding for TANF. If there is a greater need than the federal funding provided in a given
state in a given year, then some candidates in that state will not receive cash assistance10. The
stringent nature of today’s modified “welfare” programs creates the perfect conditions for
benefits churn to harm DHS offices and recipients alike.
8 Levine. 2013. 9 Levine. 2013. 10 Rosenbaum. 2015.
8
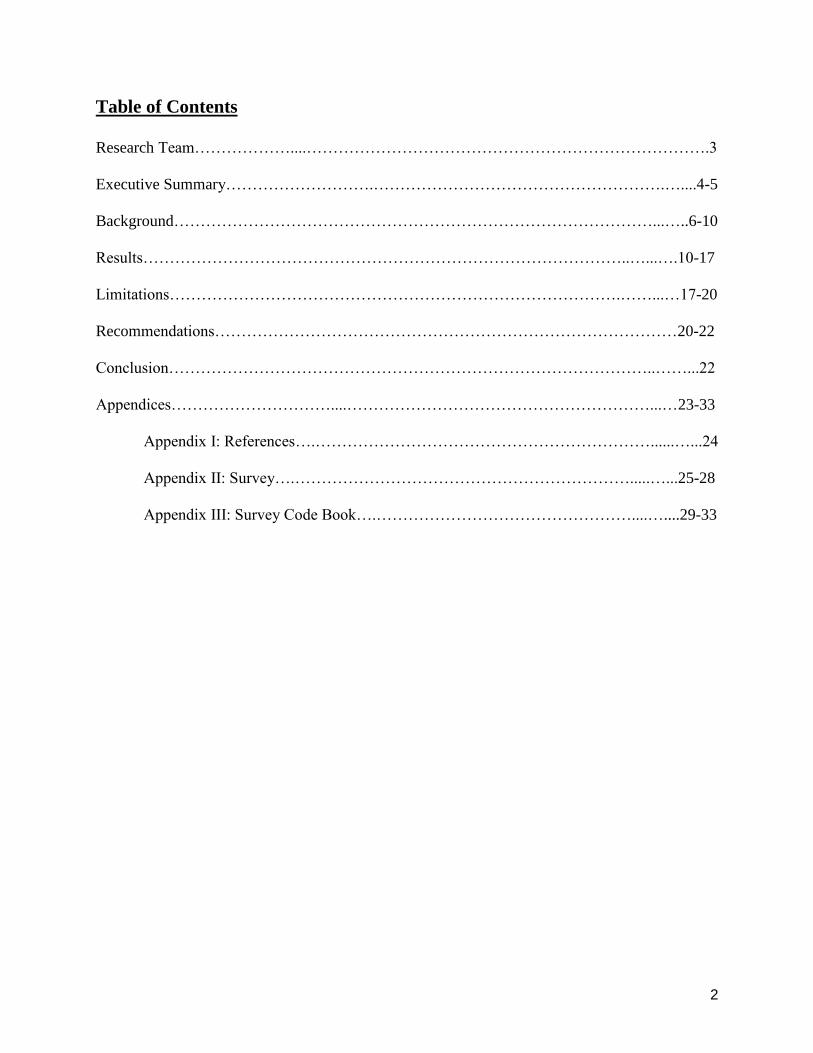
Process of Renewal and Churn
For each public benefits program, churn becomes an issue during the renewal process.
Either biannually or annually, public benefit programs reassess families’ eligibility to direct
limited budget resources to families that need assistance the most. This reassessment, called
renewal, involves interactions between state agencies and families - opportunities for procedural
issues that create churn11. Renewal for each benefits program is administered differently, so
clients may have to complete multiple, separate renewals each year (see Figure I on the next
page). Recipients are required to verify their financial status, residency, health and criminal
histories, etc. by providing various documents and completing a renewal form. Ideally, DHS
staff will send recipients the renewal form over the mail - then the client will submit the
documents by mail or in person12.
Figure I13
SNAP TANF Medicaid
Renews every six months Renews every 12 months
Renews every 12 months14
Requires in-person interview
with a DHS caseworker every
12 months
Requires an in-person
interview with a caseworker
every 12 months
Does not require an
interview
If eligible clients fail to receive renewal forms in the mail, submit renewal paperwork, or
complete interviews, then the client will have their benefits terminated. The process of
11 Rosenbaum. 2015. 12 "Interview of Graham O'Neill." Personal interview. 29 July 2016. 13 Rosenbaum. 2015. 14 Sometimes caseworker can verify status using records on file. In this case the client does not have to
submit a renewal form.

9
reapplying for benefits shortly after having a case terminated is estimated to cost the PA DHS
and Philadelphians about $9 million every year. When clients experience churn, they have to
complete an entirely new application which costs the PA DHS double or triple the cost of
processing a renewal application15. Most importantly, clients experience serious hardship when
they are no longer receiving benefits that they need.
The “Trust Gap”
Dr. Judith Levine, a professor at Temple University, wrote a book called Ain’t No Trust,
which describes how low-income mothers – often recipients of AFDC and now TANF – tend to
distrust many people within the “welfare” system (as well their boyfriends and bosses). Levine
posits that distrust occurs when 1) the other’s interests in the interaction opposes his/her own and
2) he/she doesn’t feel he/she has the power to demand fair treatment from the other16. Since the
passage of PRWOWA and the Great Recession, caseworkers have exorbitant caseloads to
process and are not incentivized to take measures that could help people stay connected to
benefits17.
Distrust between clients and caseworkers can lead to misunderstandings in the renewal
process and limit communication between recipients and caseworkers, contributing to lapses
with required submissions or follow through18. Clients do not eagerly reach out to DHS offices
for help, so they remain unsure of the renewal process timeline and requirements. A client of
Community Legal Services (CLS) shared her own experience with us. We will call this client,
who asked to remain anonymous, Jane. Jane compared making a phone call to the assistance
15 “Churn Hurts Clients, DHS Caseloads, and Pennsylvania’s Economy,” Center for Law and
Social Policy, January 2015. 16 Levine, Judith. "PCAO Survey Interview." Personal interview. 9 Aug. 2016. 17 Levine. 2016. 18 Rosenbaum. 2015.
10
office to “falling into a black hole.” She reported that she has never received a call back after
leaving a message19.
When people have their benefits unexpectedly terminated, it can exacerbate trust between
its victims, caseworkers and recipients, closing further lines of communication that could have
cleared up misunderstandings or made processes easier20. Many of the clients we surveyed were,
like Jane, in the office because they assumed that their issue would not be addressed unless
he/she was in-person, directly observing the caseworker addressing his/her issue. A “trust gap”
can be observed from our survey responses and their aggregate statistics described below.
Results
After our surveying period finished, we coded our results and ran statistical analyses
using the program IBM SPSS Statistics 24.21 Relevant analyses include frequencies, descriptive
statistics, crosstabs, and correlations. These analyses form the basis of our results.
We surveyed clients at five County Assistance Offices (CAOs) across the City of
Philadelphia. We did not collect identifying information, but we can reasonably assume that the
clients surveyed are low-income individuals with a wide range of racial and ethnic backgrounds.
In the data that we did collect, approximately 35 percent of survey respondents experienced an
income change within the past six months, and 28.65% of our respondents had a change of
address within the last six months. It should be noted that the survey captures clients' perceptions
of DHS actions and may not correspond directly with results obtained from administrative data.
19 Interview with “Jane,” a benefits recipient from Community Legal Services." Telephone
interview. 8 Aug. 2016. 20 Levine. 2016. 21 The survey and related code book can be found in Appendices II and III.

11
Our sample is biased towards clients who apply in person rather than online or through
the mail; however, surveyors collected data on multiple days throughout four weeks from any
client willing to participate. As such, this sample of clients represents the larger Philadelphian
population that seeks to apply for benefits in person. Due to the breadth of responses (a total of
711) our white paper can help illustrate the gravity of the problems for these individuals.
Furthermore, these results illuminate the need for additional research using administrative data
from DHS to confirm the extent of these issues.
In total, we found that 60.32% of clients surveyed claim to experience their benefits
being cut off. There are multiple reasons that someone may experience a stoppage. For example,
a monetary raise could result in someone disqualifying for benefits even if they are still
experiencing hardships. Ninety-five people, or approximately one-third of respondents who had
not lost their benefits, were in the process of applying for benefits for the first time. Excluding
these 95 clients, a total of 69.9% of clients indicated that they had lost their benefits at some
point in time. Of those who had experienced their benefits being cut off, 66.9%, or 267
individuals, reportedly experienced this stoppage in the last six months. Such a high proportion
of clients reporting losing benefits within the last six months suggests that cut-offs are frequent.
Although our specific focus was churn, the loss of benefits at such high levels is concerning,
especially in light of evidence that the benefits cut-offs are recurring. While this survey cannot
speculate as to why people report losing their benefits so frequently, we can easily tell this high
turnover rate must put an enormous weight on staff at CAO who must constantly close and
reopen benefit cases. Both this aspect of recurrence and the overall high rate of losing benefits
could indicate underlying issues related to policy or the renewal process.
12
Isolating churn per se from these surveys was more difficult than simply reported loss of
benefits. Some proposed measures in a report by the Center for Budget and Policy Priorities all
involved determining a proportion of cases that reopened “within 90 days” of being formally
closed.22 In our analyses, we used four criteria to isolate which clients had experienced churn in
the last six months: 1) the client’s benefits were stopped, 2) the client reapplied within four
months of benefits stopping, 3) the client’s application was approved, and 4) this entire process
happened within the past six months. Under this criteria, we found that at least 90 respondents
had experienced churn in the last six months. These 90 clients represent 12.66% of our total
respondents, and 14.61% of respondents who had applied for benefits before (i.e. those who were
not applying for the first time on the date surveyed). While these numbers provide an estimate of
definite rates of reported churn within the last six months, they exclude those cases in which the
approval notice has not been received, but which conform to all other criteria.
Many of the respondents surveyed were at a CAO in order to complete the process of
reapplying for their benefits. We thought of these clients as “likely churners.”23 While we cannot
definitively prove they will complete the churn cycle by being accepted, we can reasonably
estimate that most people will be accepted. We can predict this result based on the fact that
clients who already had applied saw a 97% acceptance rate in our survey, but also anecdotally as
clients did not appear concerned about having their application accepted, but had other concerns
such as the wait time required to speak to a caseworker. Our inability to precisely identify
whether likely churners will be accepted demonstrates further the need to continue this project.
Adding “likely churners” to our pool of “definite churners” results in a total of 216 respondents
22 Rosenbaum. 2015 23 Throughout this section, we will refer to measurements that use both “likely churners” and
“definite churners” as churn-likely, and measurements that use only “definite churners” as churn-
definite.

13
who have reported experiencing churn in the last six months, which is 30.38% of our total
respondents and 35.06% of respondents who had applied before.
These figures indicate that churn is a problem of a much larger scope than our most
conservative definition suggests. Furthermore, an additional 73 respondents had experienced
churn as defined by our first three criteria, but not in the last six months. All of these rates point
to a high incidence of churn, and show that churn is a serious issue in Philadelphia. Clearly,
CAOs would benefit from identifying why churn is reportedly happening so they can implement
policies to help address benefits retention.
We next examined the spread of churn across different types of benefits. Of churn-
definite respondents, 83.33% were reapplying for lost SNAP benefits, 36.67% were reapplying
for lost Medicaid, and 35.56% were reapplying for lost TANF benefits. Of churn-likely
respondents, 79.17% were reapplying for lost SNAP benefits, 40.93% were reapplying for lost
Medicaid, and 29.77% were reapplying for lost TANF. (See Graph I below for number of churn-
likely respondents for each type of benefit). The high proportion of respondents receiving SNAP
benefits likely contributes to the high proportion of people who lost this benefit. Thus, the lesson
to be gained from this analysis is not that one benefit or another is most closely associated with
churn. Rather, one should note that these percentages add to far more than 100% (155.56% for
churn-definite and 149.87% for churn-likely), which indicates that substantial proportions of
churners experienced churn for more than one benefit. The loss of multiple benefits is yet
another troubling piece of evidence of the far reaching consequences of churn.

14
Graph I
Furthermore, churn also deserves serious consideration because of the negative impact
that it has on client’s lives. In our survey, we allowed clients to review a list of hardships (e.g.
missing a meal, unable to pay rent) and note which ones they had experienced. As surveyors, we
believe that many clients declined to indicate hardships that they had, in fact, experienced due to
a lack of privacy or comfort with the interviewer. Despite this under-reporting, 67.51% of
respondents reported experiencing at least one hardship listed on the survey within the last six
months. There is a positive correlation between the experience of benefits being cut off and the
number of hardships encountered (i.e. sum of hardships; r(N = 687) = .078, p<0.05). Clients who
have had their benefits stopped are more likely to have experienced multiple hardships than those
who had not experienced a cut-off. While it is beyond the statistical scope of our survey to prove
that losing benefits leads to hardships, it is certainly clear that staying on public benefits would
improve the quality of life of many of our respondents.
From the high incidence of benefits loss either generally or due to churn specifically, to
the overlap of churn for multiple benefits, to the associations between churn and hardships, it
appears that churn is a substantial problem for public benefits clients in Philadelphia.
Understanding the gravity of churn, it is imperative that government find ways to reduce its
15
incidence and ensure that clients are able to stay connected to benefits. With this critical mandate
in mind, we also examined several aspects of the renewal process to narrow down problems that
may have resulted in churn for churn-definite and churn-likely respondents. Our survey
attempted to determine potential factors resulting in churn, but due to limitations in the data, we
strongly recommend future research utilizing administrative data to pinpoint why clients are
experiencing trouble staying on their benefits. Nevertheless, it is worth considering a few key
findings from our look at the renewal process.
From those we surveyed, 44.94% of churn-definite respondents and 55.19% of churn-
likely respondents reported that they never received a renewal form. Of those who did receive a
form, some clients may have come to their local CAO to pick up a renewal form, lessening the
likelihood that any given client would receive a renewal form in the mail, as is protocol. While
there are multiple reasons that someone may not receive their renewal form in the mail, there
was no correlation between address change and receiving the renewal form. In other words, it
does not appear that a change of address is resulting in the reported absence of a renewal form
for most clients. Regardless of reason, not receiving a renewal form means that clients may not
realize that they are facing an upcoming deadline (an issue in and of itself even when clients do
receive the form), leading to a loss of benefits. The magnitude of clients who reported they did
not receive renewal forms suggests that this simple, initial step was a major issue in the renewal
process that could contribute substantially towards churn. With identifying information, we
could help determine exactly when the renewal form was sent and potential reasons someone
may have not gotten the form within thirty days of their renewal deadline.
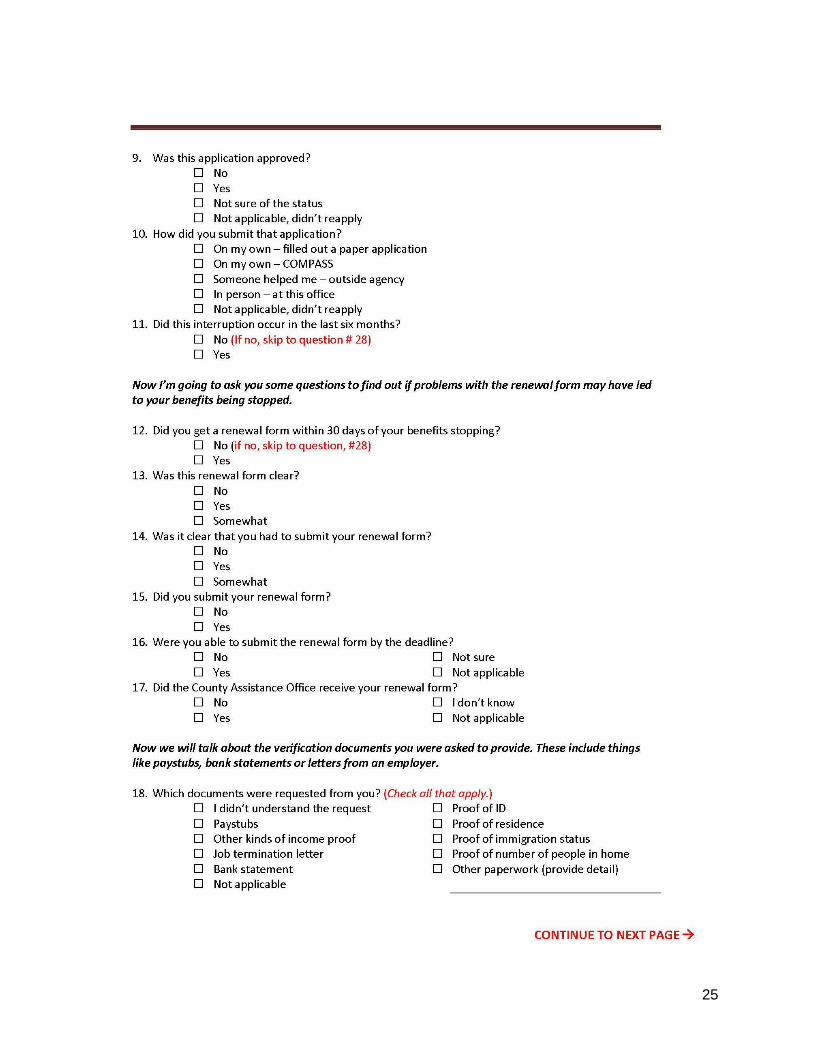
Clients are also expected to submit documentation, such as paystubs or proof of
residence, along with the renewal form. More research is needed to understand the issues in this

16
phase that may contribute towards churn. With not enough responses in the documentation
section of the survey, we could not determine the relationship between types of documentation
required and if that impacted submitting the paperwork at all or by the deadline. Future research
should collect more information to help determine if certain paperwork is leading to churn.
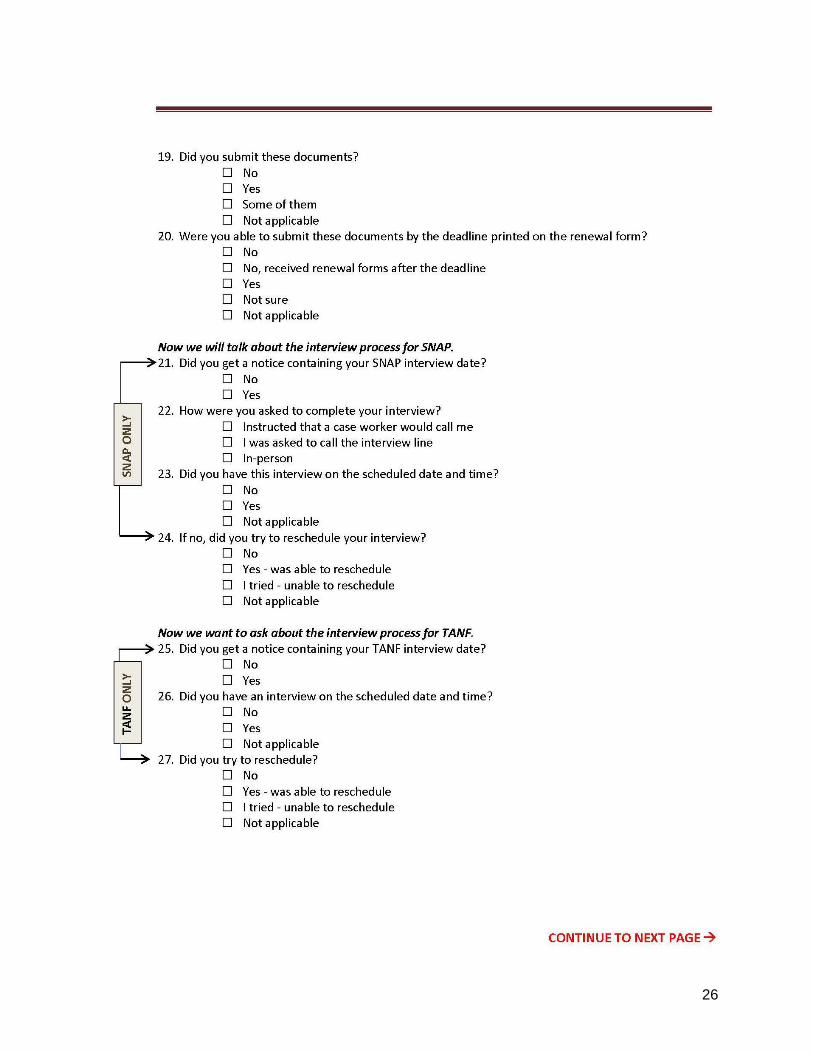
Excluding Medicaid, if the renewal form and documentation are submitted and approved,
clients who are renewing SNAP and TANF are required to complete an interview. Again, clients
reported that the major problem was receiving notice of this interview. Under SNAP, 37.84% of
churn-definite interviewees and 40.00% of churn-likely interviewees claim they did not receive
an interview notice. Under TANF, there were not enough churn-definite interviewees to draw
conclusions, but 30.56% of churn-likely interviewees report they did not receive an interview
notice. (See Graph II below for a comparison of SNAP and TANF using churn-likely rates.) The
high rate of churners who did not receive interview notices means that this may be another major
point at which clients lose their benefits. Beyond this point, barriers to conducting the interview
could present further issues, which would require further research to confirm.
Graph II

17
While further research is certainly needed, it is clear that churn is a major cause for
concern in Philadelphia. Furthermore, it seems that special attention must be placed on issues
surrounding the renewal form and interview notices, as high rates of problems were reported in
these areas. Major steps must be taken to improve these aspects of the renewal process so that
key issues do not cause clients to lose their benefits.
Limitations
No matter how thorough a project like this may seem, it is important to remember and
recognize the imperfections: intentional and accidental, large and small. Ultimately, these
limitations are a necessary part of fully comprehending and contextualizing this project and its
results.
Project Limitations
Several limitations were simply a product of the survey’s intentional design. These
limitations were purposeful omissions motivated by the scope of our project. Nevertheless, they
should be noted in hopes of improving future projects and better understanding this one.
In the city of Philadelphia there are 13 PCAO locations; because of our limited
manpower, we only conducted surveys at five. This limited the representation of clients,
potentially skewing the data if the five offices were not representative of citywide benefits
clientele. In addition, all of this surveying -- conducted from July 1st to July 22nd -- occurred
within one month in the middle of summer. It is not unreasonable to assume that client demands
placed on the CAOs change month by month and season by season. Because of the limited
timeframe of our project, these were factors for which we were simply unable to account.
Finally, because these surveys were conducted exclusively in-person at the offices, all the clients
who used other tools -- the internet, phone, fax -- to get benefits were excluded from our results.

18
Their experiences of benefits and churn is wholly absent from our results. Yet another population
that was excluded was those who were at the office but unwilling to take the survey. While we
can only speculate on their reasons for refusing to participate, their viewpoints would have been
valuable inclusions.
Some limitations occurred because of questions we just chose not to ask in order to keep
the project within a manageable scope and make the survey more attractive to a client population
possibly wary of being interviewed. We completely excluded demographic questions from the
survey. We recorded no information about race, gender, age, marital status, socioeconomic
status, or the client’s household, including dependents like children. Because we did not collect
this information, we could not establish any correlations with our own data.
As mentioned earlier in this paper, the final project limitation would be that we were
ultimately recording clients’ perceptions of what happened, not necessarily what actually did
occur. Clients' interpretations of PCAO procedures and actions may not correspond with PCAO
records.
Team Limitations
While we may be reluctant to admit these things in ourselves or acknowledge them in
clients’ attitudes, interviewer and selection biases are something that must be taken into account.
To be completely forthright: stark ethnic and economic differences existed between our
interviewers and the vast majority of PCAO clientele. These differences would have been readily
apparent to both parties and innate bias could have affected many personal interactions. Our
team members might have been biased against approaching clients they subconsciously saw as
intimidating, surly, or unwelcome, while at the same time some clients might have been

19
unwilling to work with surveyors they perceived as insincere, unsympathetic, or unlikely to
create change.
Survey Limitations
As we only came to realize once we began surveying, our survey itself had some faults
that created distinct limitations. While the survey was fairly comprehensible, it was created in a
short amount of time leading to a few limitations. The survey almost exclusively inquired about
events that occurred within the last six months and terminated data collection if events happened
outside that scope. This limited the number of valid instances of churn we could document with
an arbitrary cutoff. Additionally, we didn’t receive enough responses to the documentation
section of our survey (see questions 19, 20, and 21 in the survey) to draw confident conclusions;
this section should be restructured or moved. Within the survey we did not provide a space
within the questions -- notably #10 -- for respondents who had pending applications. Oftentimes
we would be interviewing people who had just submitted an application, yet we failed to make
room for this on the survey. Finally, pen and paper surveying proved a limitation in and of itself.
It was time-consuming and error prone. A more efficient system might involve the use of tablet
devices to reduce human error and allow surveyors to skip questions more easily.
Recommendations
Based on the background data, key informant interviews, and limitations observed
throughout the interview process, we have determined a set of recommendations for future use.
We do not have enough conclusive data to determine the most comprehensive recommendations,
because the extent of what we know is that many people did not receive and/or submit their
renewal forms.

20
Increase Trust
In order to close the “trust gap” described earlier, Dr. Levine suggested that assistance
offices could consider:
● Supporting caseworkers with the resources they need to support clients. With a reduced
caseload, caseworkers would have more time and attention to communicate with clients,
improve trust, and reduce churn: inspiring a virtuous cycle rather than a vicious one.
● Caseworkers could be recognized or incentivized when a high percentage of their
caseload does not experience churn.
● Clients could be provided with greater flexibility during renewal processes regarding
requirements and deadlines.
Improve the Notification Process
● We believe that providing more advanced notice to those whose benefits are at risk of
being shut off is not only essential in building trust between clients and CAOs, but also in
decreasing the number of clients who experience churn. We recommend that PCAO look
into additional notification options to give people more notice and time before needing to
reapply.
● When clients were left voicemail messages about the status of their benefits, they often
found that there was no information left about whom they should contact to proceed with
the process. We recommend that when CAOs call clients, they also leave a call back
number at which they can be reached.
● Many clients reported that they received no notice prior to their benefits being shut off.
For clients whose benefits are at risk of being stopped, notices should be sent by mail, e-

21
mail, text, and phone call. Utilizing all of these avenues will likely improve
communication between clients and CAOs.
Future Study
● We found there to be certain procedural changes within our survey that may have
improved the results of our study. We did not include identifying info (i.e. sex, education
level, etc.) in our survey. These factors may influence the rate at which people
experience churn, so we recommend that they be used in future surveys.
A few offices consist of a largely Spanish-speaking clientele. We were not always fully
prepared with bilingual surveyors, which could have presented bias in our results. For
future study, we recommend that that at least one surveyor be assigned to the Somerset
and Liberty offices (or any with a largely Spanish speaking population) who is proficient
in Spanish. We also recommend that the survey be printed in Spanish as well as English.
Considering our survey’s limitations and scope, our team and the BAWG would benefit
from and appreciate access to large-scale, administrative data concerning PA benefits
access and retention.
Conclusion
Ultimately, this is a problem the city must face to help people avoid hardship and stay
connected to the benefits necessary to maintain the livelihood of the city and its residents’
wellbeing. Our recommendations are designed to confront future churn and to set other studies of
churn in motion. Implementing these recommendations would require some changes in
philosophy and initial investment, but could improve PA DHS’s finances, the atmosphere in
assistance offices, and clients’ everyday lives over the long term.

22
Appendices

23
Appendix I: References
“Churn Hurts Clients, DHS Caseloads, and Pennsylvania’s Economy,” Clasp, January 2015.
"County Assistance Office Contact Information." PA Department of Human Services. Web.
"DHS Budget Request for FY 2016-2017." PA Department of Human Services (2015): 30-35.
PA Department of Human Services. Web.
"Interview of Graham O'Neill." Personal interview. 29 July 2016. Graham O’Neill is the Benefits
Access Coordinator for the Mayor’s Office of Community Empowerment and
Opportunity.
“Interview with “Jane,” a benefits recipient from Community Legal Services." Telephone
interview. 8 Aug. 2016.
"PCAO Survey Interview with Judith Levine." Personal interview. 9 Aug. 2016.
Levine, Judith Adrienne. Ain't No Trust: How Bosses, Boyfriends, and Bureaucrats Fail
Low-Income Mothers and Why It Matters. U of California, 2013. Print.
Rosenbaum, Dottie. "Lessons Churned: Measuring the Impact of Churn in Health and Human
Services Programs on Participants and State and Local Agencies." Center for Budget and
Policy Priorities (2015): Web.
24
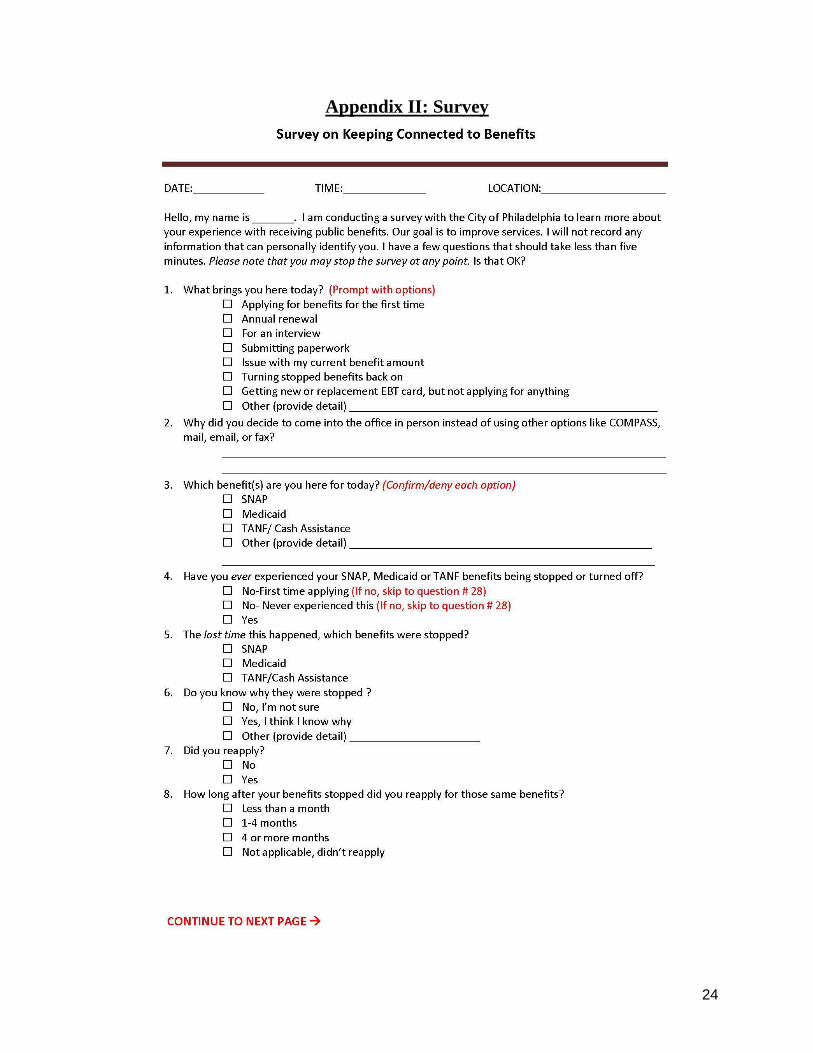
Appendix II: Survey
25
26

27

28
Appendix III: Survey Code Book
1. What brings you here today?
A. Applying for benefits
1 = No
2 = Yes
B. Annual Renewal
1 = No
2 = Yes
C. For an interview
1 = No
2 = Yes
D. Submitting paperwork
1 = No
2 = Yes
E. Issue with my current benefit amount
1 = No
2 = Yes
F. Turning stopped benefits back on
1 = No
2 = Yes
G. Getting new or replacement EBT card, but not applying for anything
1 = No
2 = Yes
H. Other
1 = No
2 = Yes
Write in answer if they provide detail for other 2. Why did you decide to come into the office in person instead of using other options like
COMPASS, mail, email, or fax? Write in answer
3. Which benefit(s) are you here for today?
A. SNAP
1 = No
2 = Yes
B. Medicaid
1 = No
2 = Yes
C. TANF
1 = No
2 = Yes
D. Other
1 = No
2 = Yes
4. Have you ever experienced your SNAP, Medicaid or TANF benefits being stopped or turned off?
1 = No-First time applying
2 = No-Never experienced this before
3 = Yes
5. The last time this happened, which benefits were stopped?
A. = SNAP
1 = No
2 = Yes

29
B. = Medicaid
1 = No
2 = Yes
C. = TANF
1 = No
2 = Yes
6. Do you know why they were stopped?
1 = No, I’m not sure
2 = Yes, I know why
3 = Other (provide detail) ______________________
7. Did you reapply?
1 No
2 Yes
8. How long after your benefits stopped did you reapply for those same benefits?
1 = Less than a month
2 = 1-4 months
3 = 4 or more months
99 = Not applicable, didn’t reapply
9. Was this application approved?
1 = No
2 = Yes
3 = Not sure of the status
99 = Not applicable, didn’t reapply
10. How did you last apply for those benefits?
1 = On my own – paper application
2 = On my own – COMPASS
3 = Someone helped me – outside agency
4 = In person – at this office
99 = Not applicable, didn’t reapply 11. Did this interruption occur in the last six months?
1 = No
2 = Yes
12. Did you get a renewal form within 30 days of your benefits stopping?
0 = No 1 = Yes
13. Was this renewal form clear?
1 = No
2 = Yes
3 = Somewhat
14. Was it clear that you had to submit renewal form?
1 = No
2 = Yes
3 = Somewhat
15. Did you submit your renewal form?
1 = No
2 = Yes
16. Were you able to submit the documents by the deadline?
1 = No
2 = Yes
3 = I don’t know
30
99 = Not applicable
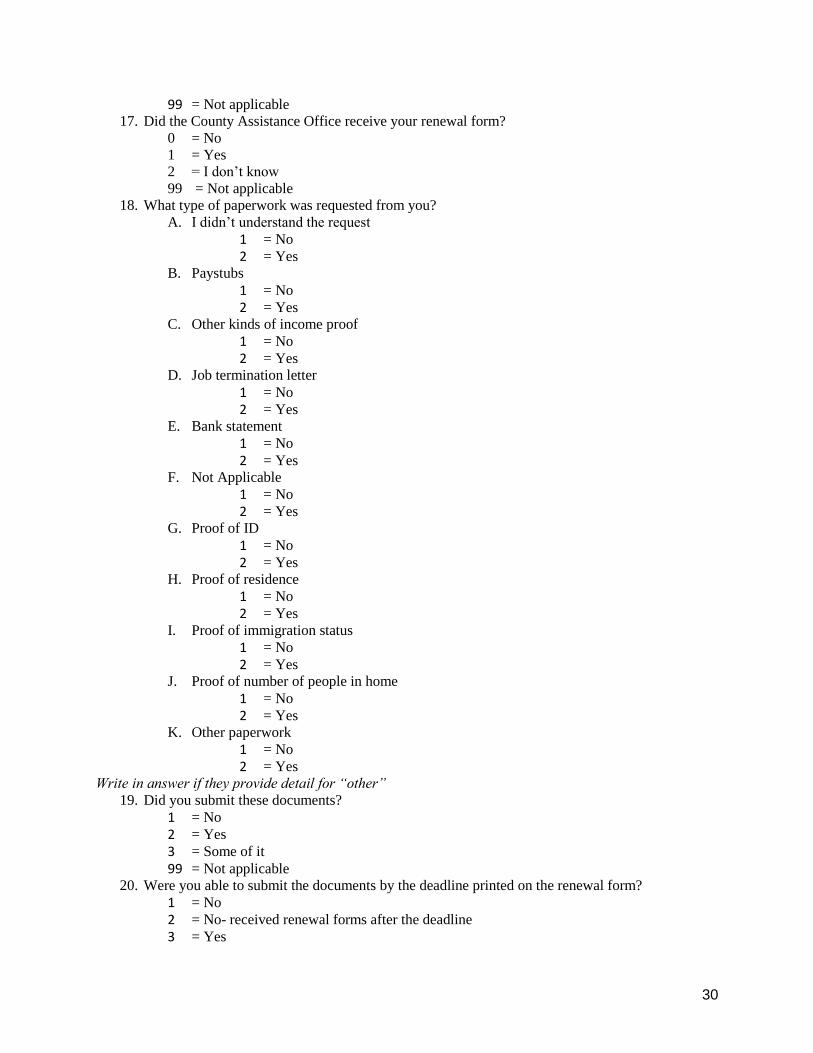
17. Did the County Assistance Office receive your renewal form?
0 = No 1 = Yes 2 = I don’t know 99 = Not applicable
18. What type of paperwork was requested from you?
A. I didn’t understand the request
1 = No
2 = Yes
B. Paystubs
1 = No
2 = Yes
C. Other kinds of income proof
1 = No
2 = Yes
D. Job termination letter
1 = No
2 = Yes
E. Bank statement
1 = No
2 = Yes
F. Not Applicable
1 = No
2 = Yes
G. Proof of ID
1 = No
2 = Yes
H. Proof of residence
1 = No
2 = Yes
I. Proof of immigration status
1 = No
2 = Yes
J. Proof of number of people in home
1 = No
2 = Yes
K. Other paperwork
1 = No
2 = Yes
Write in answer if they provide detail for “other” 19. Did you submit these documents?
1 = No
2 = Yes
3 = Some of it
99 = Not applicable
20. Were you able to submit the documents by the deadline printed on the renewal form?
1 = No
2 = No- received renewal forms after the deadline
3 = Yes
31
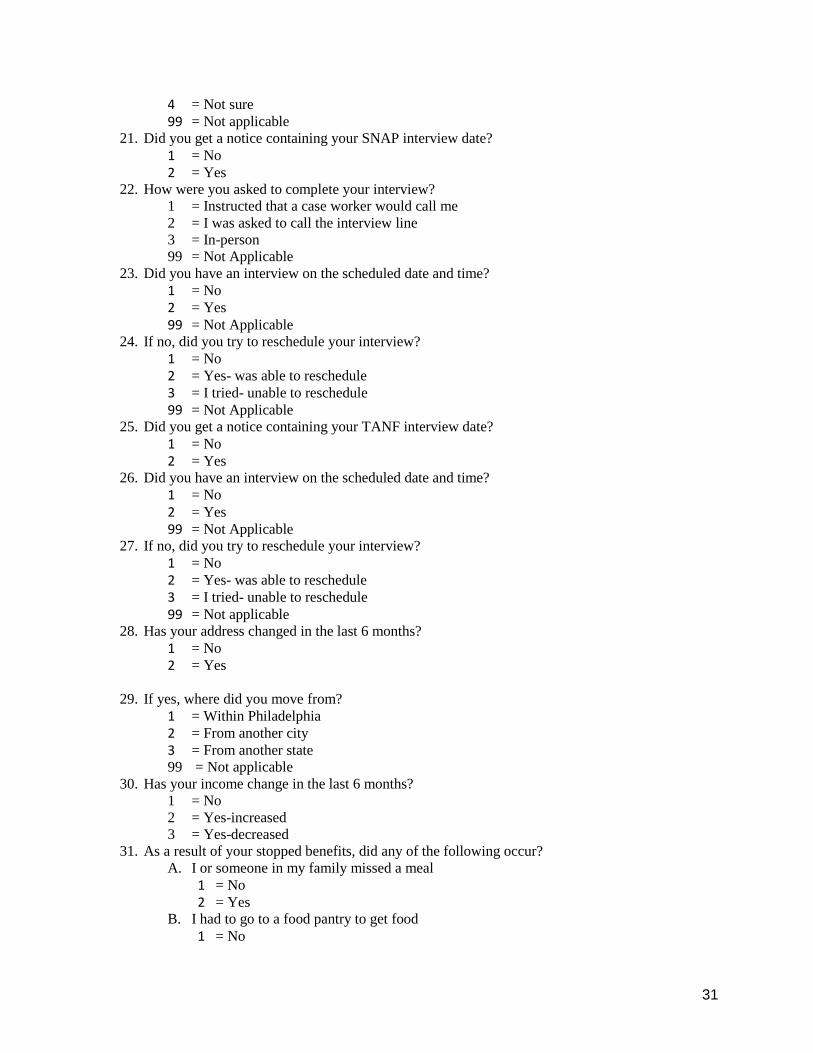
4 = Not sure
99 = Not applicable
21. Did you get a notice containing your SNAP interview date?
1 = No
2 = Yes
22. How were you asked to complete your interview?
1 = Instructed that a case worker would call me
2 = I was asked to call the interview line
3 = In-person
99 = Not Applicable
23. Did you have an interview on the scheduled date and time?
1 = No
2 = Yes
99 = Not Applicable
24. If no, did you try to reschedule your interview?
1 = No
2 = Yes- was able to reschedule
3 = I tried- unable to reschedule
99 = Not Applicable
25. Did you get a notice containing your TANF interview date?
1 = No
2 = Yes
26. Did you have an interview on the scheduled date and time?
1 = No
2 = Yes
99 = Not Applicable
27. If no, did you try to reschedule your interview?
1 = No
2 = Yes- was able to reschedule
3 = I tried- unable to reschedule
99 = Not applicable
28. Has your address changed in the last 6 months?
1 = No
2 = Yes
29. If yes, where did you move from?
1 = Within Philadelphia
2 = From another city
3 = From another state
99 = Not applicable
30. Has your income change in the last 6 months?
1 = No
2 = Yes-increased
3 = Yes-decreased
31. As a result of your stopped benefits, did any of the following occur?
A. I or someone in my family missed a meal
1 = No
2 = Yes
B. I had to go to a food pantry to get food
1 = No

32
2 = Yes
C. I went without prescription drugs
1 = No
2 = Yes
D. I couldn’t go to a medical appointment
1 = No
2 = Yes
E. I had to go to the ER instead of my regular doctor
1 = No
2 = Yes
F. I couldn’t pay a rent/ mortgage
1 = No
2 = Yes
G. I couldn’t pay utility bill
1 = No
2 = Yes
H. I had to borrow money
1 = No
2 = Yes
I. I had to miss work to fix my benefits
1 = No
2 = Yes
J. Other
1 = No
2 = Yes
Write in answer if they provide detail for “other”
Is there anything else you would like to tell us?
Write in answer All other notes
Write in answer


![Customers Churn Prediction using Artificial Neural ... · devising of churn policy [16] is depicted in Fig. 2. Fig. 2. The Six Steps for Customer Churn Prediction. Churn prediction](https://img.dokumen.tips/doc/110x75/5e71a26fb4acff71e10cc1fe/customers-churn-prediction-using-artificial-neural-devising-of-churn-policy.jpg)