Embed Size (px)
Citation preview
JOURNAL OF CELLULAR PHYSIOLOGY 127:229-236 (1986)
Phenotypic Heterogeneity in Lymphoblastic Cell Lines
L.J. SMITH AND E.A. McCULLOCH* The Ontario Cancer Institute, Toronto, Ontario M4X IK9, Canada
Four T-cell and two 6-cell lines from patients with lymphoblastic leukemia were examined with a panel of monoclonal antibodies for a variety of lineage and differentiation stage-associated antigens during growth in liquid suspen- sion. In five of the lines, markers normally associated with the granulopoietic lineage were found and t h e level of expression of these markers varied during culture. The sixth line, MOLT-3, was examined in more detail. Using clonal selection it was found that phenotypic heterogeneity could readily be ob- tained and that subclones could be acquired that expressed a wide range of markers, typically in reproducible kinetic patterns, that were not detected on t h e parent clone. Previous results were confirmed showing that treatment with t h e drug 5-azacytidine (5-aza) prior to selection promoted the expression of the granulopoietic lineage associated antigen 80H.5 on MOLT-3 subclones; however, treatment with 5-aza appeared to inhibit substantially the expression of other novel markers by subclones following a second selection compared to untreated controls. It appears that the expression of markers normally associated with other lineages on leukemic lymphoblasts (lineage infidelity) may be characteristic of such lines and that phenotypically variant subclones expressing lineage infidelity can readily be obtained by clonal selection.
The term 'lineage infidelity' has been used to describe a phenotype characterized by the simultaneous expres- sion on single leukemic blast cells of markers usually associated with different programs of differentiation (Smith et al., 1983). As part of a study of lineage infidel- ity, we examined (Smith and McCulloch, 1984) the con- tinuous lymphoblastic cell line, MOLT-3, following exposure to 5-azacytidine (5-ma). In 5-ma treated mass cultures, we observed small numbers of cells that, in addition to markers Characteristic of T lymphocytes, expressed other markers usually associated with other lineages. Further, it proved possible to select stable sub- clones with the lineage infidelity phenotype.
Mann et al. (1983) have demonstrated heterogeneity in acute lymphoblastic leukemia using monoclonal an- tibodies that recognize lymphopoiesis-associated mark- ers. In this paper we provide further evidence of heterogeneity by extending our observations of MOLT-3 cells to other lymphoblastic cell lines. Also, using clonal analysis of MOLT-3 cells, we have obtained evidence that proliferative cells, capable of expressing non-lym- phoid and differentiation-stage associated antigens may be present in continuous lines of lymphoblasts, even when these markers are not detected by usual phenotyp- ing procedures.
MATERIALS AND METHODS Drugs
5-aza was obtained from Sigma Chemical Co., St. Louis, Missouri, and 6-azacytidine (6-ma) from P-L Bio- chemicals, Milwaukee, Wisconsin. They were dissolved in phosphate buffer (0.02M Na2HP04 - 0.02M Na-
0 1986 ALAN R. LISS, INC
H2P04 - 0.42M NaCl pH 6.5) just before use (Notari and De Young, 1975).
Radiation A cesium source was used to irradiate cells a t a rate
of about 75 rads/min. Radiation survival curves for MOLT-3 cells plated in methylcellulose yielded conven- tional radiation survival curves (Whitmore and Till, 1964)) characterized by a shoulder and a negative expo- nential (Dlo varied between 400-500 rads).
Cells The leukemic cell lines Jurkat (Nagasawa et al., 1981),
CEM (Foley et al., 1965), MOLT-3 (Minowada et al., 1972) along with the B-cell lines RPMI 1788 and RPMI 3638 (Minowada et al., 1978) were obtained from Dr. T.W. Mak of this Institute. Table 1 summarizes the growth characteristics of these cell lines in suspension culture.
Suspension cultures A11 the cell lines were grown in a-minimal essential
medium (a-MEM) minus ribonucleosides and deoxyri- bonucleosides with 25 mM Hepes buffer and 10% fetal calf serum in a humidified 5% C02 incubator. Experi- ments in which the expression of markers was followed with time were initiated by using cultures a t low cell density (lo4 cells/ml). These were maintained for 14 days and sampled every 2-3 days to obtain phenotypes. The
Received September 17, 1985; accepted December 9, 1985. *To whom reprint requests/correspondence should be addressed.

230 SMITH AND McCULLOCH
added to cells suspended in methylcellulose just prior to plating. In experiments involving irradiation (see above) the cells were in a-MEM when treated and then sus- pended in methylcellulose for plating. Simple negative exponential dose response curves were obtained in ex- periments where MOLT-3 cells were plated in variable concentrations of 5-aza or 6-aza. At different times the drug concentration required to reduce survival to 10% (Dlo) values for 5-aza varied from 0.3 to 2 pM, while those for 6-aza ranged from 27 to 65 pM.
Indirect immunofluorescence Table 2 lists the monoclonal antibodies employed to
detect lineage or differentiation stage-associated anti- gens, their sources, specificities and references. The in- direct immunofluorescence staining protocol and the nature of the controls has been published (Smith et al., 1983).
Strategy for studying surface markers Each of the six leukemic cell lines was phenotyped
using the reagents listed in Table 2. Reagent pools were
TABLE 1. Growth characteristics of cell lines
Duration of Approximate Cell exponential growth' doubling time line Days Hours
MOLT-3 8 20 Jurkat 10 32 CEM 10 24 1788 7 32
'Cultures were seeded a t a density of lo4 cells per ml on day 0 and grown 14 days without subculturing (see Materials and Methods for details).
3638 7 33
B cell lines RPMI 1788 and RPMI 3638 were shaken vigorously at each sampling since these tend to adhere to plastic. Too few cells remained attached to have influ- enced the kinetic pattern of marker expression.
Colony formation The methods used for growing MOLT-3 cells in meth-
ylcellulose have been described previously (Smith and McCulloch, 1984). When drugs were used, they were
TABLE 2. Immunolonic reagents
Monoclonal Lineage association Screen Source References
80H.5 My-1 Anti-CEA (NCA)
OKMl
Granulopoietic cells Granulopoietic cells Granulopoietic cells
Granulopoietic cells Monocytes
- MOLT Jurkat CEM Jurkat CEM 1788 3638 MOLT Jurkat CEM 1788 3638 Jurkat CEM 1788 3638 Jurkat CEM 1788 3638 Jurkat CEM 1788 3638 MOLT Jurkat CEM 1788 3638 MOLT Jurkat CEM Jurkat CEM
1788
1788 3638 MOLT 1788 3638 MOLT Jurkat CEM
P. Mannoni C. Civin Hibritech, Inc., La Jolla, CA
Ortho Pharm., Raritan, NJ
Mannoni et al., 1982 Civin et al., 1981 Burtin et al., 1980
Breard et al., 1980
M02 Monocytes Coulter, Inc., Hialeah, FL Todd et al., 1983
Anti-monocytes Monocytes BRL Gaithersburg, MD
Ugolini et al., 1980
HPD-1 Megakaryocytes Platelets
W.L. Nichols Ni'chols et al.. 1983
AN51 Megakaryocytes Platelets
A.J. McMichael McMichael et al., 1981
R18 Erythropoietic cells P.A.Q. Edwards Edwards, 1980
B1
BA-1
OKT 3,4,6,8,11
B-lymphocytes Coulter, Inc. Hialeah, FL
Hibritech, Inc., La Jolla, CA
Ortho Pharm., Raritan, NJ
Bhan et al., 1981
B-lymphocytes, some granulopoietic cells
T-lymphocytes
Abrahamson et al., 1981
Reinherz and
Reinherz et al.,
Royston et al.,
Ritz et al.,
Schlossman, 1980;
1979
1980
1980
Ash et al.. 1982
TlOl
CALLA
BA-2
T-lymphocytes
Some ALL blasts, some normal marrow cells
Some ALL and AML blasts, some normal marrow cells
I. Royston
Coulter, Inc. Hialeah, FL
Hibritech, Inc., La Jolla, CA

HETEROGENEITY IN LYMPHOBLASTIC LINES 231
6 - 9 PI
,o ," 5 -
k F, 4-
0
Q
2
3 -
2 -
then constructed for each cell line that consisted of monoclonals that did not react with the lines when they were initially phenotyped. These pools of reagents were used to look for novel markers during cell growth. The composition of each of the screens is given in Table 2. MOLT-3 screen included 80H.5 in experiments in which MOLT-3 colonies grown in methylcellulose were pooled and then tested for novel markers and in the initial multiple selection studies designed to look at phenotypic heterogeneity in MOLT-3 subclones following 5-aza treatment. In the remaining experiments 80H.5 was omitted from MOLT-3 screen.
A pool of OKT 3, 4, and 8 monoclonals provided a screen to recognize T-lymphocyte associated antigens. Only a small proportion of the cells in the T-cell line GEM expressed these antigens, but the T-cell nature of this line has been confirmed in that it has been shown to be strongly positive for the T-cell antigen receptor protein mRNA (Y. Yanagi, personal communication).
RESULTS In addition to MOLT-3, we determined the phenotypes
of two other lines of T lymphoblasts, Jurkat and CEM. For contrast we examined two RPMI B cell lines, Nos. 1788 and 3638. The phenotypes are summarized in Ta- ble 3. It is apparent that, using lymphopoiesis-associated markers, the cell phenotypes were consistent with the assignment of each cell line either to the B or T cell lineage. However, four of the five lymphoblastic lines were also positive for the granulopoiesis-associated markers MY-1 and 80H.5. Only MOLT-3 was negative for MY-1 and 80H.5 using standard phenotypic methods.
Selection of MOLT-3 subclones We repeated and extended our previous observations
(Smith and McCulloch, 1984) on MOLT-3 cells treated with 5-ma (see Fig. 1). MOLT-3 cells were plated at a concentration of 3 x lo3 cells/ml in the presence of increasing concentrations of drug. After 2 weeks, dupli- cate plates with discrete colonies were selected, usually from cultures containing the drug at the Dlo dose. Cells were pooled from one plate of each set of duplicates and the percentage of cells positive for unusual markers determined, using the MOLT-3 screen (see Materials and Methods). This permitted the identification of the pair of plates with both adequate numbers of colonies and the highest concentration of unusual markers; in- dividual colonies were then picked from the duplicates and expanded. A clone with the highest number of un- usual markers was then replated and the selection pro-
D / expanded .,* /
/ /
0 / '- 2 n d selection
/
/ /
\ / o \ 0
\ \ \
TABLE 3. Phenotvues of cell lines'
i- 3'O 7'' gT selection
,f. 22 >90% positive
Selection for Lineage infidelity in MOLT-3
7 t
I0 20 30 40 50 60 70 80 90 I00 Percent positive cells ( i n decodes) 2 M O M
Fig. 1. Selection of MOLT-3 cells for the expression of lineage infidel- ity following exposure to 5-ma. In the first selection, MOLT-3 cells were plated at a concentration of 3 x lo3 cells/ml with increasing concentrations of 5-ma. At the end of 2 weeks representative plates were pooled and stained with the MOLT screen containing 80H.5 (see Table 2 and Materials and Methods). Colonies were picked from a duplicate plate to the one giving the highest percentage of cells with novel markers where adequate colony numbers were found and indi- vidually expanded. These were then examined using the screen and the results are shown (0). In subsequent selections this process was repeated except there were no further drug treatments and subclones with the highest proportion of cells with novel markers were chosen for subcloning (0). At the end of the third selection all of the 22 tertiary subclones were > 90% positive (large ).
Percent positive cells' 31 BA-1 BA-2 OKT3,4,8 OKTll TlOl My-l 80H.5
T cell lines MOLT-3 0 0 0 100 5 ND3 0 0 Jurkat 0 0 0 23 88 5 16 39 CEM 0 0 0 16 4 5 26 44
1788 100 0 58 0 0 0 2 39 3638 100 50 33 0 0 0 39 34
B cell lines
'All reagents listed in Table 2 were used. Only positives were included in this table 'Based on a count of 500 cells. 3Not done.

232 SMITH AND McCULLOCH
TABLE 4. MOLT-3 variants after three selections
Percent positive cells' Monoclonals BDB BDD BDH BDP BDT BDX
80H.5 90 77 87 60 100 My-1 9 28 40 6 62 Anti-NCA 0 0 0 3 < 1 M02 0 0 < 1 2 0
HPD-1 ND ND ND 2 ND AN5 1 0 0 0 13 0 R18 0 0 0 7 2 B1 0 0 0 < 1 < l BA-1 0 0 0 11 0
Anti-monocytes ND2 0 0 5 0
92 34 0 0 0
25 5
10 0 0
~ A L L A 0 0 < I < 1 22 19 BA-2 0 0 0 15 0 < 1
'Based on a count of 500 cells. 'Not done.
cedure repeated. Plates containing colonies grown without drug were negative for unusual markers. As is evident from the figure, the percentage of abnormal markers increased. The selection was repeated a third time; when these clones were examined, all were found to contain in excess of 90% of cells with unusual markers.
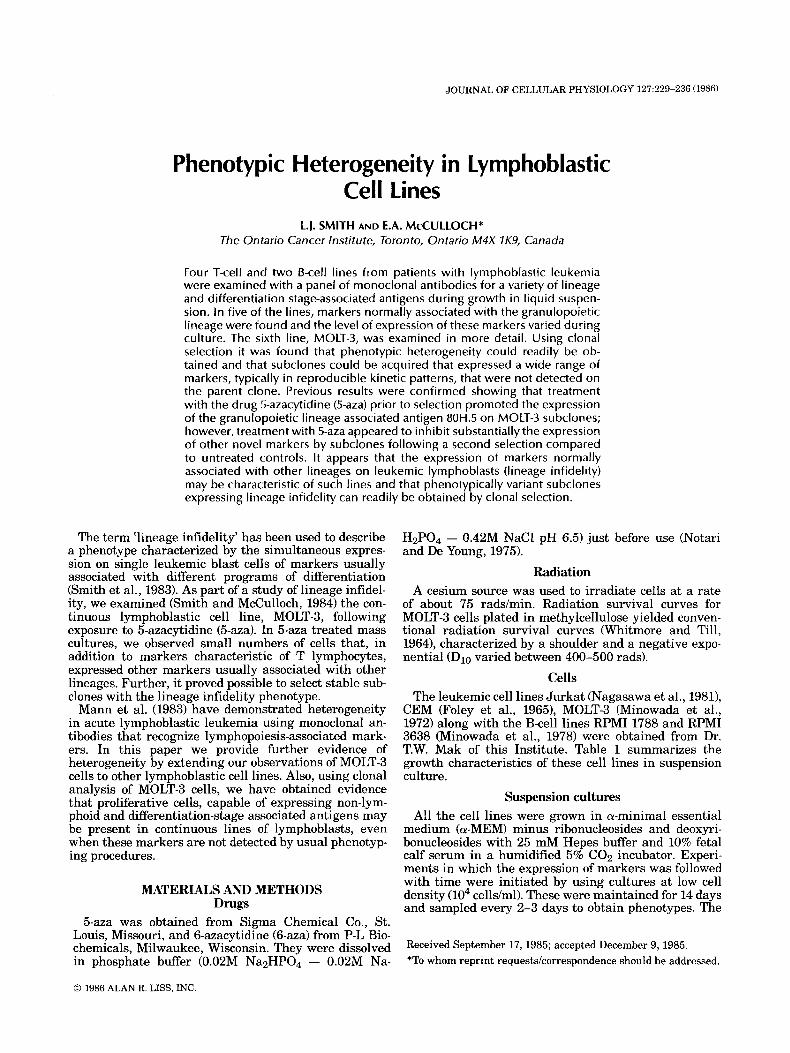
Six of the tertiary clones were then examined using a panel of monoclonal reagents. The data are presented in Table 4. It is apparent that the glycolipid antigens 80H.5 and MY-1 were seen most commonly; however, the other reagents recognized a variable number of cells in the tertiary subclones. Thus, the procedure illustrated in Figure 1 yielded MOLT-3 variants with marked pheno- typic heterogeneity.
Kinetics MOLT-3 variants, designated BDD, BDX, and K2A
were examined in more detail. Figure 2 illustrates the growth kinetics; these were similar for the three lines, characterized by a doubling time of 1.6 days during exponential growth. Line BDD continued to grow for approximately 2 days after the two other variants had entered stationary phase.
The kinetics of expression of the markers MY-l,80H.5 and CALLA are shown in Figure 3. Each subclone had characteristic and reproducible kinetics; in some, mark- ers were present throughout, while in others peaks were seen at the beginning and end of the exponential phase. Kinetic analysis of the Jurkat, CEM, RPMI 1788, and 3638 lines demonstrated that the non-lymphoid markers shown in Table 3 were also expressed in characteristic patterns during clonal expansion (data not shown). Use of the negative screens (Materials and Methods, Table 2), however, did not reveal the appearance of any addi- tional markers.
Clonal analysis The experimental design used to select MOLT-3 vari-
ants was repeated using three different agents. 5-aza was chosen since the initial observations were made with this drug which appears to cause DNA hypomethy- lation and as a result the activation of at least some genes (Taylor and Jones, 1979). Its analogue, 6-aza was used as a specificity control, since this drug does not lead to DNA hypomethylation (Jones and Taylor, 1980). The third agent chosen was irradiation, since this is a
1 0 7 ~ I I I , I 1 I 1
Growth Kinetics of Molt -3 Varients BDD , BDX, and K 2 A
t
o BDD o B D X n K 2 A
/ / t /
i 104 I I 1 I 1 I
0 2 4 6 8 10 12 14 16 18
2399P
Fig. 2. Growth kinetics of MOLT-3 variants BDD (O), BDX (01, and K2A (A). Variants BDD and BDX were among the twenty-two sub- clones shown in Figure 1 that were obtained after three selections. K2A was obtained in the same way but originated from a different primary subclone shown as a small black box in Figure 1. Suspension cultures were begun at lo4 cellsiml and were continued for about 2 weeks without subculturing as described in Materials and Methods.
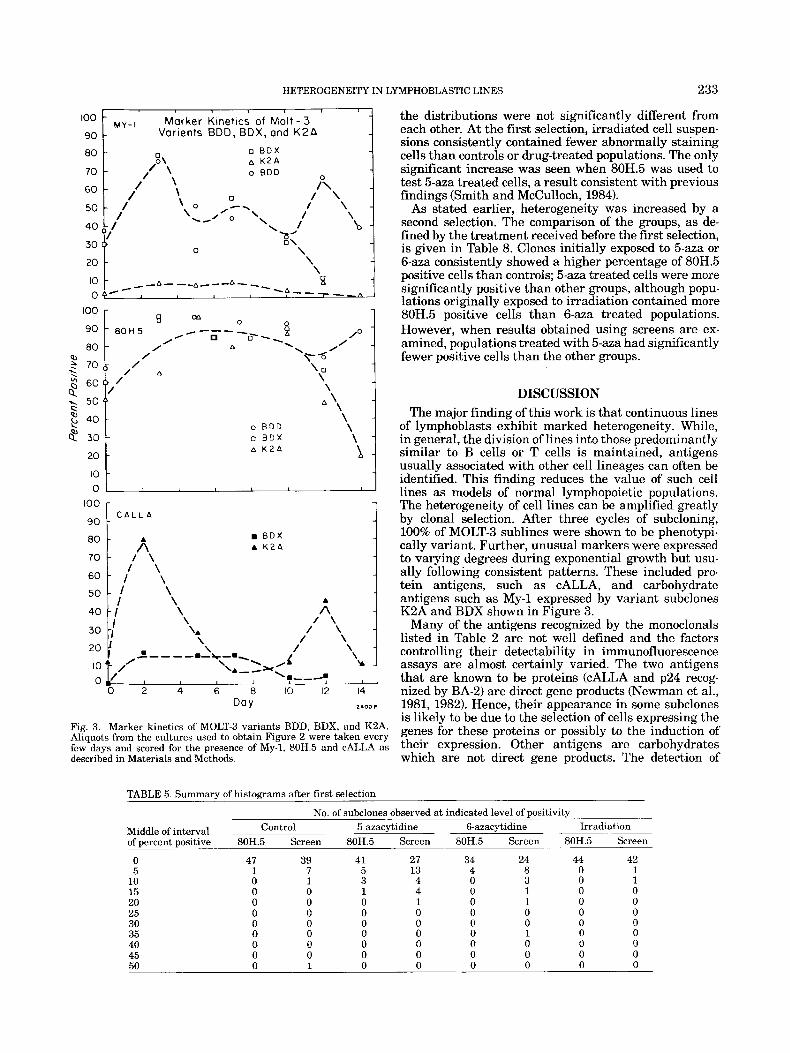
general cytotoxin. In addition, control cells, not exposed to any agent, were cloned in parallel. The three groups were exposed to an agent and the first selection cycle carried out. A second cycle was made using as starting material the clone with highest number of cells positive with the MOLT screen without 80H.5. At each cycle, clones were stained using the MOLT-3 screen and 80H.5 as a single reagent. Tables 5 and 6 summarize the his- tograms at the first and second selections. Each table shows the number of positive observations in each nu- merical interval. It is apparent that a small number of clones positive for unusual markers were seen after a single selection and that this number increased at the second selection. Further, a highly significant increase in the heterogeneity among clones was seen at the sec- ond selection (P always < .OOOOl).
The distributions within each selection cycle were also compared using the exact permutation test (Pagans and Tritchler, 1983). Tables 7 and 8 summarize these com- parisons. The significant P values are given; the brack- ets following the P values indicate whether the mean and rank (Kruskal-Wallis test) of the distribution listed vertically was smaller than that on the horizontal (neg- ative) or larger (positive). It is apparent that many of
HETEROGENEITY
loo - M Y - I
90 - 80 - o B D X
Marker Kinetics of Molt-3 Varients BDD, BDX, and K 2 A
6 K 2 A 10 - P\ o BDD
0 A
/ \
/ \
// \,
/ \ -
\ o - \ o /--,
/ './ 0 \
30 x / 6 0 -
50 - 1
40 - / \ I
\ \ \
B -A-----
-z 20[//7-A-;-:-;-*-, 10 , 0
100 - 90 - 8 0 H 5 )---
80 - /
0 -- !i /O /' 0 -. \ /
'-4' P, / \ o
\ O \ '4,
\ 3 60 13 /
x 5 0 1L C 2 40 - L
? 70 (j , / A
\ A \ \
o B D D \ 8 30 - n B D X \ - 20 - A K 2 A -
10 - 0
100 - 90 - C A L L A -
B D X A K 2 A n 80 -
7 0 - / \ / \
6 0 - I \
4 0 - I
30 -1
A \
A / \ / \
\ 5 0 - 1
I
\ \A
\\ I /
/ \ - \ \ \ 1-- - -m-+-m
20
\ \A-#* -\ A , '+-+ 10 0 I / /
'0 2 4 6 8 10 12 14 Day 2400p
TABLE 5. Summary of histograms after first selection
IN LYMPHOBLASTIC LINES 233
the distributions were not significantly different from each other. At the first selection, irradiated cell suspen- sions consistently contained fewer abnormally staining cells than controls or drug-treated populations. The only significant increase was seen when 80H.5 was used to test 5-aza treated cells, a result consistent with previous
As stated earlier, heterogeneity was increased by a second selection. The comparison of the groups, as de- fined by the treatment received before the first selection, is given in Table 8. Clones initially exposed to 5-aza or 6-ma consistently showed a higher percentage of 80H.5 positive cells than controls; 5-aza treated cells were more significantly positive than other groups, although popu- lations originally exposed to irradiation contained more 80H.5 positive cells than 6-ma treated populations. However, when results obtained using screens are ex- amined, populations treated with 5-aza had significantly fewer positive cells than the other groups.
findings (Smith and McCulloch, 1984).
DISCUSSION The major finding of this work is that continuous lines
of lymphoblasts exhibit marked heterogeneity. While, in general, the division of lines into those predominantly similar to B cells or T cells is maintained, antigens usually associated with other cell lineages can often be identified. This finding reduces the value of such cell lines as models of normal lymphopoietic populations. The heterogeneity of cell lines can be amplified greatly by clonal selection. After three cycles of subcloning, 100% of MOLT-3 sublines were shown to be phenotypi- cally variant. Further, unusual markers were expressed to varying degrees during exponential growth but usu- ally following consistent patterns. These included pro- tein antigens, such as CALLA, and carbohydrate
K2A and BDX shown in Figure 3. Many of the antigens recognized by the monoclonals
listed in Table 2 are not well defined and the factors controlling their detectability in immunofluorescence assays are almost certainly varied. The two antigens that are known to be proteins (CALLA and p24 recog- nized by BA-2) are direct gene products (Newman et al., 1981, 1982). Hence, their appearance in some subclones
-
antigens such as My-1 expressed by variant subclones
-
No. of subclones observed at indicated level of positivity Con t r o I 5-azacytidine 6-azacytidine Irradiation Middle of interval
of percent positive 80H.5 Screen 80H.5 Screen 80H.5 Screen 80H.5 Screen
0 5
10 15 20 25 30 35 40 45 50
47 1 0 0 0 0 0 0 0 0 0
39 7 1 0 0 C 0 0 0 0 1
41 27 5 13 3 4 1 4 0 1
0 0 0 0
34 24 44 42 4 8 0 1 0 3 0 1 0 1 0 0 0 1 0 0 0 0 0 0 0 0 0 0 0 1 0 0 0 0 0 0 0 0 0 0 0 0 0 0

234 SMITH AND McCULLOCH
TABLE 6. Summarv of histomams after second selection
- No. of subclones observed a t indicated level of positivity Middle of interval Control 5-azacytidine 6-azacytidine Irradiation of percent positive 80H.5 Screen 80H.5 Screen 80H.5 Screen 80H.5 Screen
0 5
10 15 20 25 30 35 40 45 50 55 60 65 70 75 80 85 90 95
100
42 0 0 0 0 0 0 0 0 0 0 0 0 0 0 0 0 0 0 0 0
6 3 2 2 3 3 1 2 0 4 2 3 3 0 3 1 1 2 0 1 0
33 3 3 2 1 0 0 0 0 0 0 1 0 0 0 0 0 0 0 0 0
4 8 9 9
2 2
1 0 0 0 0
45 1 0 0 0 0 0 0 0 0 0 0 0 0 0 0 0 0 0 0 0
3 7 1 4 2 4 1 1 2 2 2 1 1
4 0 2 0 0 0 0 0 0 0 0 0 0 0 0 0 0 0 0 0 0
2 1 0 0 1 0 0 1 1 0 0 0 1 0 0 0 0 0 0 0
TABLE 7. Exact permutation test results (P values) for first selection'
Control 5-azacytidine 6-azacytidine 80H.5 Screen 80H.5 Screen 80H.5 Screen
Control - -
6-azacytidine NS NS NS NS Irradiation 0.002( -1 0.03(-) 0.0005(-) 0.0001( -) 0.00002(-) 0.0009(-)
5-azacytidine 0.02(+) NS2 - - - -
'A positive value indicates that the treatment given on the left resulted in a relatively greater generation of subclones with novel markers and a greater proportion of cells within particular subclones with novel markers as determined by the Kruskal-Wallis test. 2Not significant.
TABLE 8. Exact permutation test results (P values) for second selection'
Control 5-azacytidine 6-azacytidine 80H.5 Screen 80H. 5 Screen 80H.5 Screen
Control - -
5-azacytidine 0.0000001(+) 0.0007(-) - - 6-azacytidine 0.02( + 1 0.01(+) 0.000003(-) O.OOOOl(+) - - Irradiation 0.00002(+) NS2 NS NS 0.00006( +) 0.01(-)
'A positive value indicates that the treatment given on the left resulted in a relatively greater generation of subclones with novel markers and a greater proportion of cells within particular subclones with novel markers as determined by the Kruskal-Wallis test. 'Not significant.
these antigens is probably the consequence of several factors some acting at post-translational levels.
For an antibody to recognize a particular cellular an- tigen, the antigen must not only have the right compo- sition, but the right conformation and be accessible to binding. Lineage associated antigens, therefore, must be defined operationally as those antigens recognized by antibodies that have been shown to recognize selectively a particular normal lineage under a specified set of conditions. 3-fucosyl-N-acetyllactosamine (3-fuc-NAc or FAL), for example, has been shown by Huang et al. (1983) to be the trisaccharide moiety to which the My-1
monoclonal binds. This carbohydrate structure has been found in a variety of tissue types and leukemic cells (Tetteroo et al., 1984) and has been identified by Hako- mori et al. (1981) as the murine stage-specific embryonic antigen SSEA-1. In our hands monoclonal antibodies raised to SSEA-1, unlike anti-My-1, have no lineage specificity when tested against normal human bone marrow (unpublished results). Furthermore, it has been shown by Janowska-Wieczorek et al. (1984) that a vari- ety of monoclonals that bind to the 3-fuc-NAc moiety, including the one recognizing My-1, vary in their ability to recognize different blood cell types. Thus, the ability

HETEROGENEITY IN LYMPHOBLASTIC LINES 235
of a monoclonal like My-1 to recognize an antigen clearly may depend on the influence of environmental factors on the conformation of the recognized epitope. These immediate influences could be due to genetic or epige- netic phenomena, but ultimately the regulation of lin- eage programs must involve changes in genetic expression.
A detailed study of the mechanisms of clonal selection was made, using a number of putative selective agents. Consistent with our previous finding, MOLT-3 cells ex- posed to 5-aza showed an increased percentage of cells expressing unusual markers (Smith and McCulloch, 1984). However, when subclones were isolated, without further exposure to agent, heterogeneity increased. While some significant differences were observed be- tween populations treated with 5-aza, 6-aza or radiation, as compared with controls, no pattern was observed that could be attributed confidently to a mechanism related to a particular agent.
The appearance of novel markers on some subclones when untreated MOLT-3 cells were cloned raises the possibility that variant cells are present in the parent population that are not detected by the phenotyping methods used. Presumably, when lines are maintained as mass cultures, subtle pressures are at work to mini- mize the number of unusual markers recognized using standard phenotyping procedures. Nonetheless, the ca- pacity to express such markers remains and may be a manifestation of a relaxation of the control of gene expression in established cell lines.
Finally, these studies are relevant to the phenotypes of leukemic cells freshly obtained from patients. We (McCulloch et al., 1982; Smith et al., 1983) and others (Pui et al., 1984; Bettelheim et al., 1982; Griffin et al., 1983) have shown that markers associated with differ- ent lineages may co-exist in the same leukemic clones and indeed on the same blast cells (lineage infidelity). Thus, if as suggested above, the control of gene expres- sion is relaxed in continuous cell lines, a similar relaxa- tion may be found in leukemic clones in patients. This interpretation of the data supports the hypothesis that differentiation programs of leukemic blasts are abnor- mal, rather than blocked, versions of programs charac- teristic of normal lineages.
ACKNOWLEDGMENTS We thank Drs. C.I. Civin, P.A.Q. Edwards, P. Man-
noni, A.J. McMichael, W.L. Nichols, and I. Royston for supplying us with their monoclonal antibodies. We are grateful to Dr. David Tritchler and Ms. Gina Lockwood for help with the statistical analysis.
This work was supported by grants from the National Cancer Institute of Canada and the Medical Research Council of Canada.
LITERATURE CITED Abrahamson, C.S., Kersey, J.H., and LeBien T.W. (1981) A monoclonal
antibody @A-1) reactive with cells of human B lymphocyte lineage. J. Immunol., 12633-88.
Ash, R.C., Jansen, J., Kersey, J.H., LeBien, T.W., and Zanjani, E.D. (1982) Normal human pluripotential and committed hematopoietic progenitors do not express the p24-antigen detected by monoclonal antibody BA-2: Implications for immunotherapy of lymphocytic leu-
tive acute lymphocytic leukemic cells: Evidence by double-fluores- cence staining. Blood, 6Or1392-1396.
Bhan, A.K., Nadler, L.M., Stashenko, P., McCluskey, R.T., and Schloss- man, S.F. (1981) Stages of B cell differentiation in human lymphoid tissue. J. Exp. Med., 154:737-745.
Breard, J., Reinherz, E.L., Kung, P.C., Goldstein, G., and Schlossman, S.F. (1980) A monoclonal antibody reactive with human peripheral blood monocytes. J. Immunol., 124t1943-1948.
Burtin, P., Flandrin, G., and Fondaneche, M.C. (1980) Presence of NCA (nonspecific cross-reacting antigen) in the cells of the human granu- locytic series. Blood Cells, 6t263-271.
Civin, C.I., Mirro, J., and Banquerigo, M.L. (1981) My-1 a new myeloid specific antigen identified by a mouse monoclonal antibody. Blood 57:842-849.
Edwards, P.A.Q. (1980) Monoclonal antibodies that bind to the human erythrocyte-membrane glycoproteins, glycophorin A and band 3. Biochem. SOC. Trans., 8t334-338.
Foley, G.E., Lazarus, H., Farber, S., Uzman, B.G., Boone, B.A., and McCarthy, R.E. (1965) Continuous culture of human lymphoblasts from peripheral blood of a child with acute leukemia. Cancer, I8.522- 527.
Griffin, J.D., Tantravahi, R., Canellos, G.P., Wisch, J.S., Reinherz, E.L., Sherwood, G., Beveridge, R.P., Daley, J.F., Lane, H., and Schlussman, S.F. (1983) T-celi surface antigens in a patient with blast crisis of chronic myeloid leukemia. Blood, 61:640-644.
Hakomori, S., Nudelman, E., Levery, S., Solter, D., and Knowles, B.B. (1981) The hapten structure of a developmentally regulated glyco- lipid antigen (SSEA-l) isolated from human erythrocytes and adeno- carcinoma. Biochem. Biophys. Res. Commun., ZOO:1578-1584.
Huang, L.C., Civin, C.I., Magnani, J.L., Shaper, J.H., and Ginsburg, V. (1983) My-1, the human myeloid-specific antigen detected by mouse monoclonal antibodies, is a sugar sequence found in lacto-N-fucopen- taose 111. Blood, 56:1020-1023.
Janowska-Wieczorek, A,, Mannoni, P., Turner, A.R., McGann, L.E., Shaw, A.R.E., and Turc, J.M. (1984) Monoclonal antibody specific for granulocytic lineage cells and reactive with human pluripotent and committed haematopoietic progenitor cells. Br. J. Haematol., 58.159- 168.
Jones, P.A., and Taylor, S.M. (1980) Cellular differentiation, cytidine analogues and DNA methylation. Cell, 20:85-92.
Mann, D.L., Haynes, N.F., Thomas, C., Cole, D., Fauci, A.S., and Poplack, D.G. (1983) Heterogeneity of acute lymphocytic leukemia cell surface markers as detected bv monoclonal antibodies. J . Natl. Cancer Inst., 71~11-17.
Mannoni, P., Janowska-Wieczorek, A., Turner, A.R., McGann, L , and Turc, J.M. (1982) Monoclonal antibodies against human granulocytes and myeloid differentiation antigens. Hum. Immunol., 5309-323.
McCullo"ch, E.A., Smith, L.J., ana Minden, M.D. (1982) Normal and malignant haemopoietic clones in man. Cancer Surveys, 1:279-298.
McMichael, A.J., Rust, N.A., Pilch, J.R., Sochynsky, R., Morton, J., Mason, D.Y., Ruan, C., Tobelem, G., and Caen, J. (1981) Monoclonal antibody to human platelet glycoprotein. I. Immunological studies. Br. J. Haematol., 49:501-507.
Minowada, J., Ohnuma, T., and Moore, G.E. (1972) Rosette-forming human lymphoid cell lines. 1. Establishment and evidence for origin of thymus-derived lymphocytes. J. Natl. Cancer Inst., 49.891-896.
Minowada, J., Janossy, G., and Greaves, M.F. (1978) Expression of an antigen associated with acute lymphoblastic leukemia in human leukemia-lymphoma cell lines. J. Natl. Cancer Inst., 60.1269-1275,
Nagasawa, K., Howatson, A., and Mak, T.W. (1981) Induction of human malignant T-lymphoblastic cell lines, MOLT-3 and Jurkat by 12-0- tetradecanoylphorbol-13-acetate: Biochemical, physical and morpho- logical characterization. J. Cell. Physiol., I 0 9 181-188.
Newman, R.A., Sutherland, D.R., and Greaves, M.F. (1981) The bio- chemical characterization of a cell surface antigen associated with acute lymphoblastic leukemia and lymphoid precursors. J. Immu- nol., 126t2624-2030.
Newman. R.A., Sutherland, D.R., LeBien, T.W., Kersey, J.H., and .Greaves, M.F. (1982) Biochemical characterization of leukemia-asso- ciated antigen p24 defined by the monoclonal antibody BA-2. Biochim. Biophys. Acta, 701t318-322.
Nichols, W.L., Young, J.H., Ulku, B.Y., Katzmann, J.A., and Mann, K.G. (1983) A monoclonal antibody (HPD-1) which induces thrombos- thenic defects in human platelets. Thrombosis Haemostasis, 50.317- 321.
Notari, R.E., and De Young, J.L. (1975) Kinetics and mechanisms of degradation of the antileukemic agent 5-azacytidine in aqueous so- lutions. J. Pharmacol. Sci.. 64t1149-1156. kemia. Blood, 6Ot1310-1315.
Bettelheim, P., Paietta, E., Majdic, O., Gadner, H., Schwarzmeier, J., and Knapp, W. (1982) Expression of a myeloid marker on TdT-posi-
Pagans, M., and Tritchler, D.L. (1983) On obtaining permutation dis- tributions in polynomial time. J. Amer. Stat. Assoc., 78t435-442.
236 SMITH AND McCULLOCH
Pui, C.-H., Dahl, G.V., Melvin, S., Williams, D.L., Peiper, S., Mirro, J., Murphy, S.G., and Stass, S. (1984) Acute leukaemia with mixed lymphoid and myeloid phenotype. Brit. J. Haematol., 56:121-130.
Reinherz, E.L., and Schlossman, S.F. 11980) The differentiation and function of human T-lymphocytes. Cell, 19:821-826.
Reinherz, E.L., Kung, P.C., Goldstein, G., and Schlossman, S.F. (1979) A monoclonal antibody with selective reactivity with functionally mature thymocytes and all peripheral human T cells. J. Immunol., 123:1312-1319.
Ritz, J., Pesando, J.M., Notis-McConarty, J., Lazarus, H., and Schloss- man, S.F. (1980) A monoclonal antibody to human actue lymphoblas- tic leukaemia antigen. Nature, 283:583-586.
Royston, I., Majda, J.A., Baird, S.M., Meserve, B.L., and Griffith, J.C. (1980) Human T cell antigens defined by monoclonal antibodies: The 65,000 dalton antigen of T cells V65) is also found on the chronic lymphocytic leukaemia cells bearing surface immunoglobulin. J. Im- munol., 125725-732.
Smith, L.J., Curtis, J.E., Messner, H.A., Senn, J.S., Furthmayr, H., and McCulloch, E.A. (1983) Lineage infidelity in acute leukemia. Blood, 62:1138-1145.
Smith, L.J., and McCulloch, E.A. (1984) Lineage infidelity following exposure of T lymphoblasts (MOLT-3 cells) to 5-azacytidine. Blood, 63:1324-1330.
Taylor, S.M., and Jones, P.A. (1979) Multiple new phenotypes induced in 10 Yi and 3T3 cells treated with 5-azacytidine. Cell, 7:771-778.
Tetteroo, P.A.T., vantVeer, M.B., Tromp, J.F., and vondemBorne, A.E.G. Kr. (1984) Detection of the granulocyte-specific antigen 3-fucosyl-N- acetyl-lactosamine on leukemic cells after neuraminidase treatment. Int. J. Cancer, 33,355-358.
Todd, R.F., Leeman, E.L., Daley, J.F., and Schlossman, S.F. (1983) M02: Functional properties of antigen-bearing cells. Clin. Immunol. Immunopath., 26:118-125.
Ugolini, V., Nunez, G., Smith, G.R., Stastny, P., and Capra, J.D. (1980) Initial characterization of monoclonal antibodies against human monocytes. Proc. Natl. Acad. Sci. USA, 77:6764-6769.-
logical responses. Annu. Rev. Nucl. Sci., 14:347-354. Whitmore, G.F., and Till, J.E. (1964) Quantitation of cellular radiobio-